-
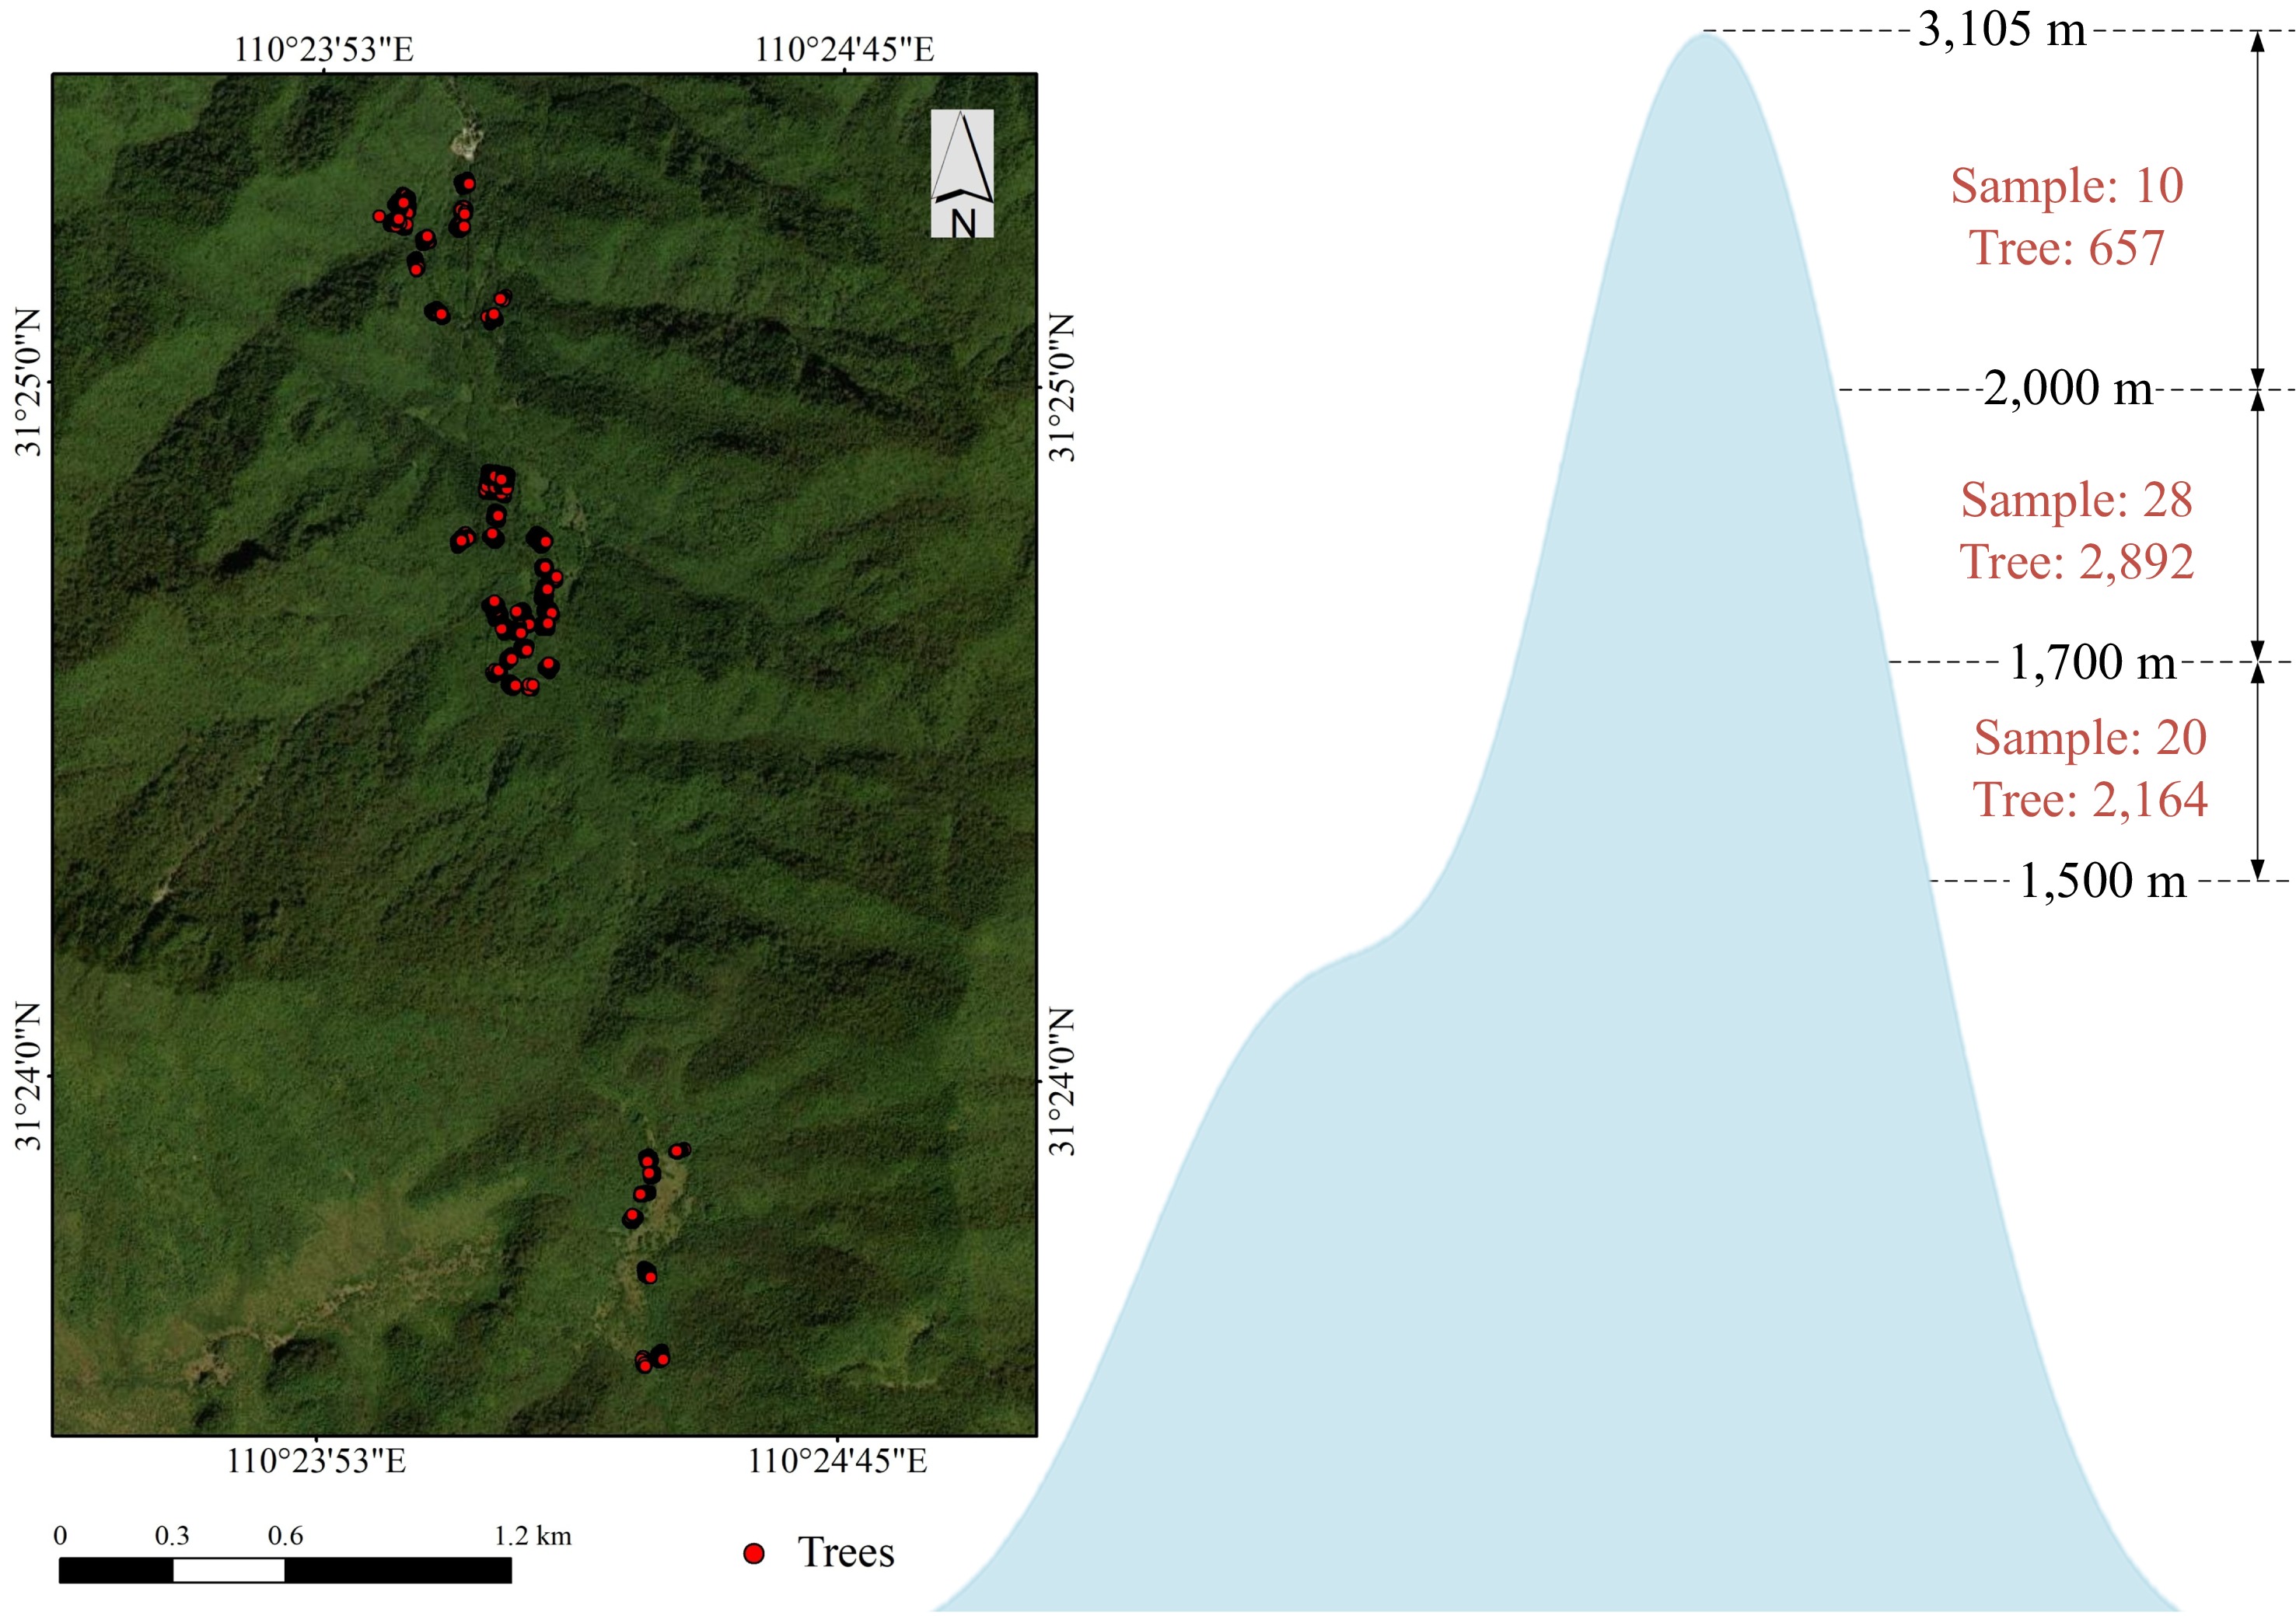
Figure 1.
Study area showing the locations of individual tree surveys and the number of individual trees surveyed at different elevation gradients.
-
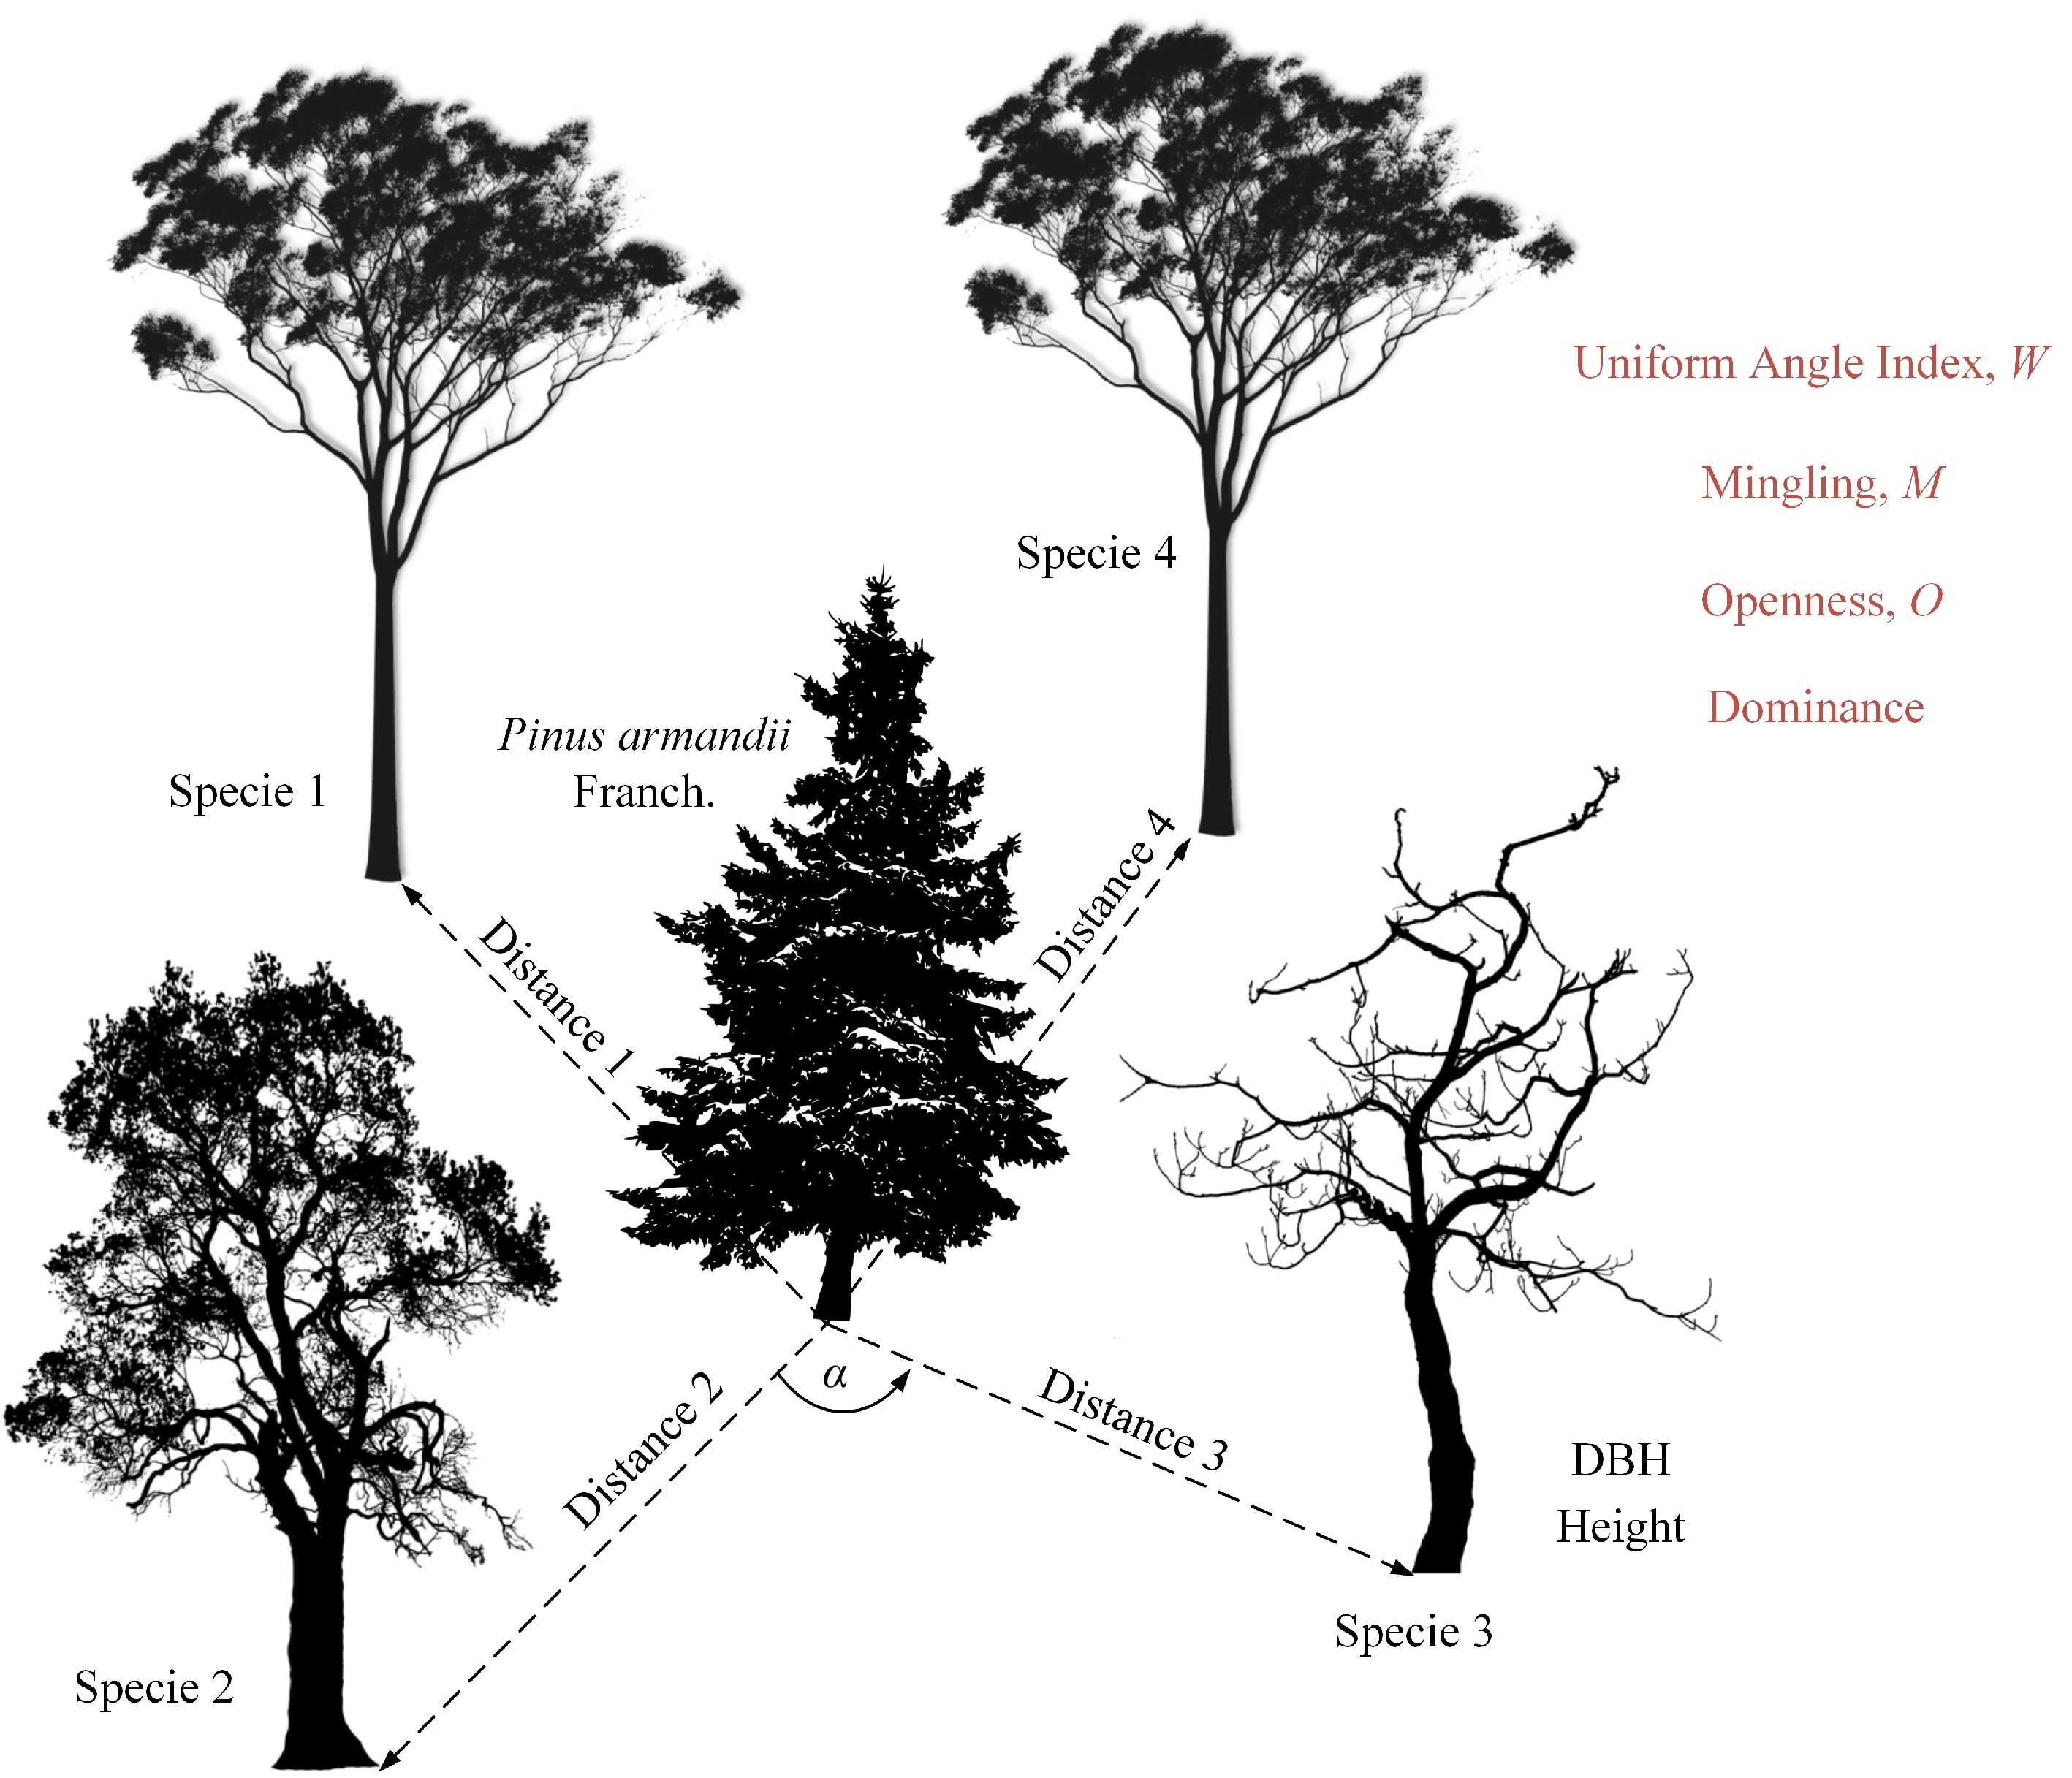
Figure 2.
Horizontal structural indices for the four nearest neighboring trees around the focal P. armandii tree. Here, α denotes the parameter for calculating the uniform angle index, and 'Distance' represents the distance from a neighboring tree to the focal P. armandii. The trees in the diagram are for illustration purposes only and do not represent specific species.
-
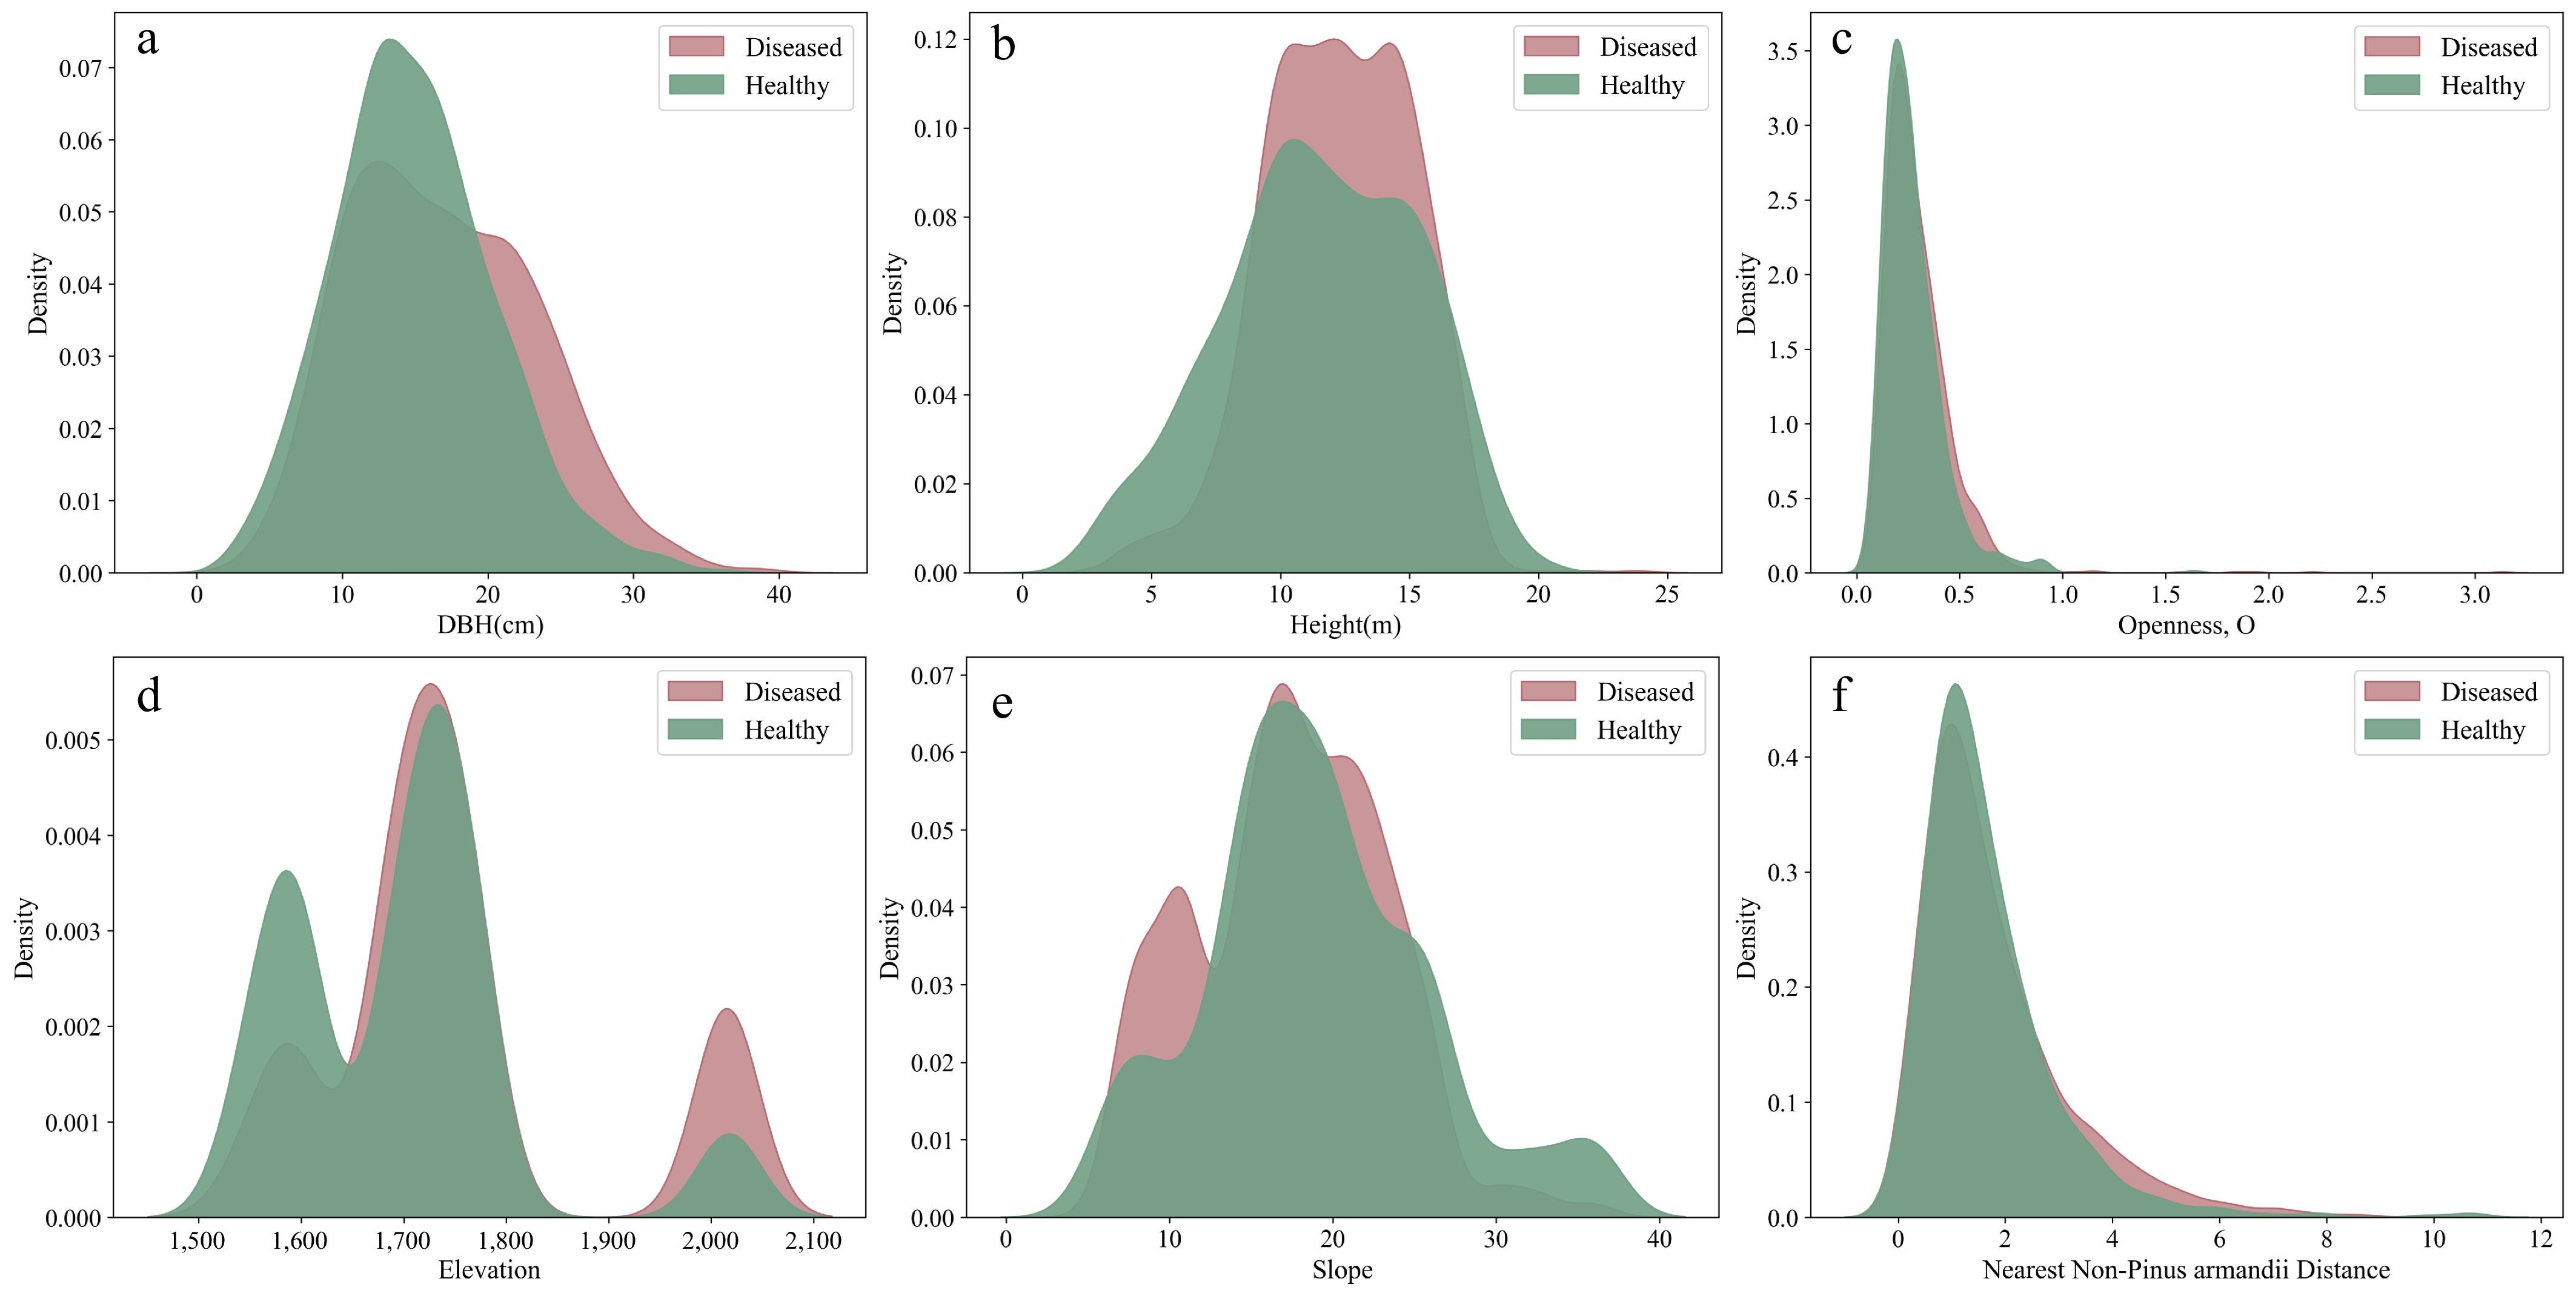
Figure 3.
Distribution of continuous variables that showed significant effects on infestation probability between the infested and non-infested groups in univariate analysis.
-
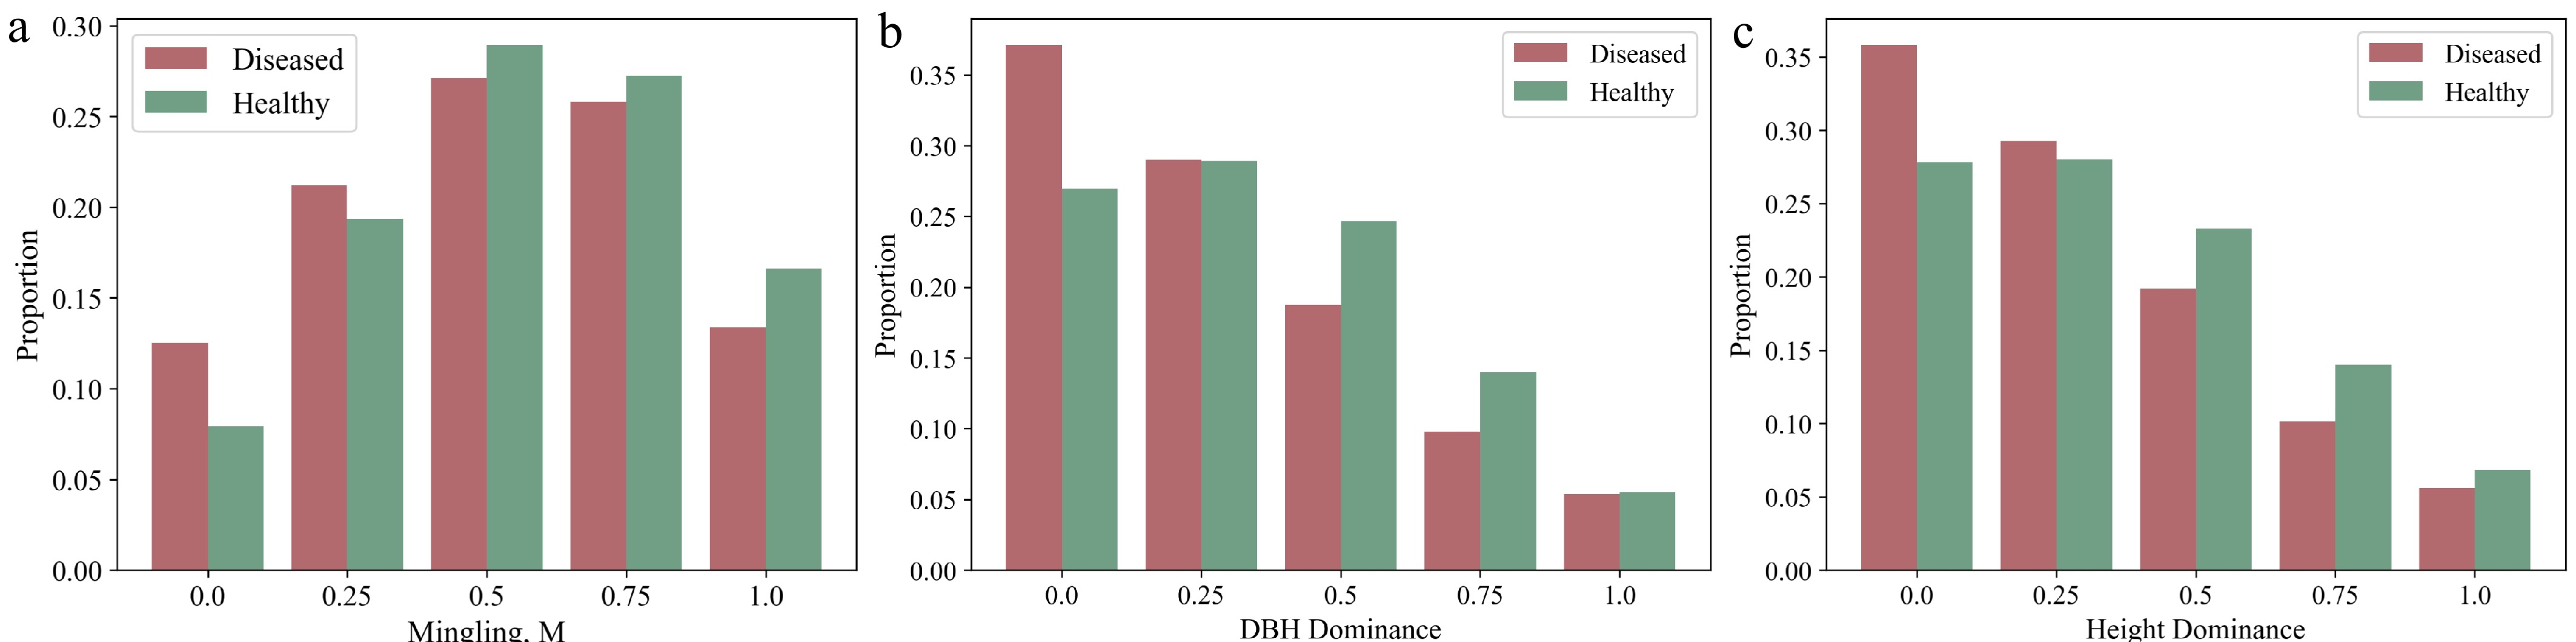
Figure 4.
Proportional distribution of categorical variables that showed significant effects on infestation probability between the infested and non-infested groups in univariate analysis. The figure shows, for each category of every categorical variable, the proportion of infested trees among all infested trees, and the proportion of non-infested trees among all non-infested trees.
-
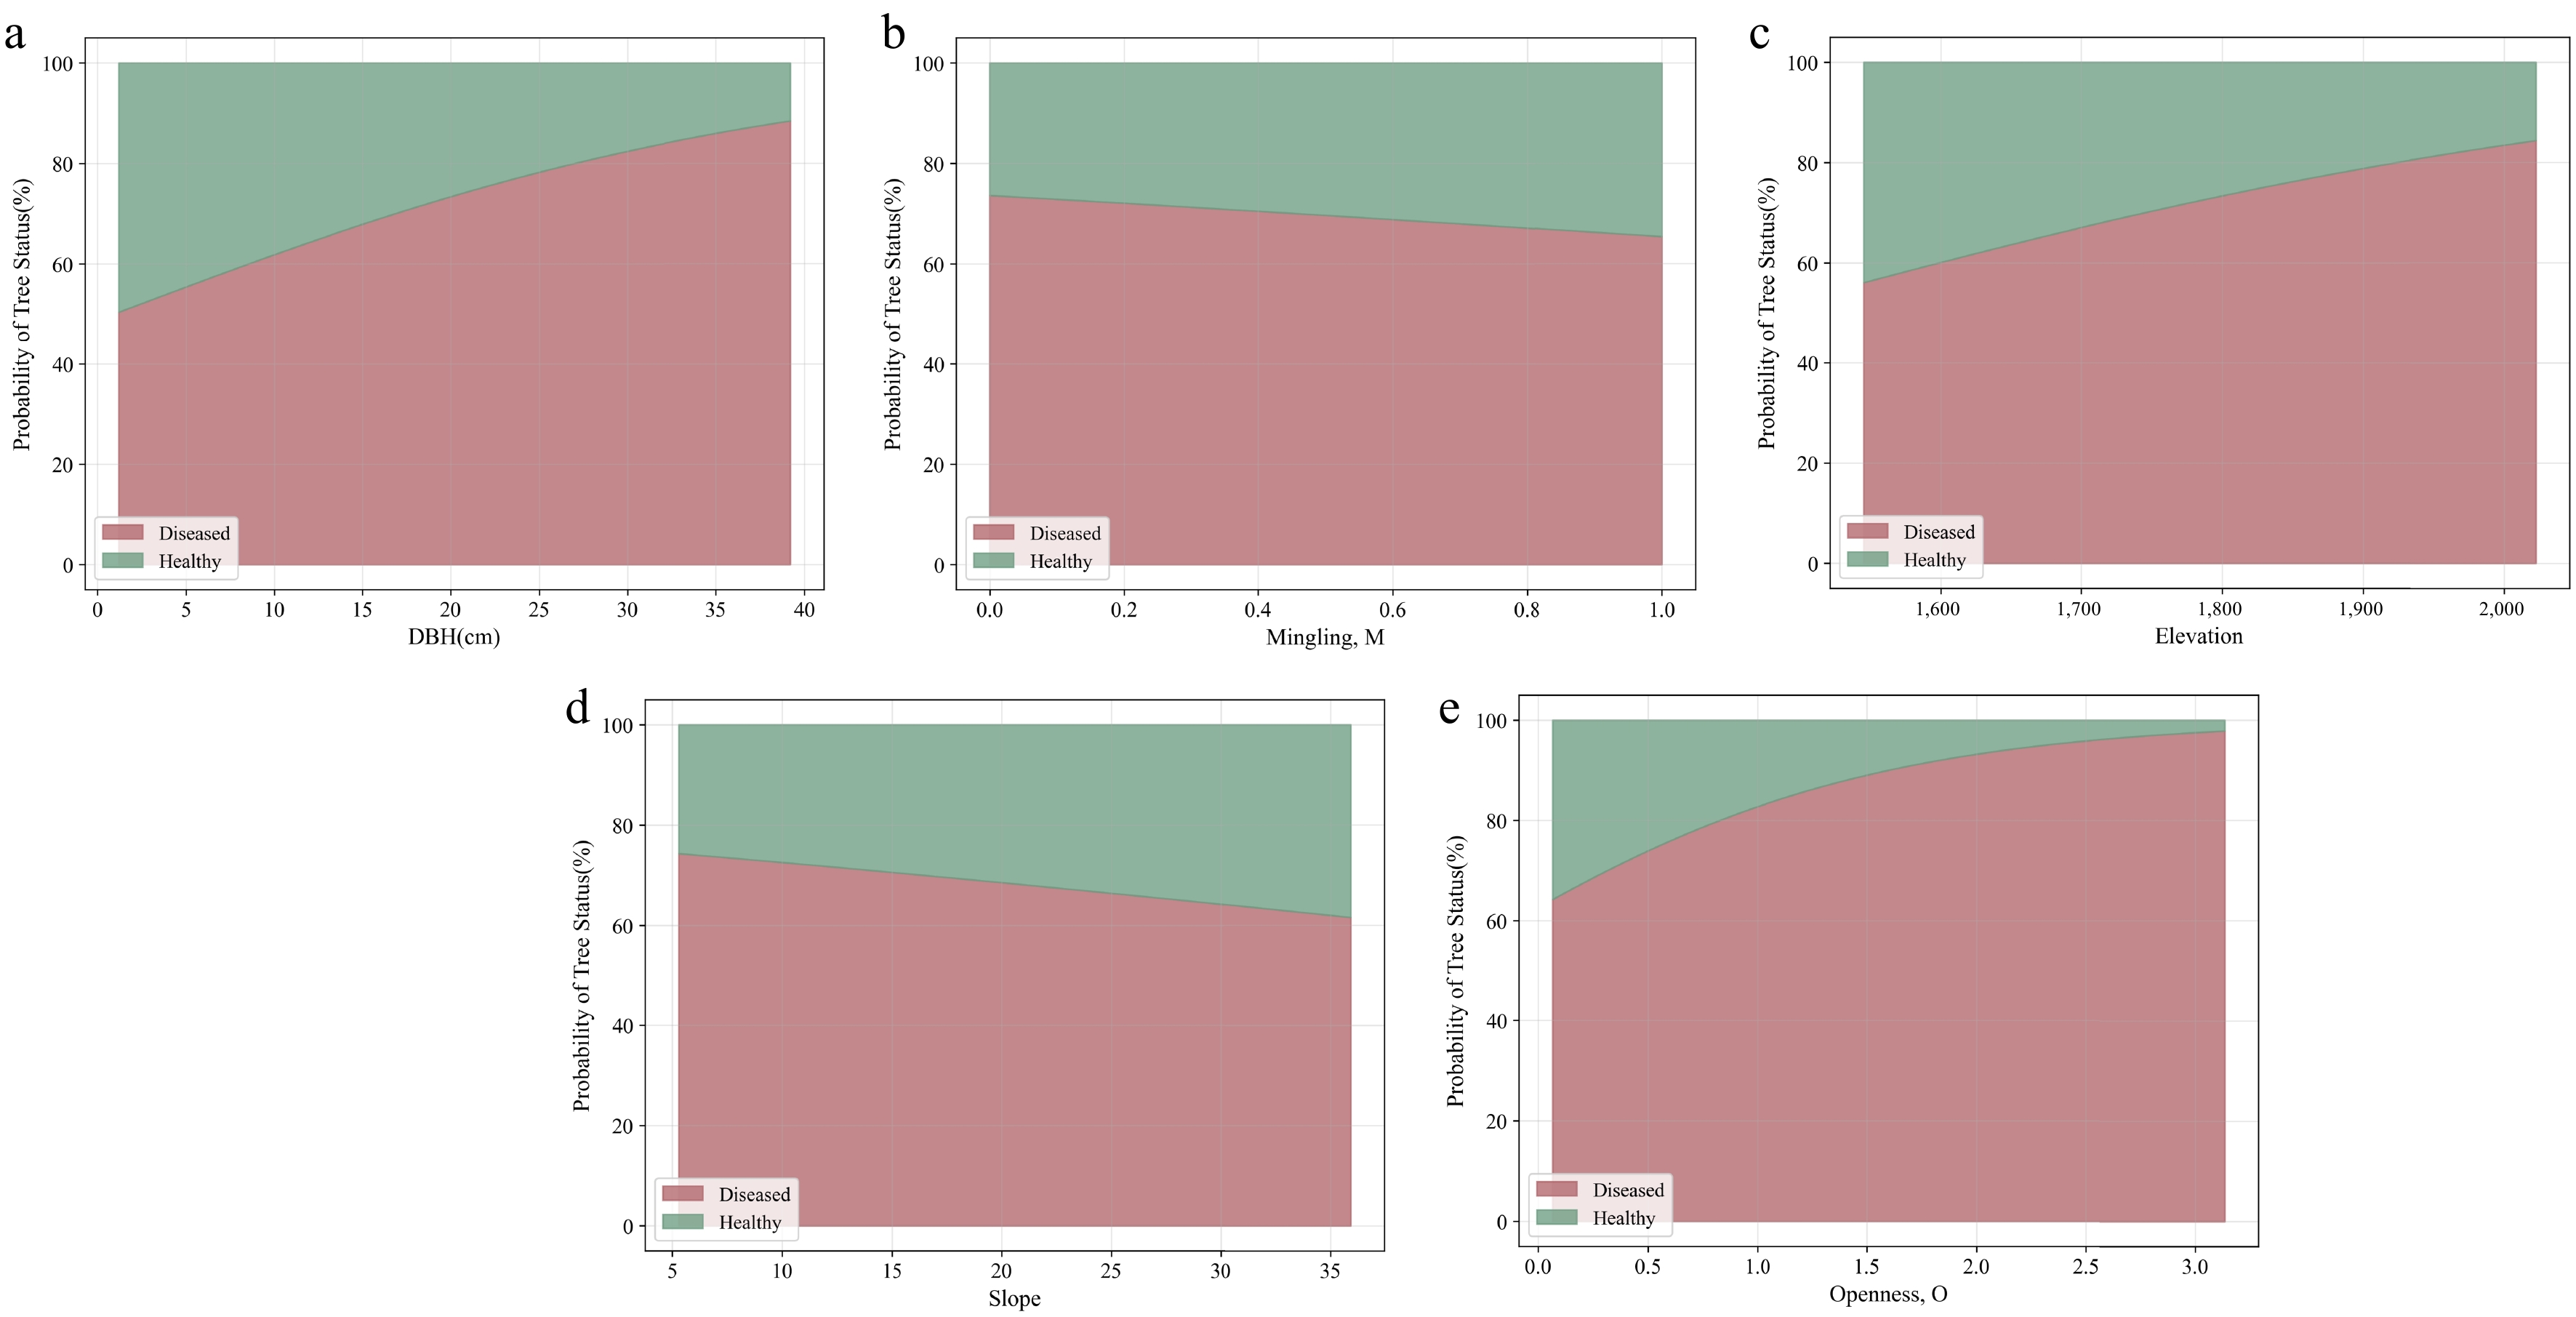
Figure 5.
Predicted probability distribution of trees in the 'Healthy' or 'Diseased' state under different variable conditions, with the total probability across all variables summing to 100%.
-
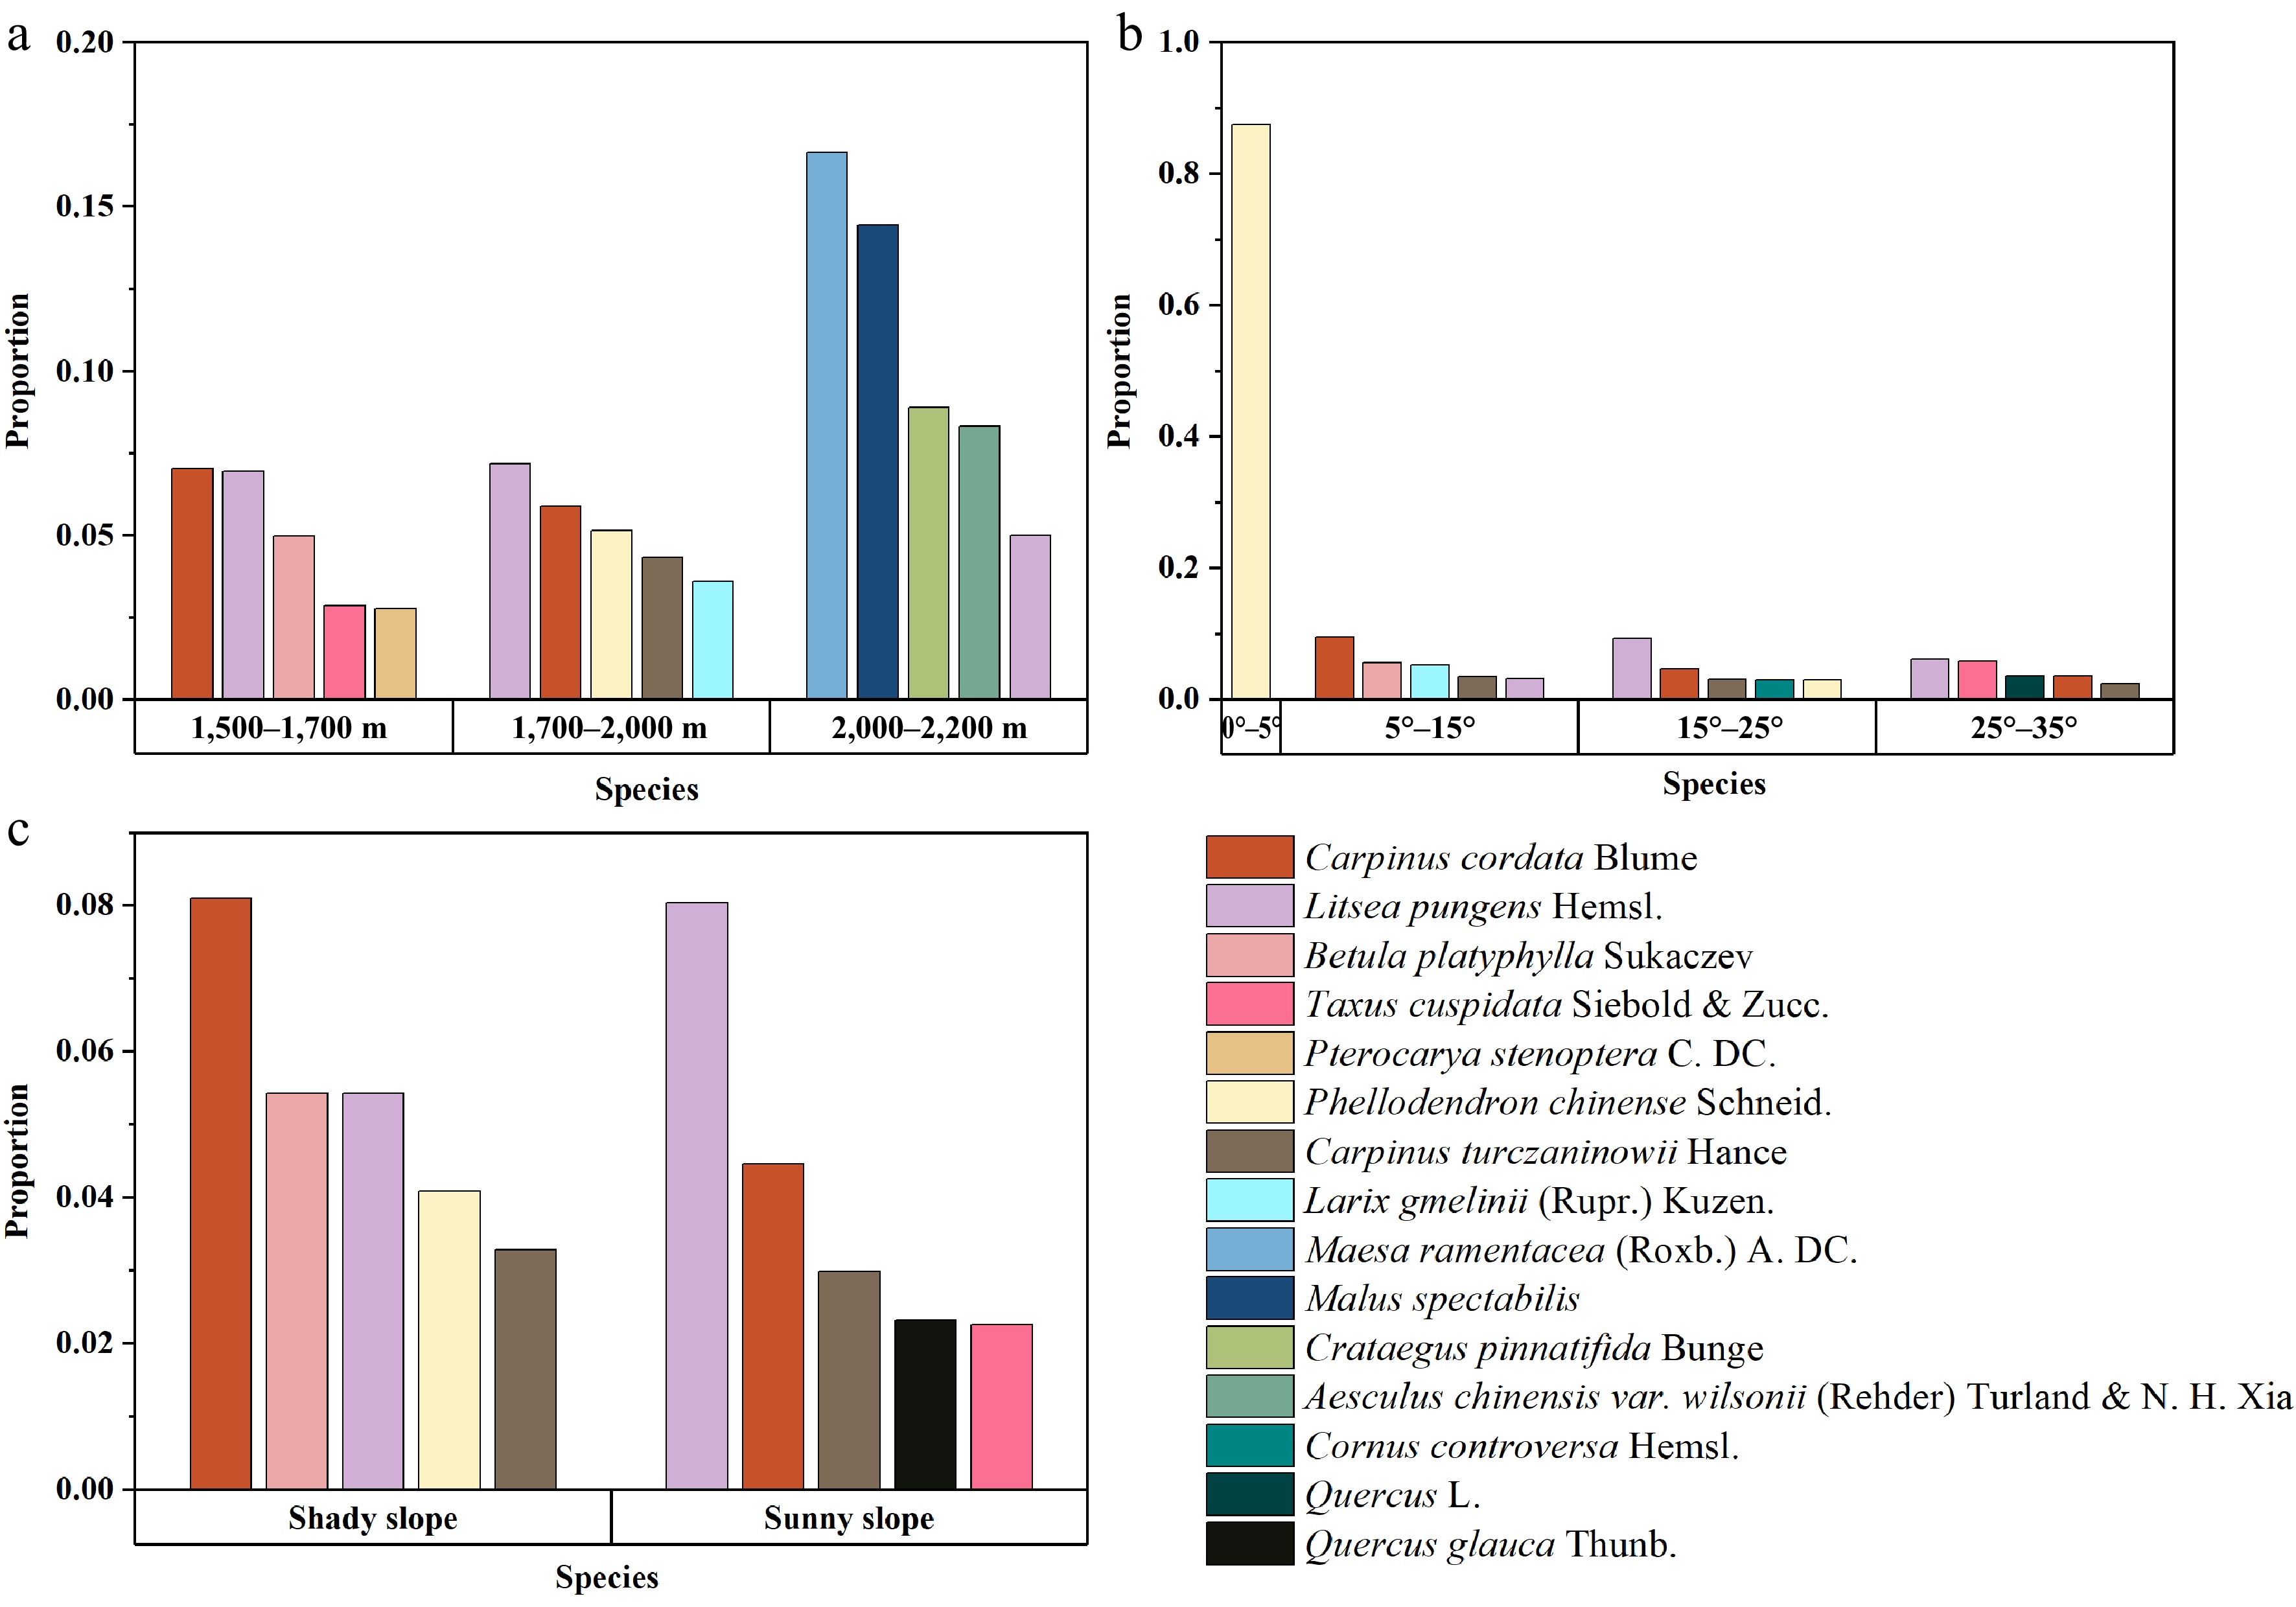
Figure 6.
Statistical data for the nearest neighbors of P. armandii trees, grouped by different elevation levels, slope aspects, and slope gradient categories. The species proportions within each independent terrain classification interval are sorted in descending order of tree species count, though a higher proportion does not necessarily represent a higher number of trees. (a) The top 5 neighboring trees with the highest proportions in different elevation ranges. (b) The top 5 neighboring trees with the highest proportions in different slope gradient ranges. (c) The top 5 neighboring trees with the highest proportions under different slope aspect conditions.
-
Variable Diseased_Mean ± std (SE) Healthy_Mean ± std (SE) p-value Significance DBH (cm) 16.94 ± 6.37 (0.17) 15.00 ± 5.46 (0.21) < 0.001 Significant Height (m) 12.27 ± 2.81 (0.08) 11.53 ± 3.69 (0.14) < 0.001 Significant Elevation 1752.50 ± 134.58 (3.61) 1699.28 ± 113.81 (4.44) < 0.001 Significant Slope 17.40 ± 5.82 (0.16) 18.99 ± 6.85 (0.27) < 0.001 Significant Slope aspect 100.01 ± 84.77 (2.27) 106.64 ± 88.89 (3.47) 0.110 Not significant Openness, O 0.30 ± 0.18 (0.00) 0.27 ± 0.15 (0.01) 0.002 Significant Nearest non-Pinus armandii distance 1.81 ± 1.40 (0.04) 1.67 ± 1.28 (0.05) 0.029 Significant Uniform angle index, W 0.00: 7.33% 0.00: 8.07% 0.245 Not significant 0.25: 17.11% 0.25: 14.61% 0.50: 44.57% 0.50: 47.95% 0.75: 19.34% 0.75: 16.95% 1.00: 11.65% 1.00: 12.79% Mingling, M 0.00: 12.51% 0.00: 7.91% 0.010 Significant 0.25: 21.21% 0.25: 19.33% 0.50: 27.10% 0.50: 28.92% 0.75: 25.81% 0.75: 27.25% 1.00: 13.37% 1.00: 16.59% DBH dominance 0.00: 37.10% 0.00: 26.94% < 0.001 Significant 0.25: 28.97% 0.25: 28.92% 0.50: 18.76% 0.50: 24.66% 0.75: 9.78% 0.75: 14.00% 1.00: 5.39% 1.00: 5.48% Height dominance 0.00: 35.80% 0.00: 27.85% < 0.001 Significant 0.25: 29.26% 0.25: 28.01% 0.50: 19.19% 0.50: 23.19% 0.75: 10.14% 0.75: 14.00% 1.00: 5.61% 1.00: 6.85% For categorical variables, values are fixed at 0, 0.25, 0.5, 0.75, and 1, with respective proportions reported. Table 1.
Grouped statistics and significance test results.
-
Variable β p-value Odd Significance Constant −5.205 < 0.001 0.005 Significant DBH (cm) 0.044 0.003 1.045 Significant Height (m) 0.023 0.422 1.023 Not significant Openness, O 1.523 < 0.001 4.584 Significant Nearest non-Pinus armandii distance −0.085 0.138 0.919 Not significant Elevation 0.003 < 0.001 1.003 Significant Slope −0.020 0.026 0.981 Significant Mingling, M −0.782 0.001 0.457 Significant DBH dominance −0.155 0.62 0.856 Not significant Height dominance 0.133 0.666 1.143 Not significant Table 2.
Logit regression model results.
Figures
(6)
Tables
(2)