-
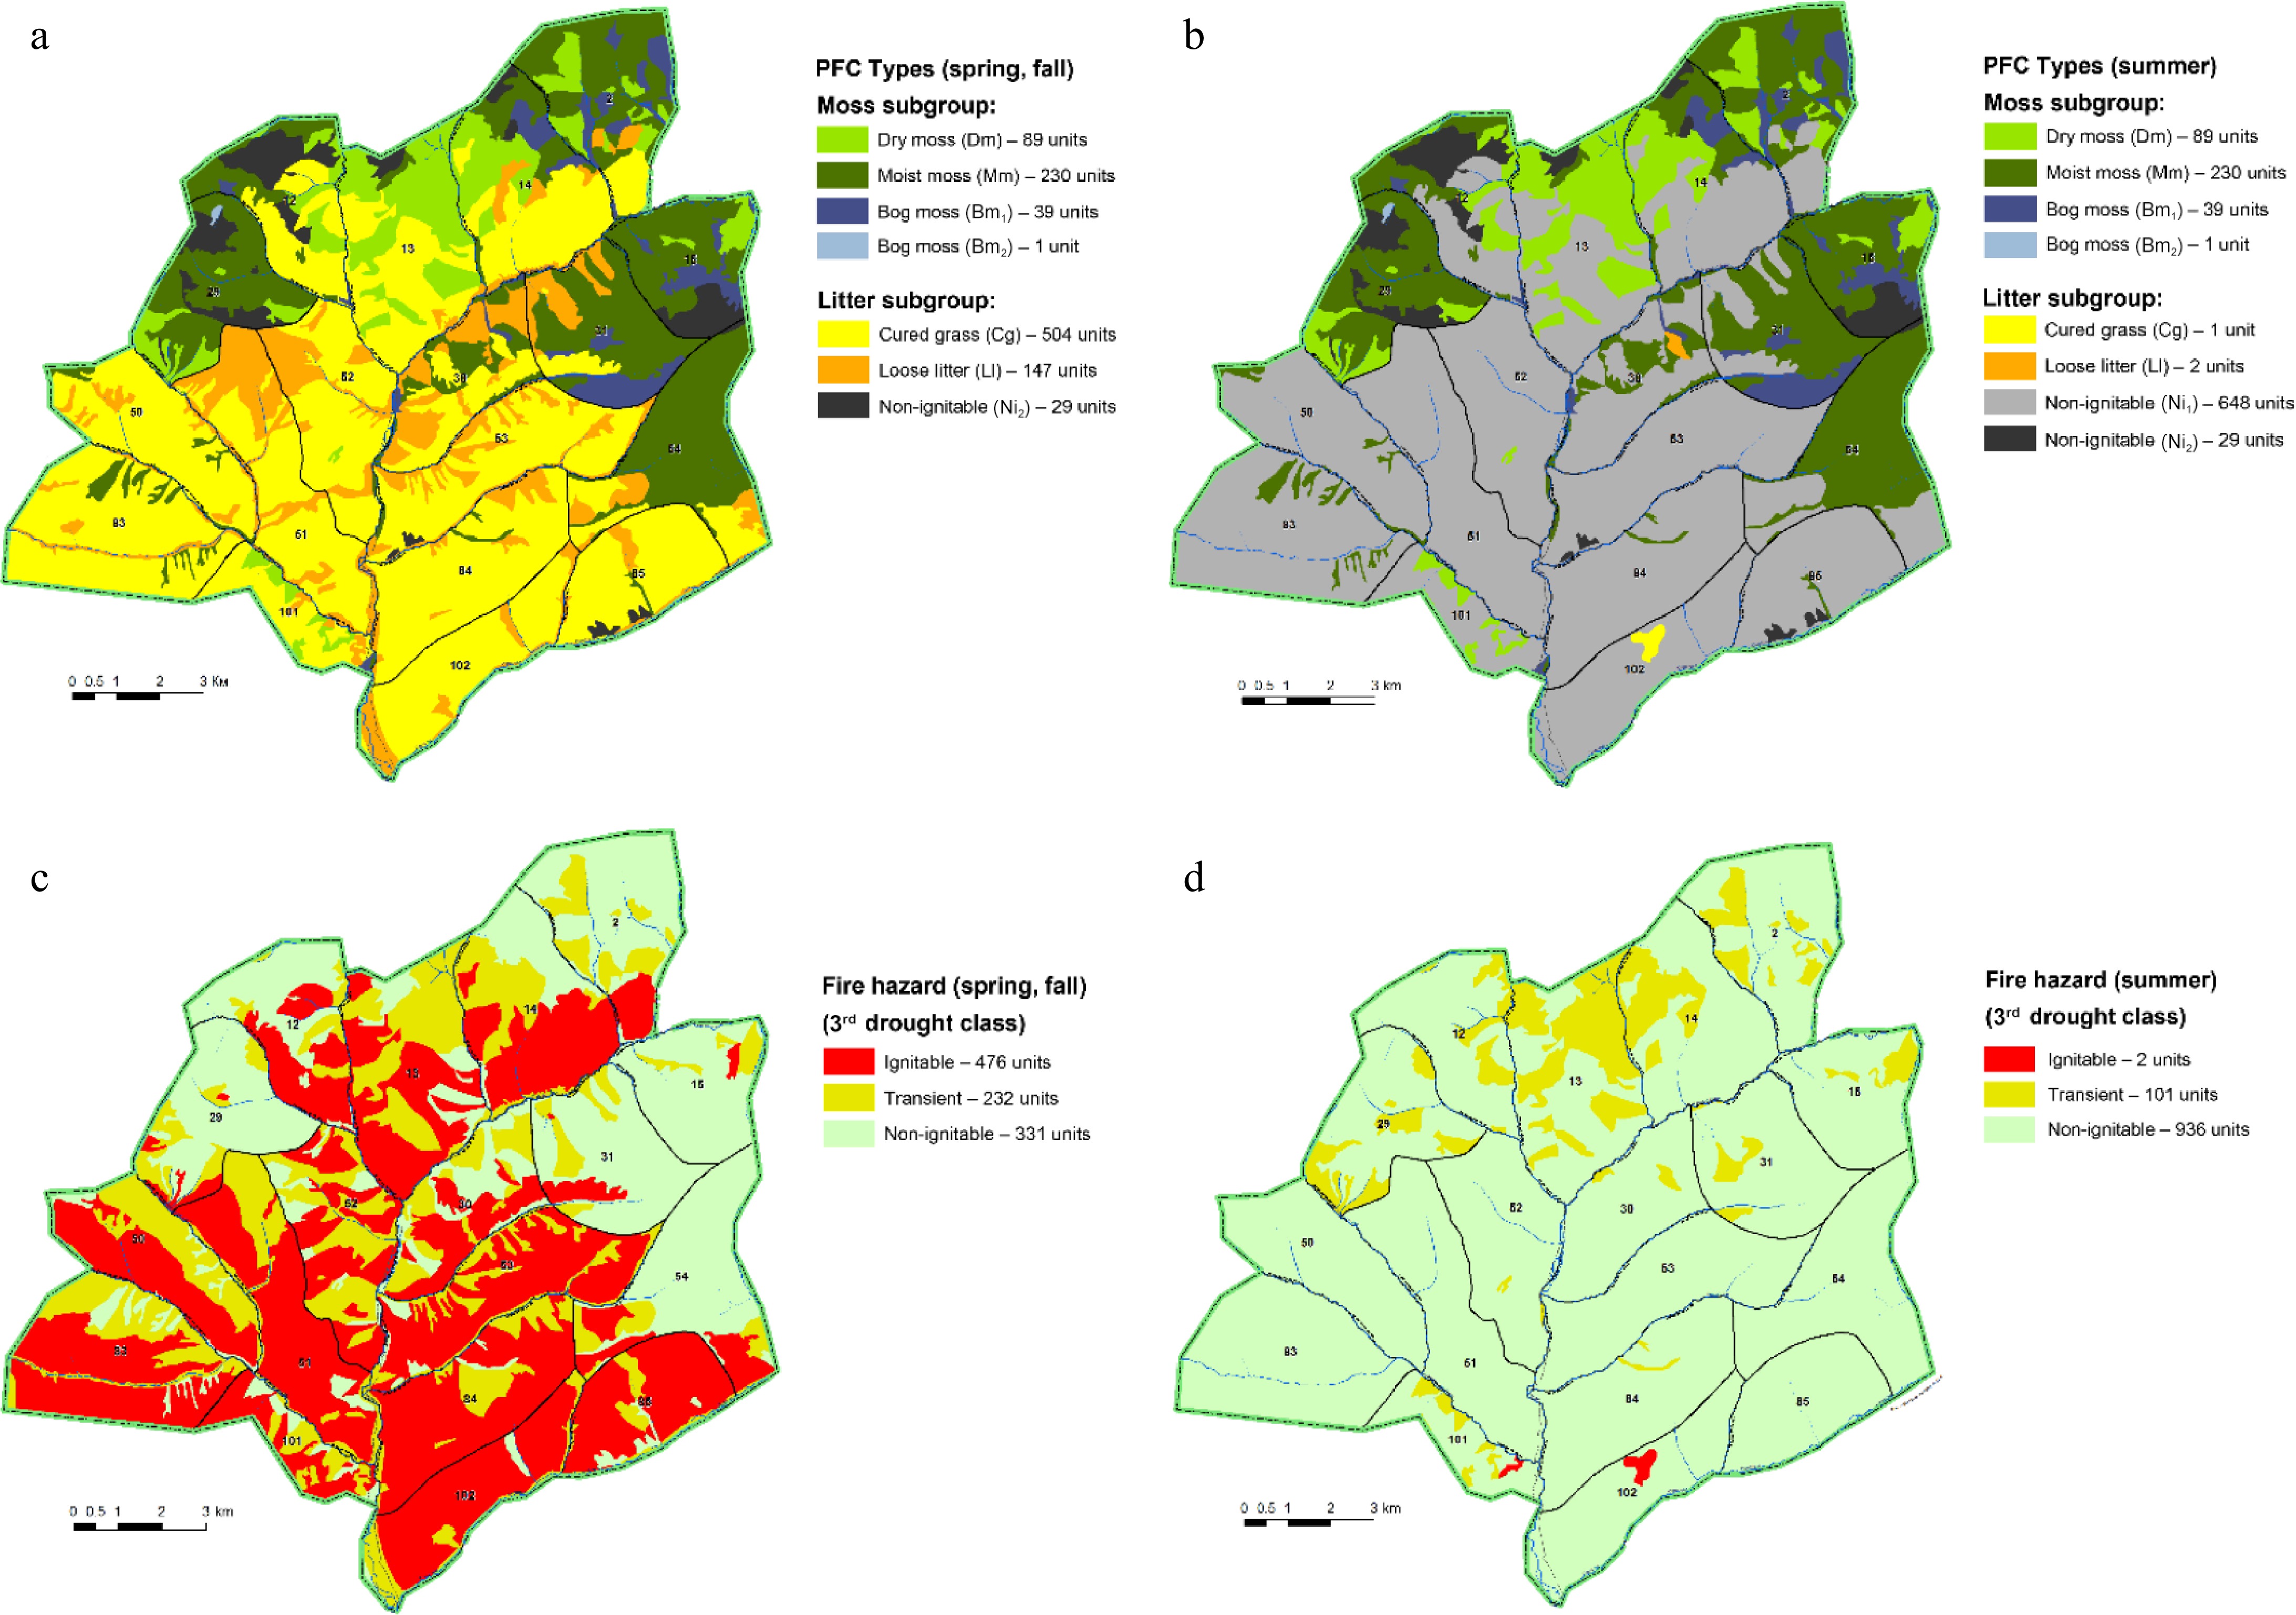
Figure 1.
Fragments of the VF map and the current fire hazard map for the Ubsunur Hollow Nature Reserve.
-
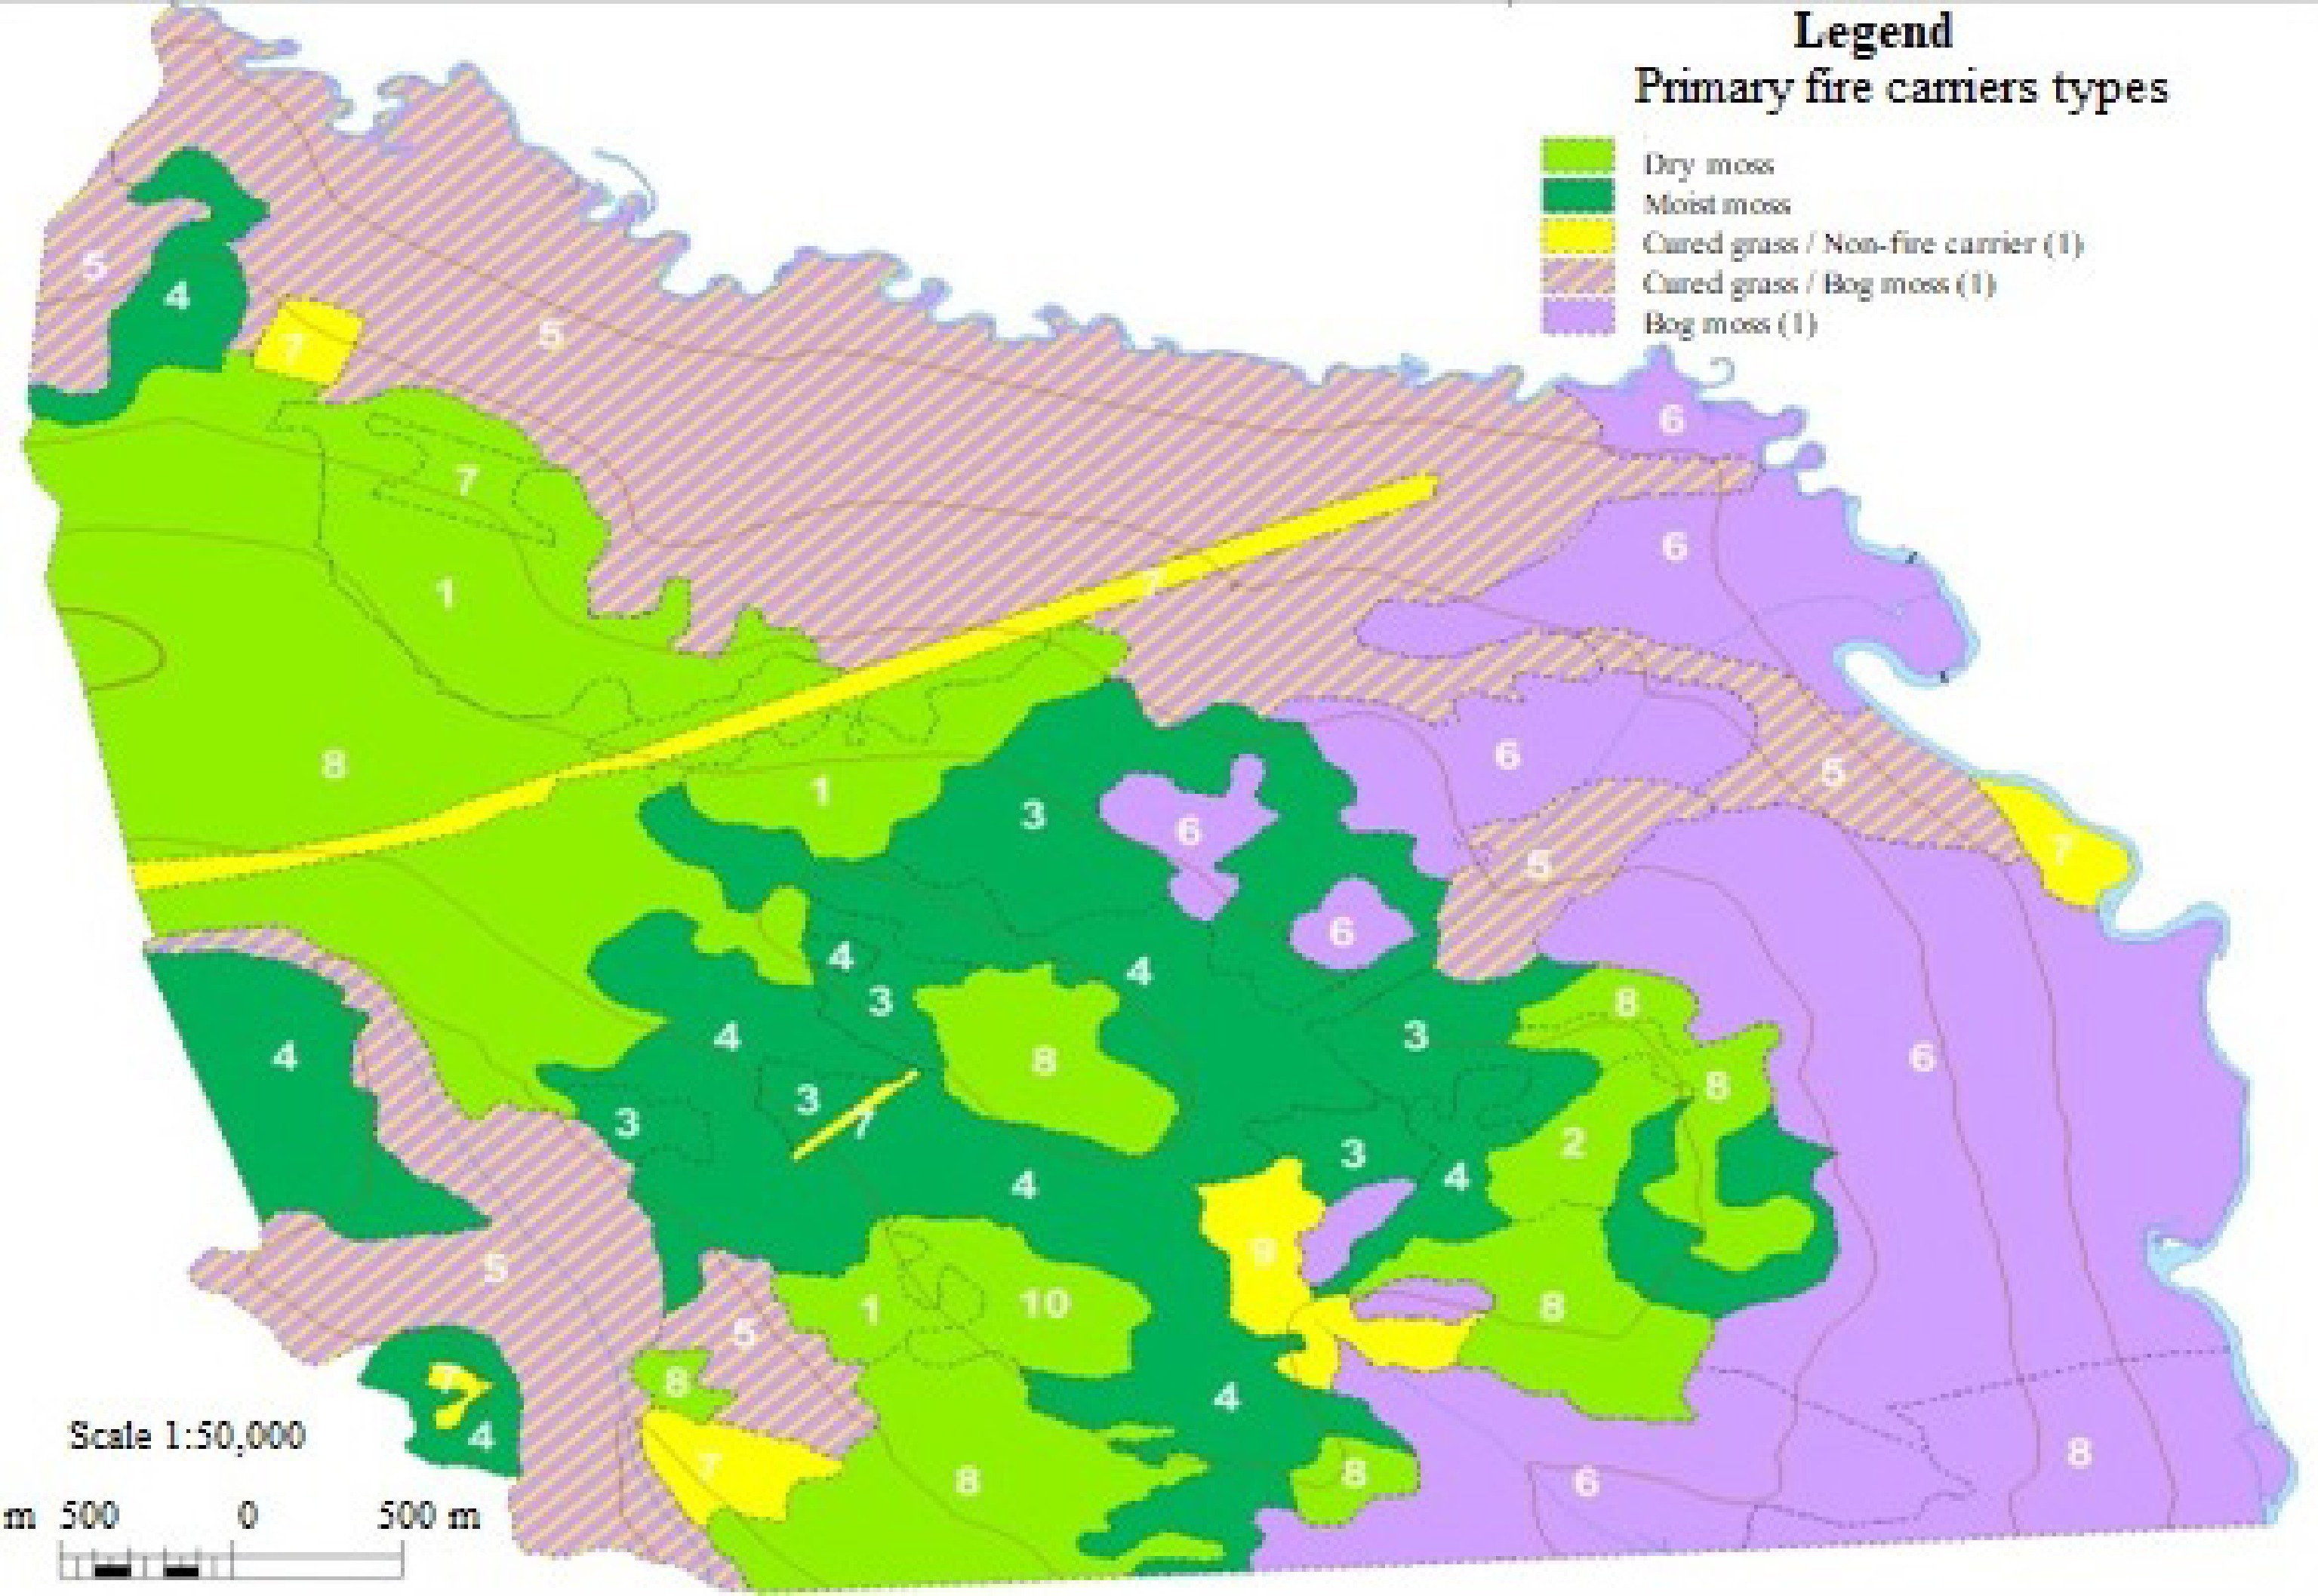
Figure 2.
The result of interpreting PFC types using QuickBird image (Evenkia, VF map fragment).
-
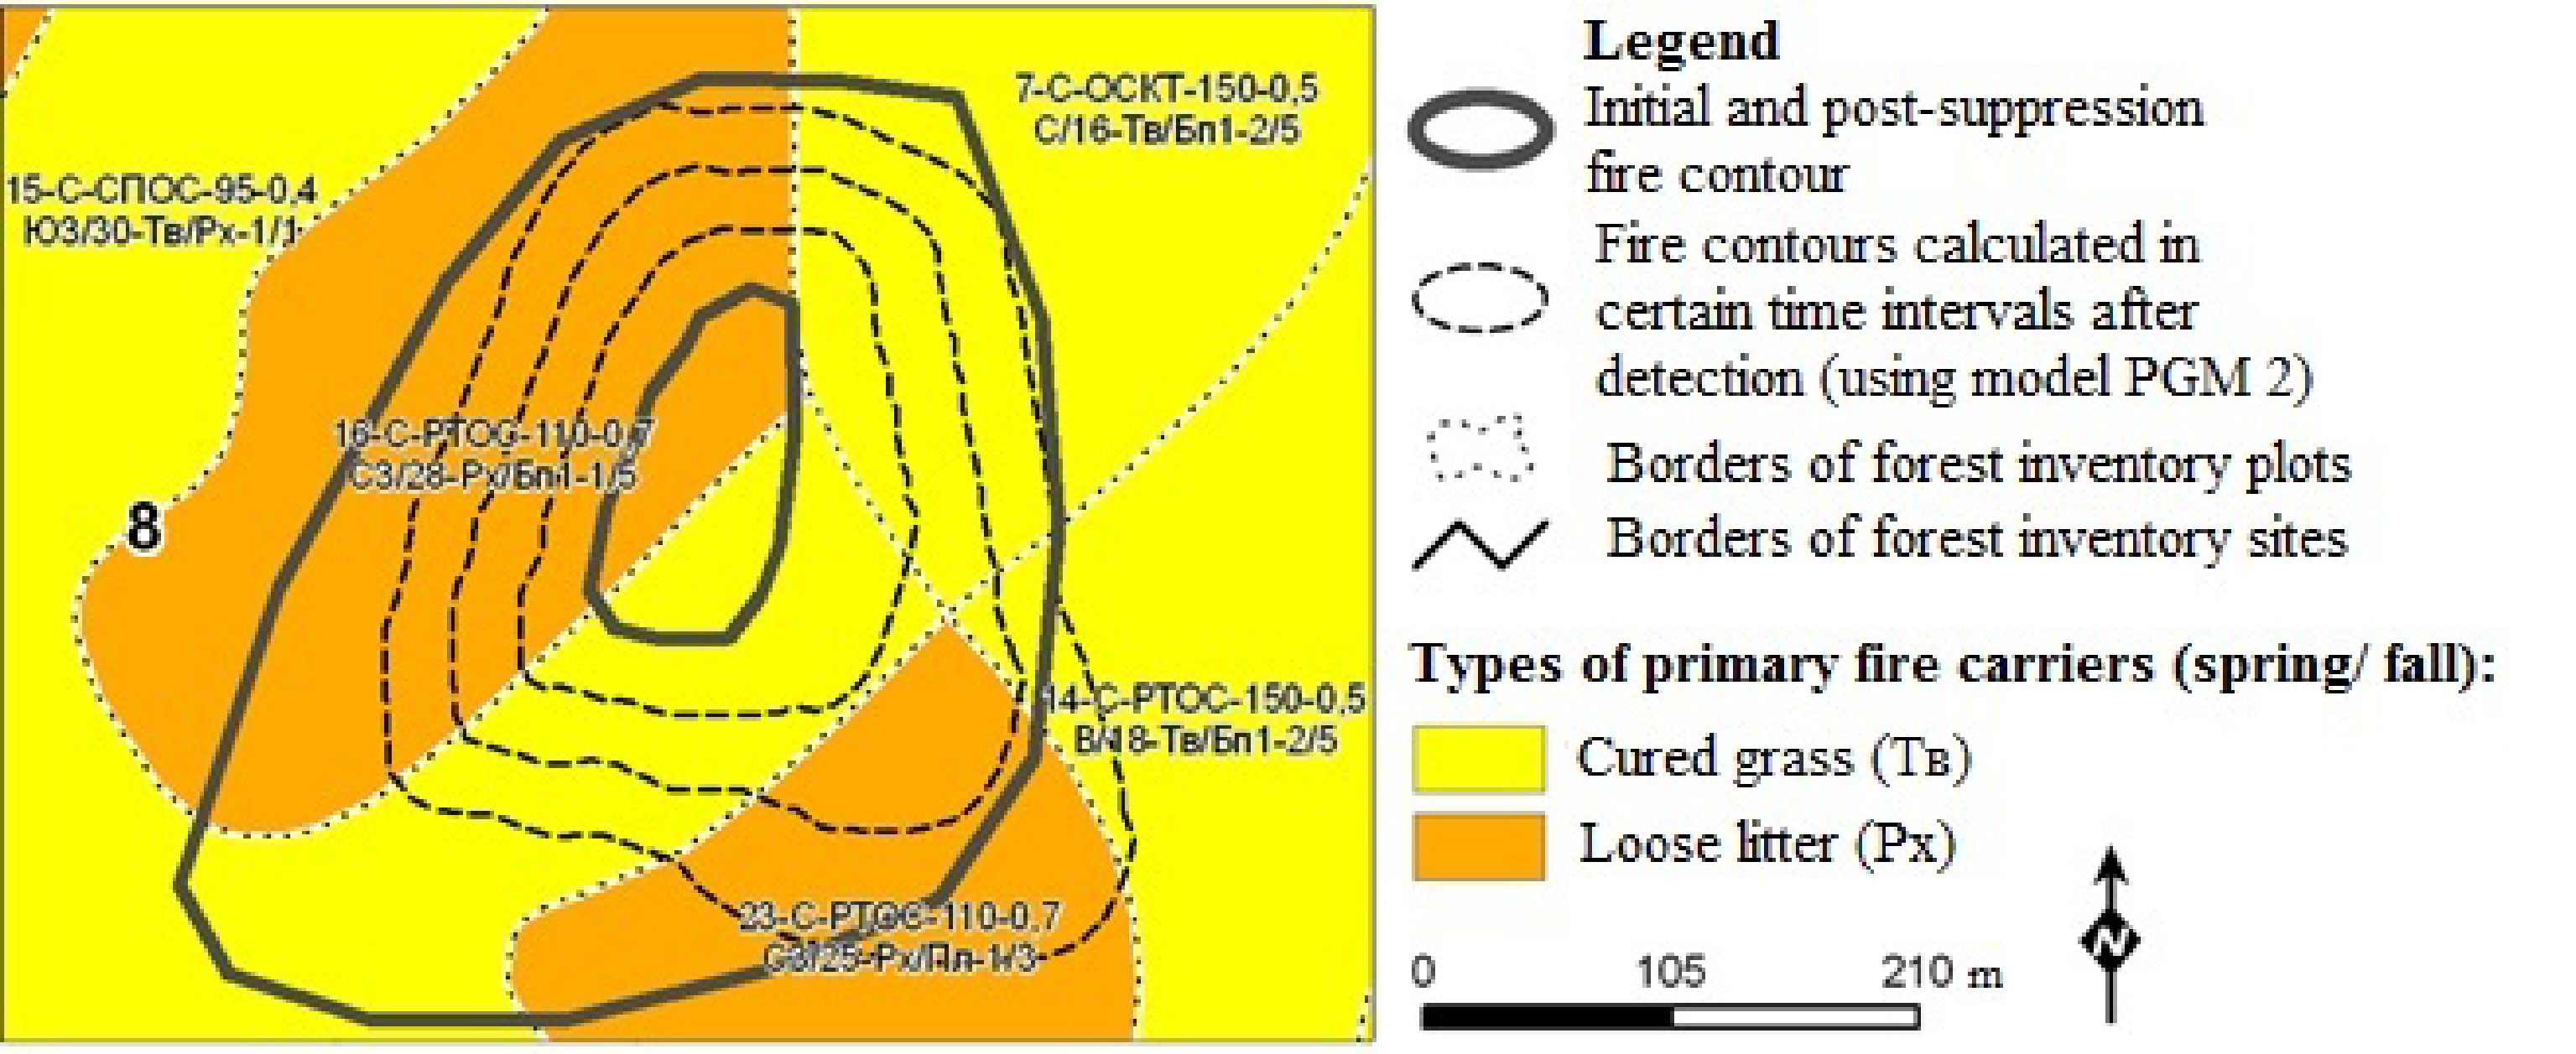
Figure 3.
Prediction of the forest fire spread in the Nature Reserve Stolby.
-
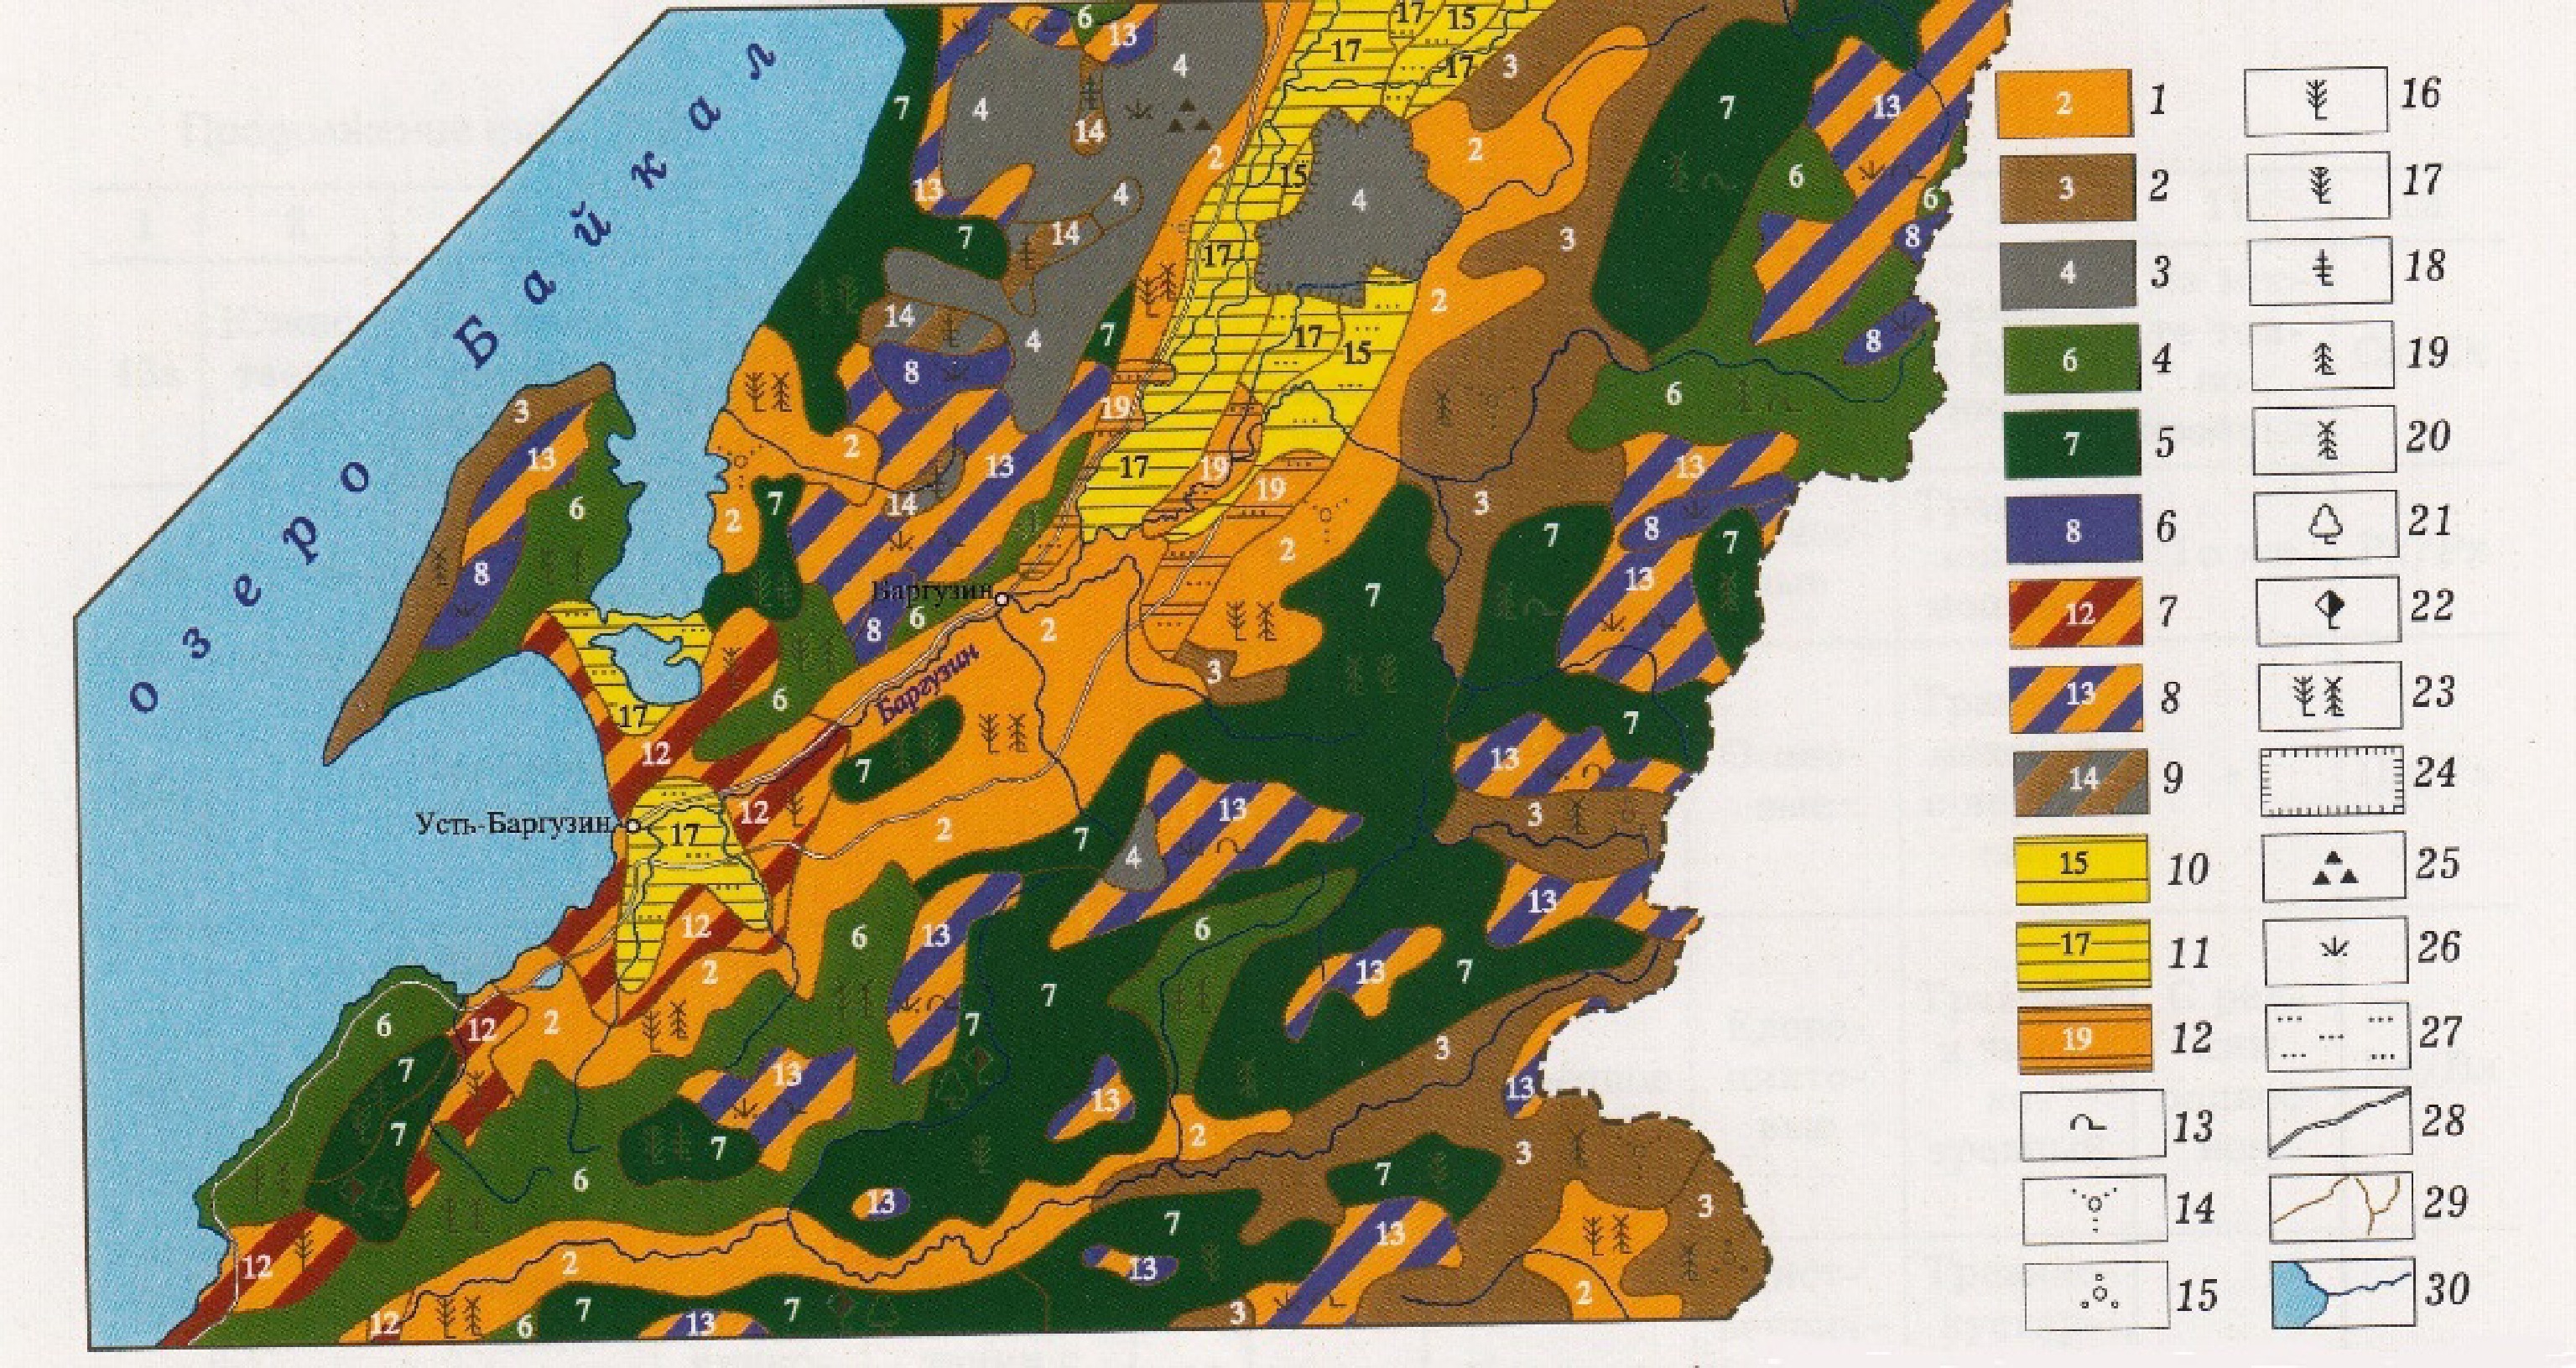
Figure 4.
VF map fragment for Lake Baikal Basin (1:1,000,000). Types of primary fire carriers (PFC types): 1 – loose litter, 2 – compact litter, 3 – non-fire-carriers, 4 – dry moss, 5 – moist moss, 6 – bog moss. Combinations of PFC types: 7 – loose litter and lichen, 8 – loose litter and bog moss, 9 – compact litter and non-fire-carrier. Seasonal dynamics of PFC types (spring/summer): 10 – cured grass/loose litter, 11 – cured grass/non-fire-carrier, 12 – loose litter/compact litter. Shrubs: 13 – Pinus pumila, 14 – Rhododendron, 15 – Betula nana. Canopy cover: 16 – pine, 17 – Siberian pine, 18 – larch, 19 – spruce, 20 – fir, 21 – birch, 22 – aspen, 23 – mixed canopy cover. Non-forest areas: 24 – crop lands, 25 – goltsy, 26 – tundra, 27 – steppes. Other legend signs: 28 – roads, 29 – plot borders, 30 – rivers, lakes.
-
Mossy PFC subgroup Lc
(lichen)Dm
(dry moss)Mm
(moist moss)Bm1
(bog moss)Bm2
(bog moss)Litter PFC subgroup Cg ↔ Ll ↔ C1 ↔ Nc1 Nc2 (Cured grass) (Loos litter) (Compact litter) (Non-fire-carriers) Critical class of dryness (CCD) I II III IV Would not burn Note: The critical class of dryness (CCD) for a PFC fuel type is a dryness class under which the PFC fuel class becomes flammable. A dryness class was determined based on the Nesterov Index[17]. Table 1.
Scheme showing the idea of PFC classification.
-
PFC subgroup Prevailing tree species Treeless Moss Litter With foliage (both leaf and needle):
pine, spruce, Siberian pine, larch, birch, aspen, firWithout foliage:
larch, birch, aspenAreas without a thick
layer of shrubsPrimary Fire Carriers (PFC)
types and subtypesRelative stand stocking* (including the second storey) ≥ 0.8 0.5−0.7** ≤ 0.4*** Any Critical dryness classes Lc Cg II I I I I Dm Ll III II I I I Mm Cl IV III III III III Bm1 Nc1 V IV (Nc1-V) IV (Nc1-V) IV (Nc1-V) IV (Nc1-V) Bm2 Nc2 Would not burn * It is the ratio of the cross-sectional area of trees at breast height (1.3 m) in a given forest stand to the cross-sectional area in a standard (for this species) forest stand, which is assumed to be 1. ** ≥ 0.6, and *** ≤ 0.5 for Northern larch open forests. Table 2.
Estimation of critical dryness classes for current fire hazard assessment.
-
Periods Before April 30 and after September 1 From May 1
to August 31Exposure North and North-East South and
South-WestNorth and North-East Slope 20−30° > 30° > 25° > 30° Drying rate One dryness class later Two dryness classes later One dryness class earlier One dryness class later Table 3.
Influence of exposure and slope on drying rate (for latitude 50−60° North).
-
Time passed after the
start of prediction1 h 2 h 3 h Fire characteristics Fire area, ha 2.7 5.2 8.5 Fire perimeter, m 620 870 1120 Perimeter spread rate, m/h 226 260 240 Area spread rate, ha/h 2 2.9 3.6 Fire front average spread rate, m/h 33 35 34 Fire edge average intensity, kW/m 112 109 107 Fire intensity assessment Medium Medium Medium Assessment of manpower and means for fire suppression Optimum suppression rate, m/h 680 780 720 Suppression duration, h/area of burnt area after suppression, ha Three firefighters 7/16 – – Five firefighters 3/8 5/20 7/40 Seven firefighters 1.5/4.5 2.5/11 3.5/20 10 firefighters 1/3.5 1.5/9.9 2.5/17 15 firefighters 0.5/3 1/7 1.5/15 20 firefighters – – 1/14 Table 4.
Characteristics of fire No. 5 calculated using the developed software.
-
Ife, kW/m Average stand diameter (or forest component), cm Pine stand mortality, % Larch stand mortality, % 8 12 16 20 24 28 32 36 8 12 16 20 24 28 32 36 Up to 20 8 2 1 0 0 0 0 0 0 0 0 0 0 0 0 0 20−60 32 9 4 2 1 0 0 0 4 2 0 0 0 0 0 0 61−100 56 22 10 6 3 1 0 0 11 4 2 0 0 0 0 0 101−250 76 38 21 12 9 5 4 3 28 10 6 2 0 0 0 0 251−550 100 73 45 33 23 16 12 9 65 28 15 7 4 1 0 0 551−1,200 100 100 84 72 60 47 36 36 95 64 32 22 15 11 6 4 1,201−2,400 100 100 100 95 87 82 75 66 100 95 58 41 28 22 17 10 Over 2,400 100 100 100 100 100 96 93 88 100 100 85 60 44 33 27 22 Birch stand mortality, % Spruce stand mortality, % Up to 20 25 6 2 0 0 0 0 30 16 8 4 2 0 0 0 20−60 45 23 10 7 5 4 3 63 44 30 24 21 18 16 14 61−100 69 40 20 15 11 10 8 85 67 55 45 40 36 34 32 101−250 84 57 32 22 20 18 14 100 83 75 67 58 53 50 47 51−550 100 72 50 33 30 27 22 100 98 93 88 82 77 73 70 551−1,200 100 85 65 50 42 38 33 100 100 100 100 98 96 94 92 Over 1,200 100 100 74 62 54 48 42 100 100 100 100 100 100 100 100 Table 5.
Prediction of tree mortality by stock (%) in stands after a surface fire, depending on the predicted fire intensity at the fire edge (Ife, kW/m).
Figures
(4)
Tables
(5)