-
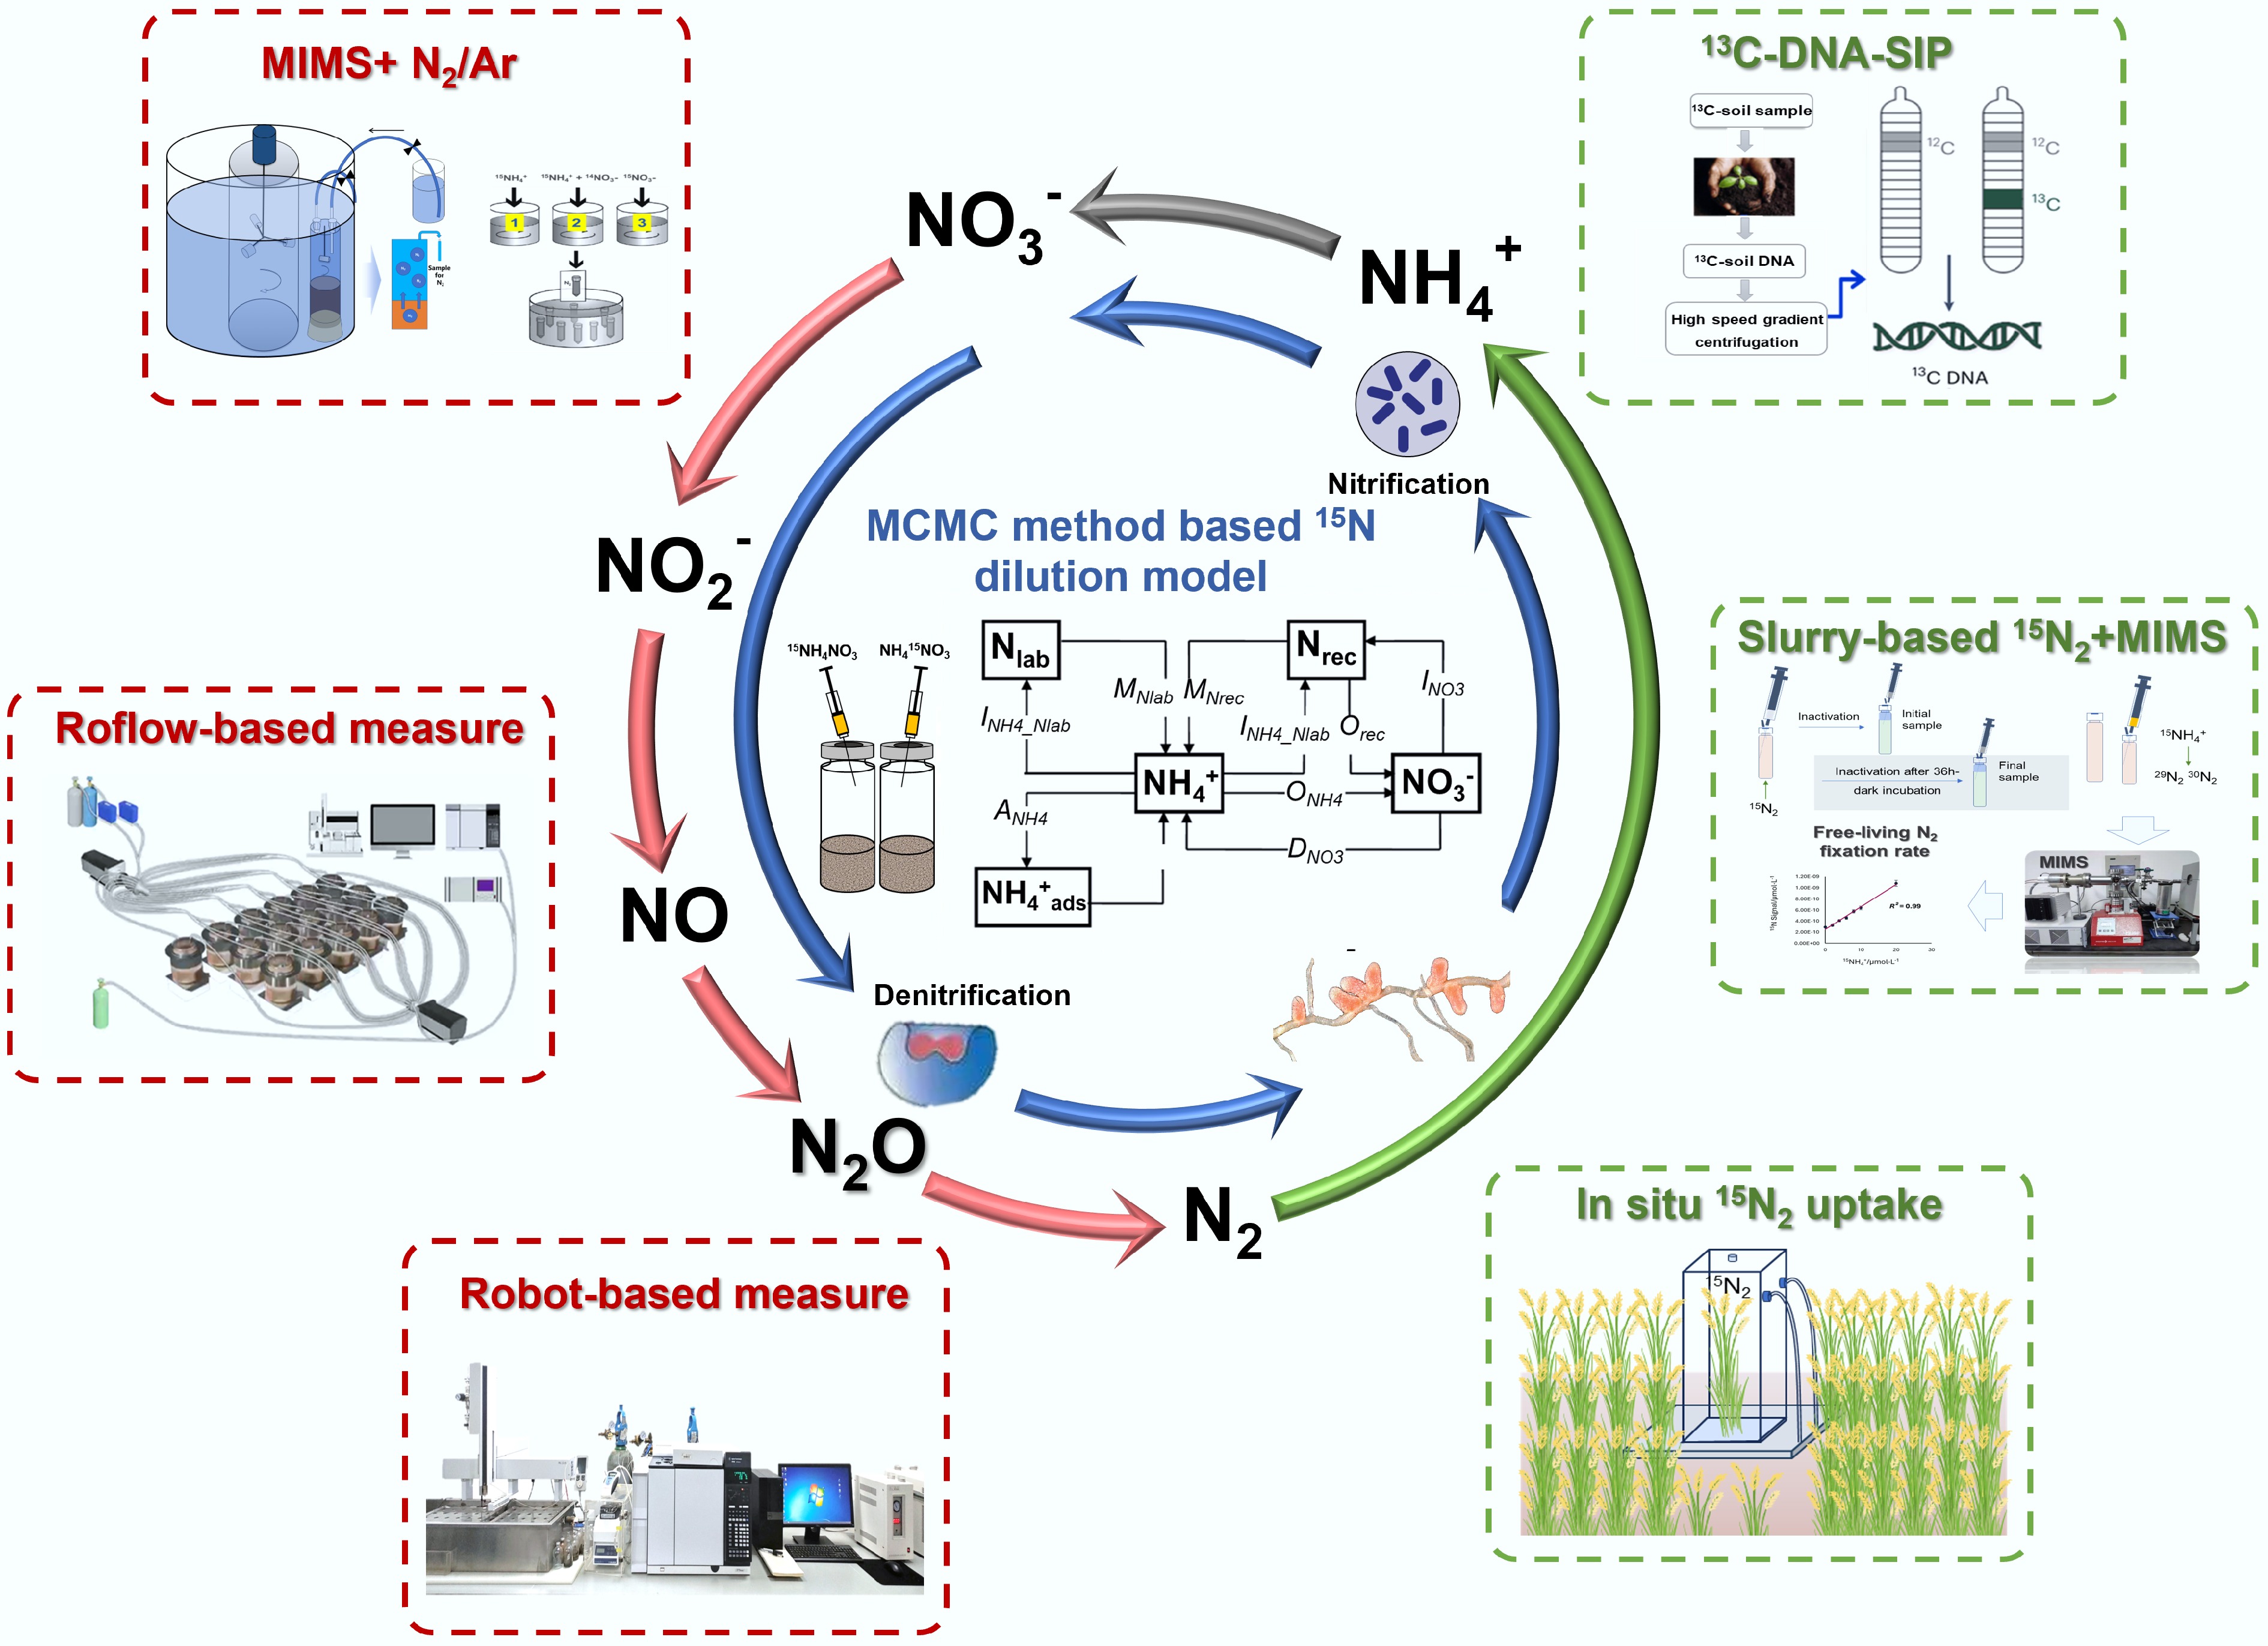
Figure 1.
Methodological innovations for gross N transformation, denitrification, and biological N fixation quantification in agroecosystems. Utilization of MCMC method based 15N dilution mode (modified from Müller et al.[5,6]) allows for precisely determining gross N transformation processes rates (blue arrows); Application of robotized continuous-flow incubation system and membrane inlet mass spectrometry enables direct quantification of N2 loss (red arrows); The 15N2 tracer techniques combined with stable isotope probing and multi-omics enable the determination of biological N fixation rate and the identification of active diazotrophs.
-
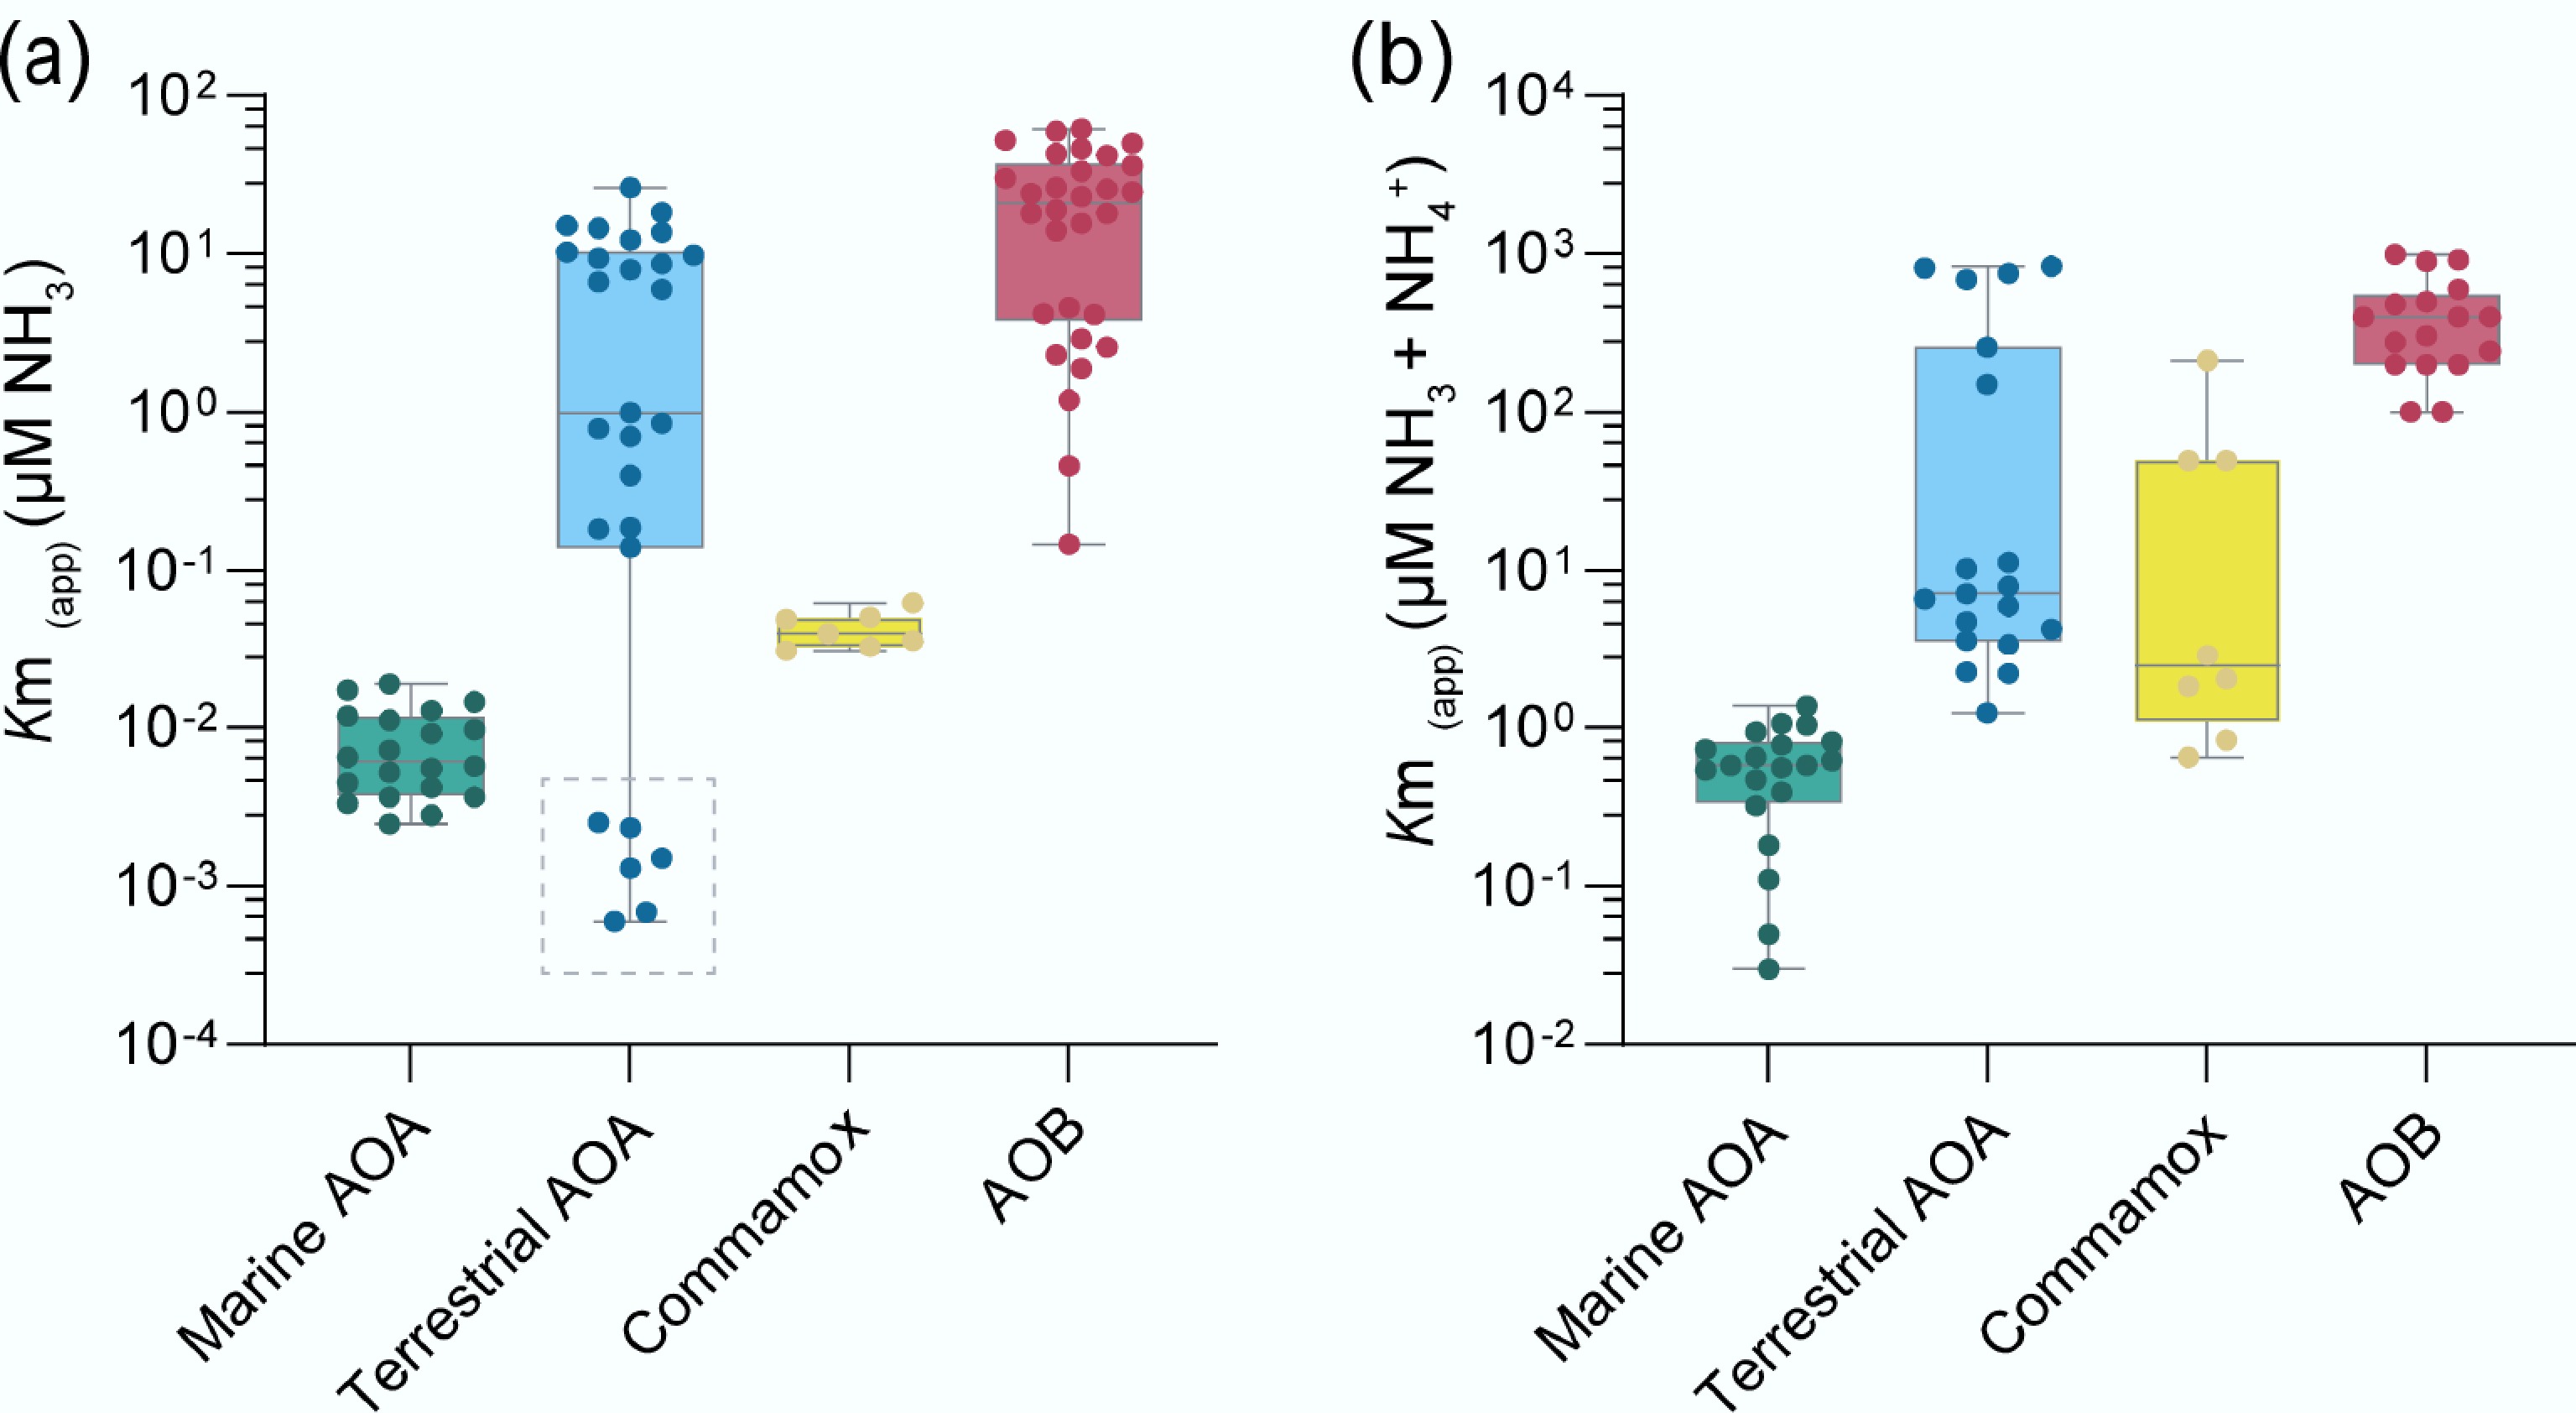
Figure 2.
Different ammonia-oxidizing microorganisms (AOMs) exhibit distinct apparent substrate affinities (Km(app)) for (a) ammonia, and (b) total ammonium. The dashed box represents the acidic soil AOA ('Ca. Nitrosotaleales', Group 1.1 a-associated), whose low Km(app) (NH3) may be attributed to the minimal dissociation of ammonia from ammonium under low pH conditions. The data in the figures were collected from previous studies[62−68].
-
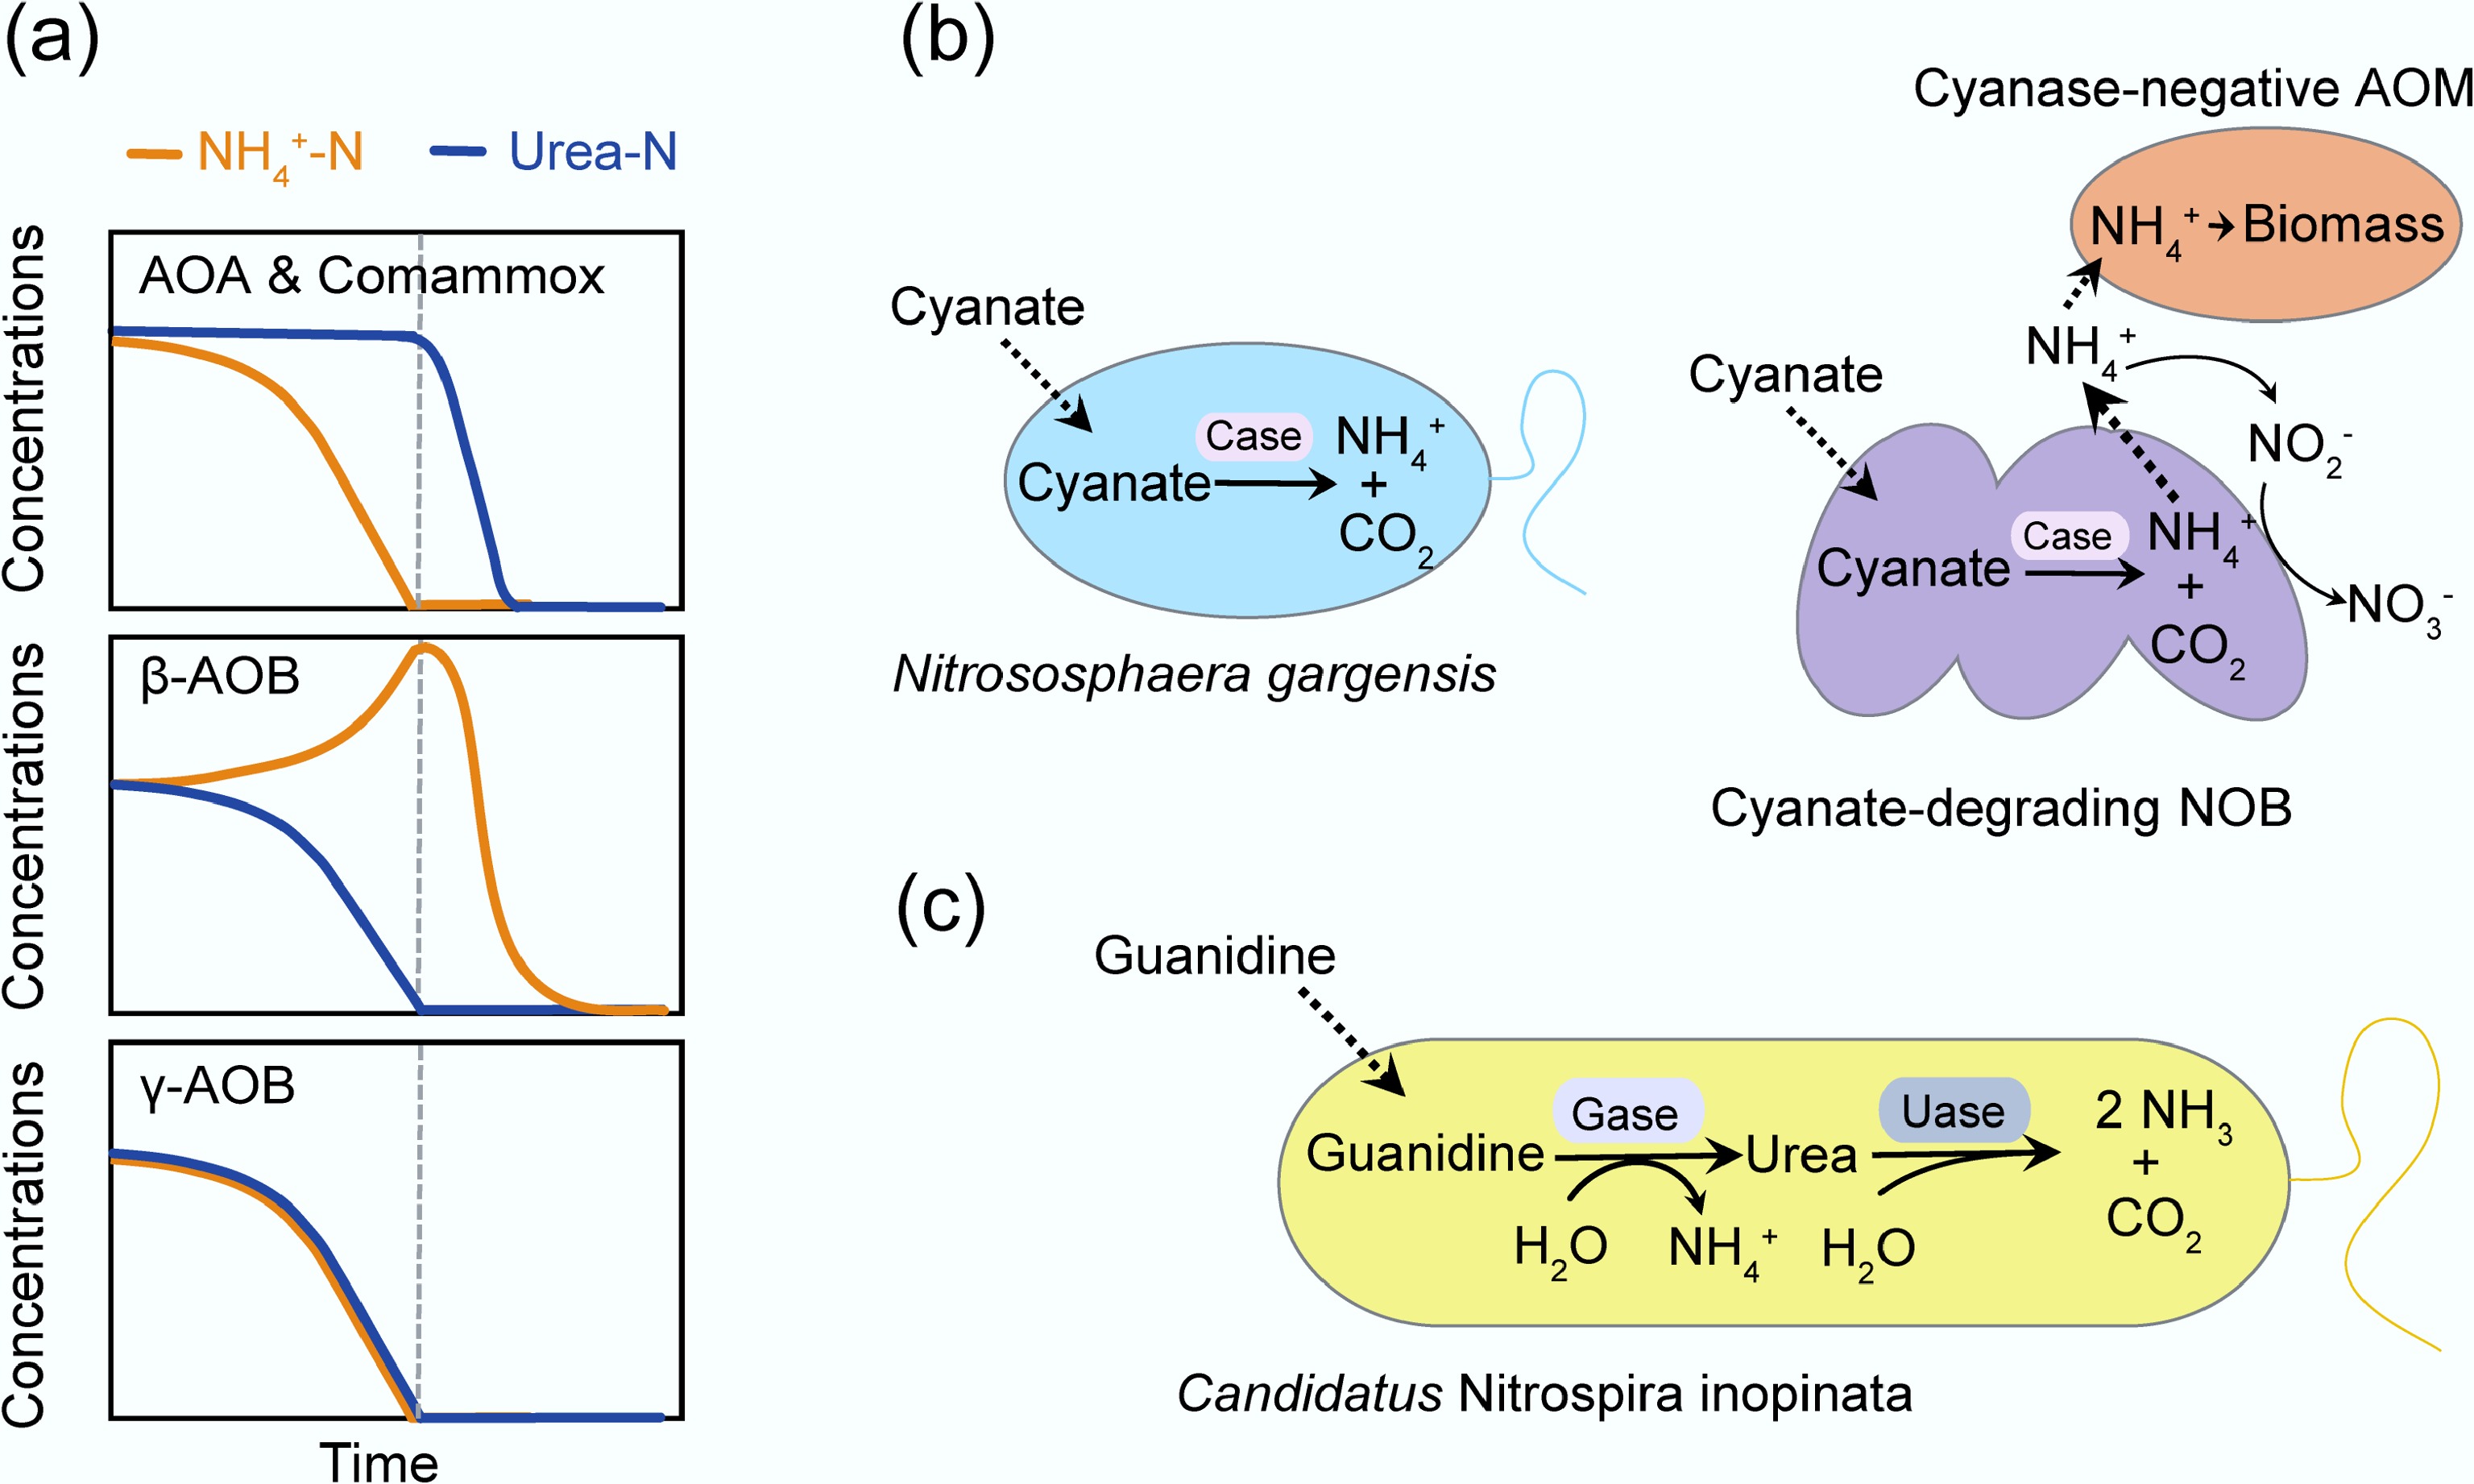
Figure 3.
Substrate preference and the metabolic versatility of AOM. (a) Three AOM nitrogen utilization patterns with equal ammonia-N and urea-N coexistence. Redrawn with reference to Qin et al.[73]. (b) The metabolic versatility of AOM. Nitrososphaera gargensis hydrolyzes cyanate into ammonium and carbon dioxide via cyanase (Case). Cyanate-degrading NOB support cyanase-negative AOM by supplying ammonium from cyanate[74,75]. (c) Candidatus Nitrospira inopinata assimilates guanidine via guanidinase (Gase), yielding ammonium and urea[76]. Uase, urease.
-
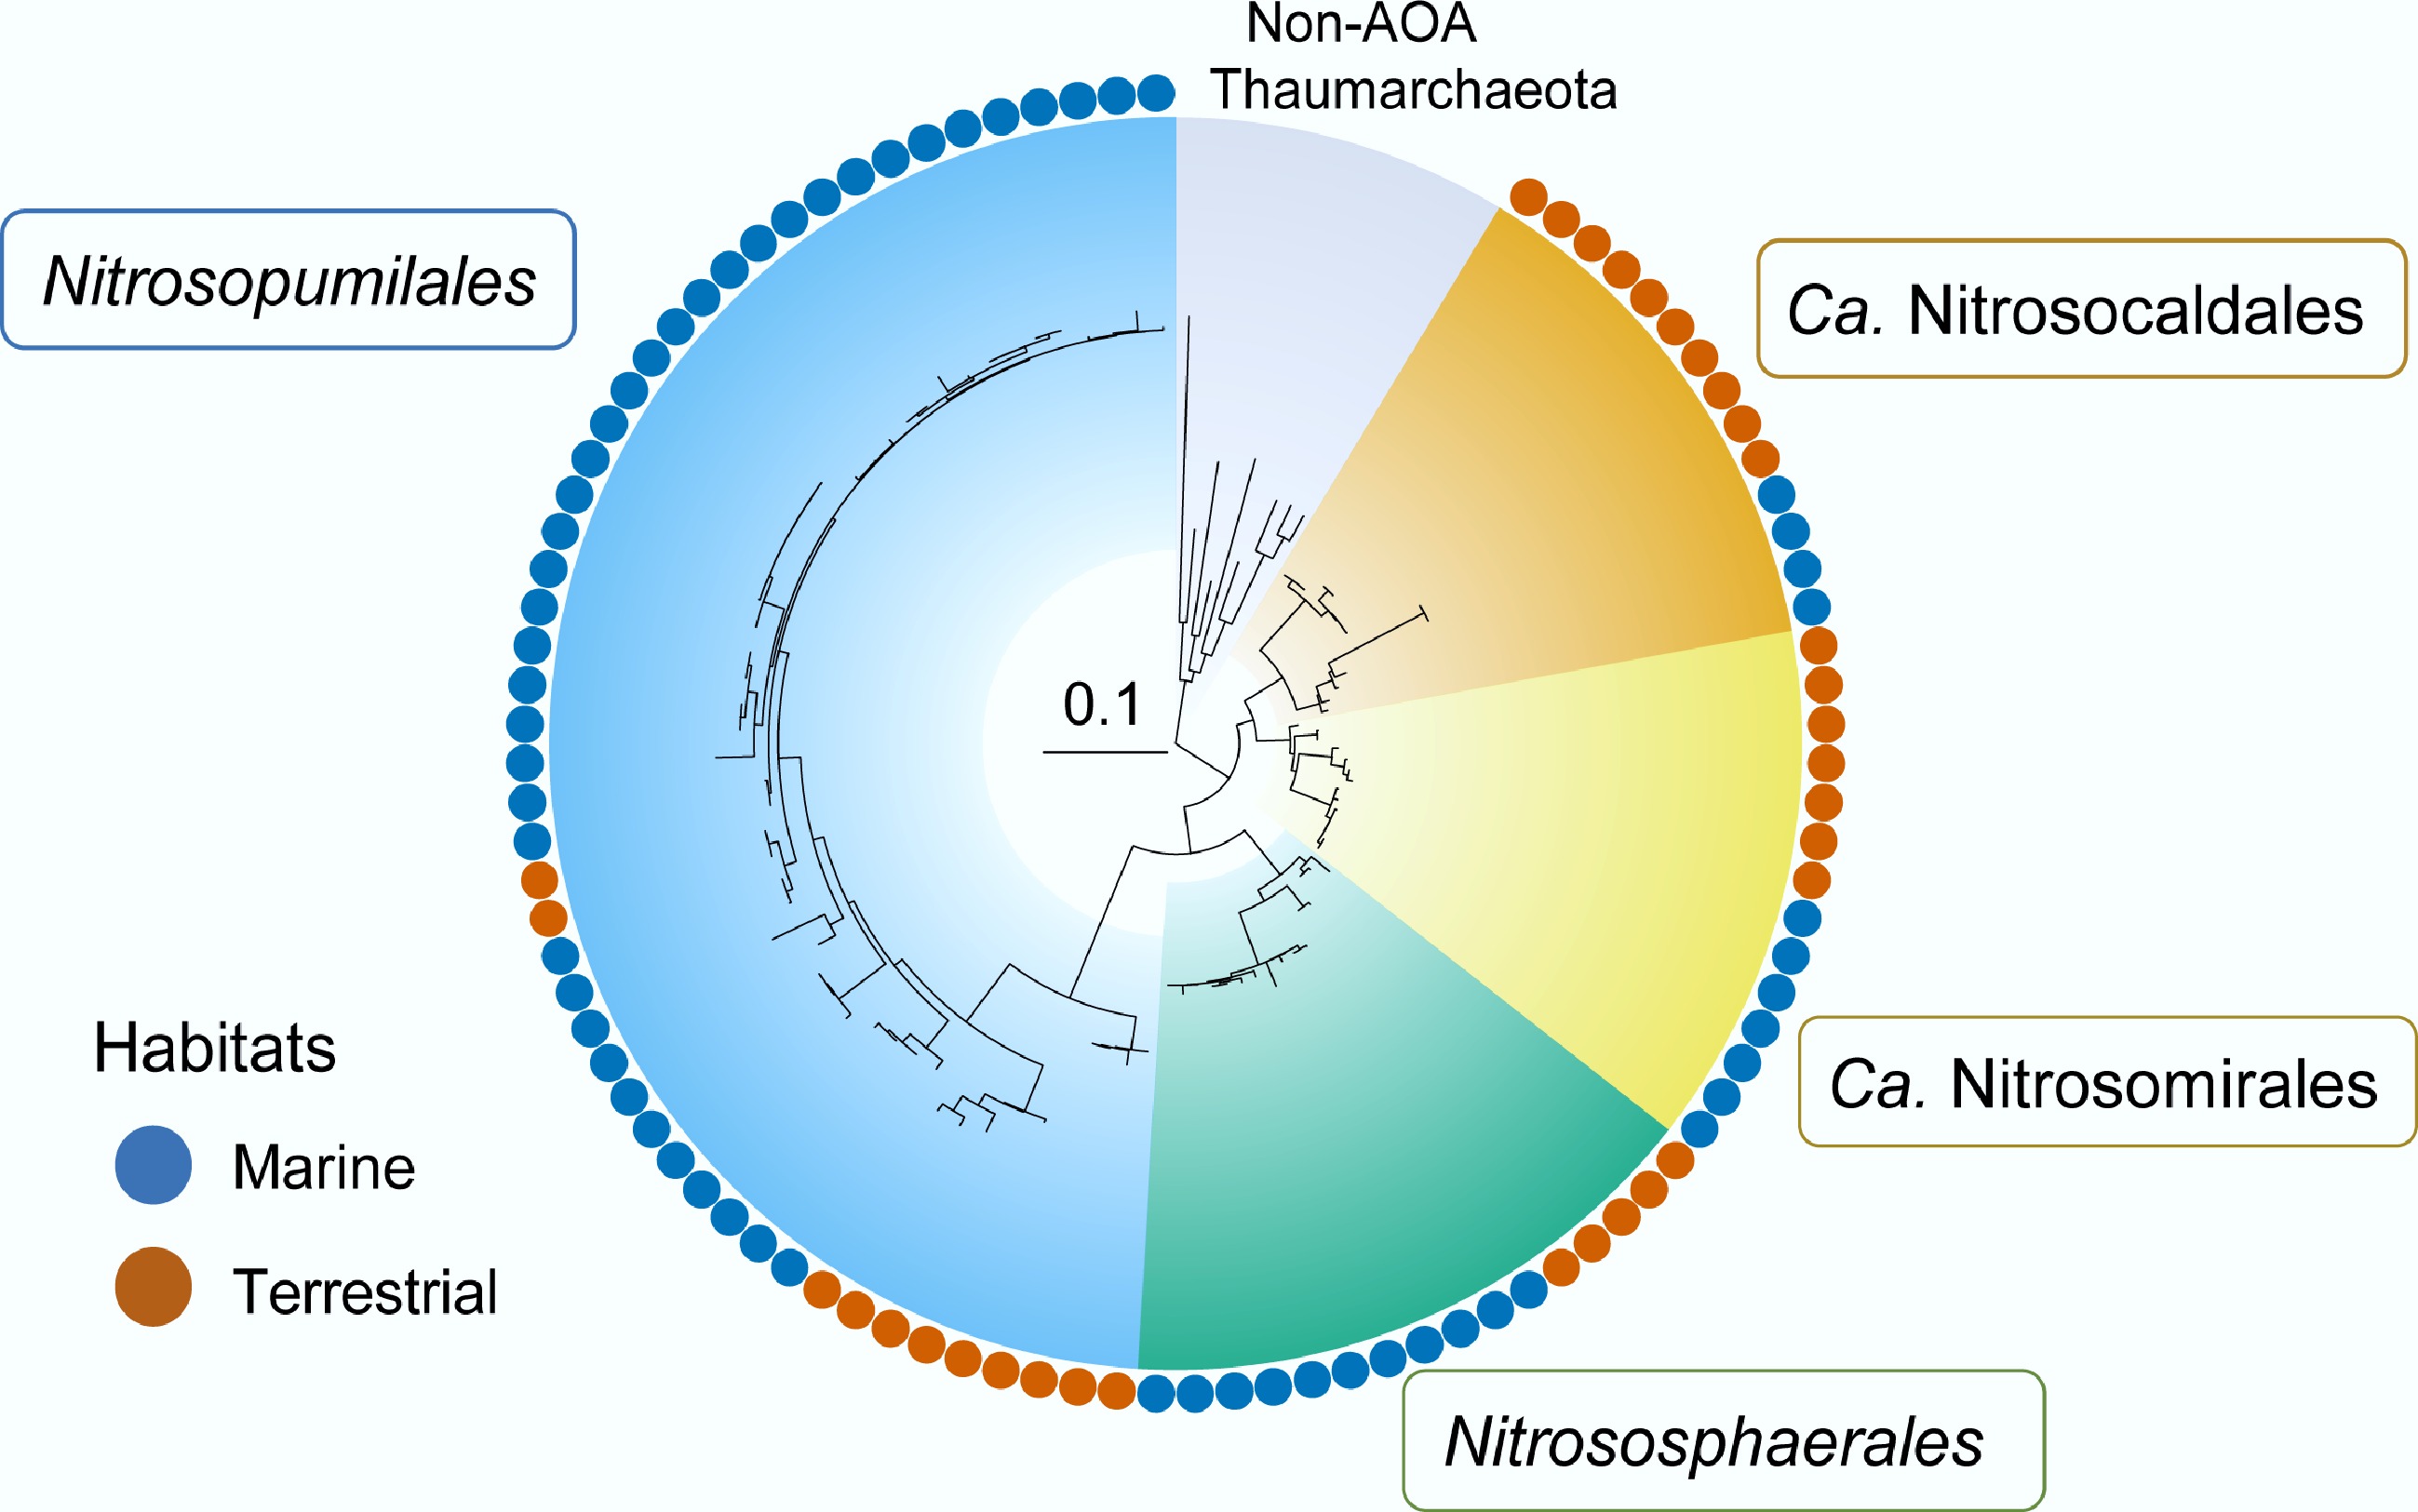
Figure 4.
Four major ammonia-oxidizing-Thaumarchaeota lineages with global distribution across terrestrial and marine ecosystems: Nitrosopumilales, Nitrososphaerales, Ca. Nitrosocaldales, and Ca. Nitrosotaliales. Redrawn with reference to Zheng et al.[80].
-
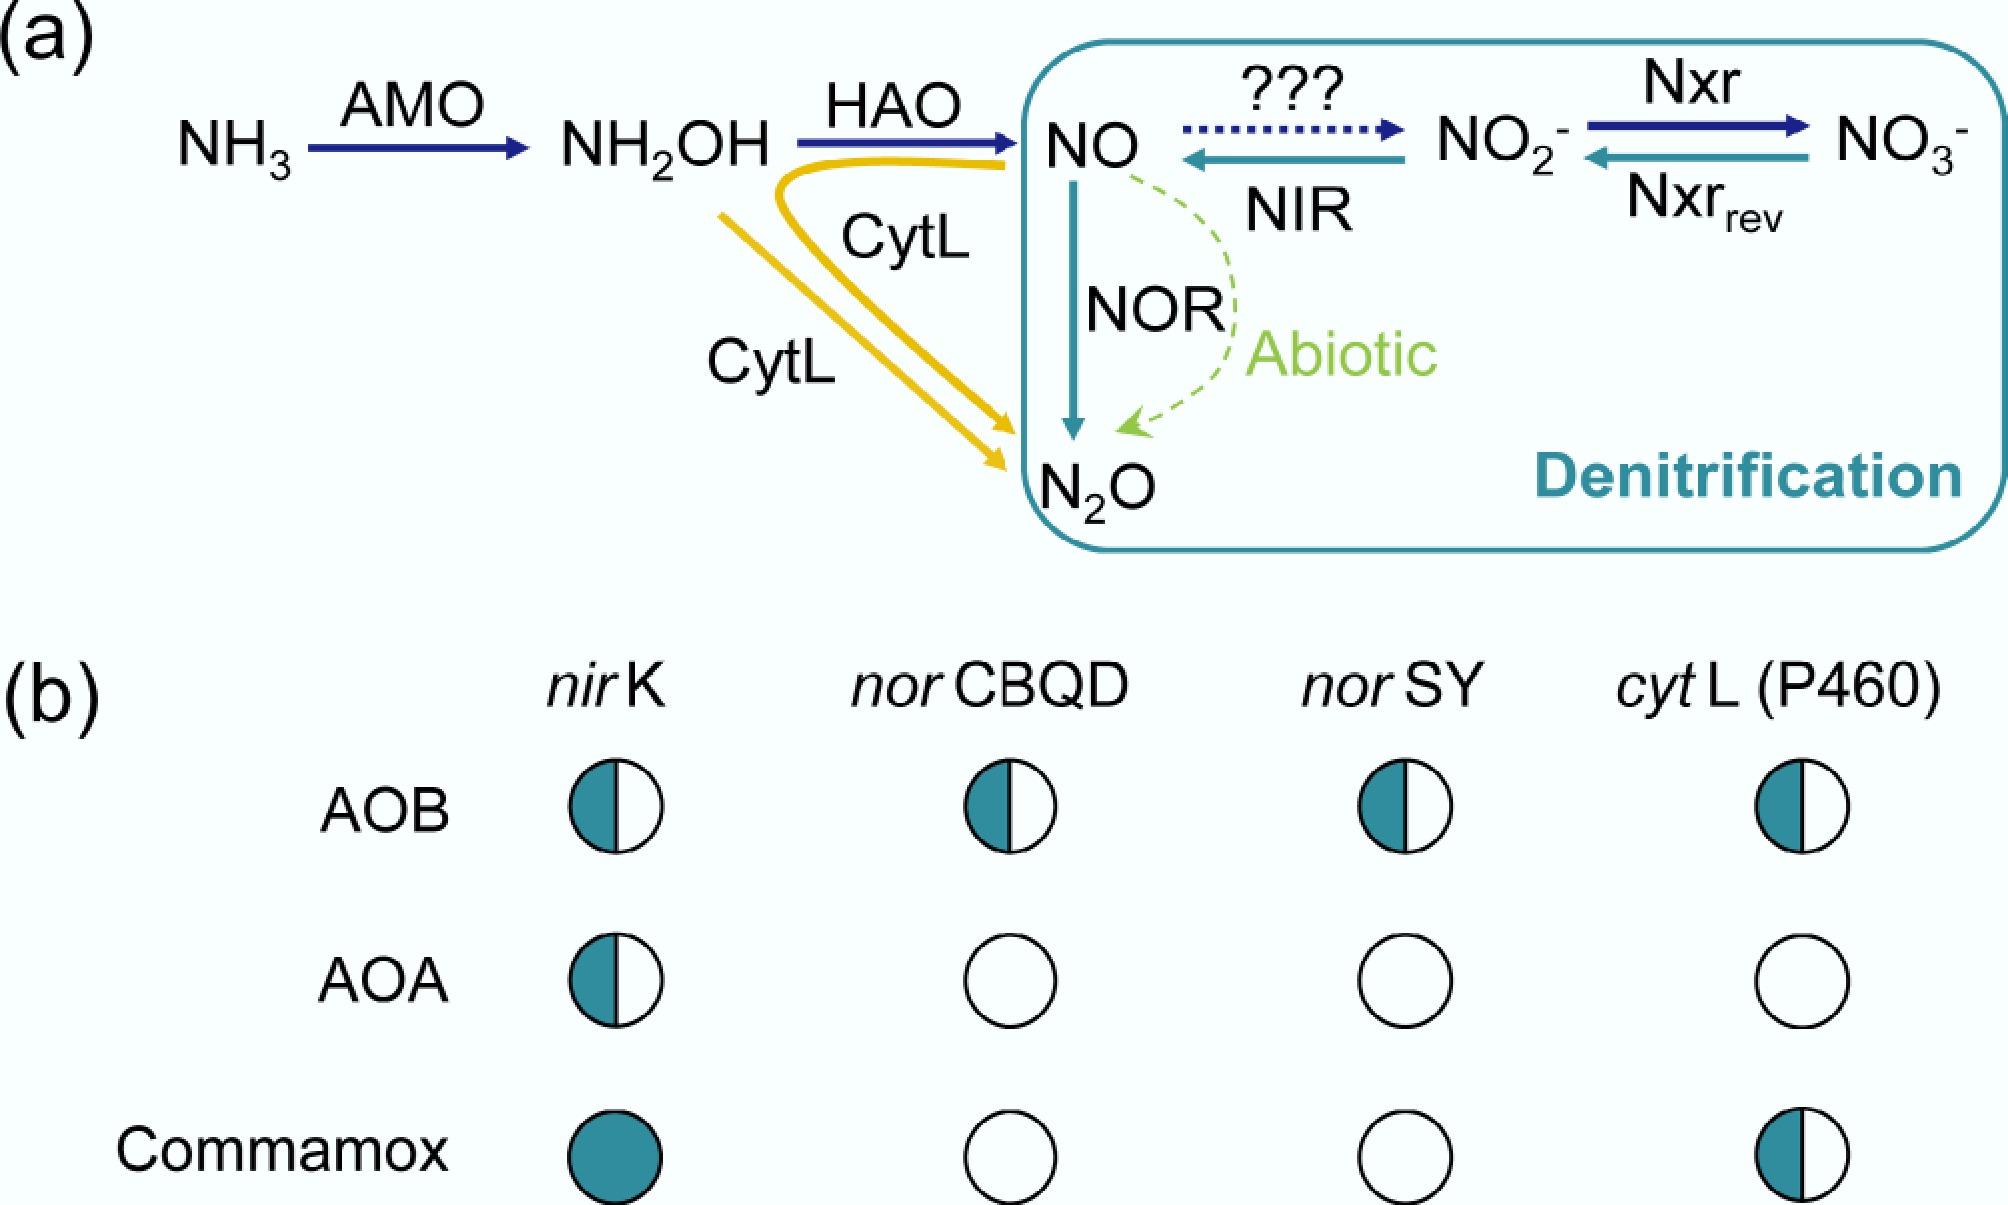
Figure 5.
(a) Metabolic pathways of N2O emission in nitrifiers. In AOB, NO reduction to N2O is mediated by cytochrome c nitric oxide reductase (NOR)-norCBQD or norSY, while comammox and all genome-sequenced AOA lack NOR[89,90]. AMO, monooxygenase; HAO, hydroxylamine oxidoreductase; NIR, nitrite reductases; NXR, nitrite oxidoreductase; cytL, cytochrome P460. The green arrow indicates abiotic pathways. '???' indicates that the specific enzyme has not yet been identified. (b) The presence of the gene involved in N2O production in AOMs, '
$\bigcirc $ 
-
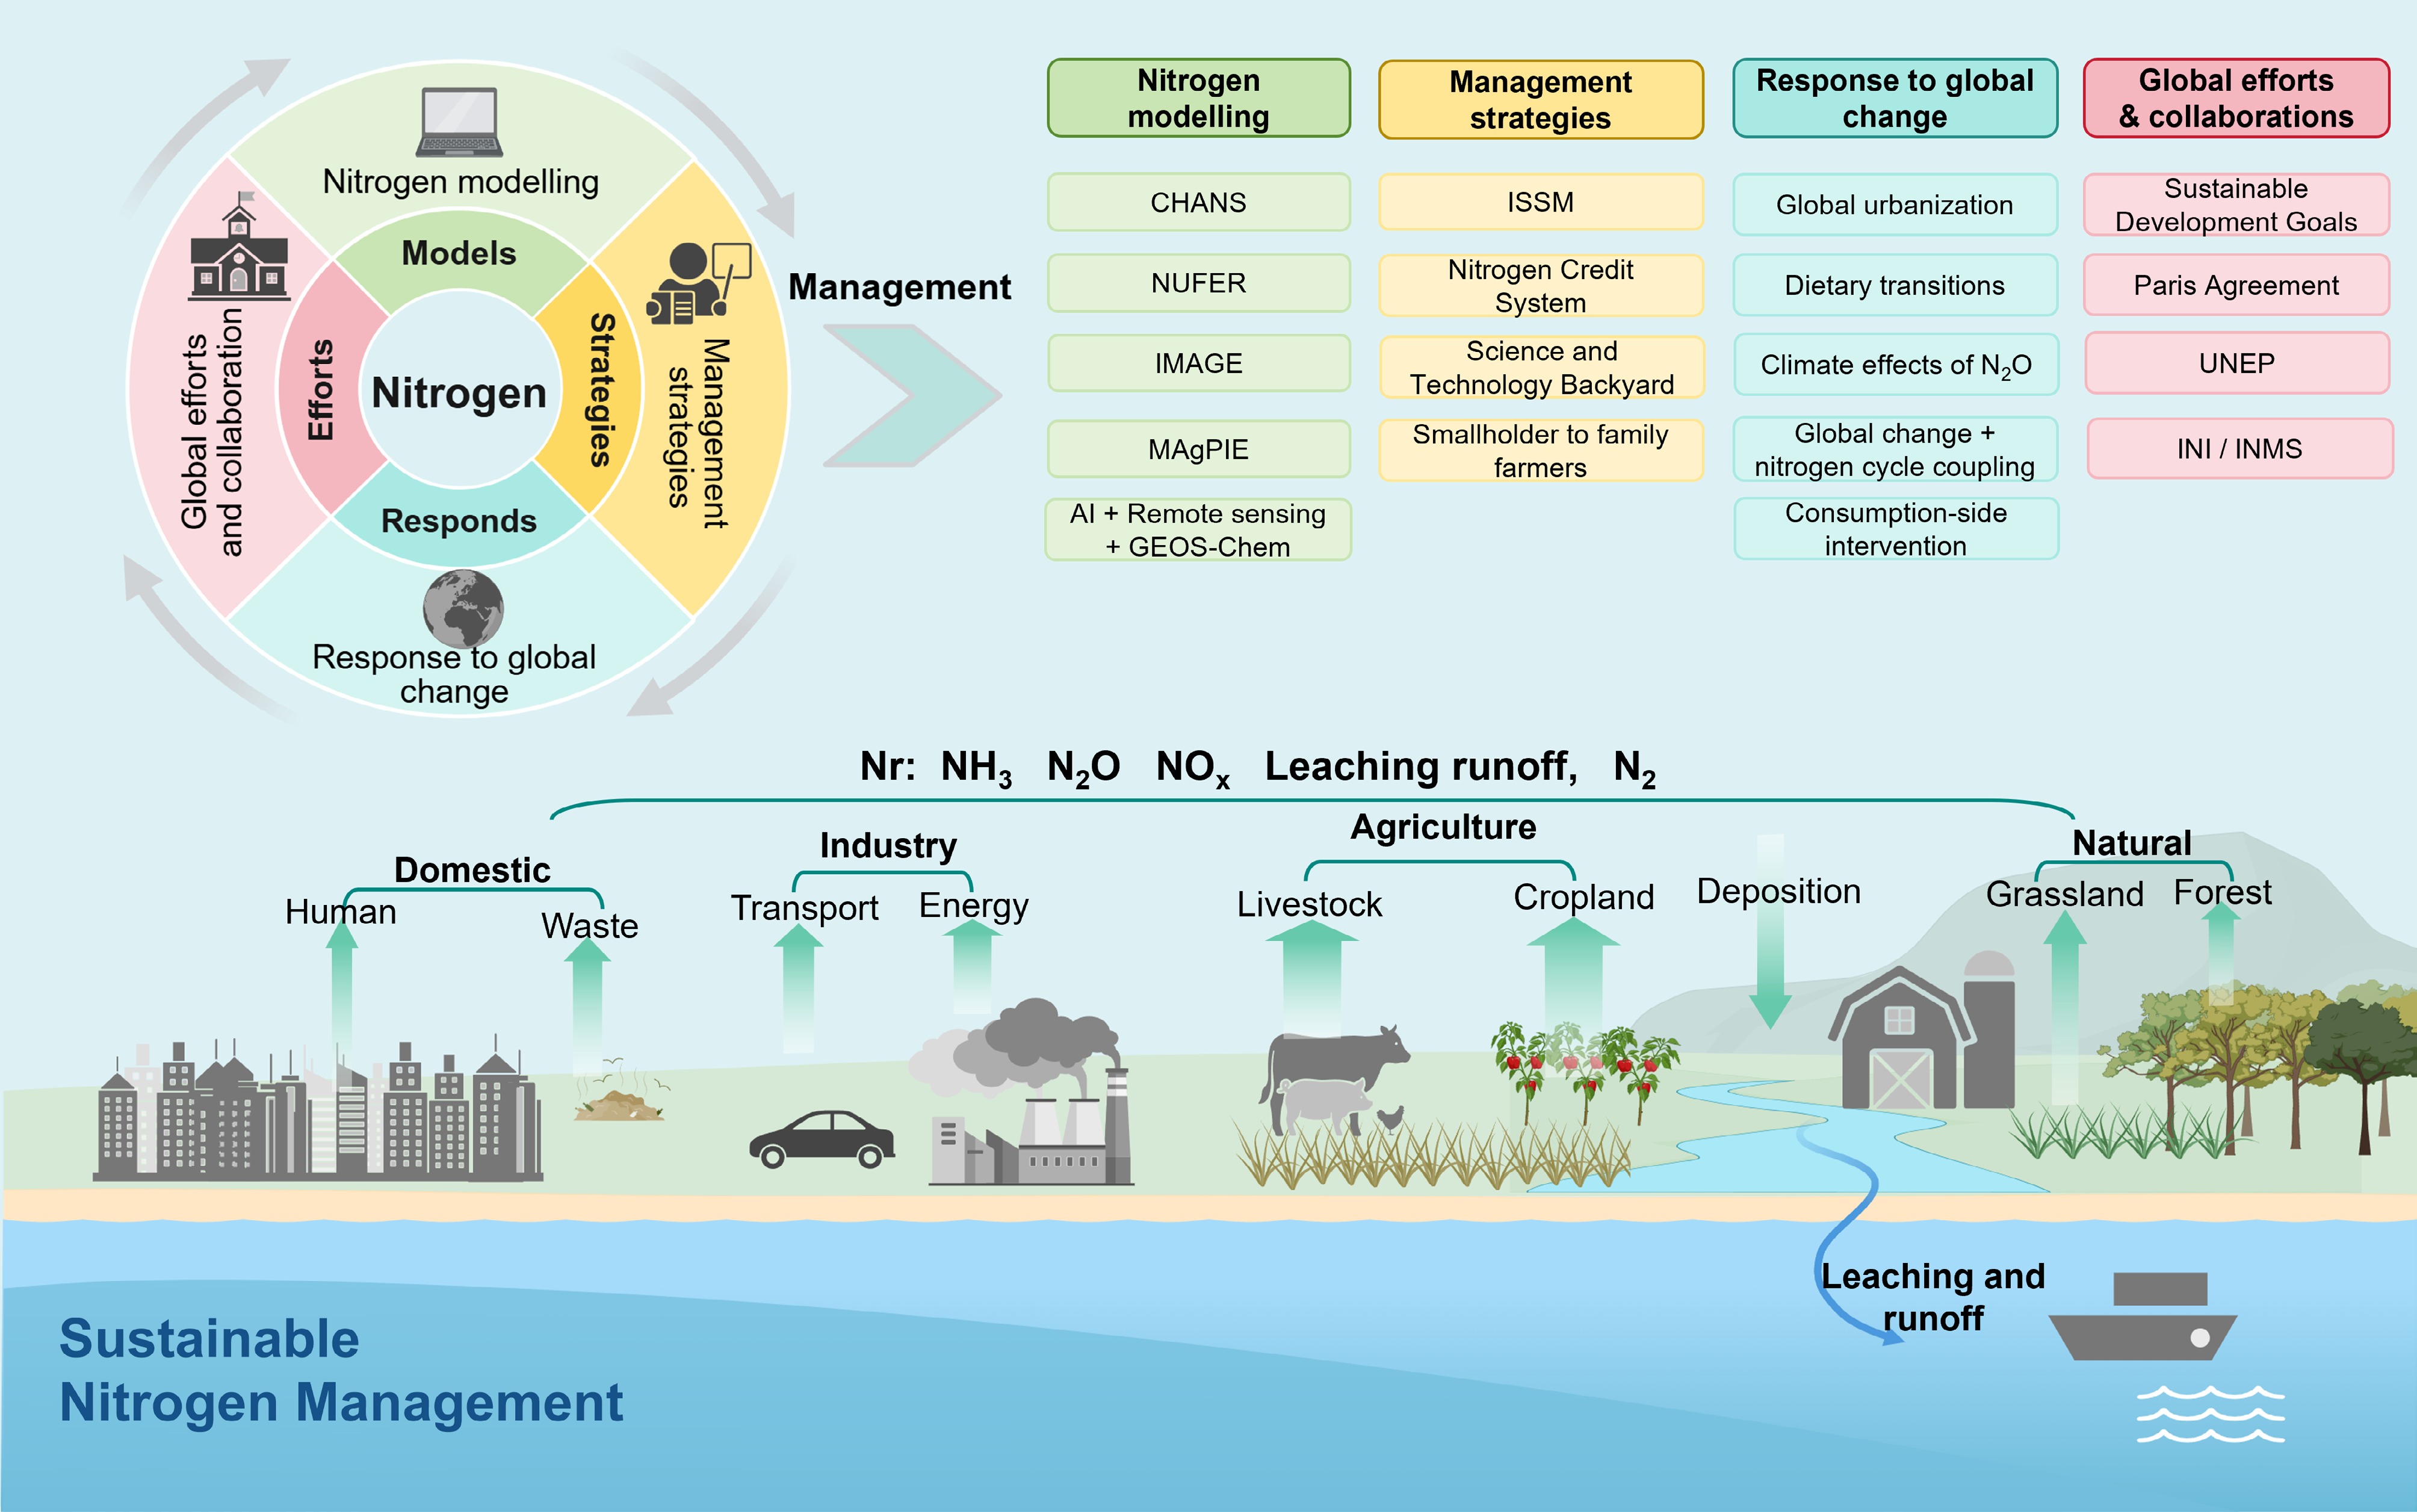
Figure 6.
Integrated framework for sustainable nitrogen management. This illustration depicts the global N cycle, highlighting both anthropogenic impacts and strategic interventions for sustainable management. CHANS: Coupled Human and Natural Systems model; NUFER: Nutrient Flows, Environment, and Resource Use; IMAGE: Integrated Model to Assess the Global Environment; MAgPIE: Model of Agricultural Production and its Impact on the Environment; ISSM: Integrated Soil–Crop System Management; UNEP: United Nations Environment Programme; INI: International Nitrogen Initiative; INMS: International Nitrogen Management System.
Figures
(6)
Tables
(0)