-
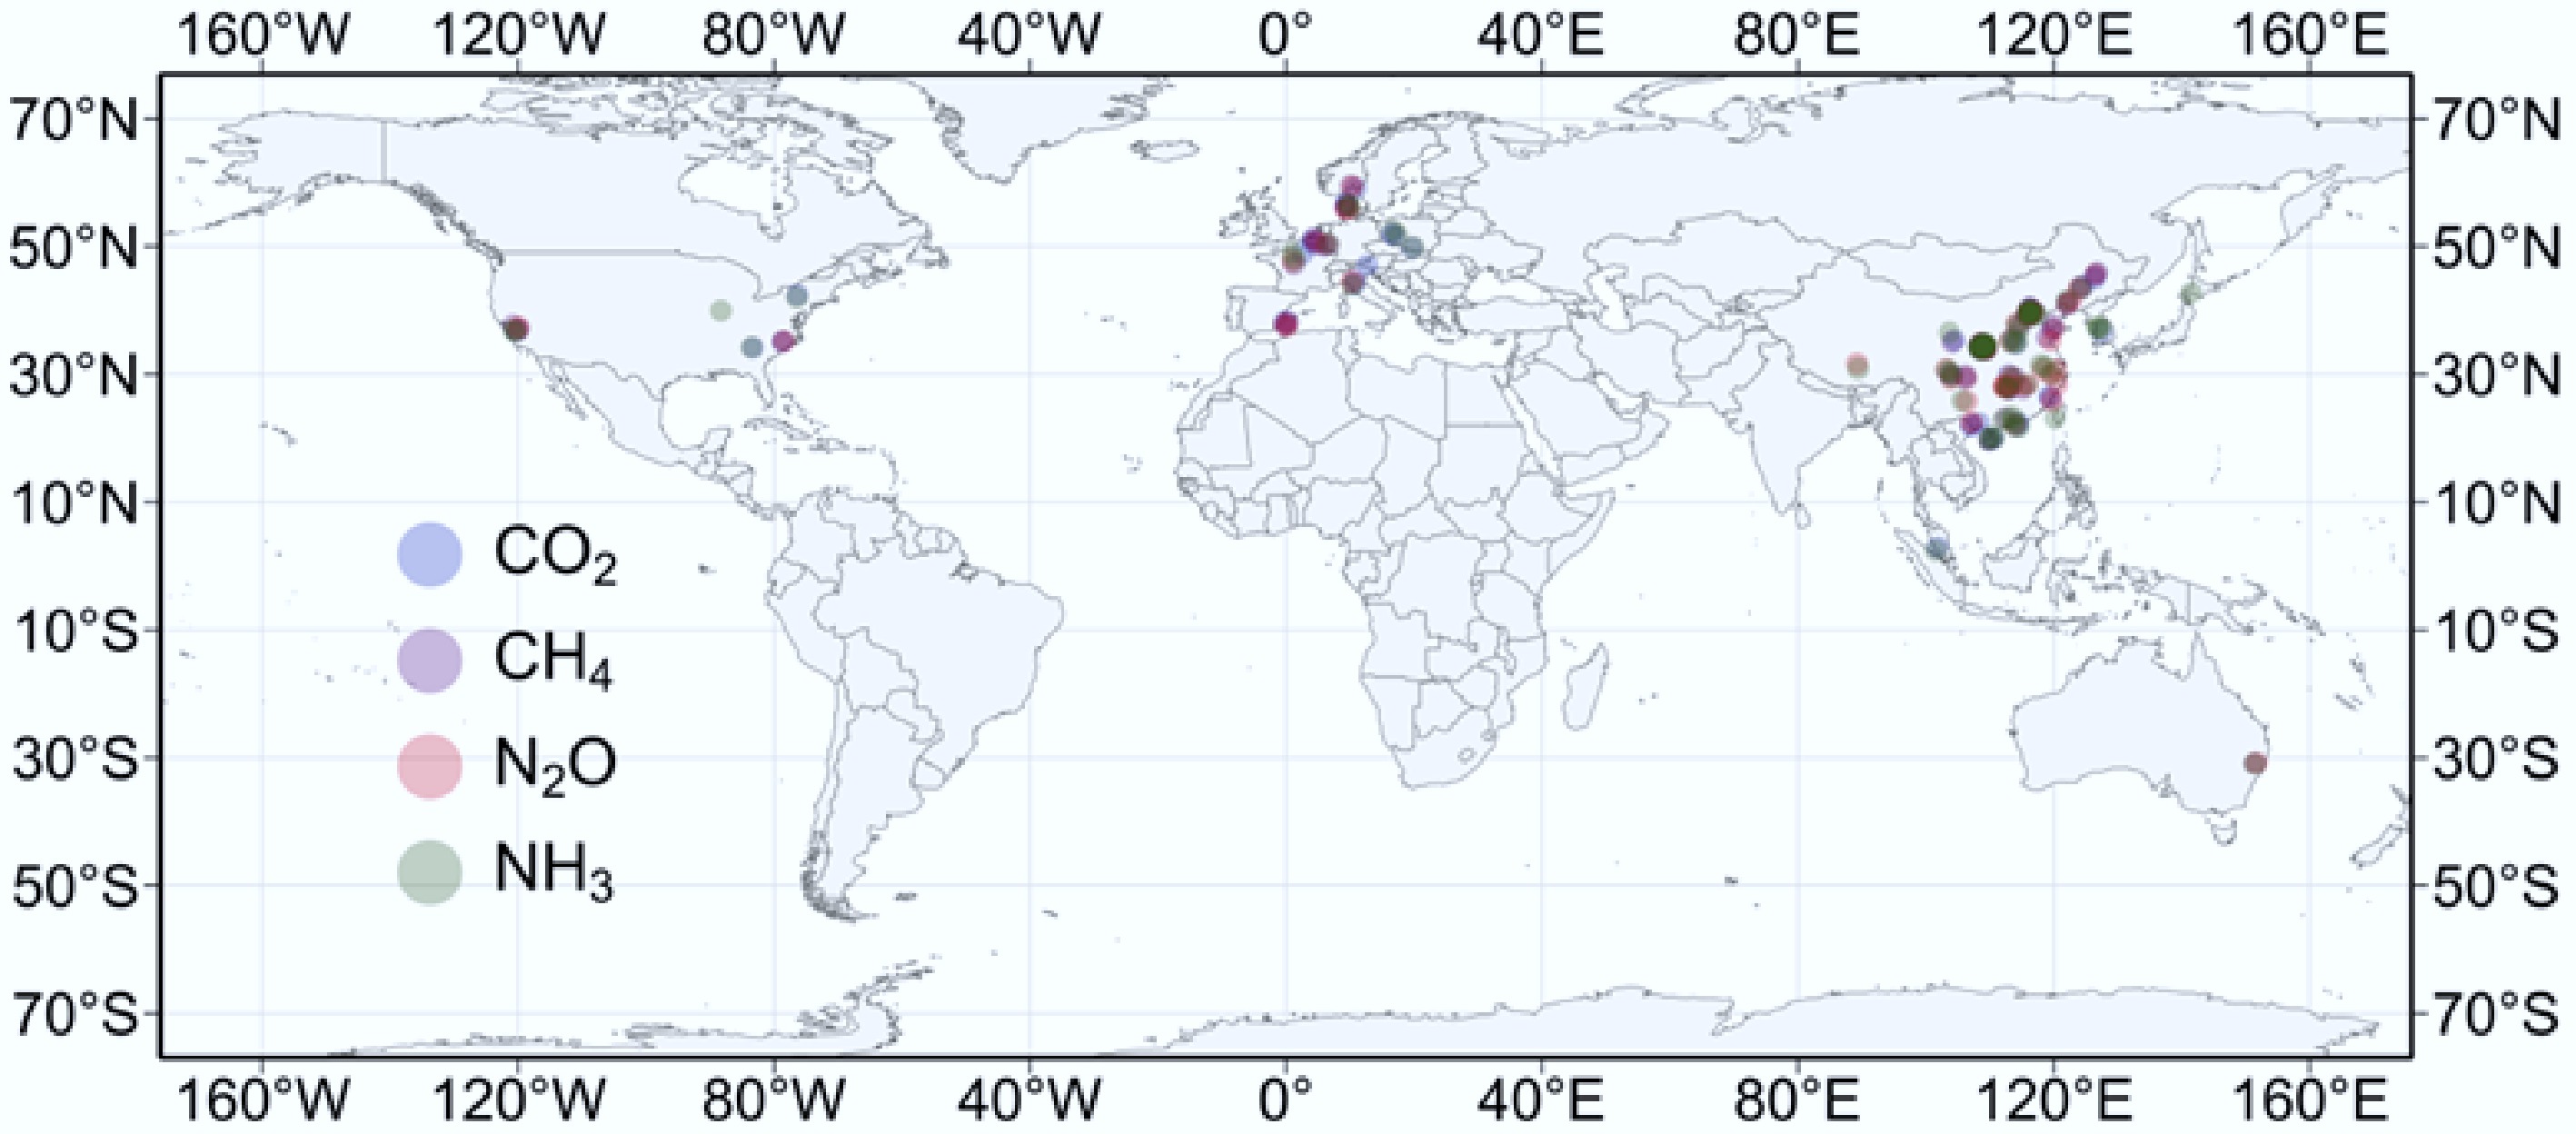
Figure 1.
Global distribution of qualifying studies.
-
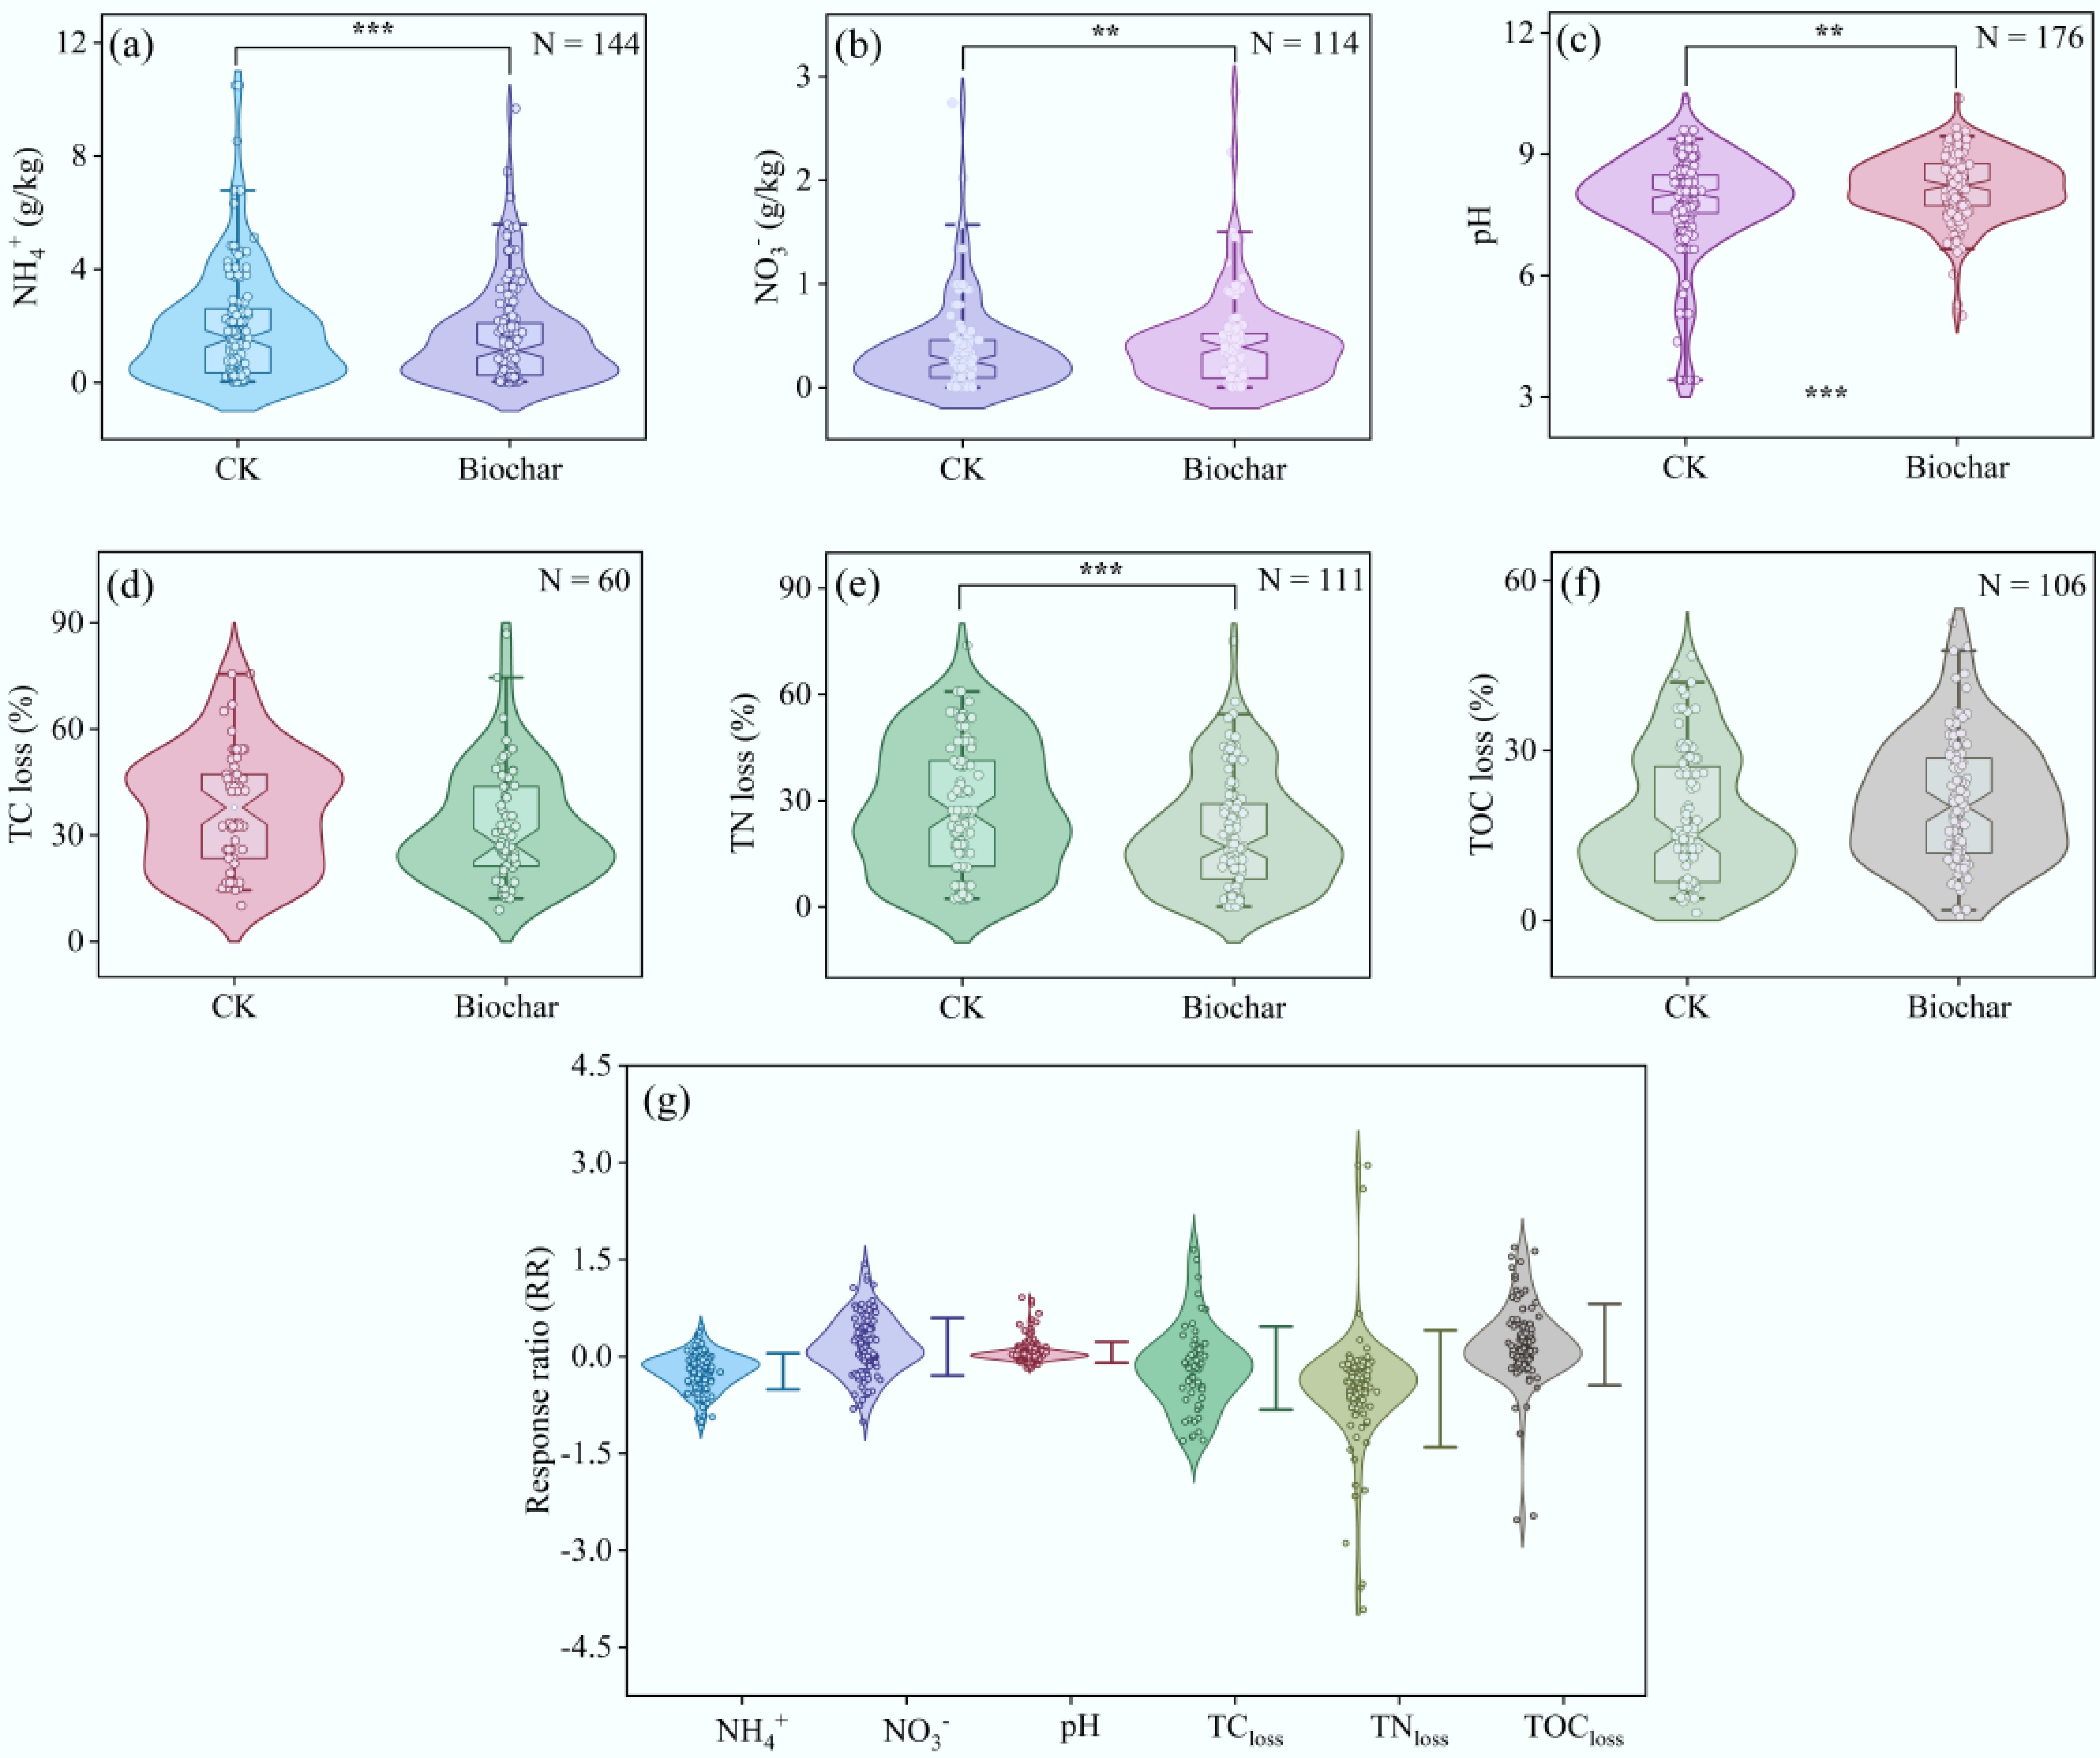
Figure 2.
Violin plots of NH4+, NO3−, pH, TC loss, TN loss, and TOC loss in the control (CK) and biochar-amended composting systems (a)–(g). N denotes the number of paired samples, with asterisks indicating the statistical significance levels (* p < 0.05, ** p < 0.01, and *** p < 0.001). The response ratios (RR) of NH4+, NO3−, pH, TC loss, TN loss, and TOC loss are shown in (f). The color-coded point markers on the right represent the mean RR values, with the error bars indicating standard deviations.
-
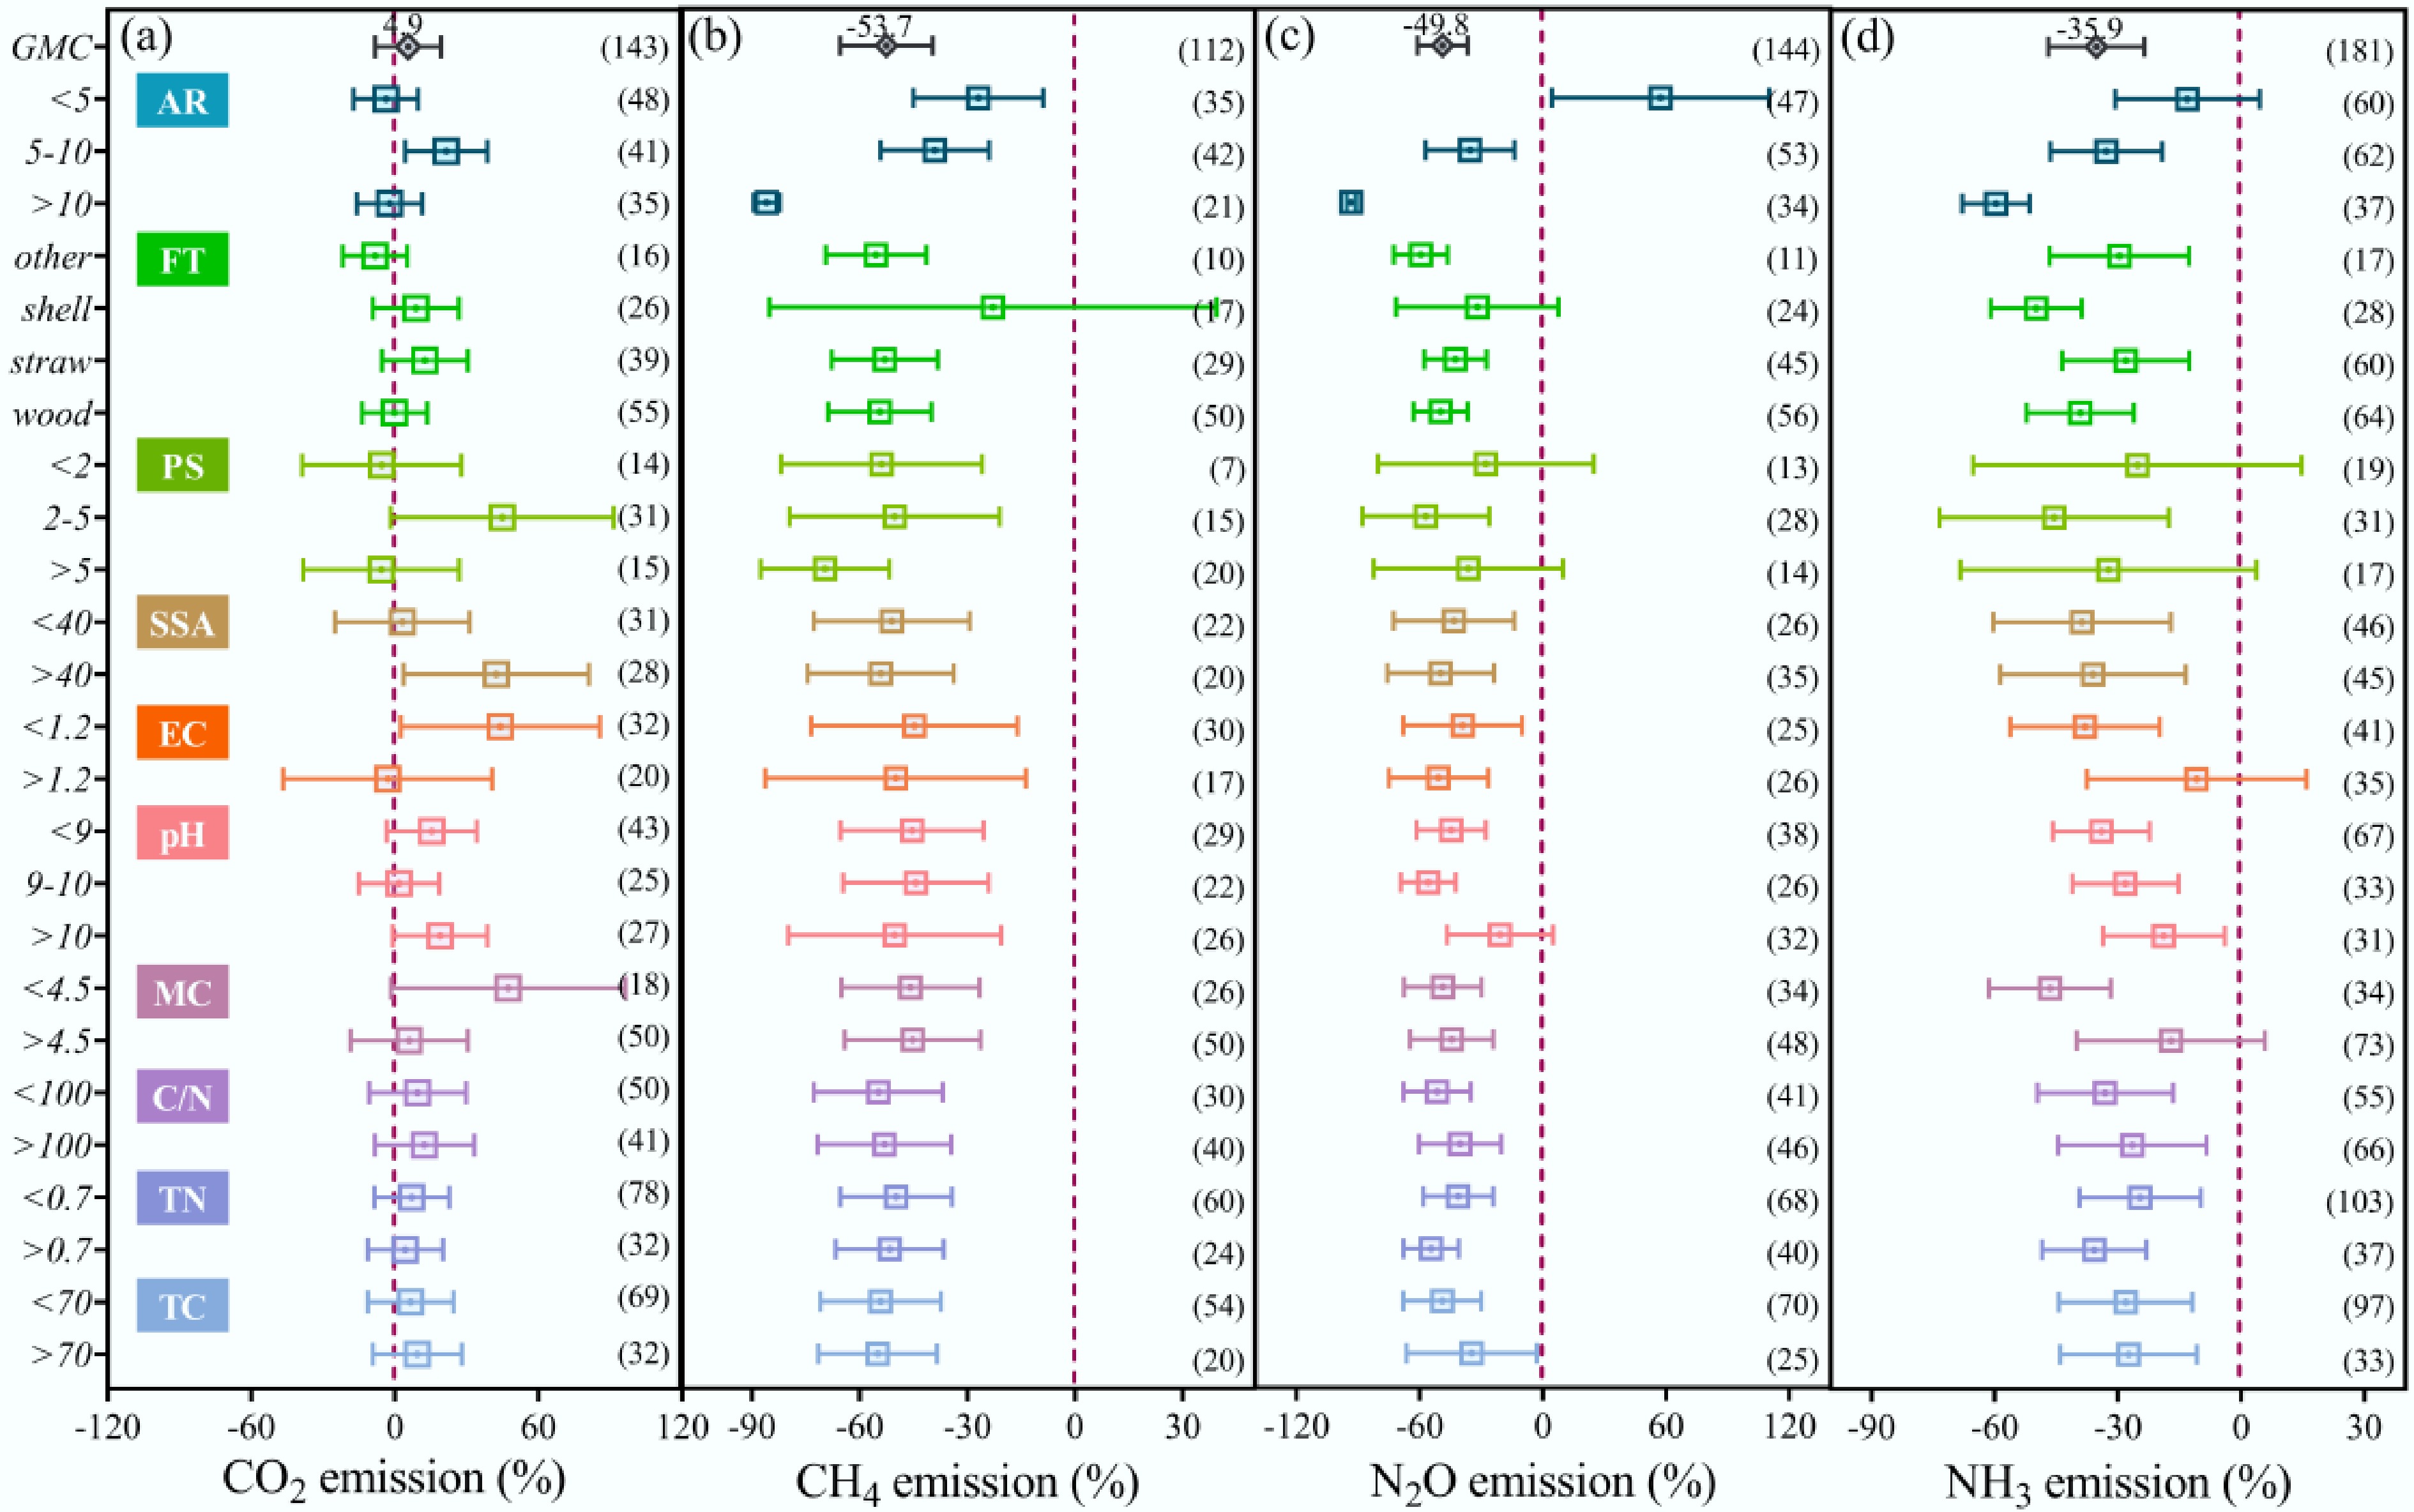
Figure 3.
Effects of biochar properties on CO2, CH4, N2O, and NH3 emissions during composting (a)–(d). The center of the small square represents the average value, and the error line represents the ± 95% CIs. The numbers in brackets represent sample sizes. TC, total carbon; TN, total nitrogen; C/N, carbon : nitrogen ratio; MC, moisture content; EC, electric conductivity; SSA, specific surface area; PS, particle size; FT, feedstock type; AR, application rate.
-
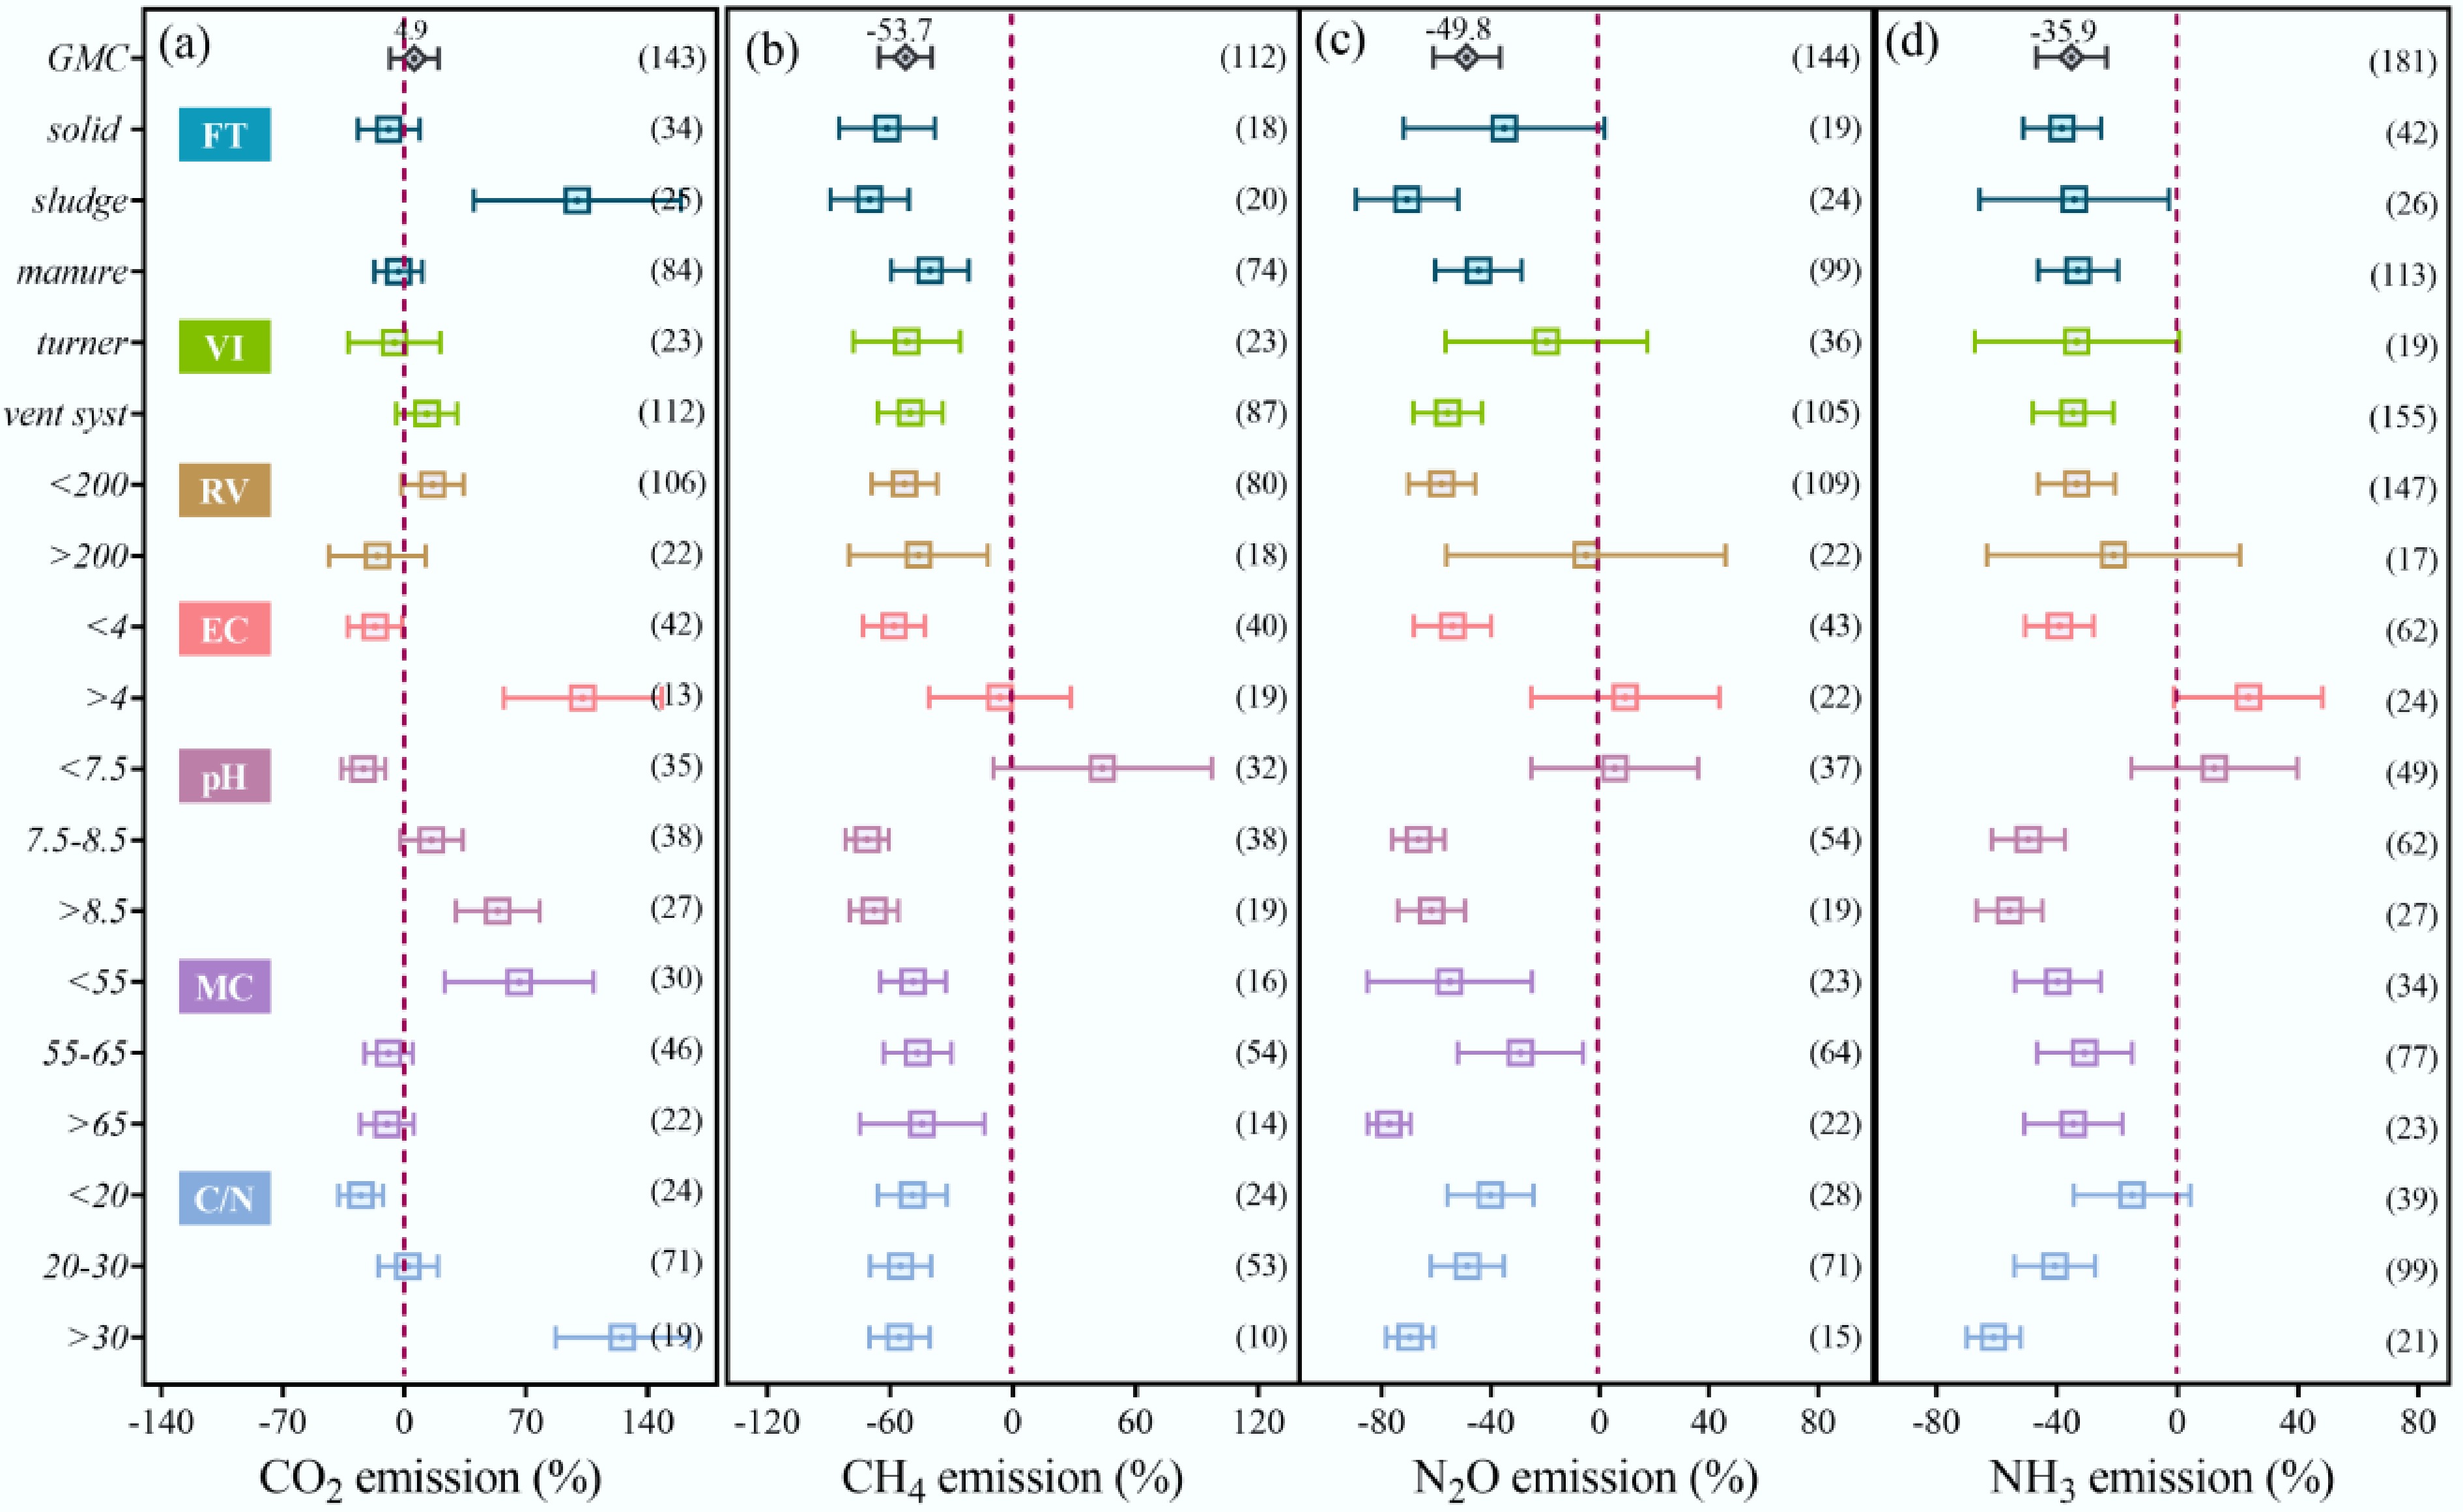
Figure 4.
Effects of composting conditions on CO2, CH4, N2O, and NH3 emissions during composting (a)–(d). The center of the small square represents the average value, and the error line represents the ± 95% CIs. The numbers in brackets represent the sample sizes. C/N, carbon : nitrogen ratio; MC, moisture content; pH, initial pH; EC, electric conductivity; RV, reactor volume; VI, ventilation instrument; FT, feedstock type.
-
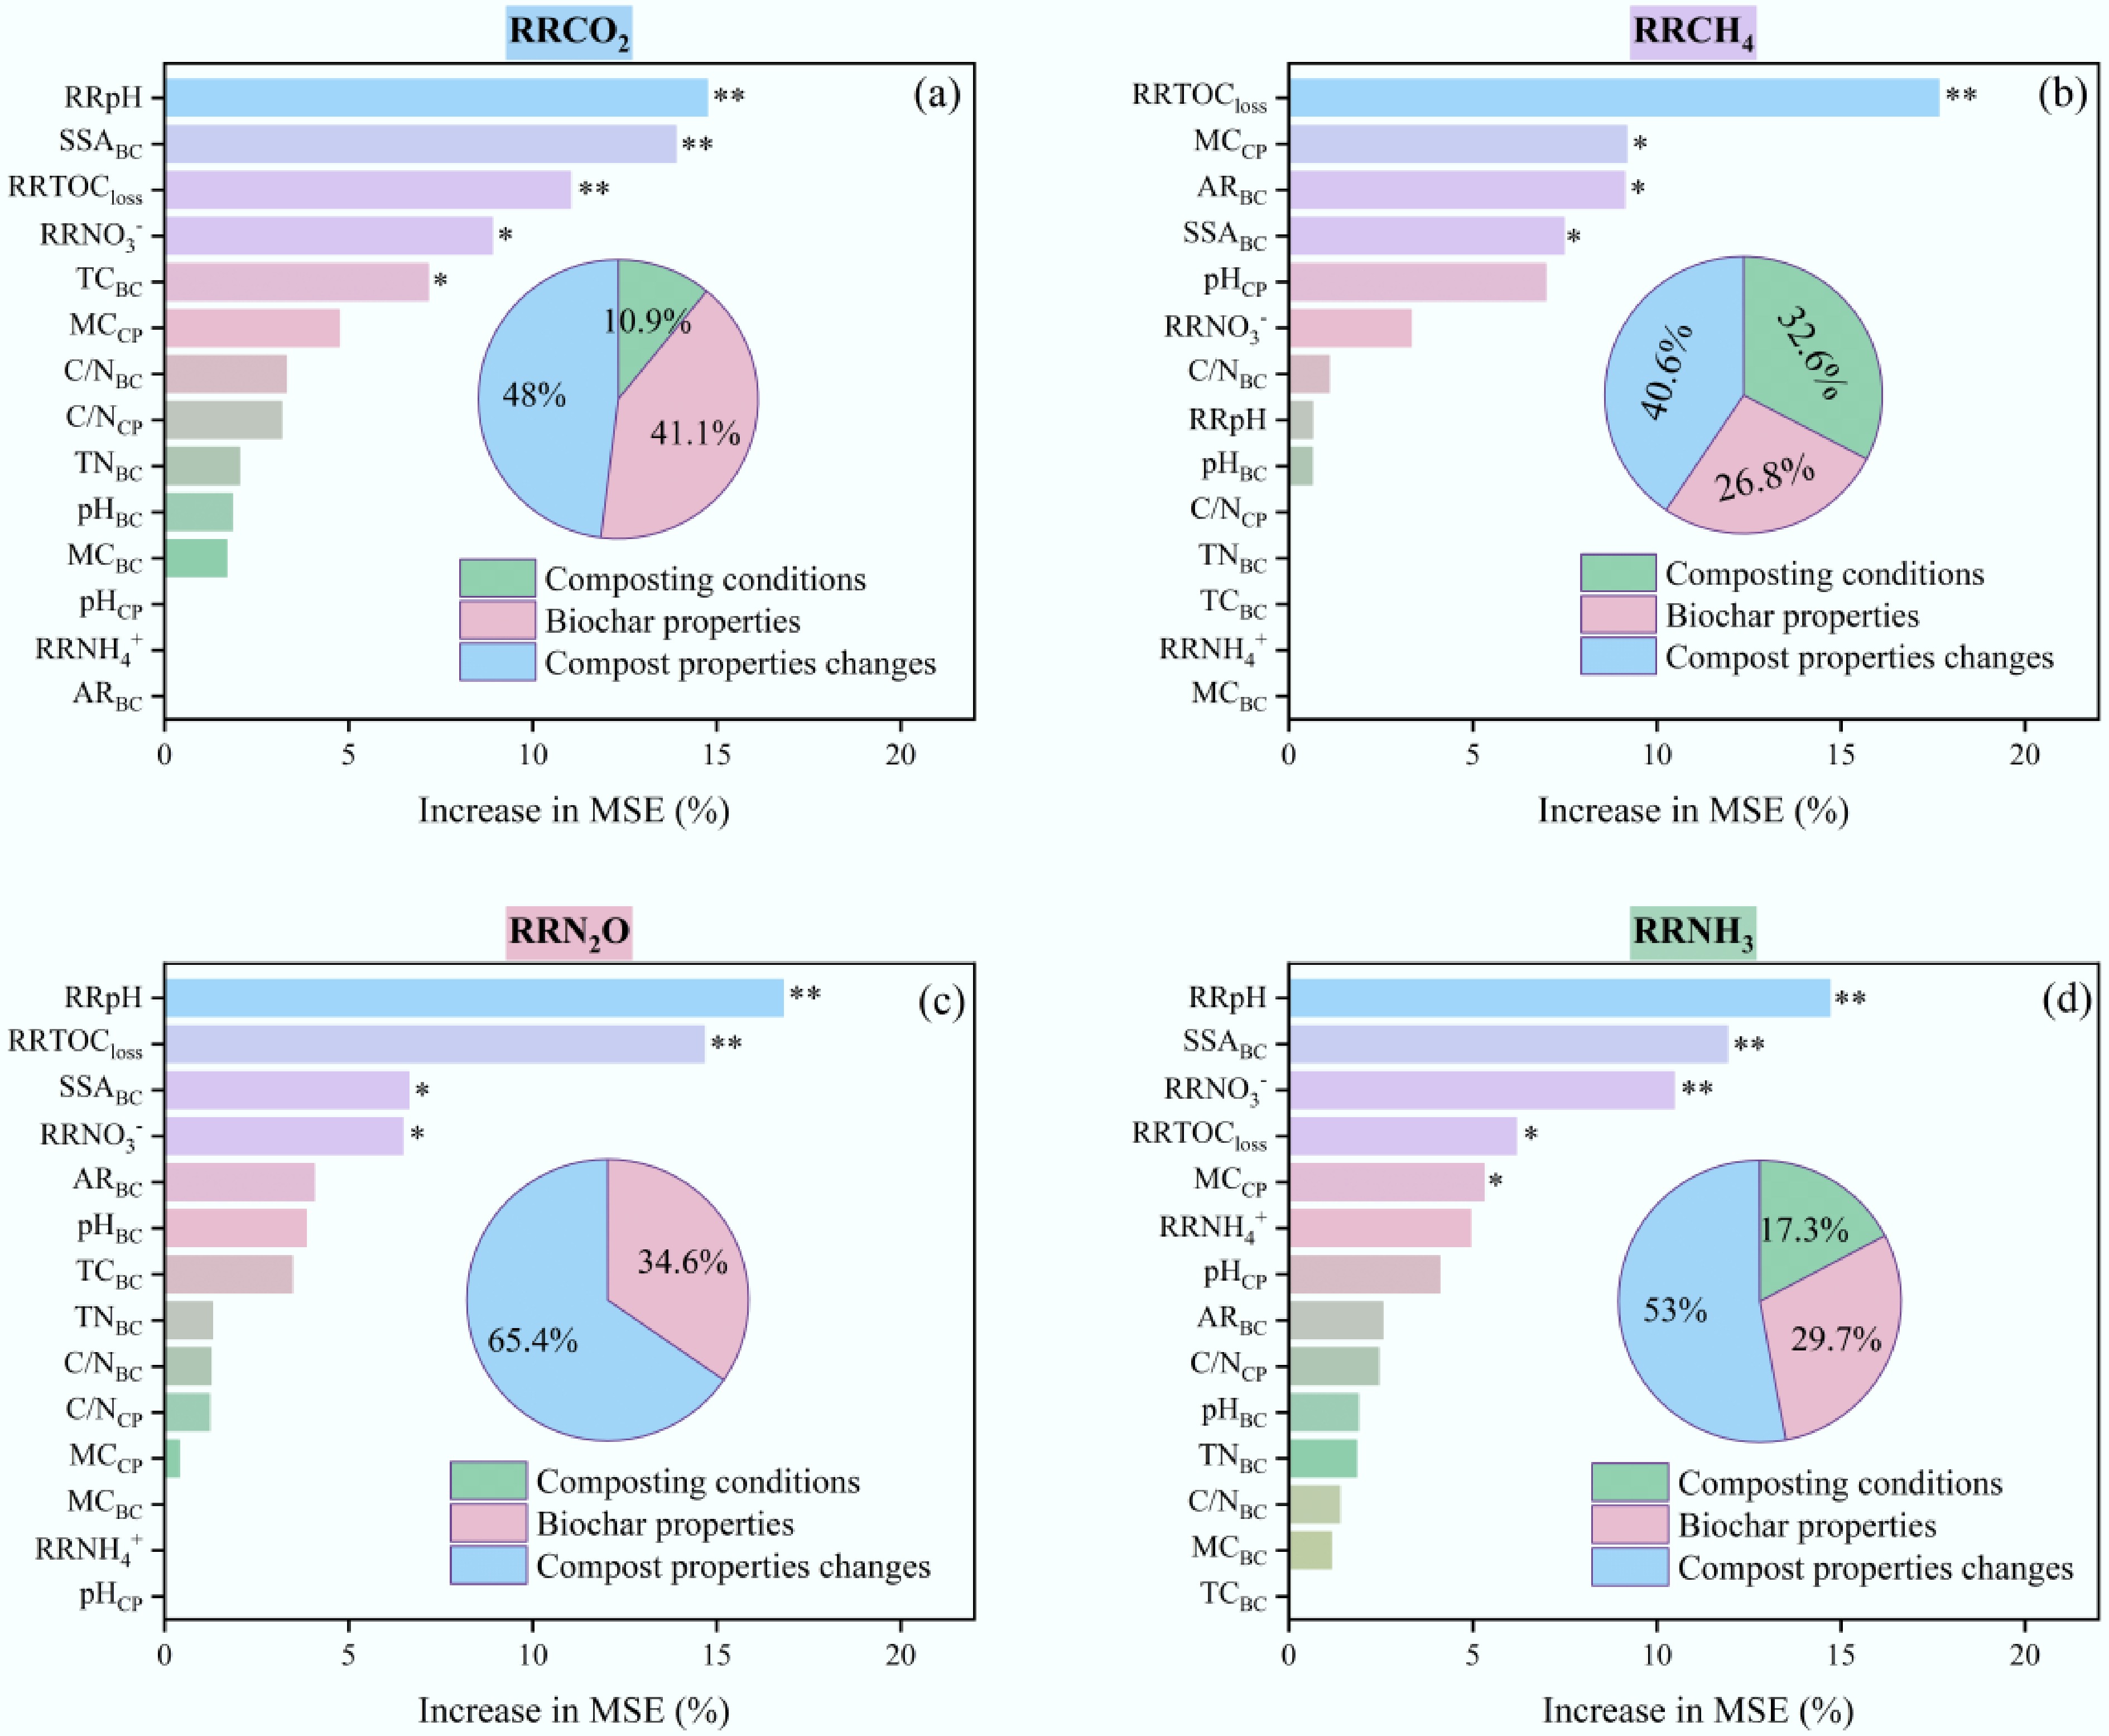
Figure 5.
Random Forest models used to rank the predictive variables of response ratios (RR) of CO2, CH4, N2O, and NH3 emissions (a)–(d). The percentage increase in the mean squared error (%IncMSE) represents the importance of the main predictors; negative values of %IncMSE are not shown. Statistical significance levels are denoted by asterisks (* p < 0.05 and ** p < 0.01). The predictive variables are categorized into three classes, namely composting conditions, biochar properties, and changes in compost properties. Composting conditions include the carbon : nitrogen ratio (C/N), moisture content (MC), and initial pH. Biochar properties include total carbon (TC), total nitrogen (TN), C/N, MC, pH, specific surface area (SSA), and application rate (AR). Changes in compost properties include the RRs of NH4+, NO3− final pH, and TOC loss.
-
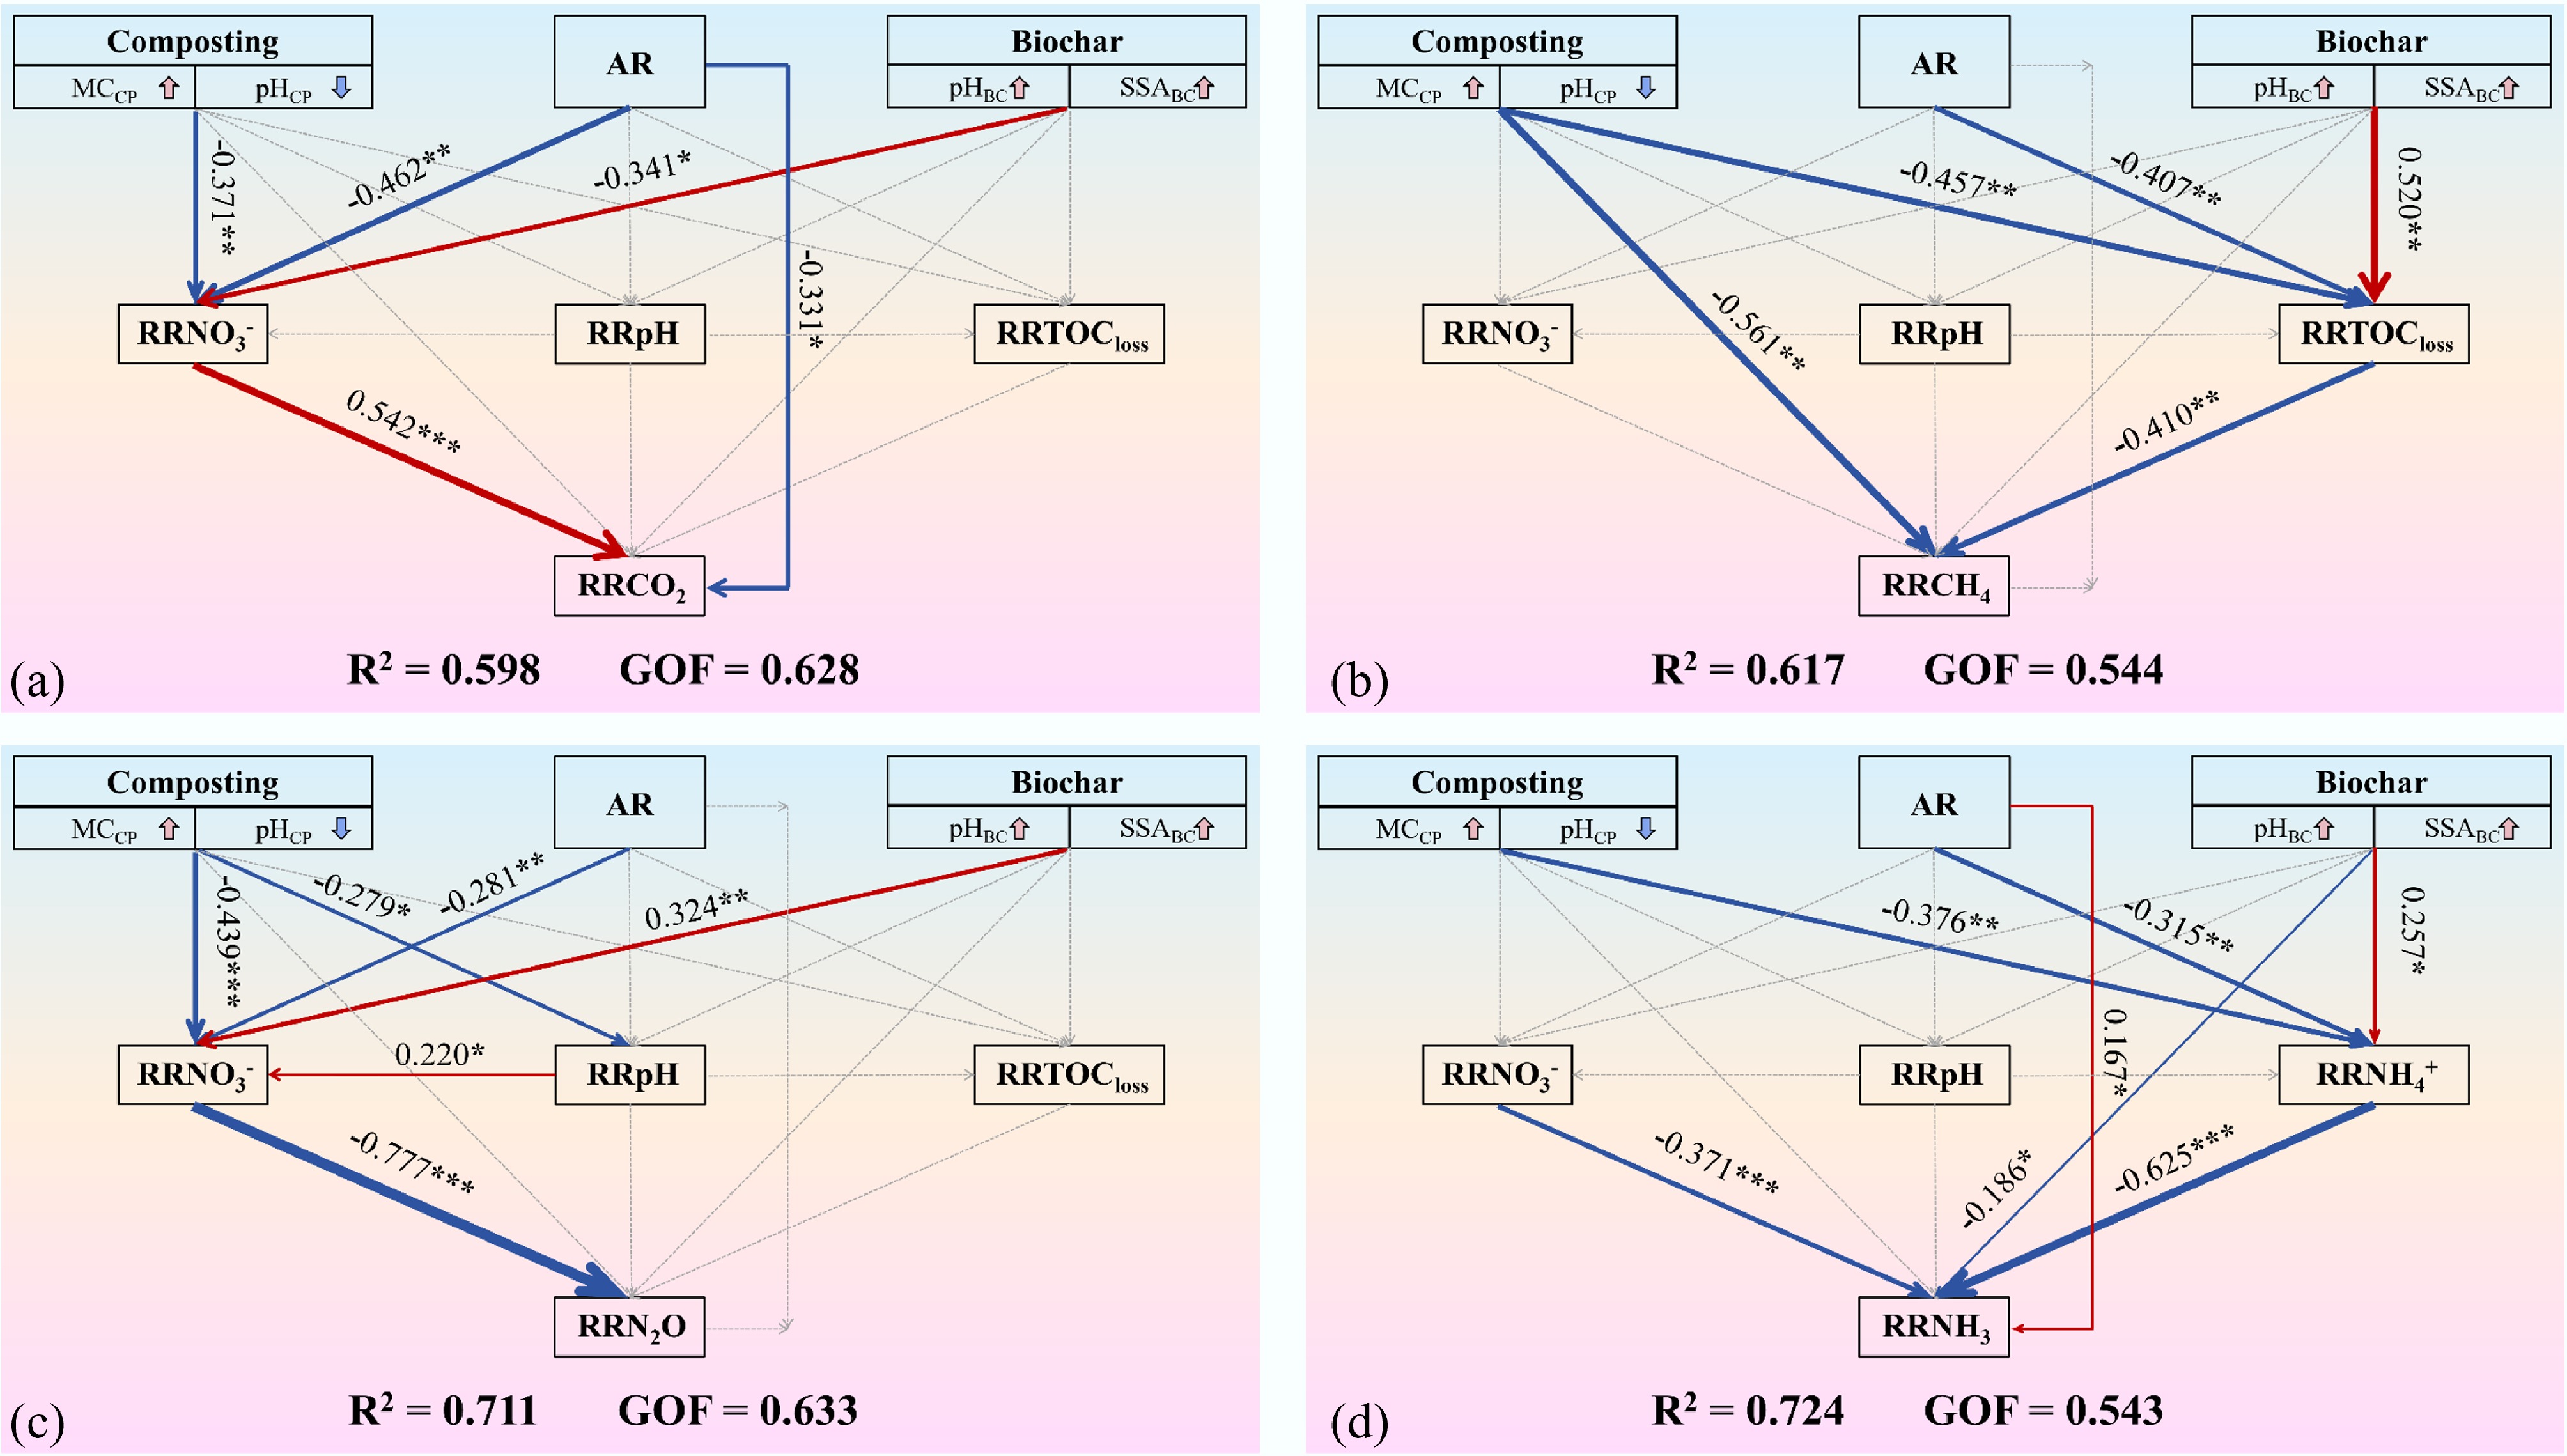
Figure 6.
Partial least squares path models (PLS-PMs) demonstrating how composting conditions (MCCP, moisture content of compost; pHCP, initial pH of compost), the application rate of biochar (AR), biochar properties (pHBC, pH of biochar; SSABC, specific surface area of biochar), and changes in compost properties (RRNO3−, response ratio of average NO3− contents; RRpH, response ratio of final pH; RRTOCloss, response ratio of total organic carbon loss; RRNH4+, response ratio of average NH4+ contents) influence the response ratios of (a) CO2, (b) CH4, (c) N2O, and (d) NH3 emissions. Pink and blue arrows refer to positive and negative relationships (* p < 0.05, ** p < 0.01, and *** p < 0.001). Dotted arrows denote insignificant correlations (p > 0.05). The numbers next to the arrows indicate the standardized path coefficient.
-
Category Variable Abbreviation Unit Biochar properties Total carbon TCBC g/kg Total nitrogen TNBC g/kg Carbon: nitrogen ratio C/NBC − Moisture content MCBC %, w/w pH pHBC − Electric conductivity ECBC mS/cm Specific surface area SSABC m2/g Particle size PSBC mm Feedstock type FTBC − Application rate AR %, w/w
(dry weight)Composting conditions Carbon:nitrogen ratio C/NCP − Moisture content MCCP %, w/w Initial pH pHCP − Electric conductivity ECCP mS/cm Reactor volume RVCP m3 Ventilation instrument VICP − Feedstock type FTCP − Compost properties Average ammonium NH4+ g/kg Average nitrate NO3- g/kg Final pH pH − Total carbon loss TCloss % Total nitrogen loss TNloss % Total organic carbon loss TOCloss % Table 1.
The abbreviations and units of all variables in biochar-amended composting systems
Figures
(6)
Tables
(1)