-
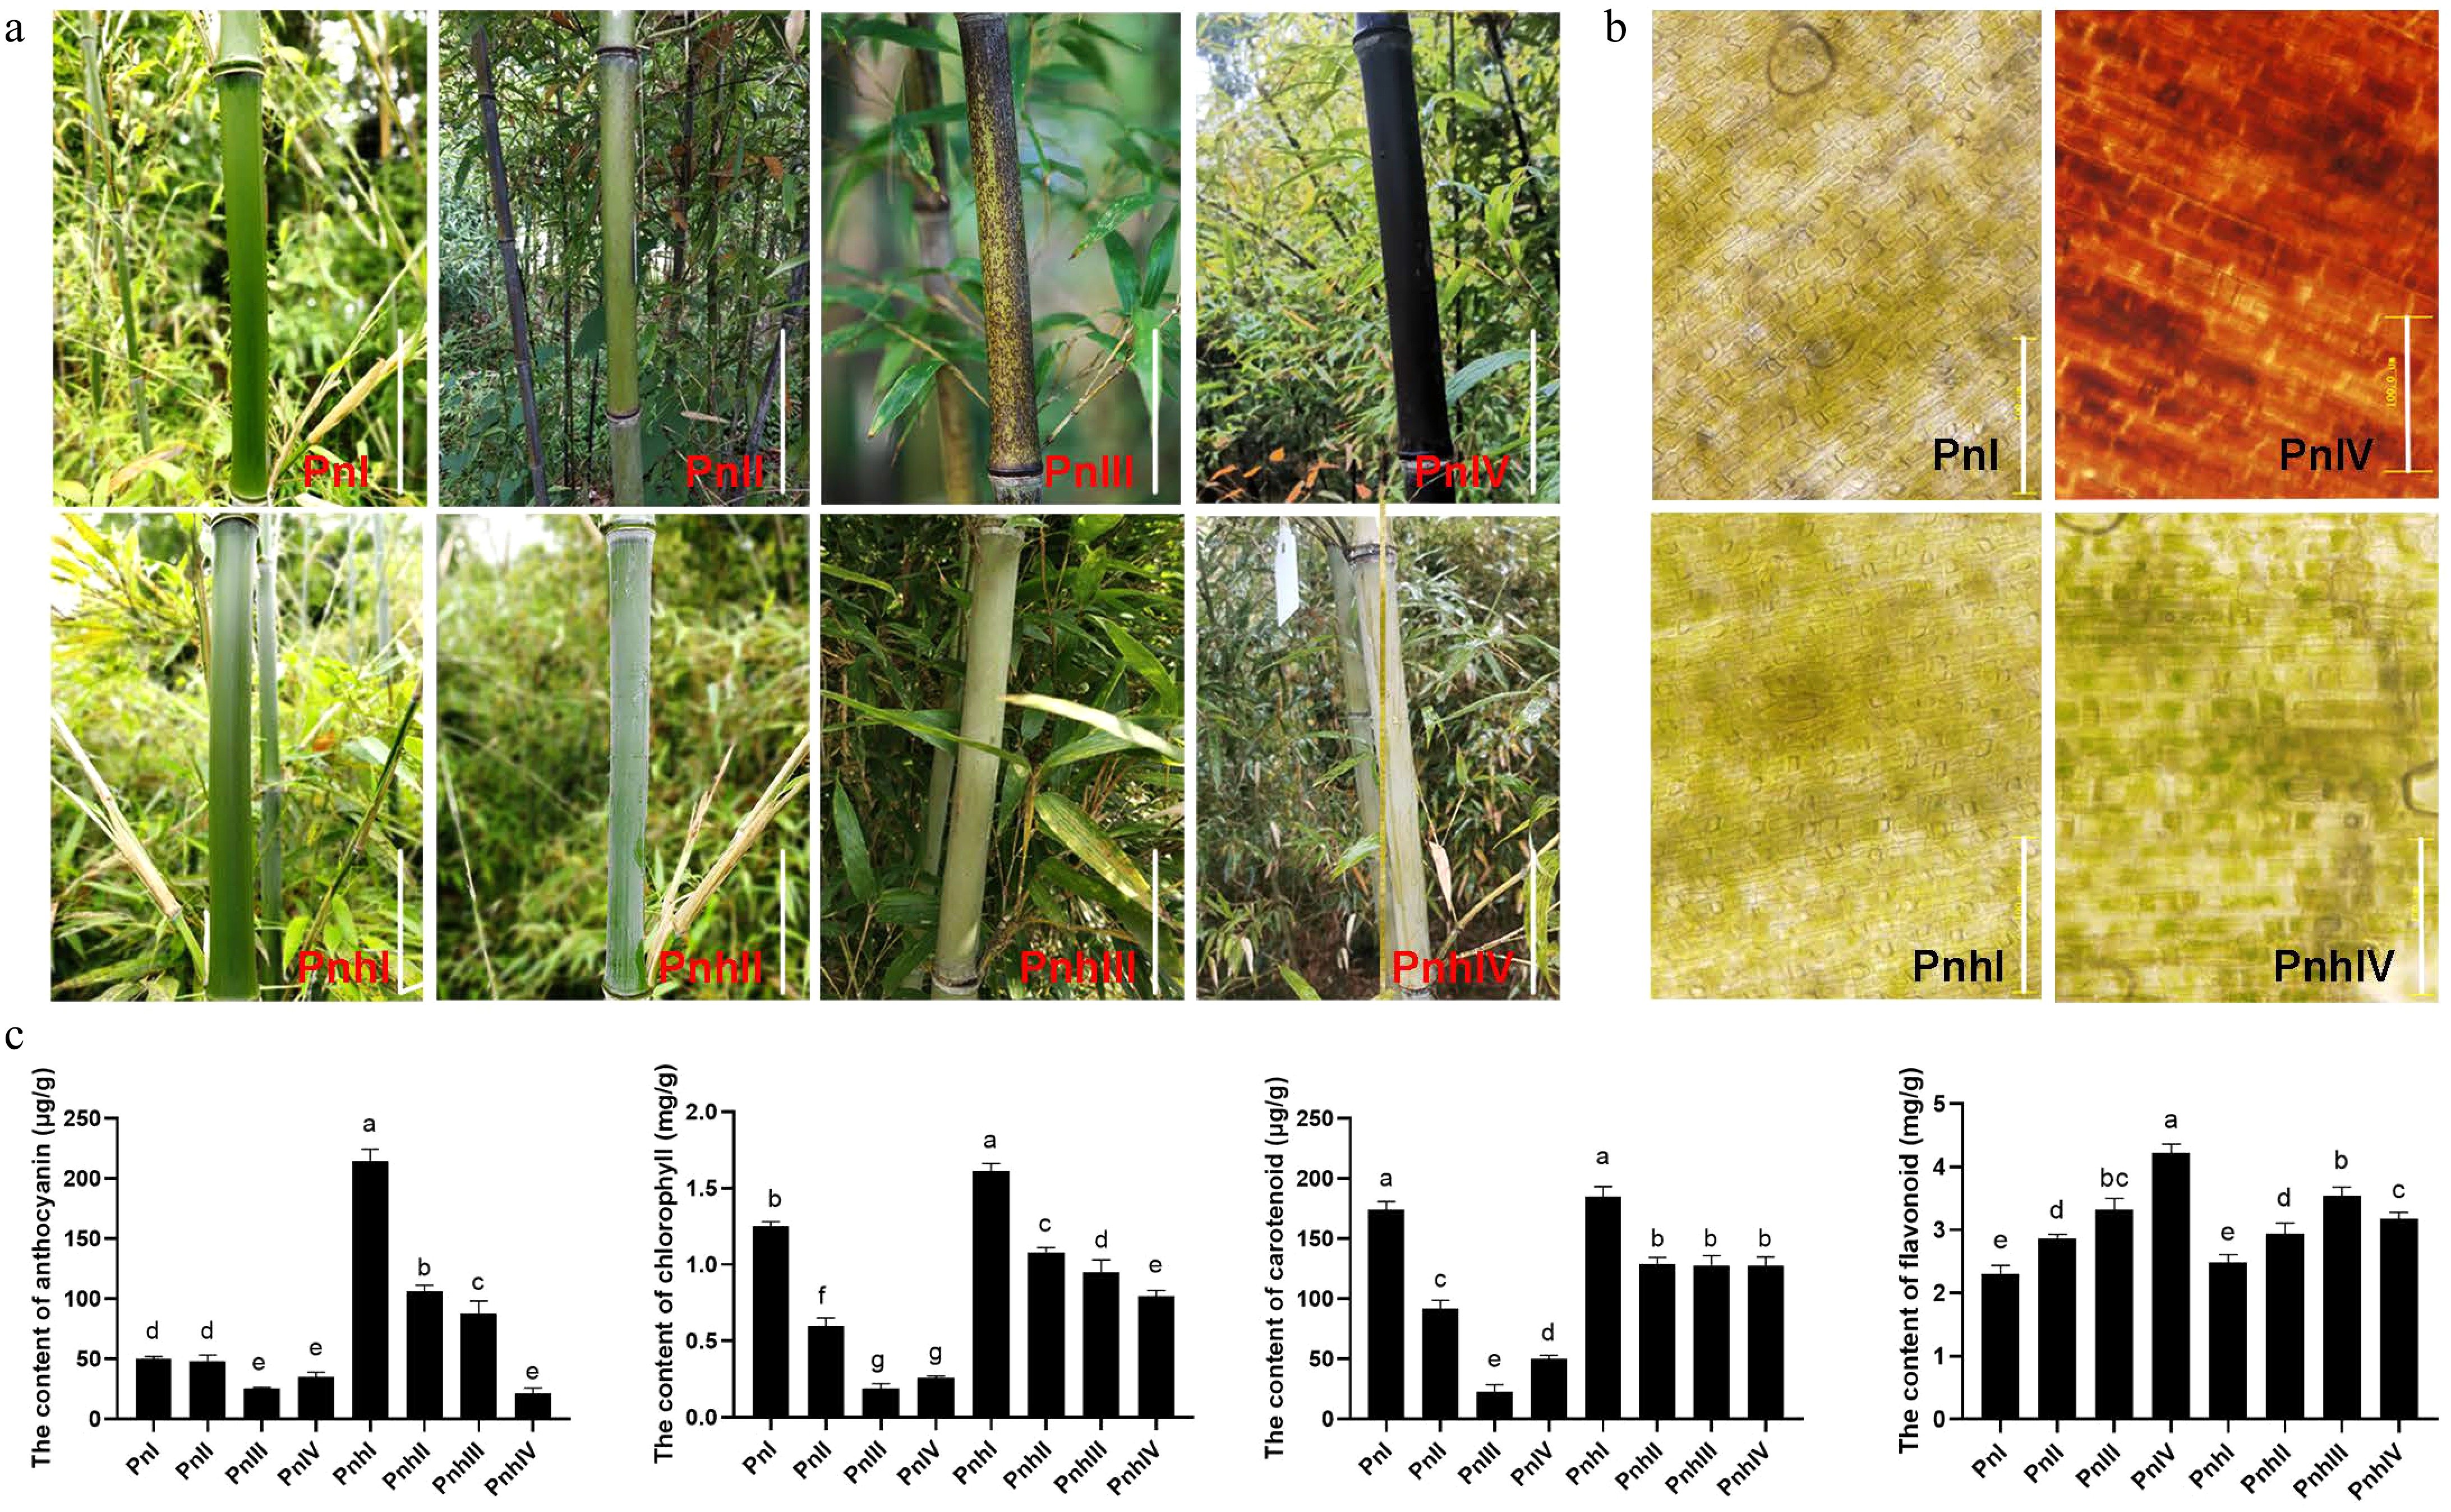
Figure 1.
Morphological observation and pigment analysis in Pn and Pnh culms. (a) The coloration process of Pn and Pnh at different stages. Bar = 10 cm. (b) Observation of pigments in Pn and Pnh at Stages I and IV. Bar = 100 μM. (c) Analysis of the content of anthocyanins, chlorophyll, carotenoids, and flavonoids in Pn and Pnh at various stages. Different letters indicate significant differences in the data.
-
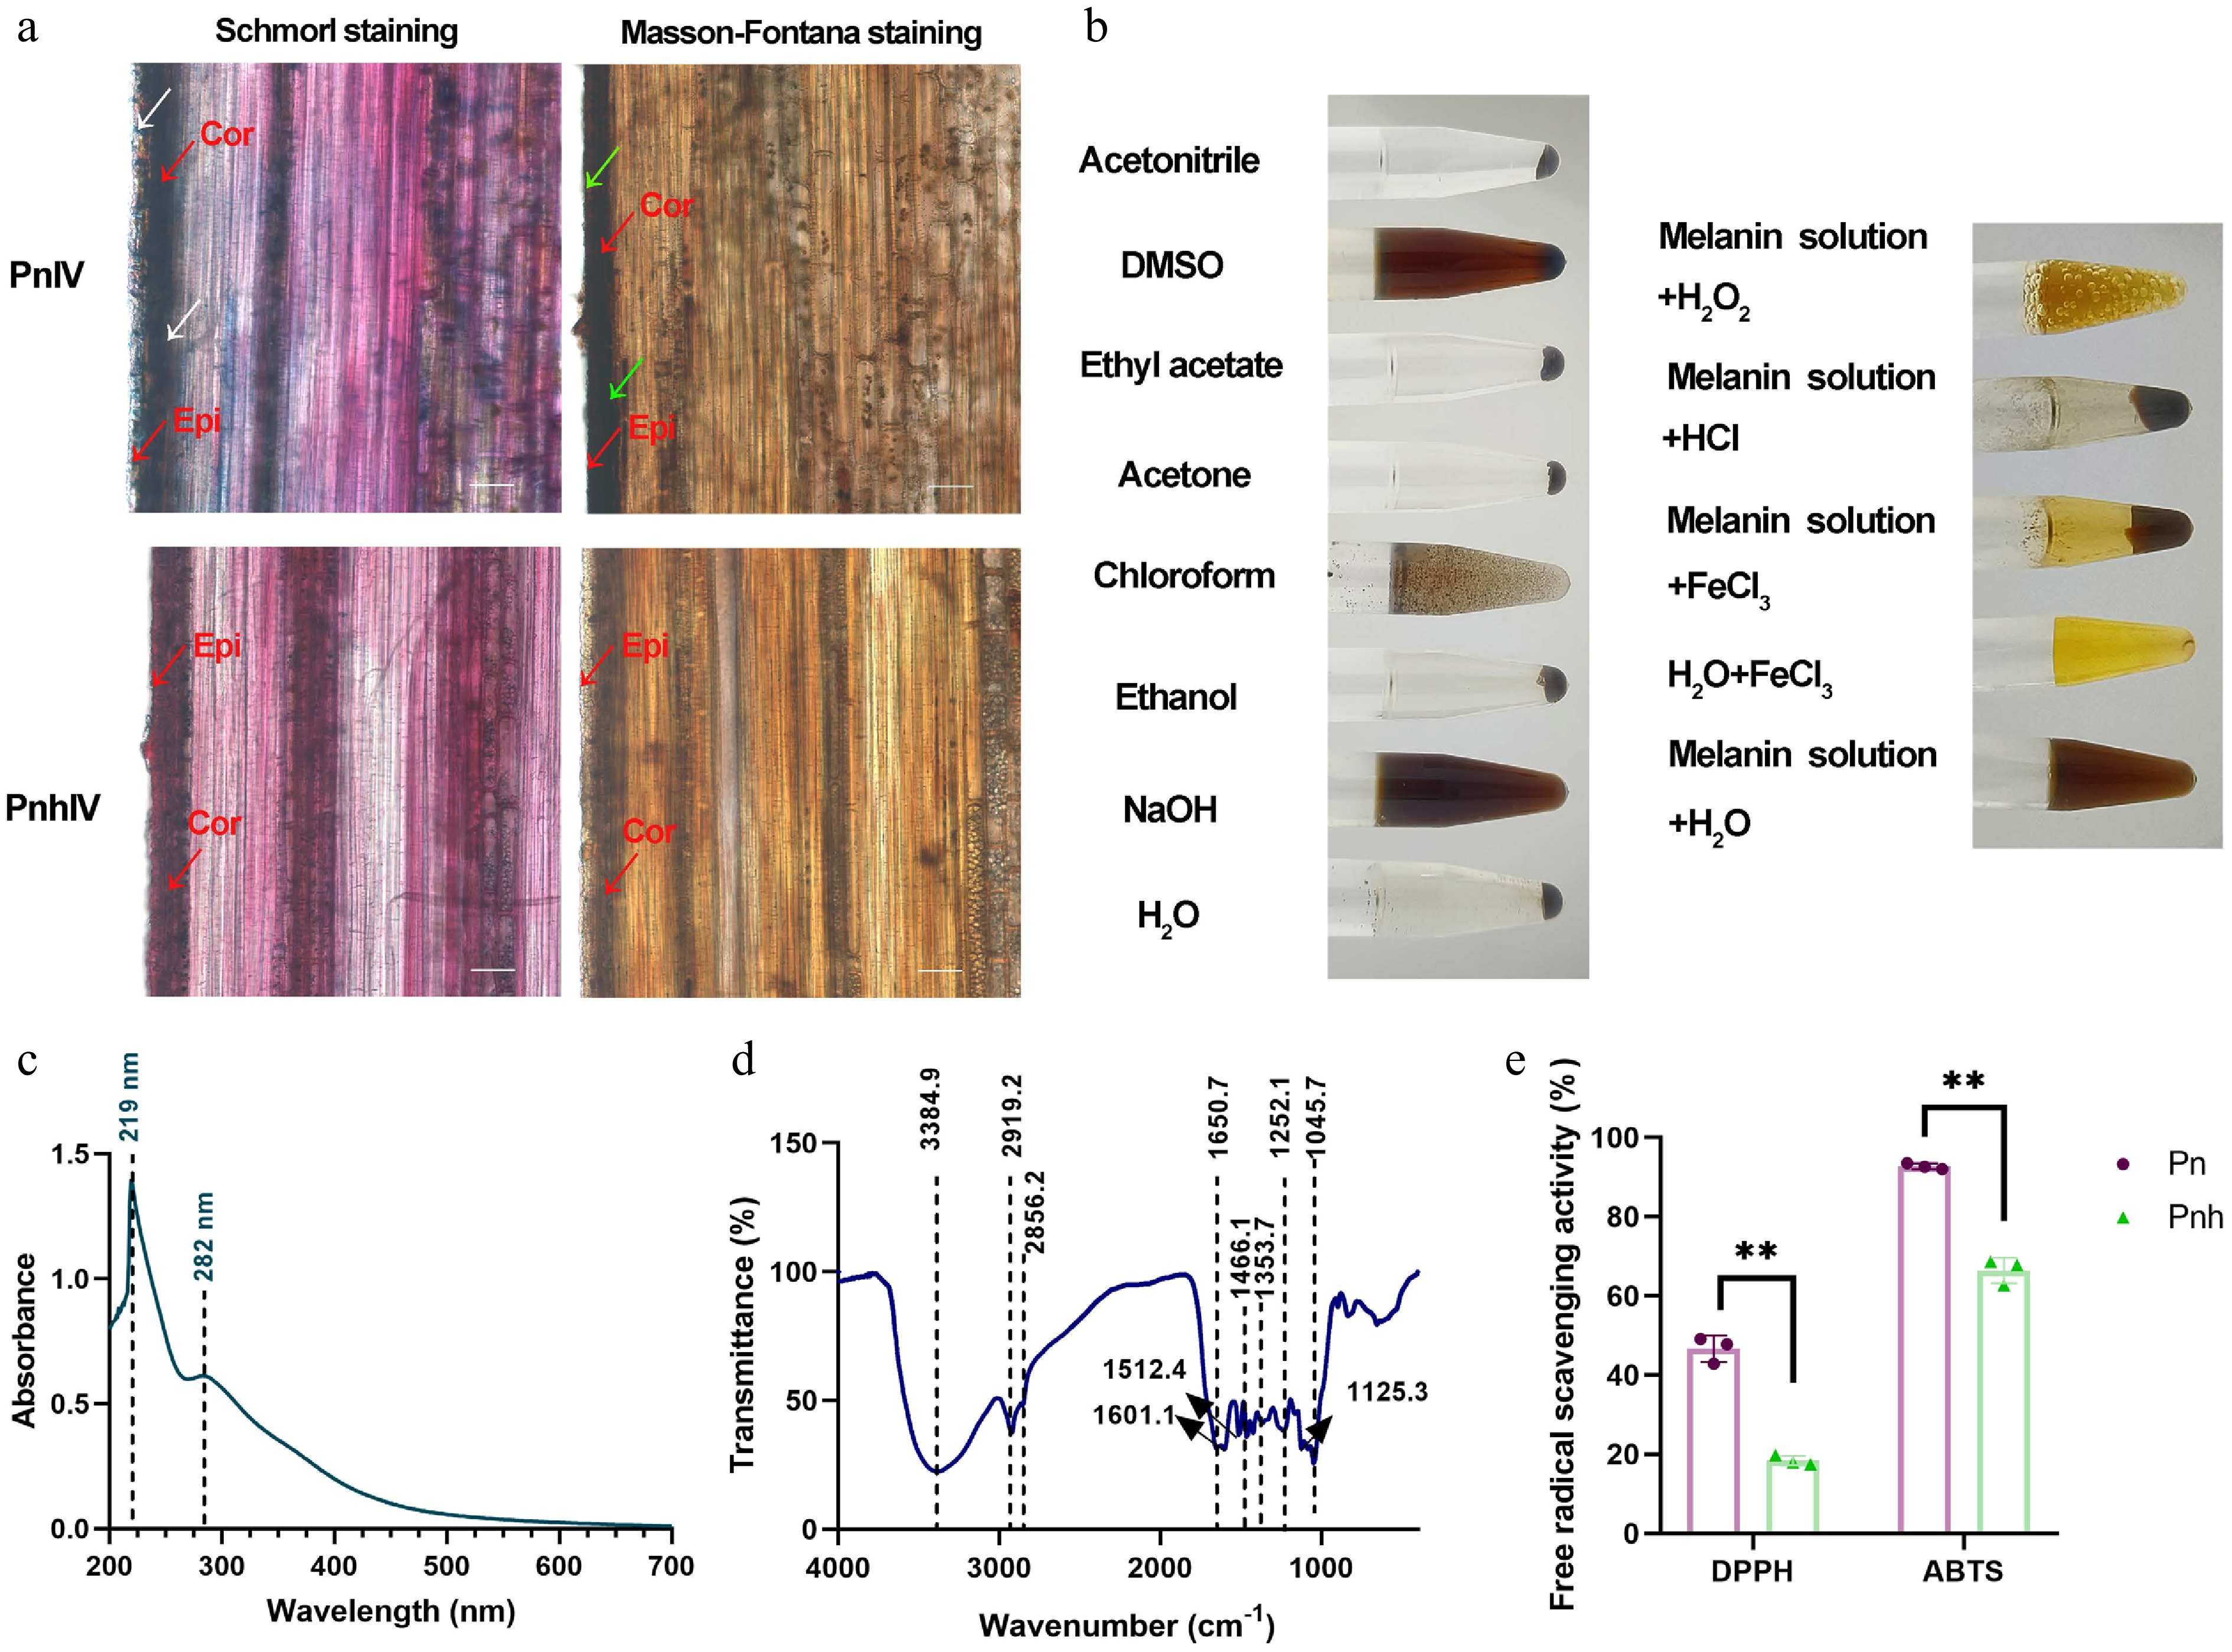
Figure 2.
The physical and chemical properties analysis of the melanin isolated from Pn. (a) The tissue sectioning and staining of Pn and Pnh culms. Red arrows: Cor, cortex; Epi, epidermis. White arrows: blue signals after staining via Schmorl's method. Green arrows: black signals after Masson–Fortuna staining. Bar = 50 μm. (b) The solubility, precipitation, and oxidation of the melanin isolated from Pn. (c), (d) The UV and FT-IR analysis of Pn melanin. The dashed lines represent the absorption peaks. (e) The DPPH and ABTS free radical scavenging analysis of Pn and Pnh at Stage IV. ** represents p < 0.01.
-
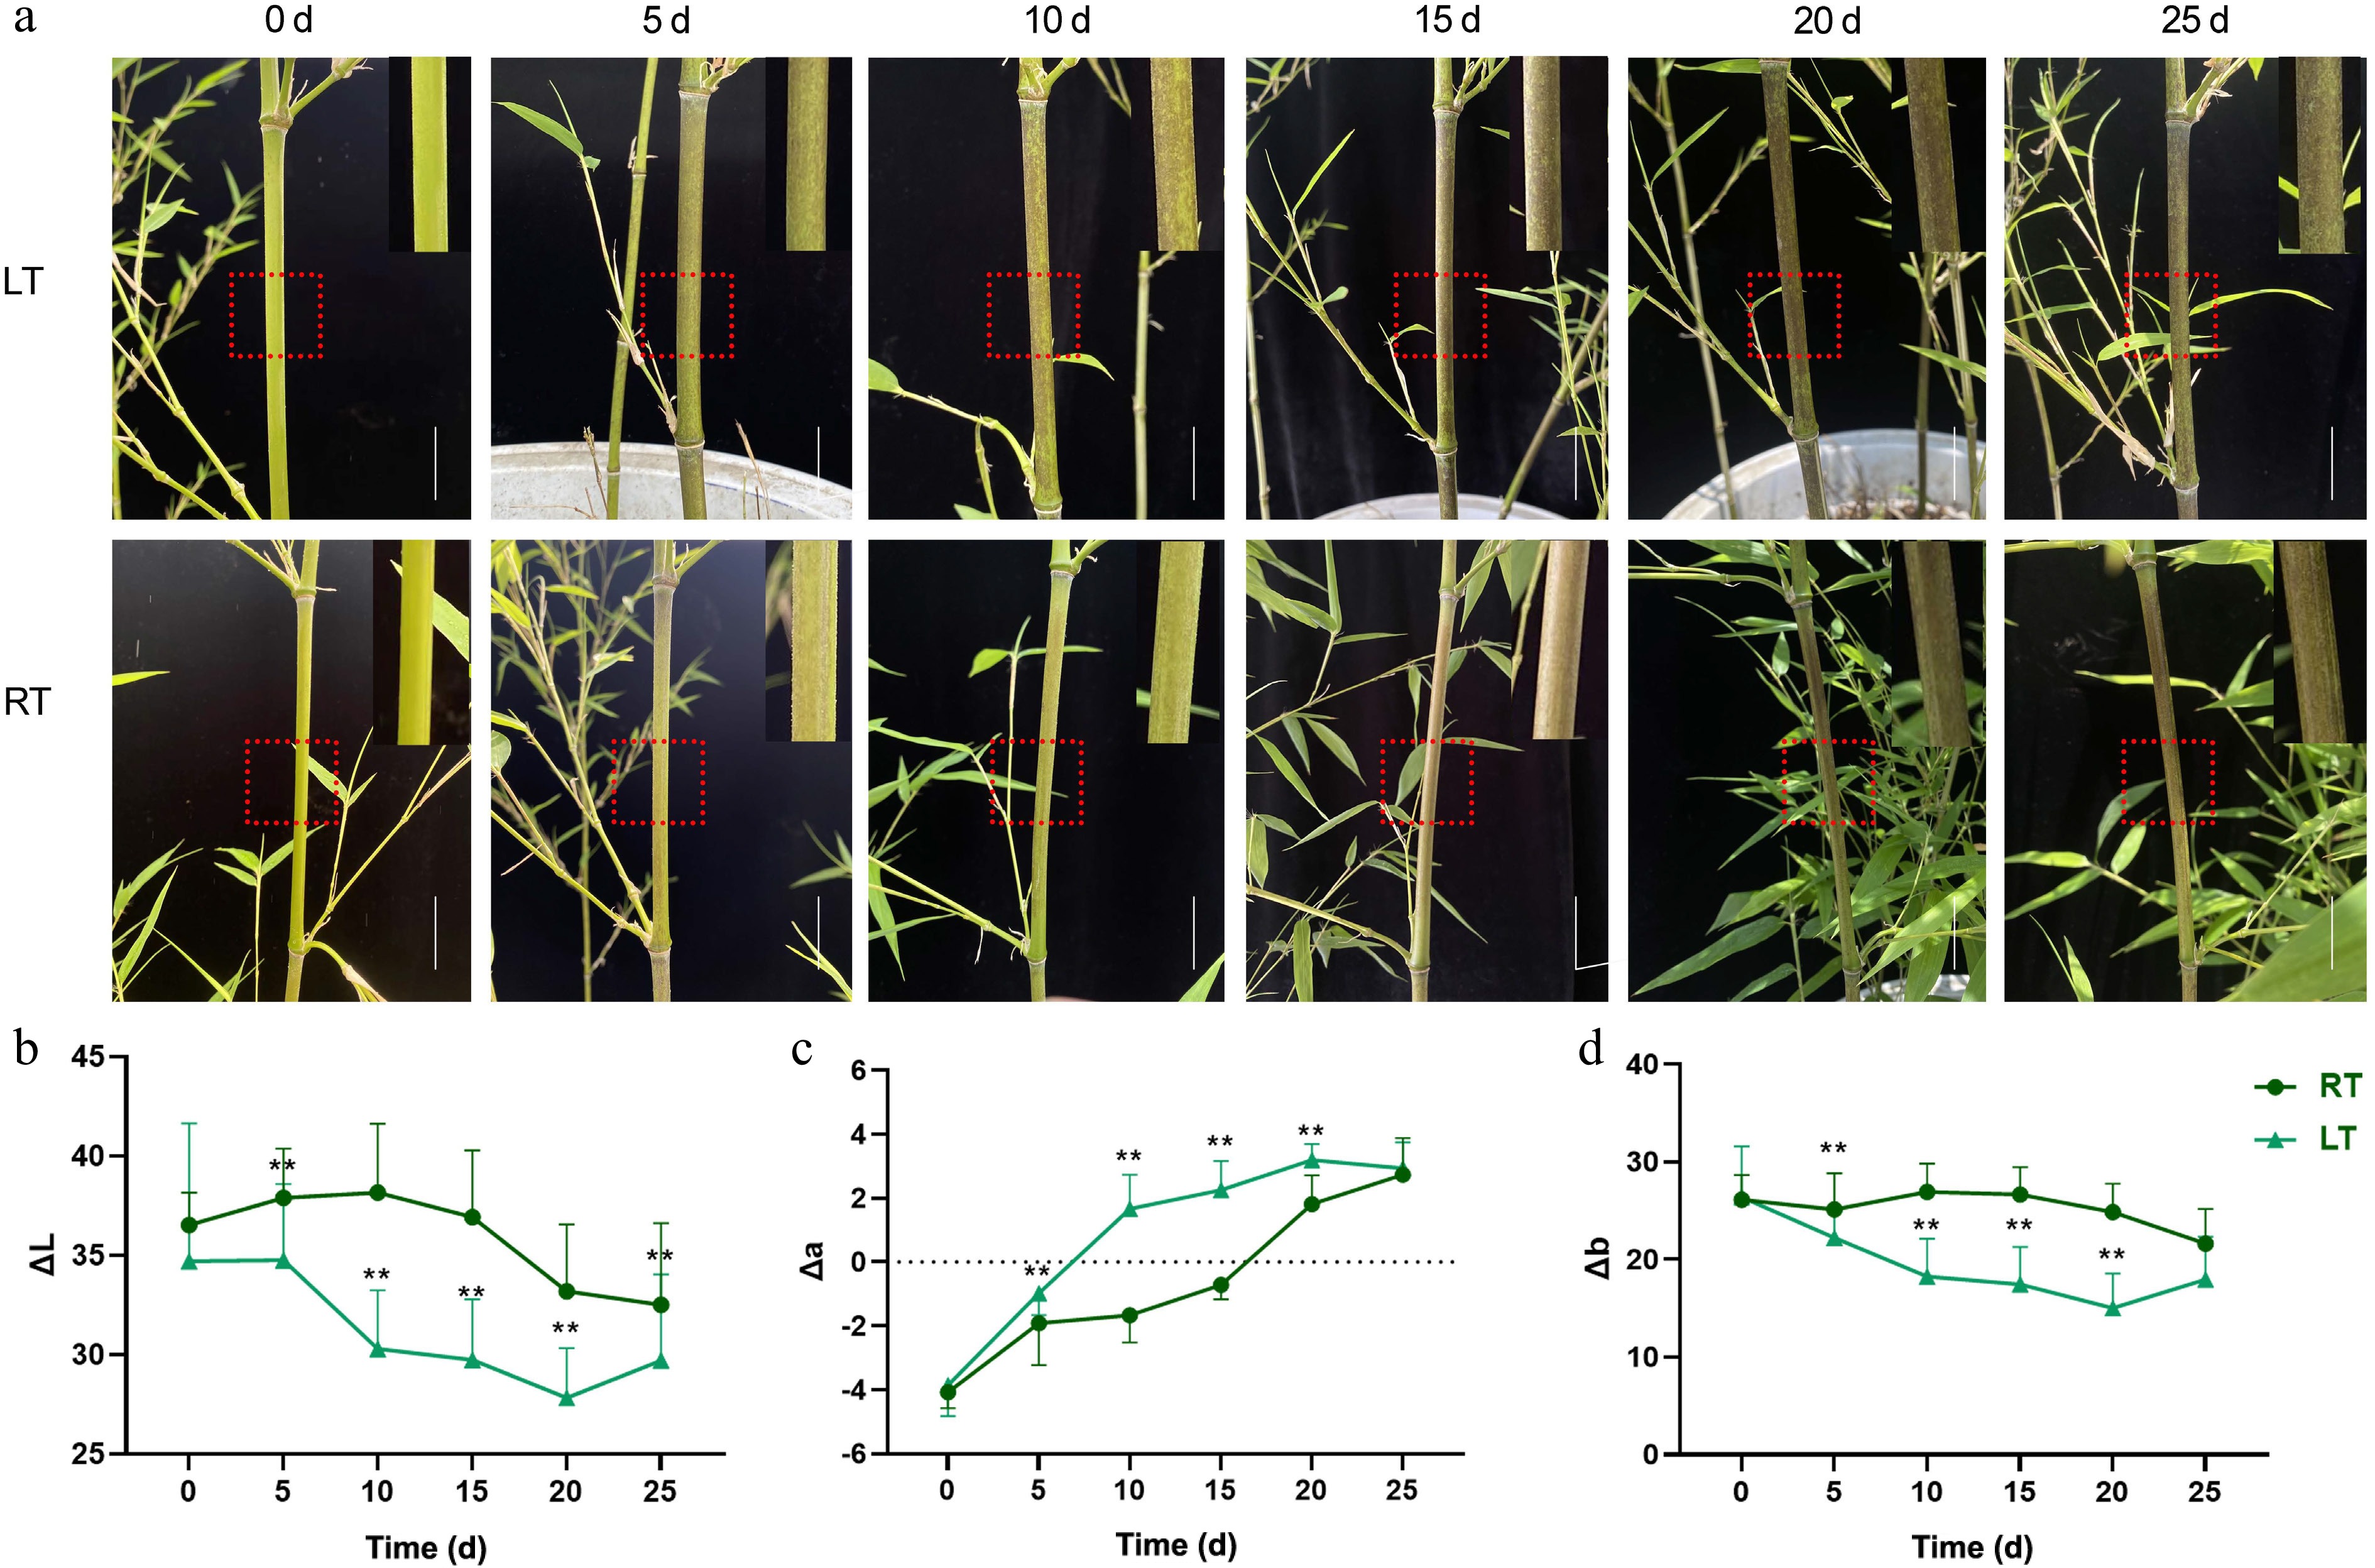
Figure 3.
Growth phenotype and color difference of Pn grown under the low temperature (LT) and room temperature (RT) treatments. Bar = 2 cm. The red dotted box was enlarged in the upper right corner of each image. (a) The phenotype of Pn grown under the LT and RT treatments over the duration of the 25-day temperature trial. (b−d) Changes in ΔL, Δa, and Δb values of Pn grown under the LT and RT treatments. ΔL represents the brightness, Δa represents the color change from red to green, and Δb represents the color change from yellow to blue. ** represents p < 0.01.
-
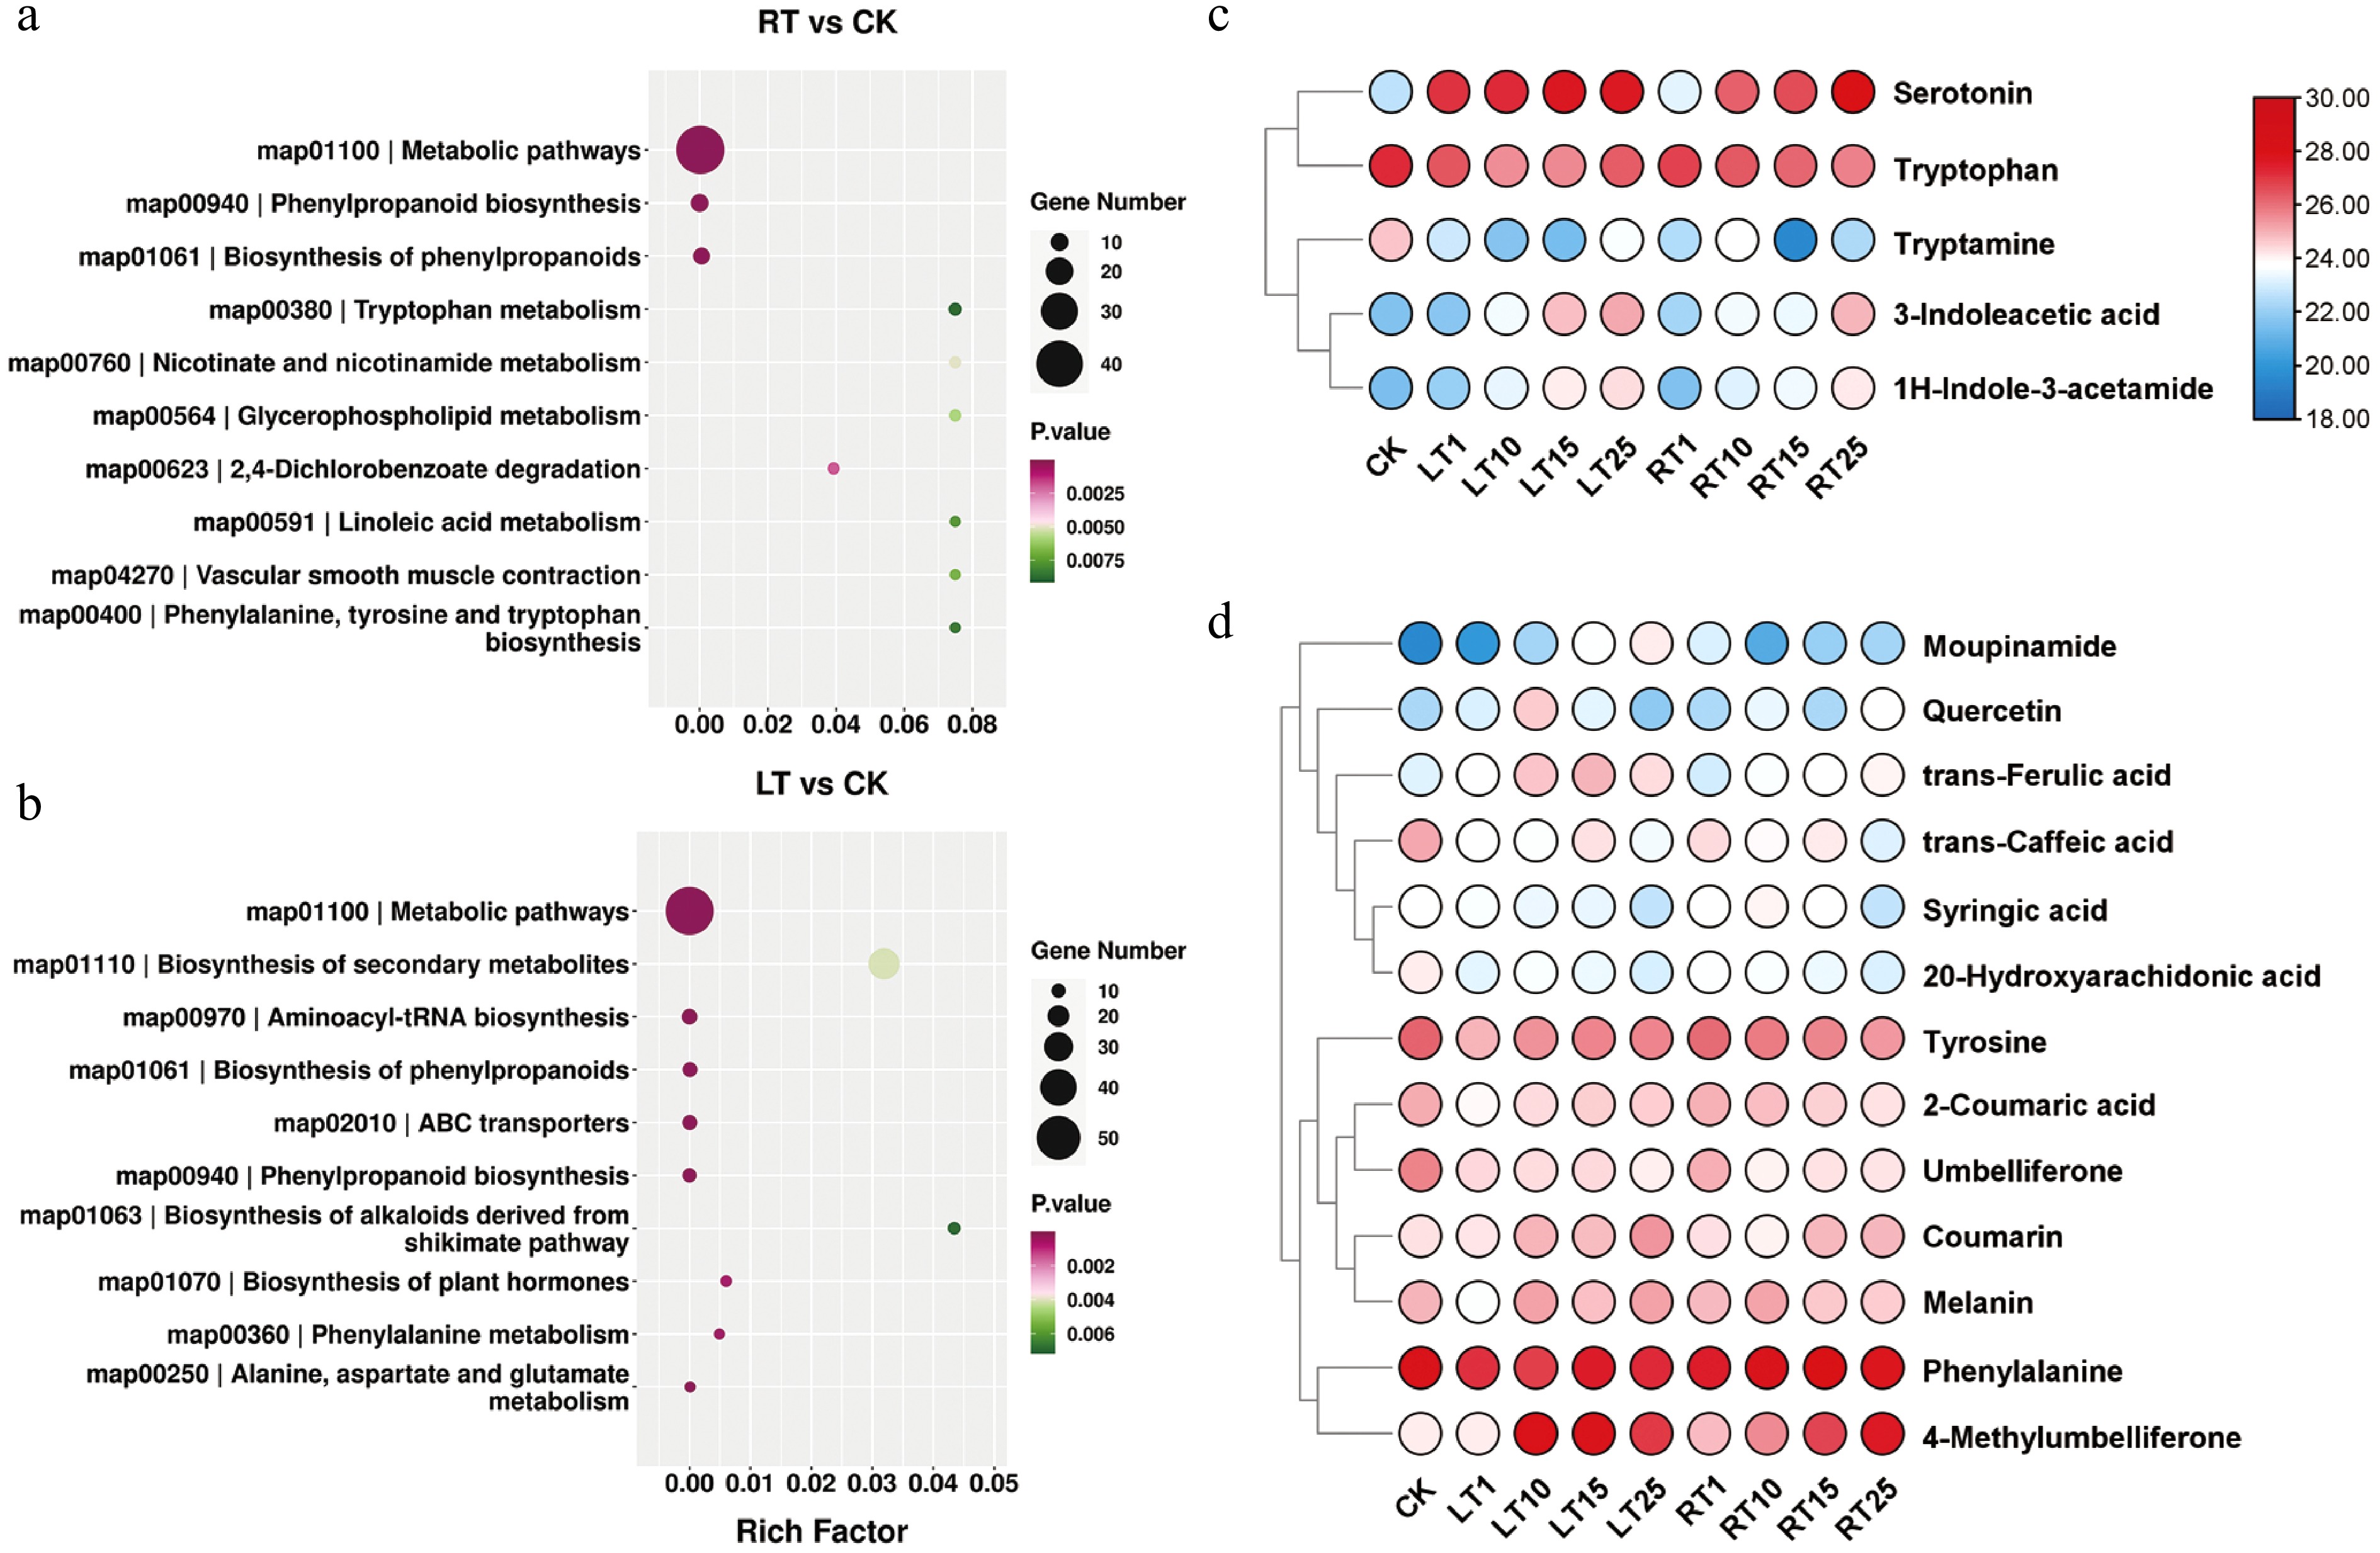
Figure 4.
Metabolic profiles of Pn grown under LT and RT. KEGG enrichment analysis of DEMs under the (a) RT treatment and (b) LT treatment. (c) Heatmap highlighting the relative contents of indole-related metabolites when grown under the LT and RT treatments. (d) Heatmap highlighting the relative contents of phenolic-related metabolites when grown under the LT and RT treatments.
-
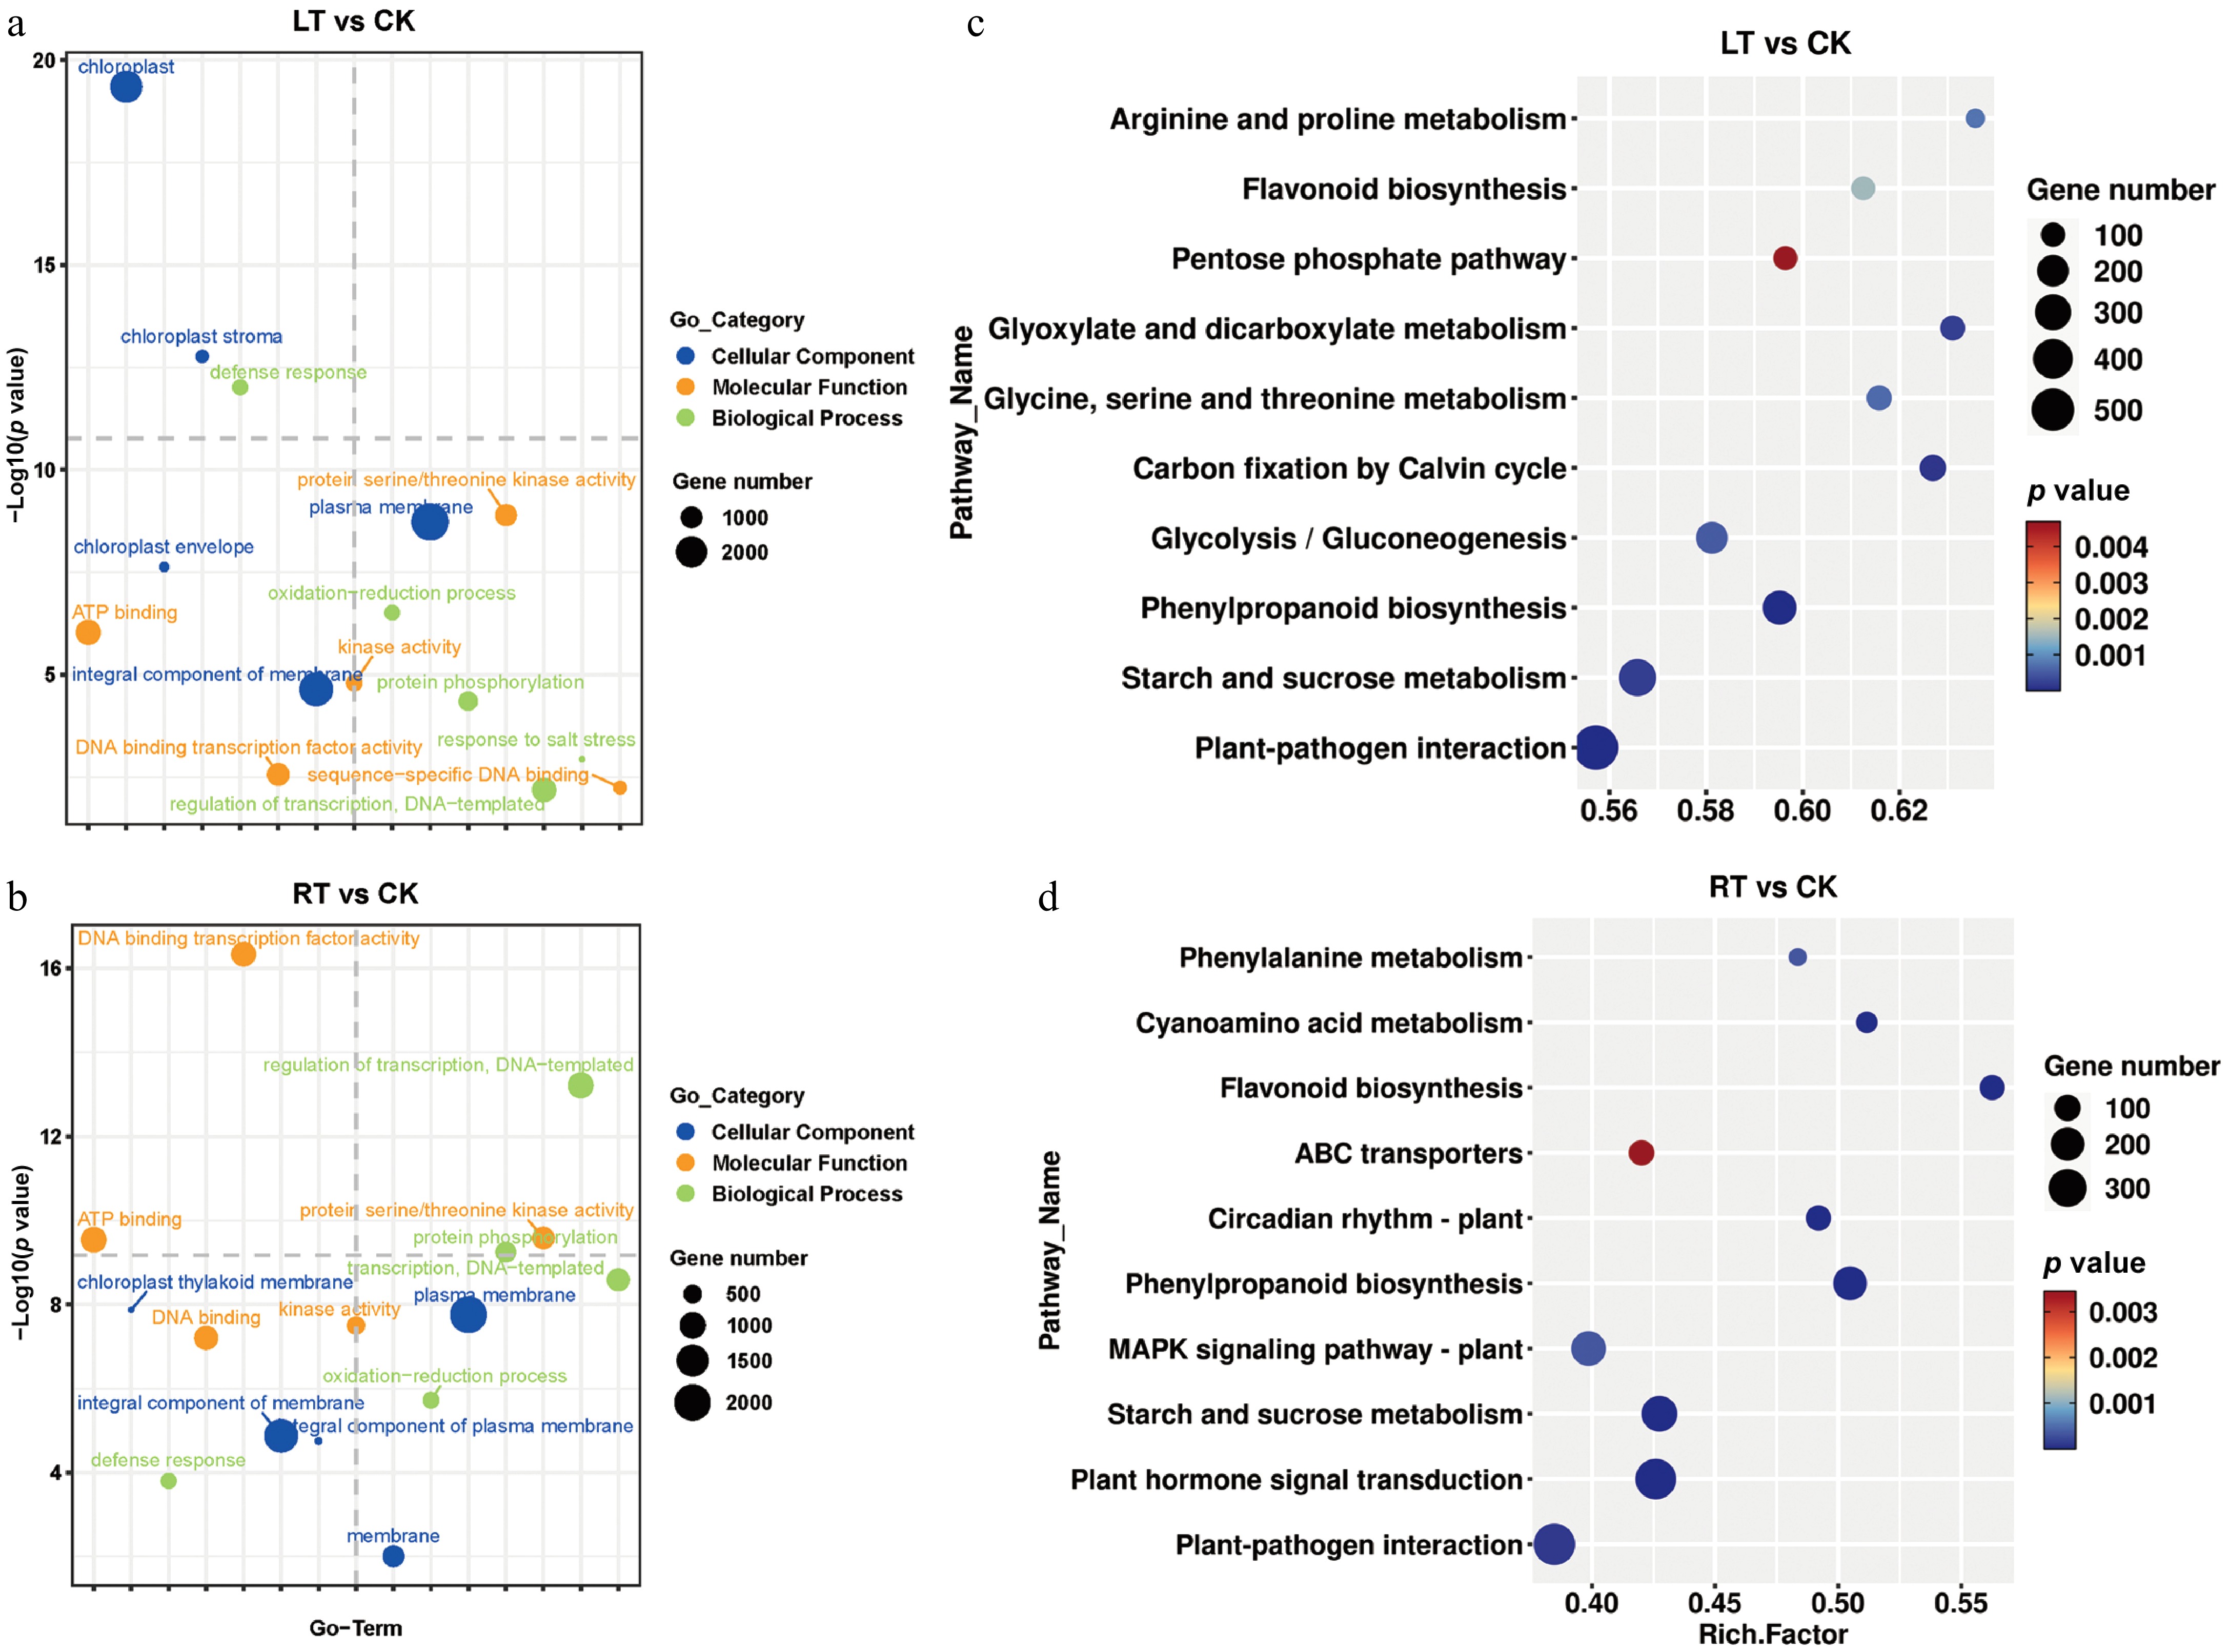
Figure 5.
GO terms and KEGG enrichment analysis of DEGs in P. nigra comparing the RT and LT growth treatments. GO enrichment analysis of DEGs under (a) the LT treatment and (b) the RT treatment. KEGG enrichment analysis of DEGs under (c) the LT treatment and (d) the RT treatment.
-
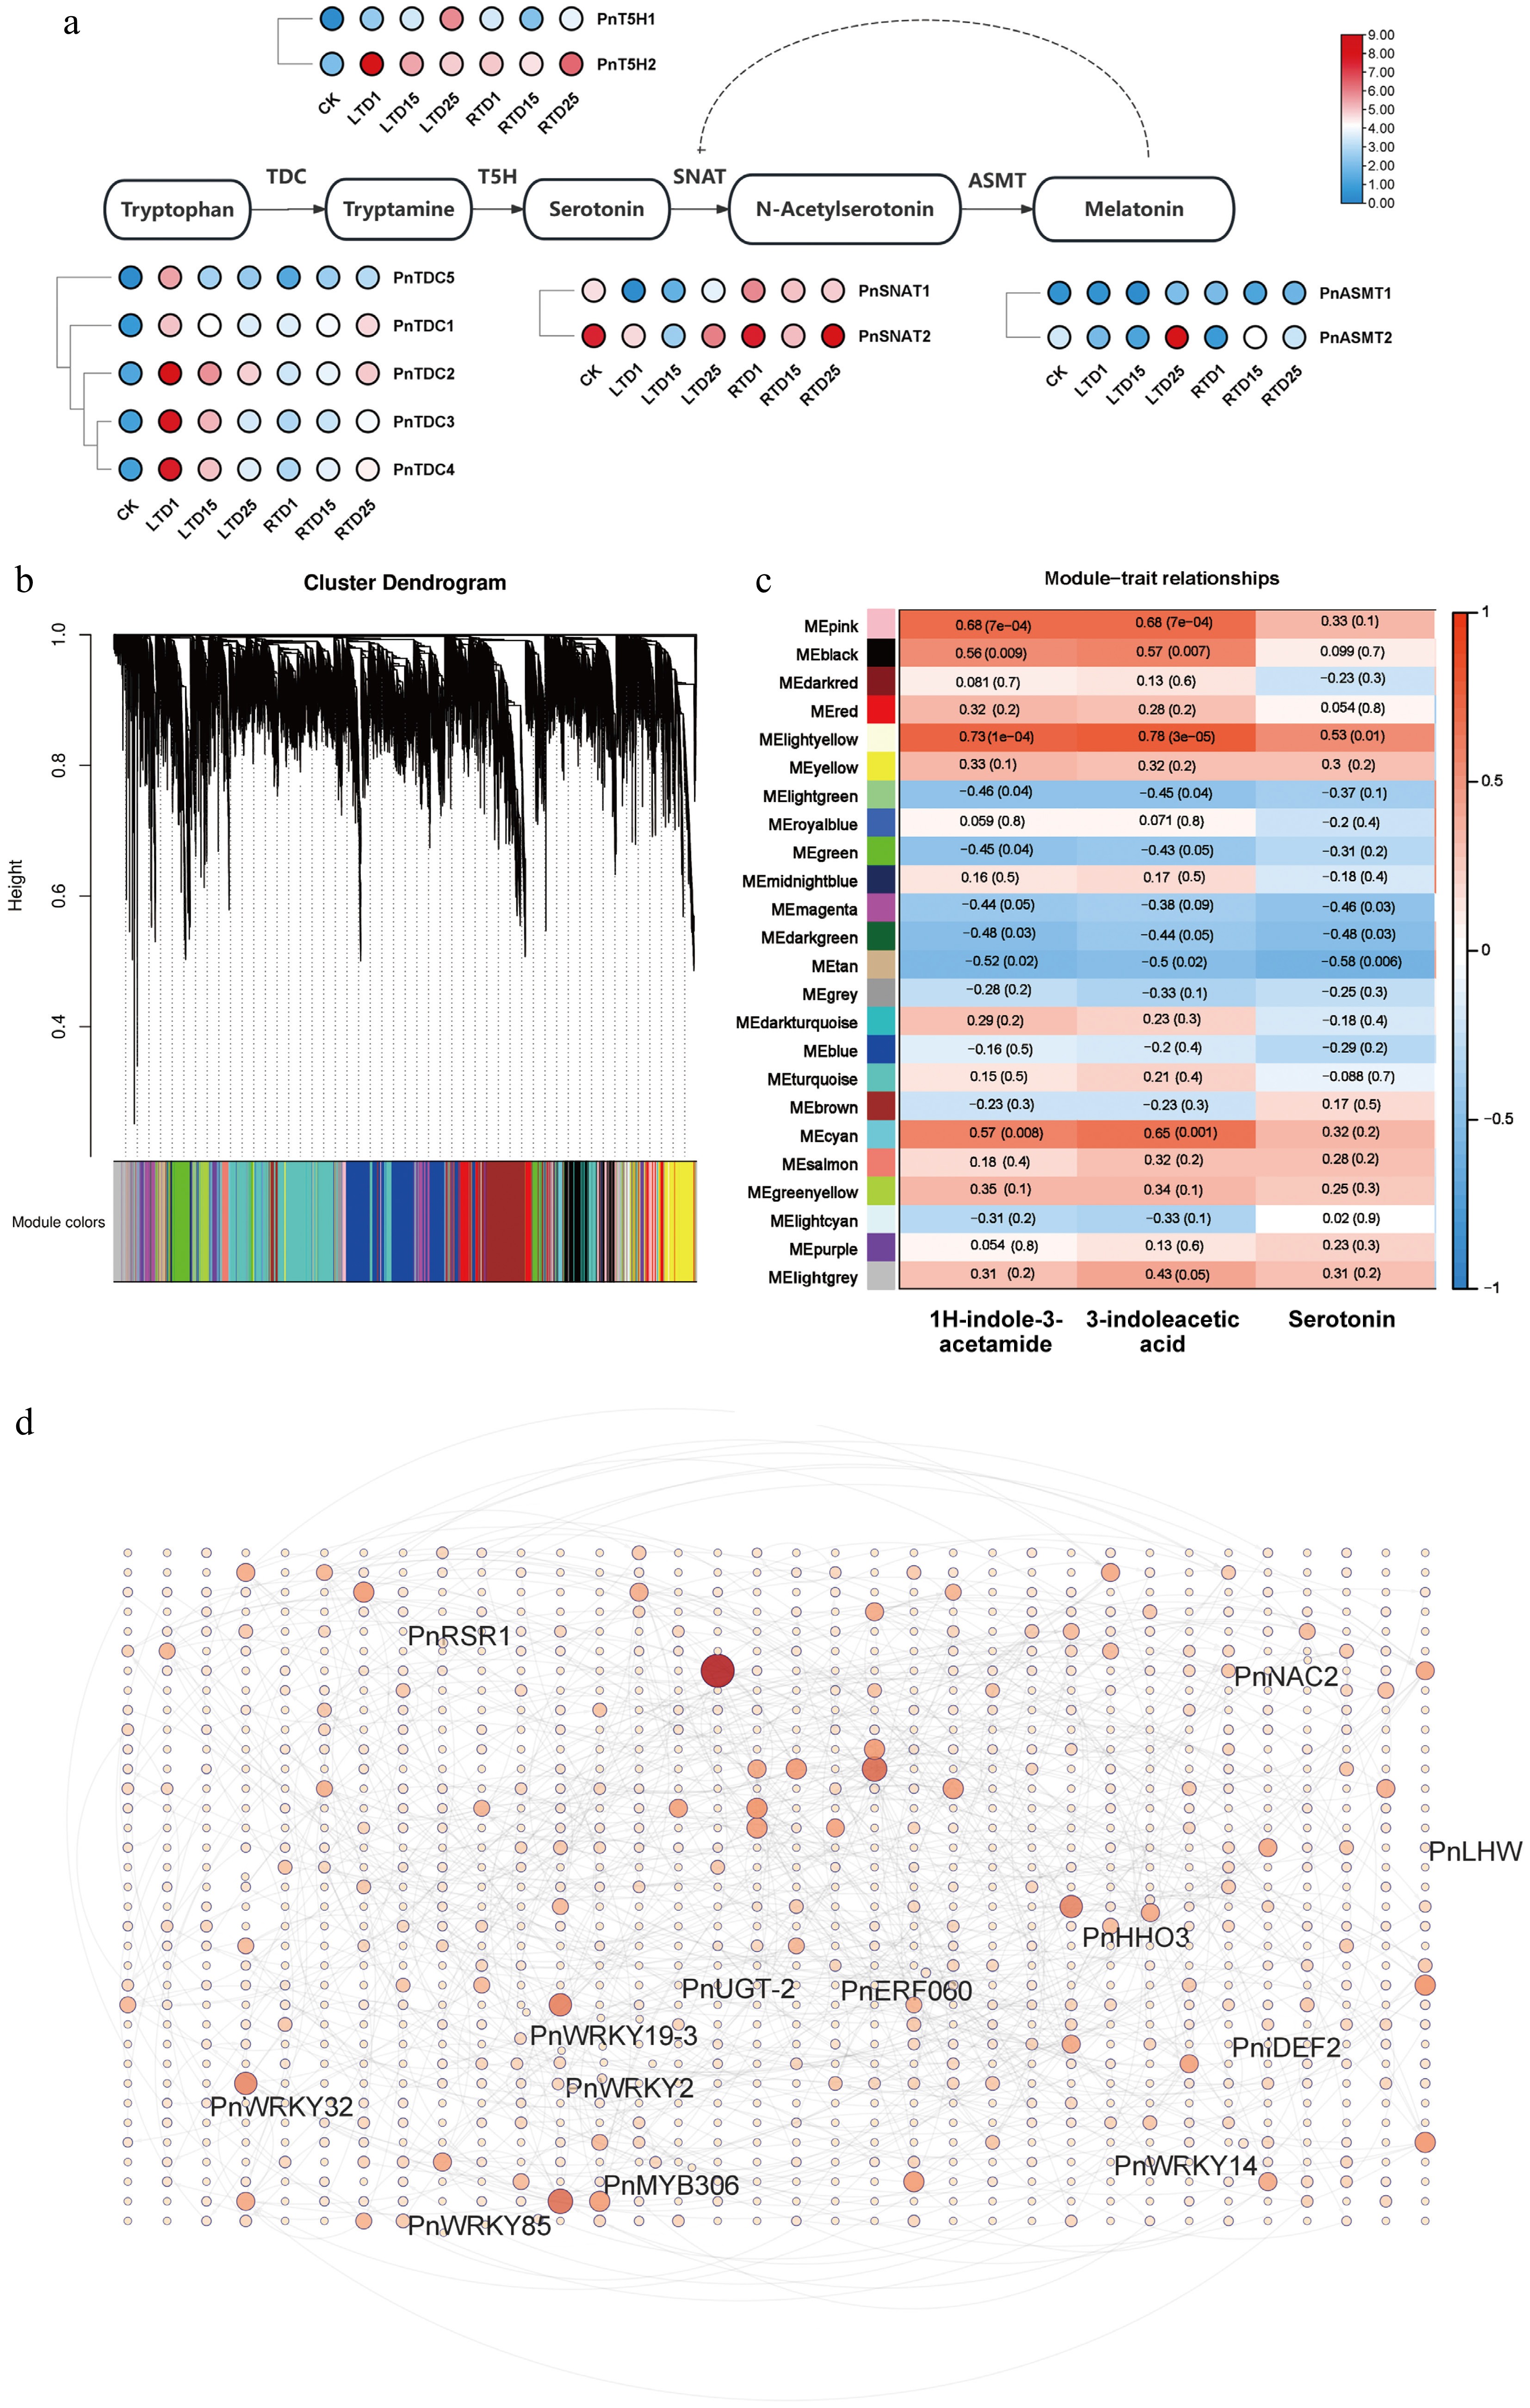
Figure 6.
Correlation analysis and expression profiles of DEGs related to indole biosynthesis. (a) Heatmap highlighting the expression profiles of genes involved in indole biosynthesis. (b) Division of genes and TFs into 24 modules. (c) Correlation analysis of gene co-expression network modules with serotonin, 3-indoleacetic acid, and 1H-indole-3-acetamide. (d) Gene network analysis of the aforementioned genes that are highly related to serotonin, 3-indoleacetic acid, and 1H-indole-3-acetamide. The red circles represent various genes, and the shades and sizes indicate the number of gene connections.
-
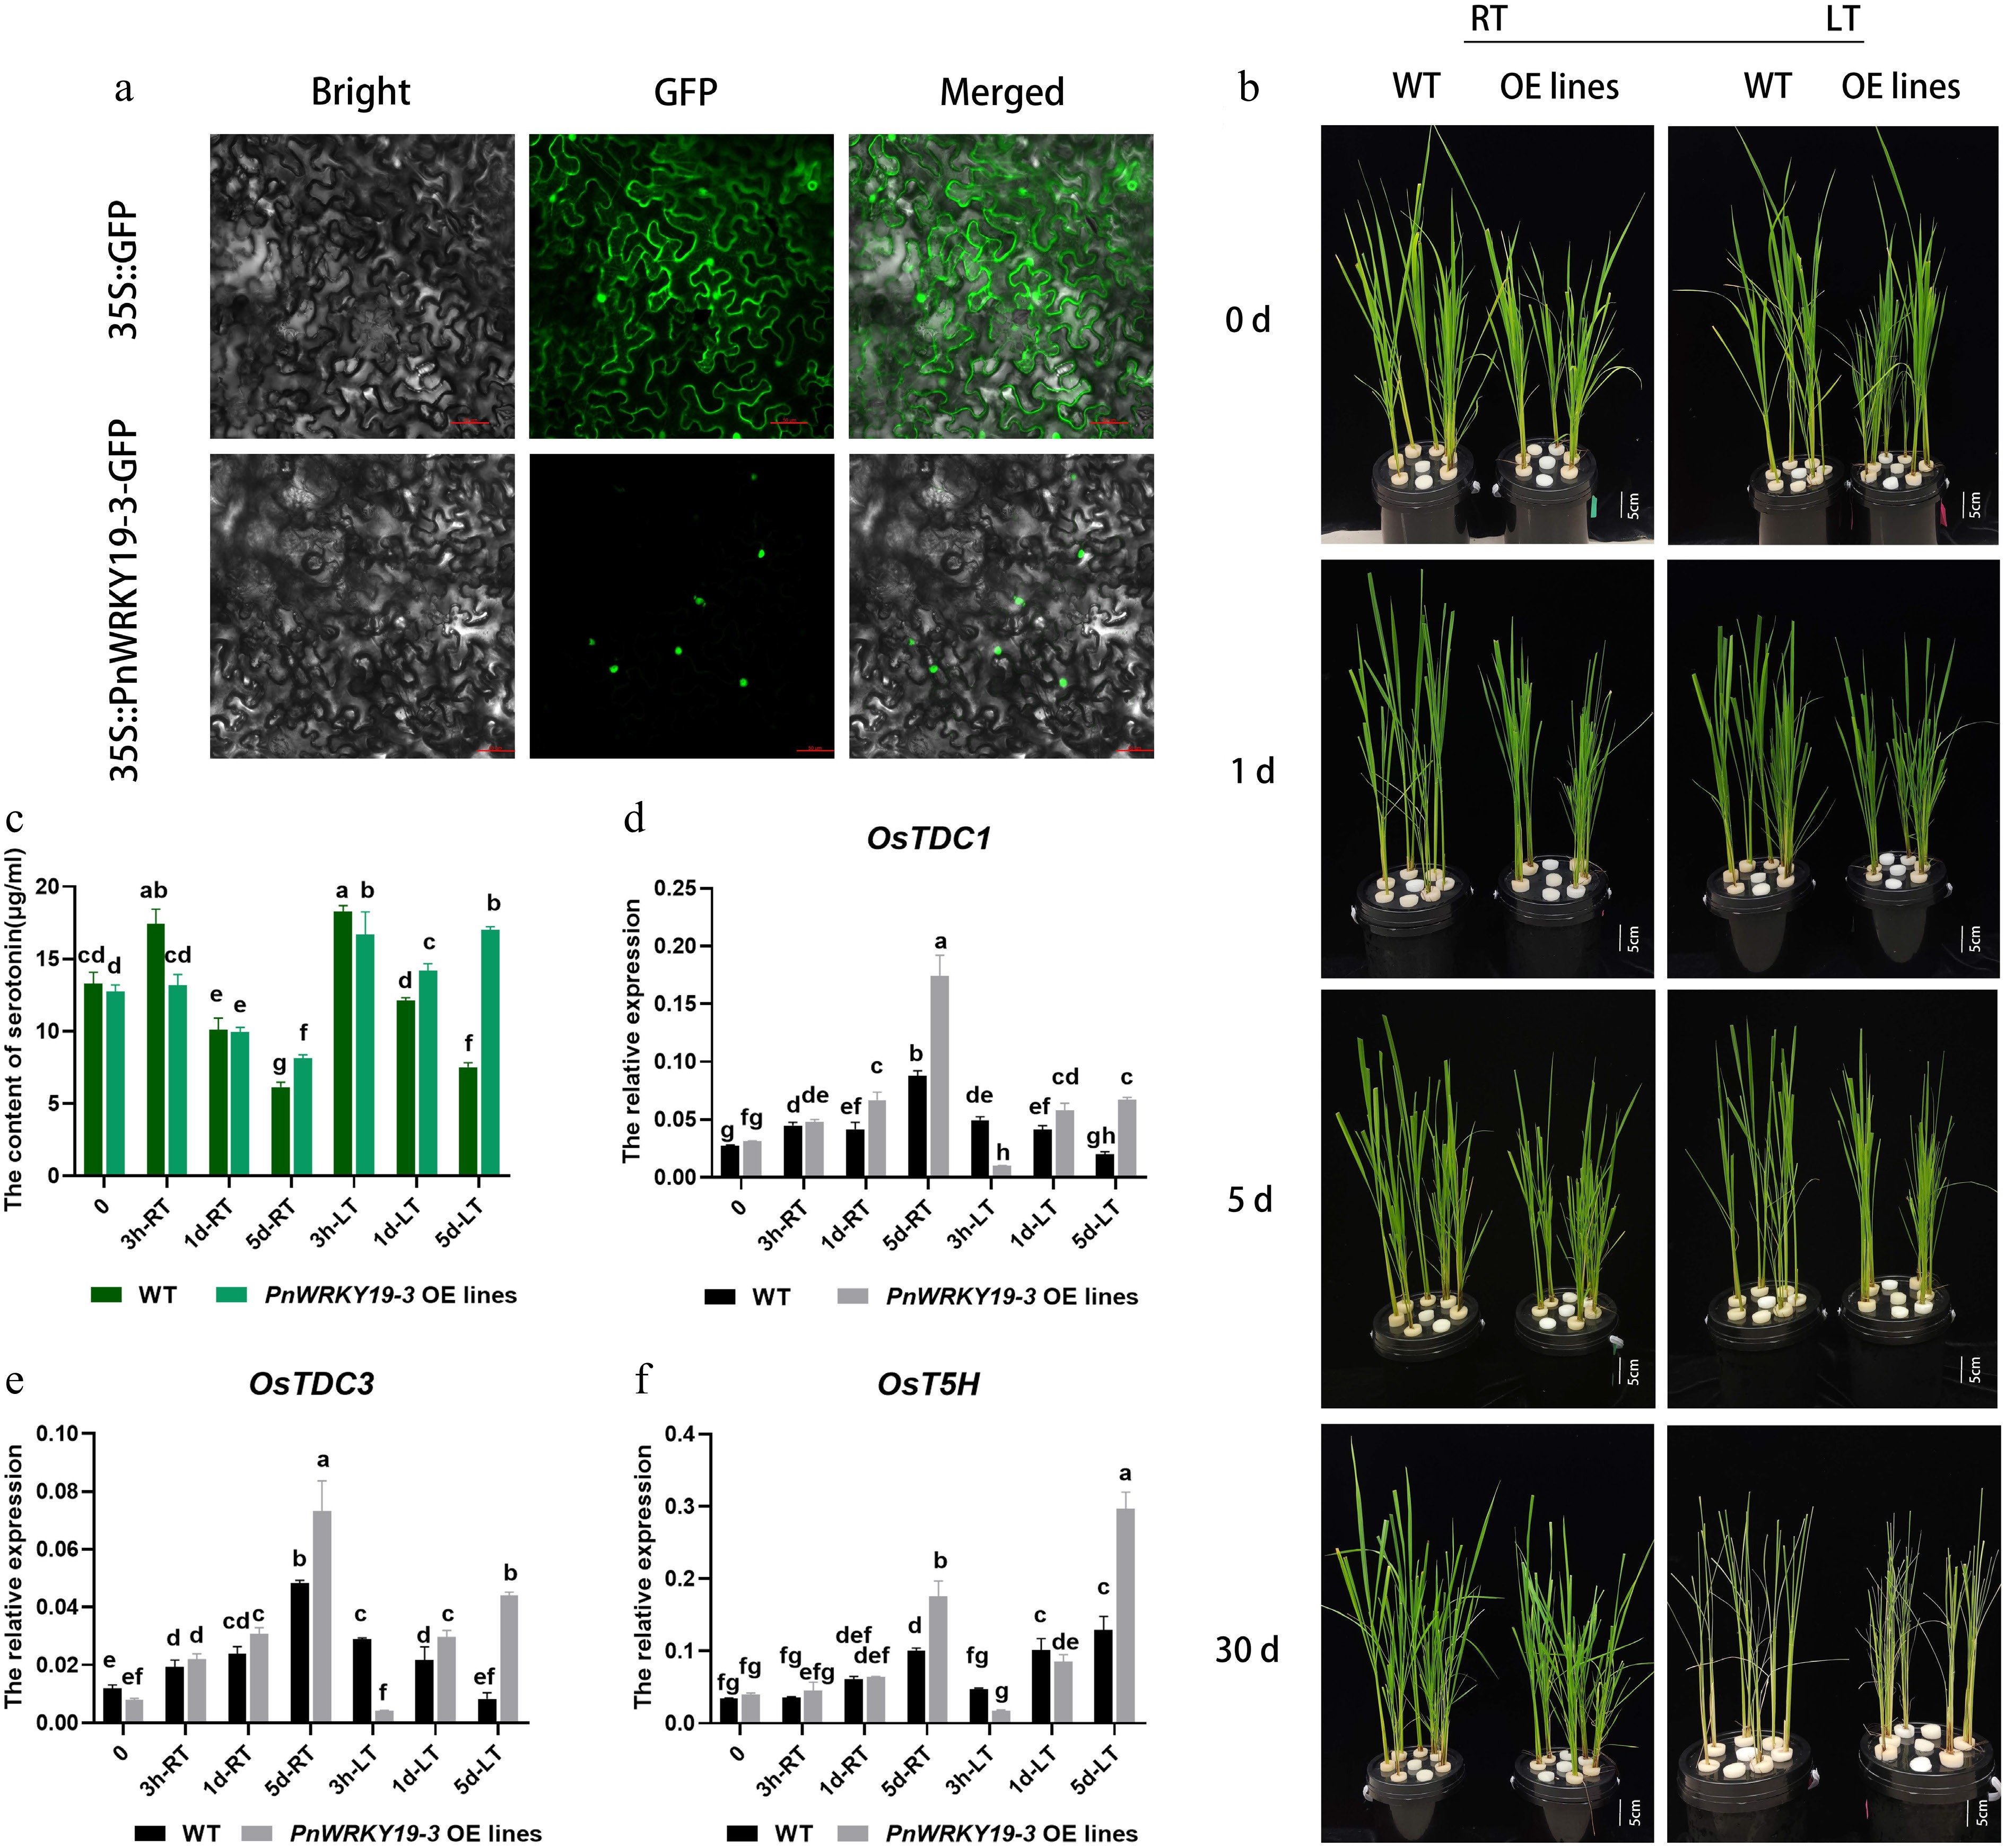
Figure 7.
PnWRKY19-3 overexpression can enhance the accumulation of serotonin in rice. (a) Nuclear localization of PnWRKY19-3 protein; bar = 50 μM. (b) Phenotypes of the WT and PnWRKY19-3 overexpressing transgenic rice grown under RT and LT conditions; bar = 5 cm. (c) Serotonin content in WT and PnWRKY19-3 overexpressing transgenic rice when grown at under RT and LT conditions. (d–f) Expression analysis of OsTDC1, OsTDC3, and OsT5H in WT and PnWRKY19-3 overexpressing transgenic rice grown under RT and LT conditions. Different letters indicate significant differences in the data.
Figures
(7)
Tables
(0)