-
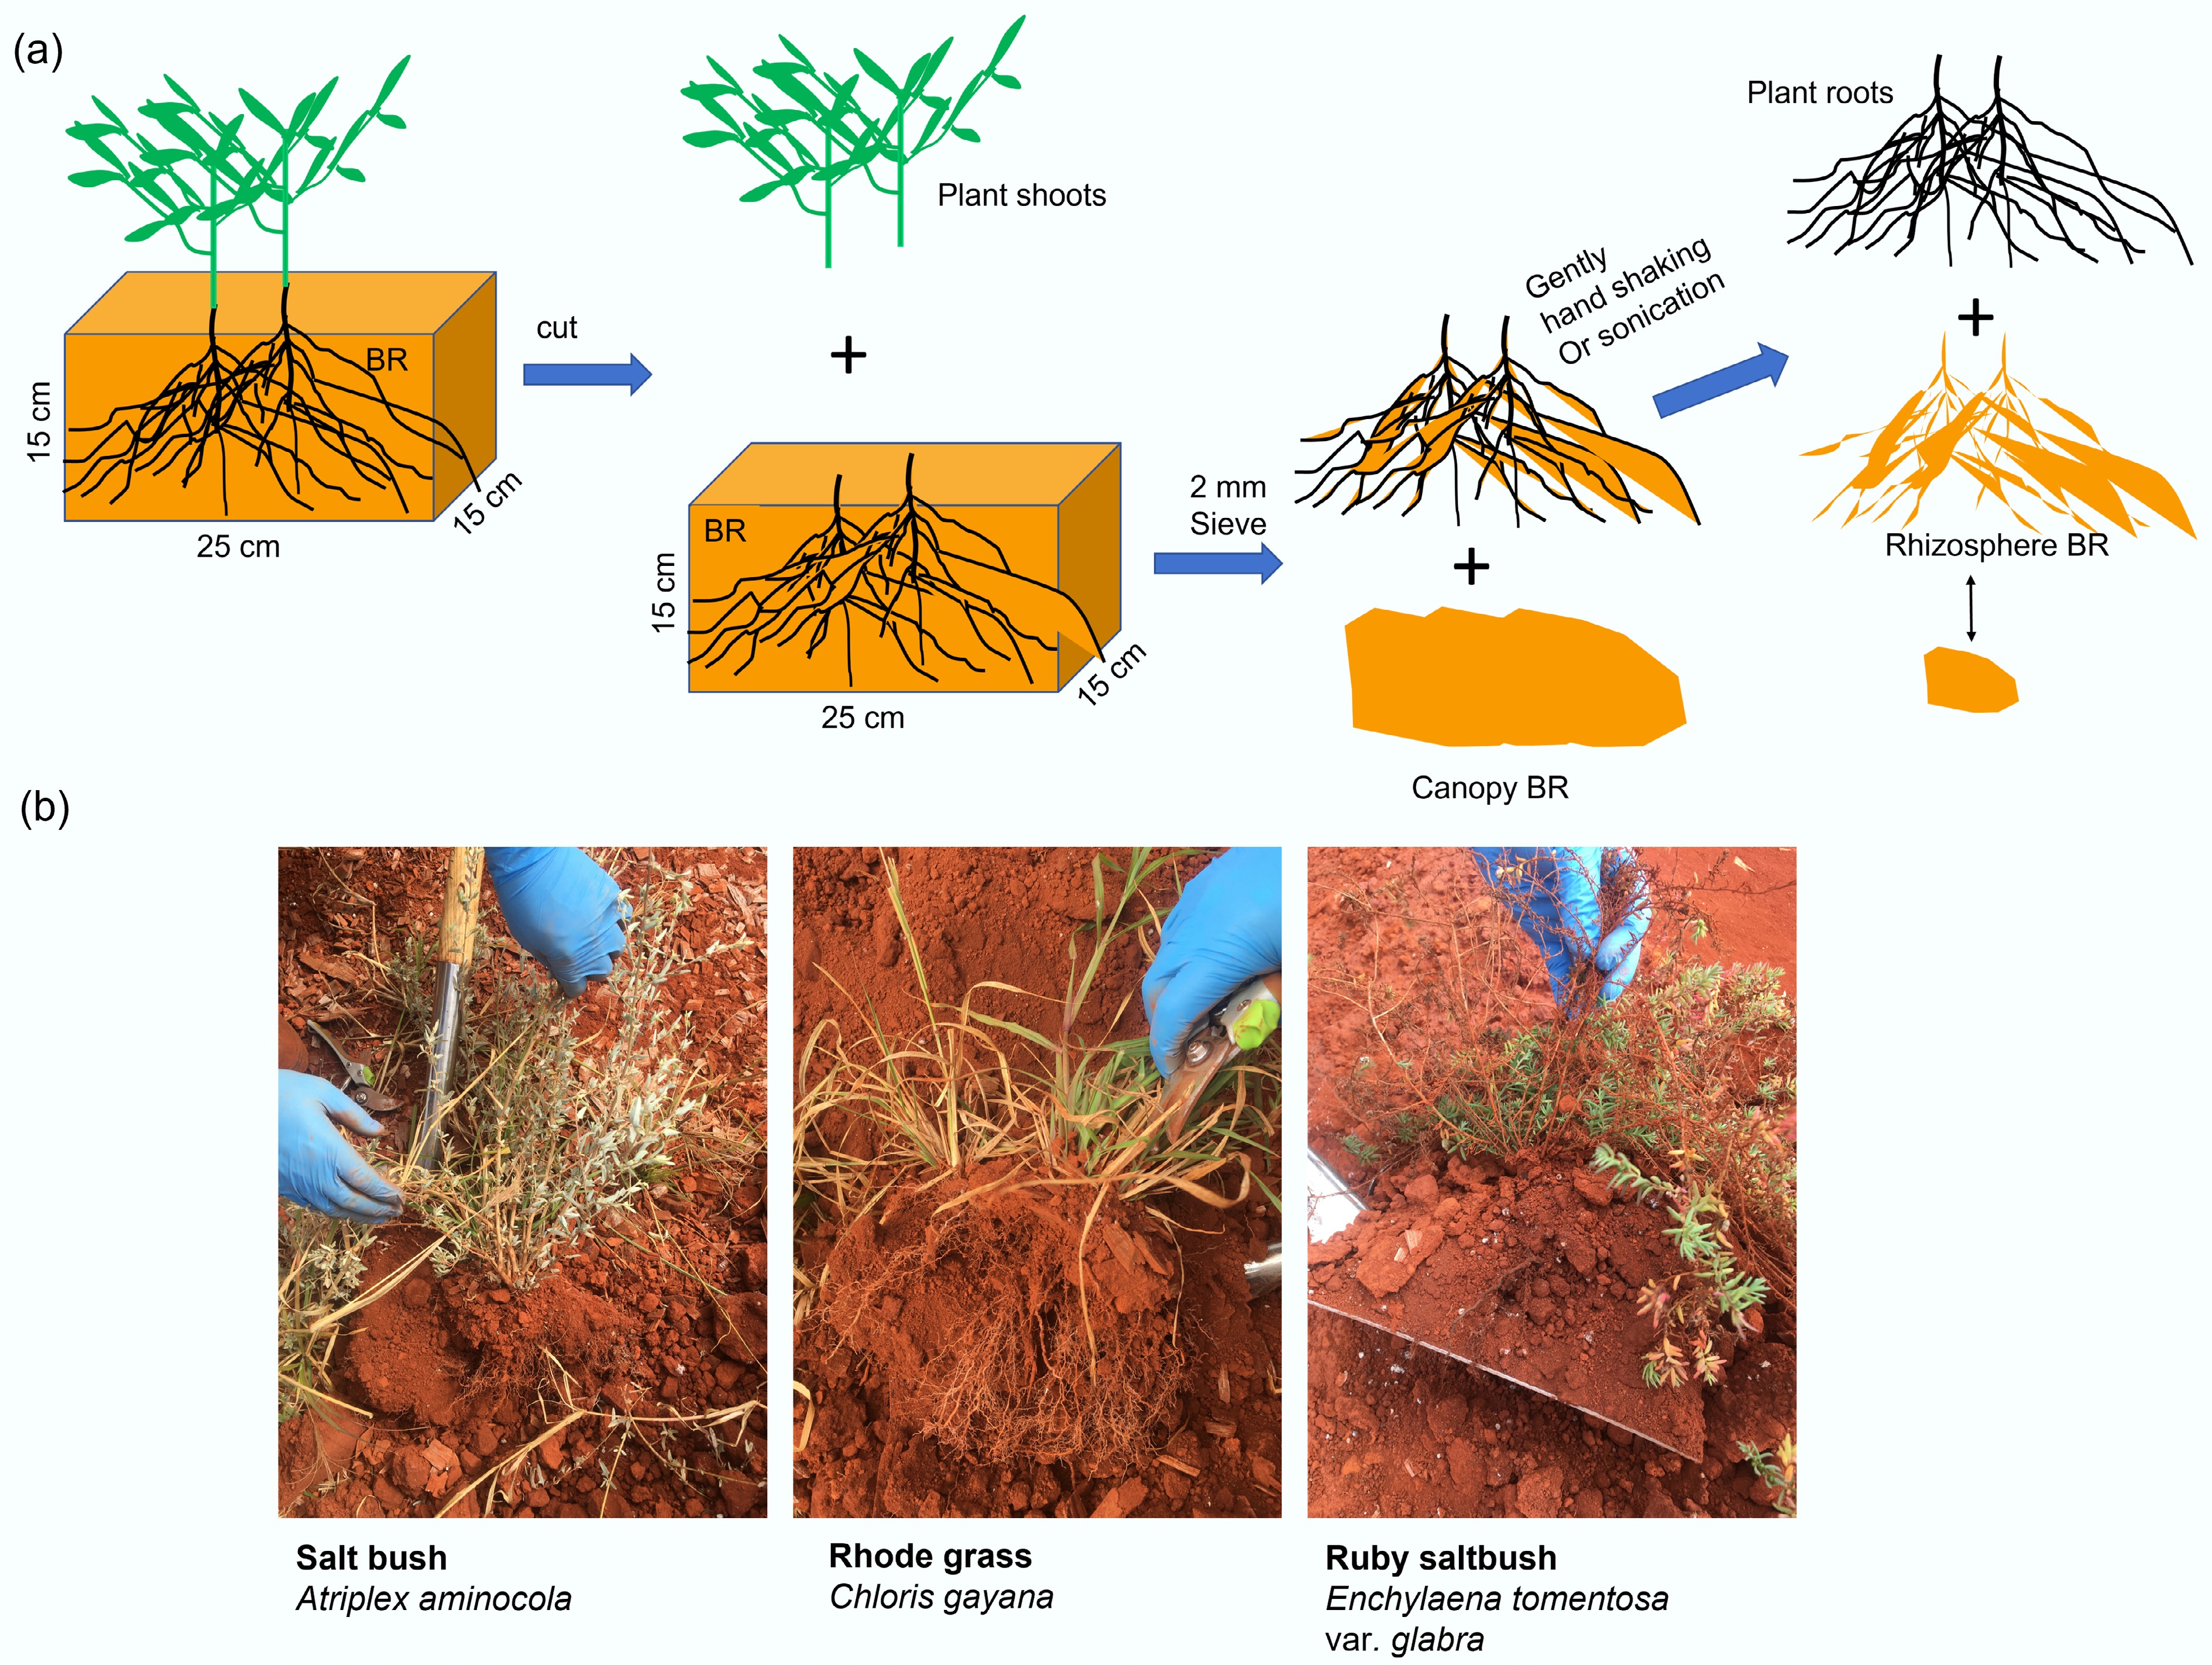
Figure 1.
(a) Diagram and (b) photos for sampling of rhizosphere bauxite residues in the field. The bauxite residue samples from the rhizosphere of individual plants species were collected, including saltbush (Atriplex aminocola), Rhodes grass (Chloris gayana), and Ruby saltbush (Enchylaena tomentosa var. glabra).
-
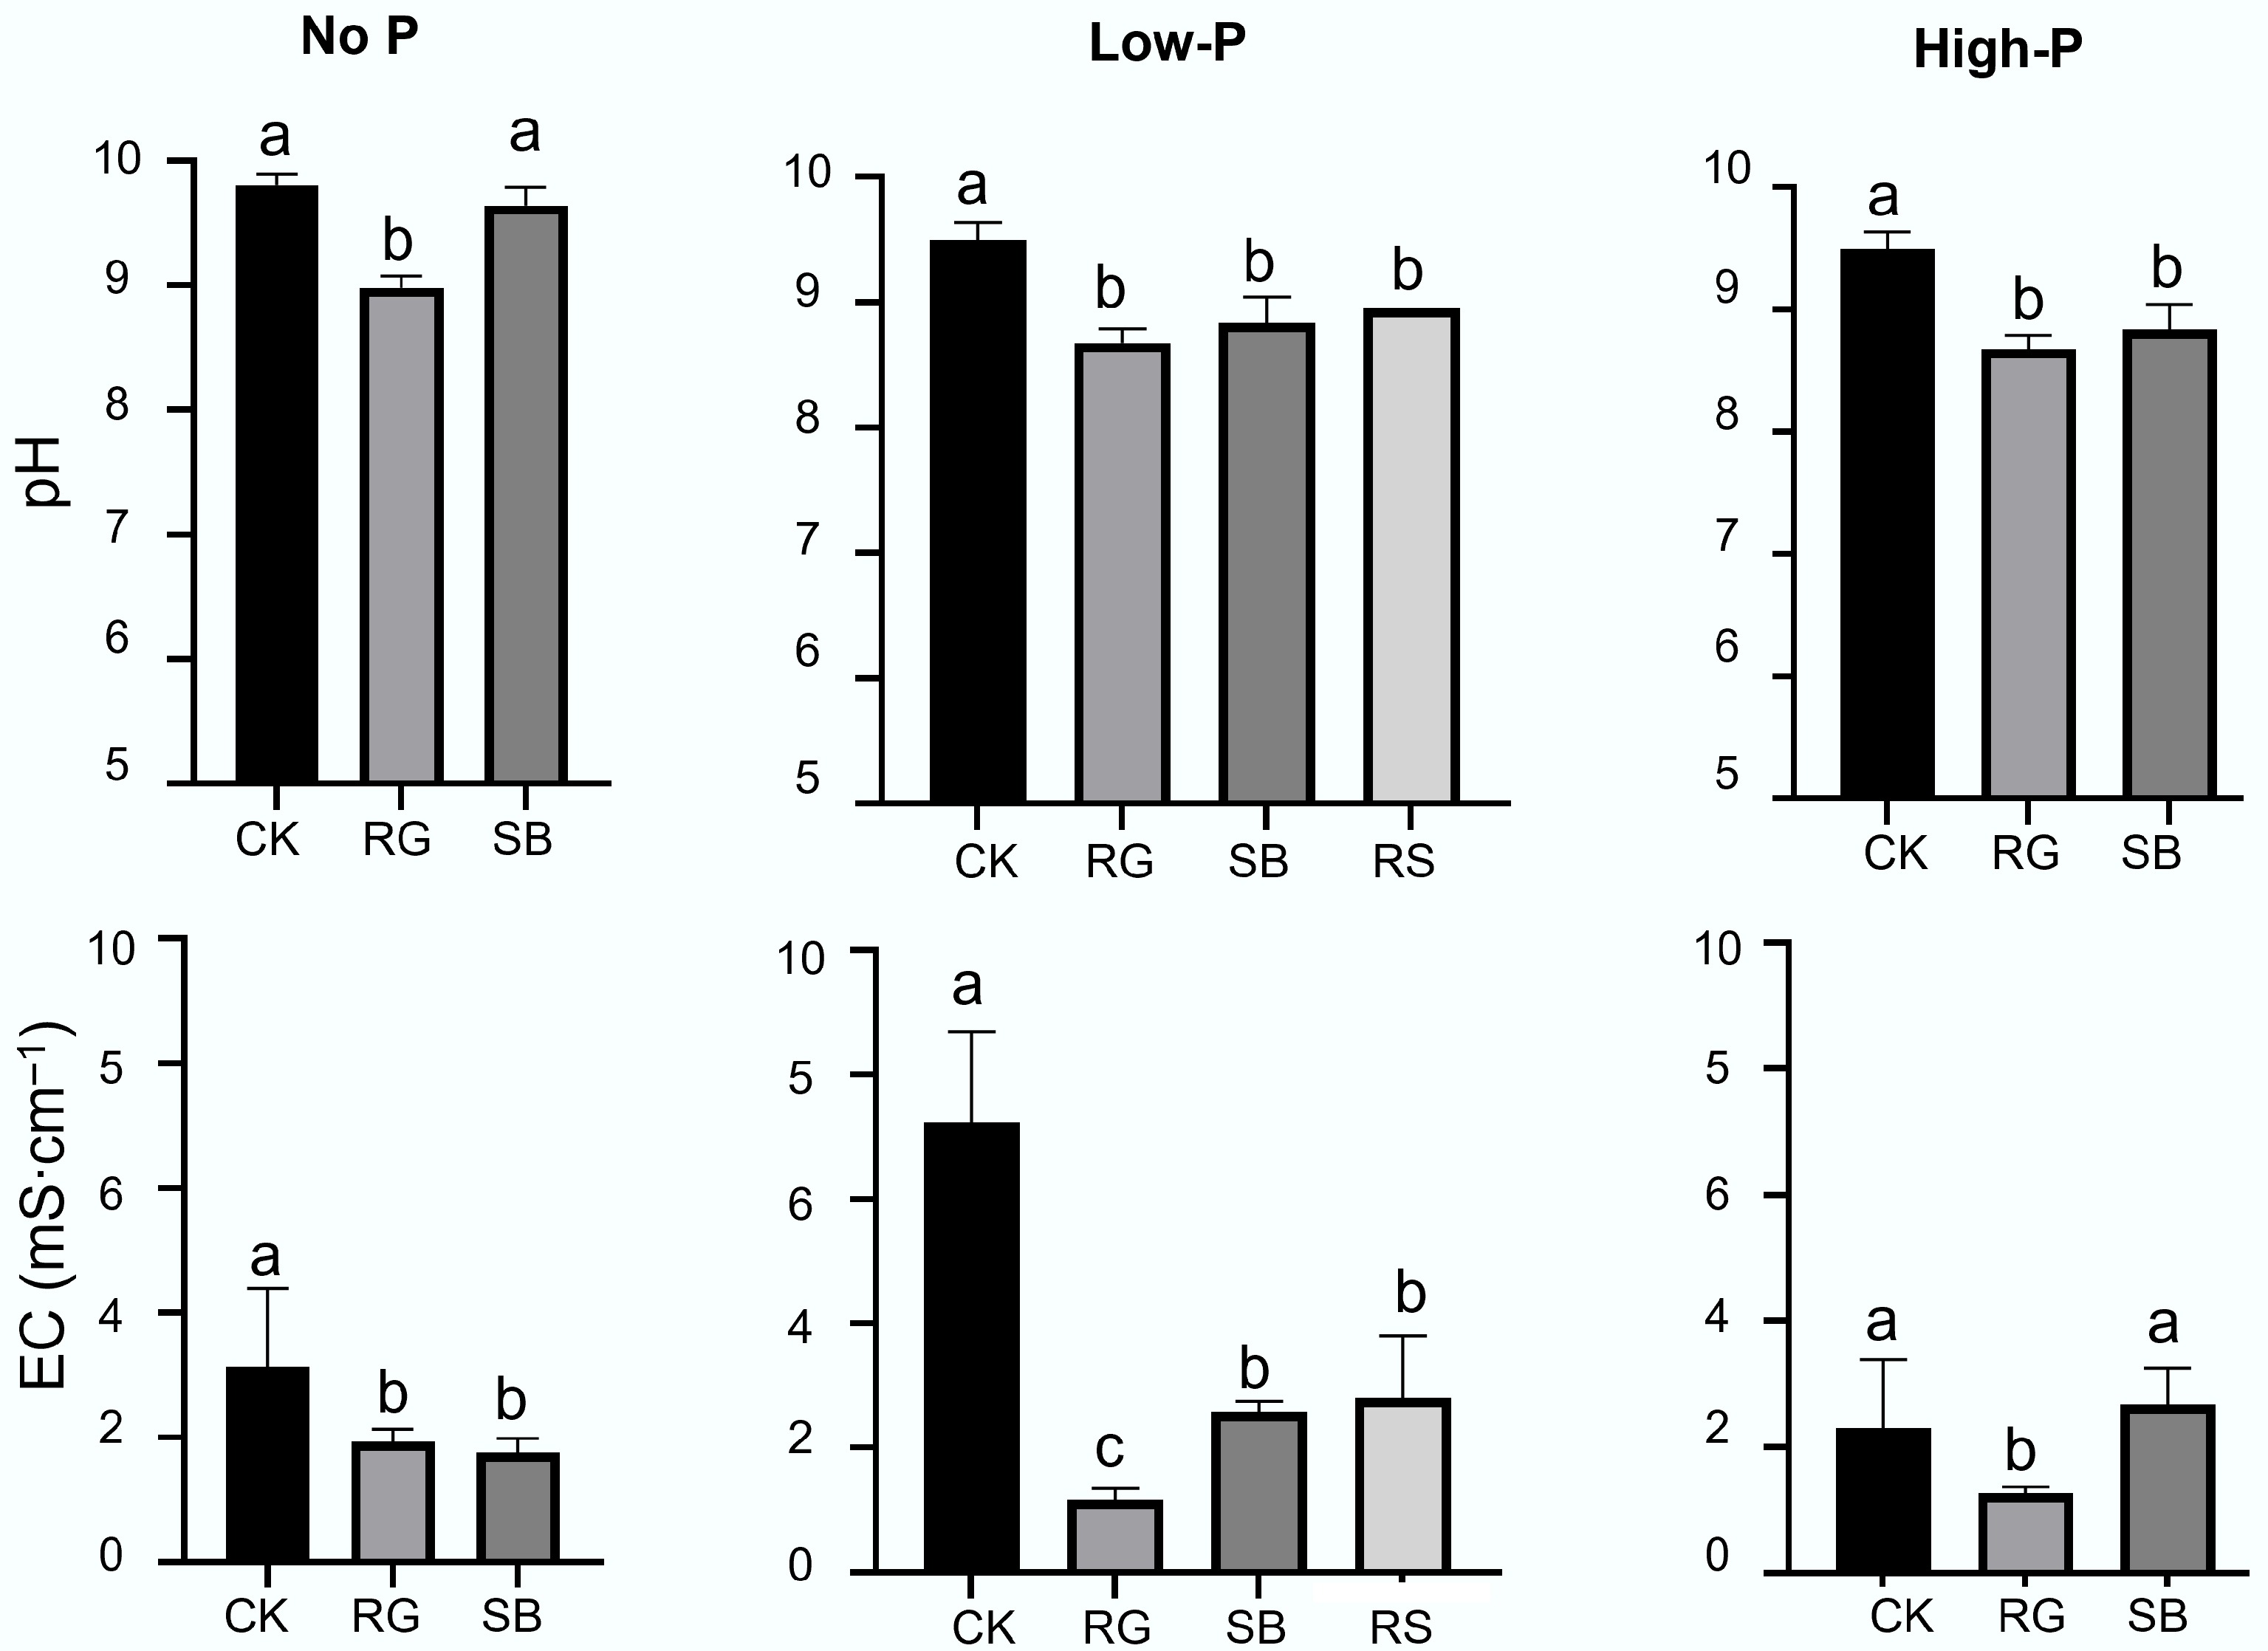
Figure 2.
The pH and electrical conductivity (EC) of bulk and rhizosphere of various plants grown in bauxite residues (BR) in the field trial. Note: CK: bulk samples without plant colonization; SB: rhizosphere of saltbush (Atriplex aminocola); RG: rhizosphere of Rhodes grass (Chloris gayana)); RS: rhizosphere of Ruby saltbush (Enchylaena tomentosa var. glabra). 'No P', 'Low P' and 'High P' represent the apply of super-phosphate (super-P) at rates (kg P ha−1) of 0, 95, and 250, respectively. Different letters show significant differences among treatments as revealed by ANOVA followed by Tukey's test (p < 0.05, n = 4).
-

Figure 3.
Mineral phases in rhizosphere and bulk bauxite residue treated with low rate of superphosphate amendment, as revealed by (a) synchrotron-based XRD, (b), (c) Fe K edge XAFS analysis, (d) Al and Si K edge XAFS, and (e) ATR-FTIR analysis. In the Fe K edge XAFS analysis, k space (k weighted 3) of Fe K-edge EXAFS spectra (line) and linear combination fitting (LCF, dashed) of the Fe phases in the rhizosphere or bulk BR are shown in (c). Fe K edge XAFS spectra of several key Fe standards are also presented, including ferrihydrite, Fe-Si-short range ordered (SRO), magnetite, hematite, Fe(III)-oxalate and schwertmannite. Note: Fe(III)-Si-SRO were synthesized by hydrolysing Fe(III) nitrate in the presence of SiO3 ligands (Na2SiO3) at ca. pH = 9. CK: bulk samples without plant colonization; SB: rhizosphere of saltbush (Atriplex aminocola); RG: rhizosphere of Rhodes grass (Chloris gayana)); RS: rhizosphere of Ruby saltbush (Enchylaena tomentosa var. glabra).
-
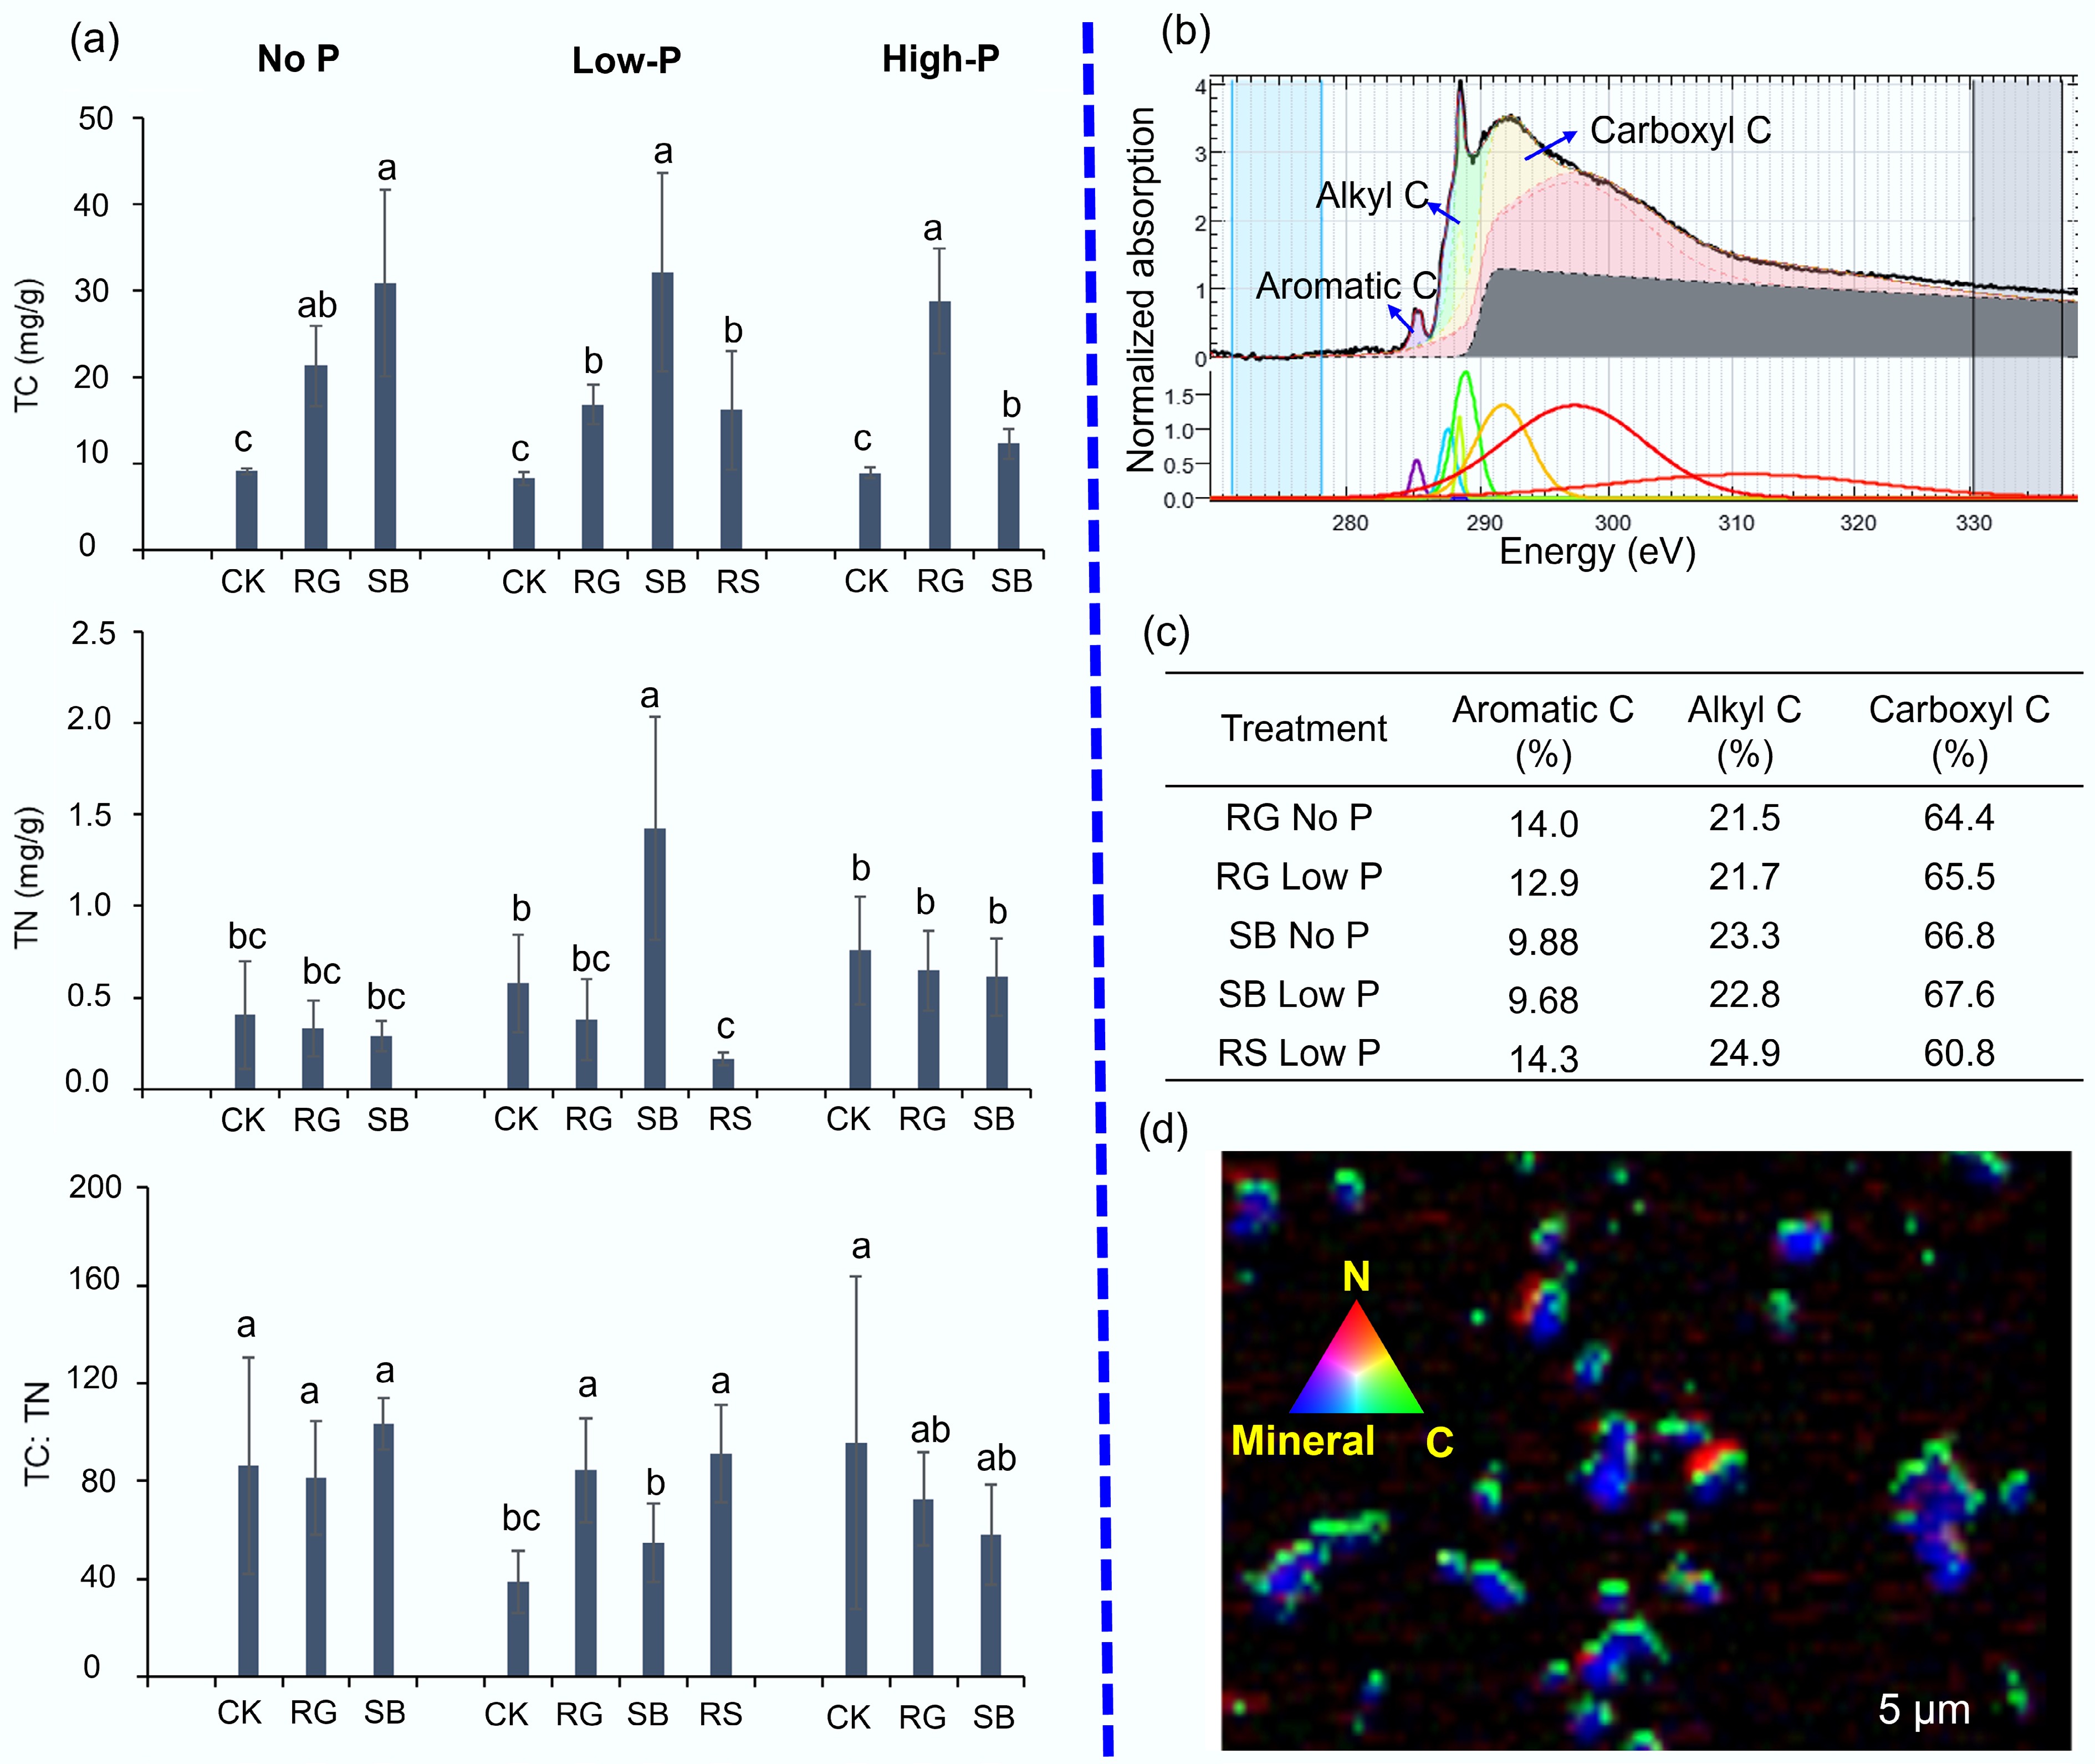
Figure 4.
Organic carbon chemistry in rhizosphere bauxite residues (BR). (a) Total carbon (TC) and total nitrogen (TN) concentration, as well as the TC:TN ratio in rhizosphere and bulk bauxite residue. (b), (c) Carbon forms in rhizosphere BR as revealed by synchrotron-based C K edge NEXAFS analysis. (d) Spatial distribution of C, N, and minerals in the rhizosphere of saltbush (Atriplex aminocola) as revealed by synchrotron-based scanning transmission X-ray microscopy (STXM). In (a), different letters show significant differences among treatments as revealed by ANOVA followed by Tukey's test (p < 0.05). In (d), OD values for N, C, and minerals are 0–0.3, 0–3.37, and 0–2.35, respectively. Note: CK: bulk samples without plants; SB: rhizosphere of saltbush; RG: rhizosphere of Rhodes grass; RS: rhizosphere of Ruby saltbush. The treatments 'No P', 'Low P', and 'High P' as in the Materials and methods.
-
Treatment Percentage (w%) Gibbsite Quartz Boehmite Anatase Hematite Sodalite Rutile Kaolinite Cancrinite Calcite Amorphous CK No P 0.28 1.02 2.48 0.81 21.3 10.6 1.03 1.33 0.59 1.23 59.3 RG No P 0.39 4.98 0.55 0.56 19.3 6.05 1.02 6.79 0.53 0.59 59.3 SB No P 0.25 2.53 0.47 0.75 21.2 6.14 1.03 9.70 0.80 1.02 56.1 CK Low P 0.57 1.83 4.13 0.79 25.8 12.6 1.38 2.88 0.83 0.93 48.2 RG Low P 0.57 4.21 1.10 1.15 26.9 9.35 1.65 9.14 0.63 0.81 44.5 SB Low P 1.14 4.92 0.83 0.78 23.9 8.71 1.13 8.62 0.80 0.68 48.4 RS Low P 0.78 3.45 1.26 0.37 15.6 5.87 0.86 6.65 0.53 0.51 64.1 CK High P 0.38 1.22 4.65 1.07 30.4 14.1 1.39 4.67 0.73 1.33 40.1 RG High P 0.48 2.45 0.53 0.93 19.8 7.02 1.38 6.83 0.18 0.46 59.9 SB High P 0.28 2.19 0.84 0.90 22.6 8.56 1.27 7.85 0.88 0.73 53.9 CK: bulk samples without plant colonization; SB: rhizosphere of saltbush (Atriplex aminocola); RG: rhizosphere of Rhodes grass (Chloris gayana)); RS: rhizosphere of Ruby saltbush (Enchylaena tomentosa var. glabra). The treatments 'No P', 'Low P', and 'High P' represent the amendment of super-phosphate (super-P) at rates (kg P/ha) of 0 (No P), 95 (Low P), and 250 (High P), respectively. Table 1.
The mineral phase components (percentage % w/w) in bauxite residues in the field trial
Figures
(4)
Tables
(1)