-
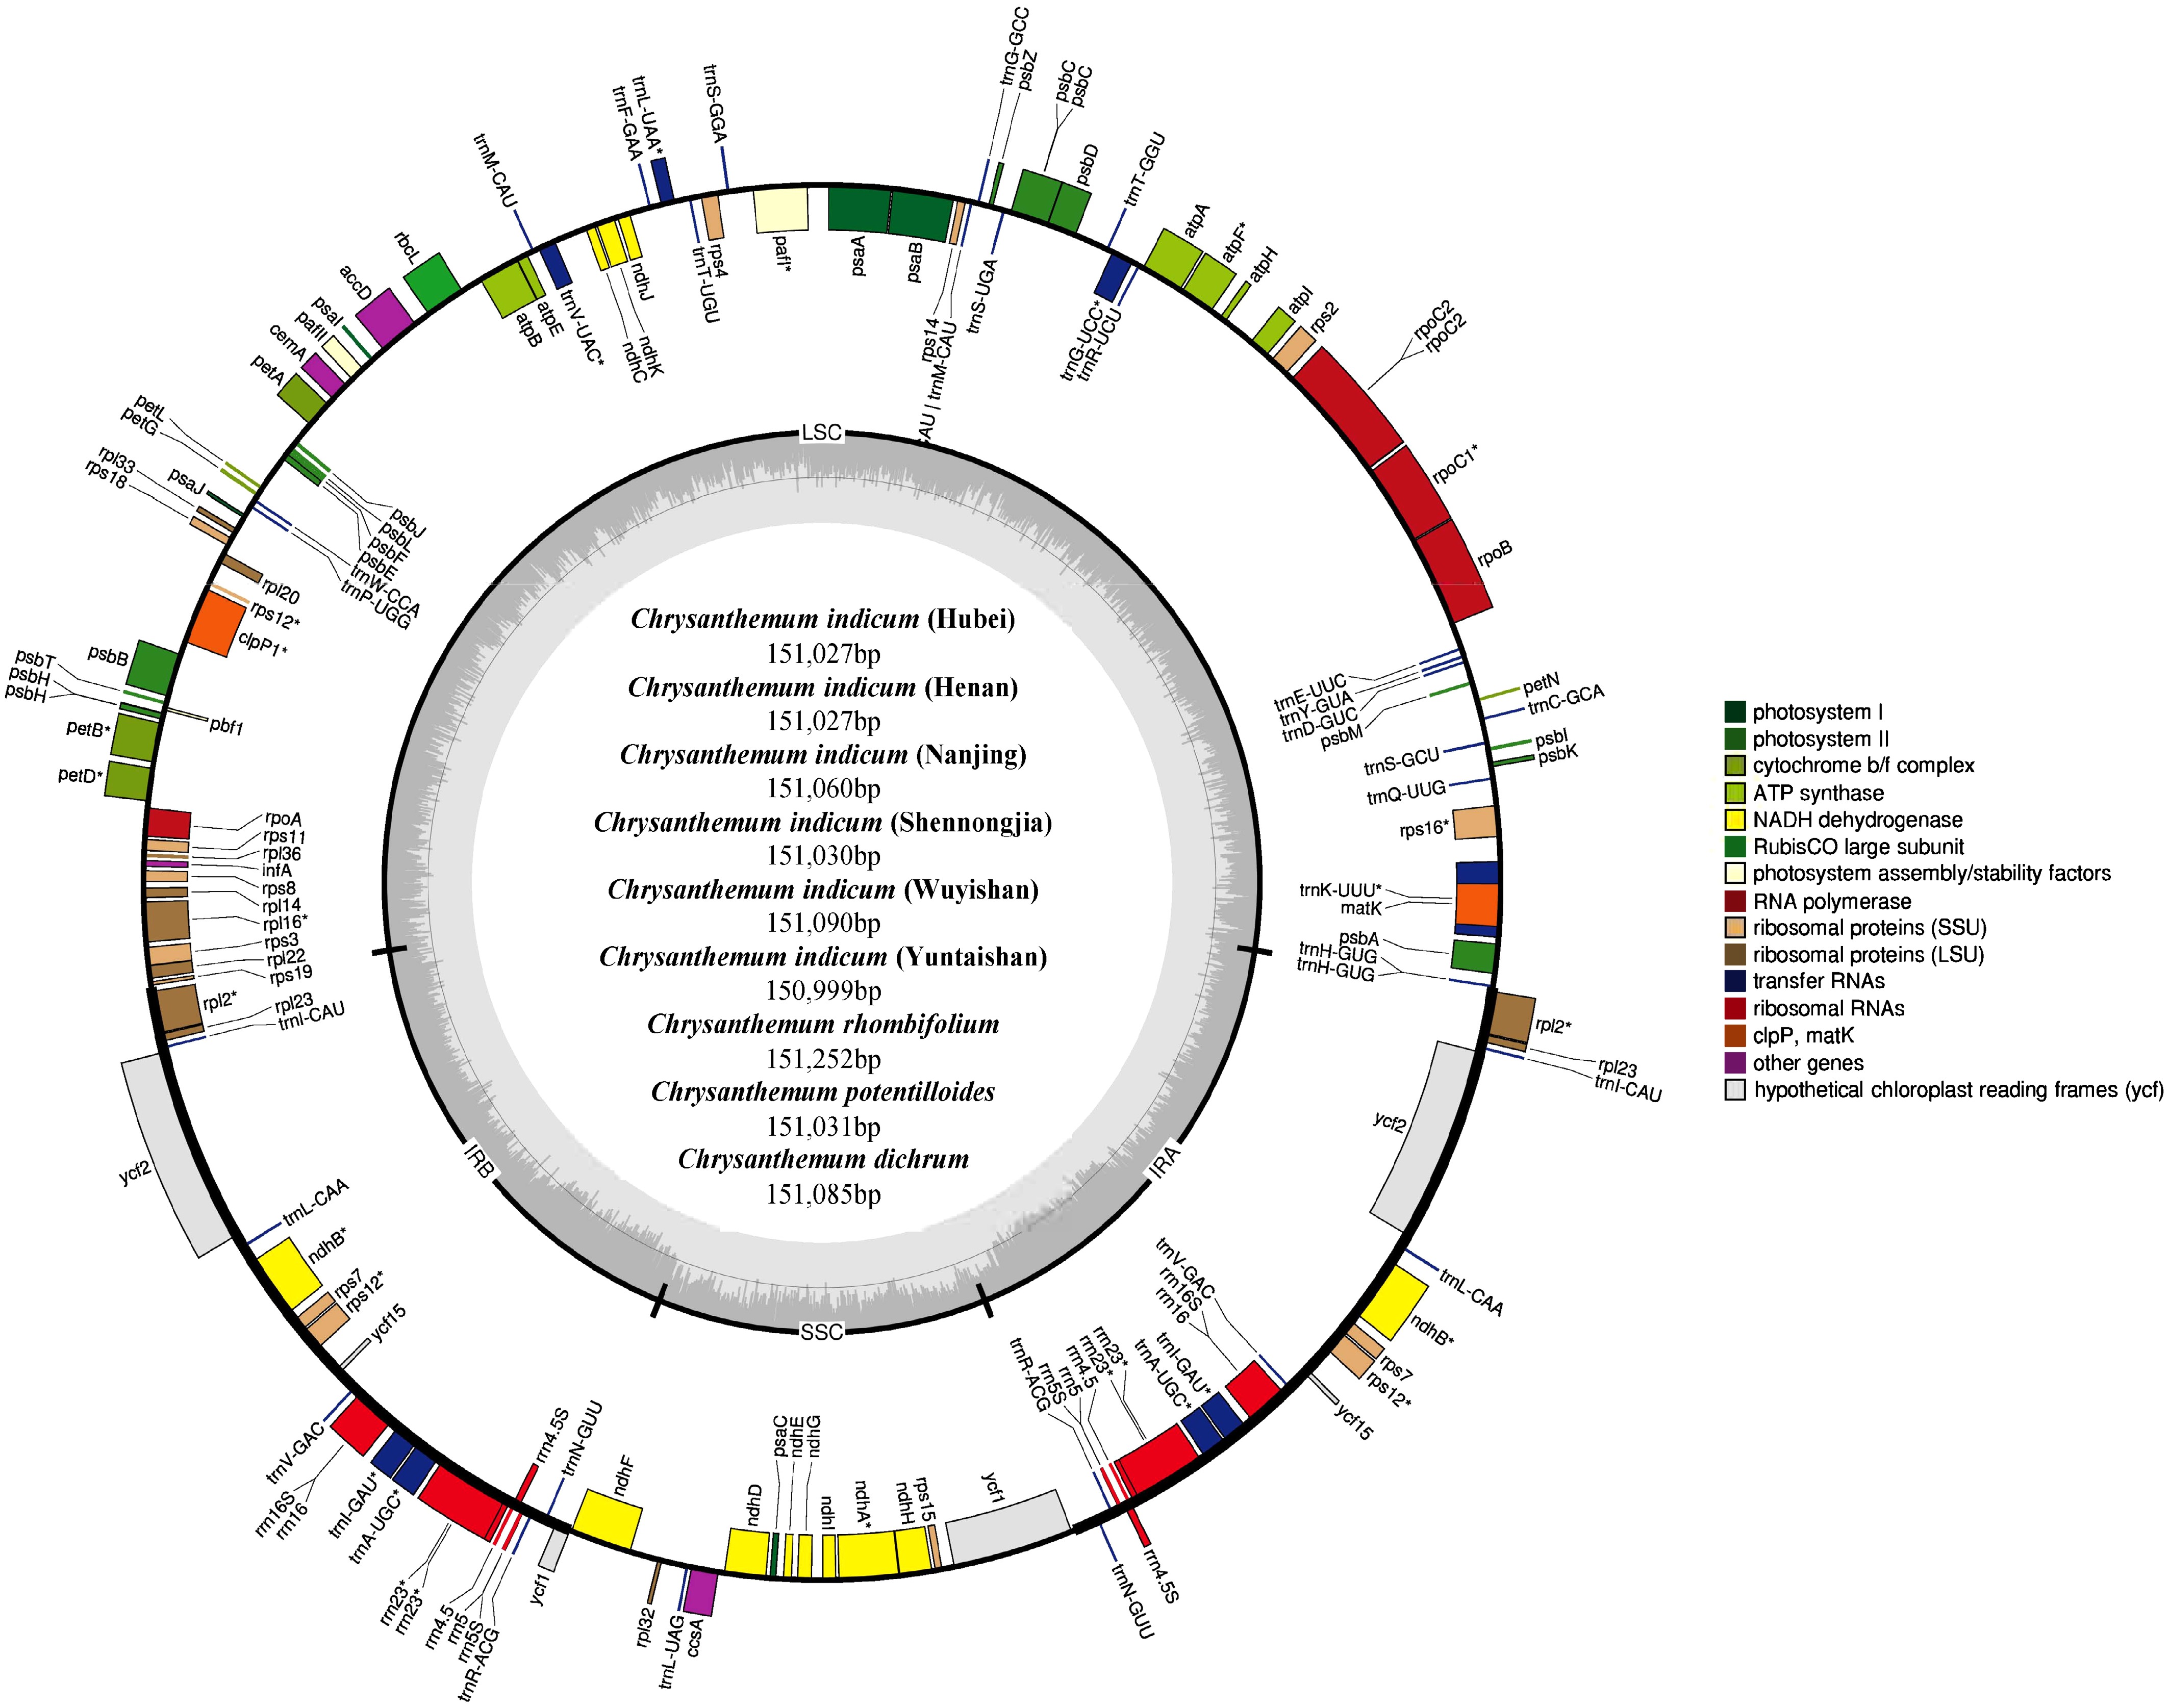
Figure 1.
The genome map of nine Chrysanthemum chloroplast genomes. Genes outside the circle were transcribed clockwise and those inside were transcribed counter-clockwise. Different gene functions are represented by different colors.
-
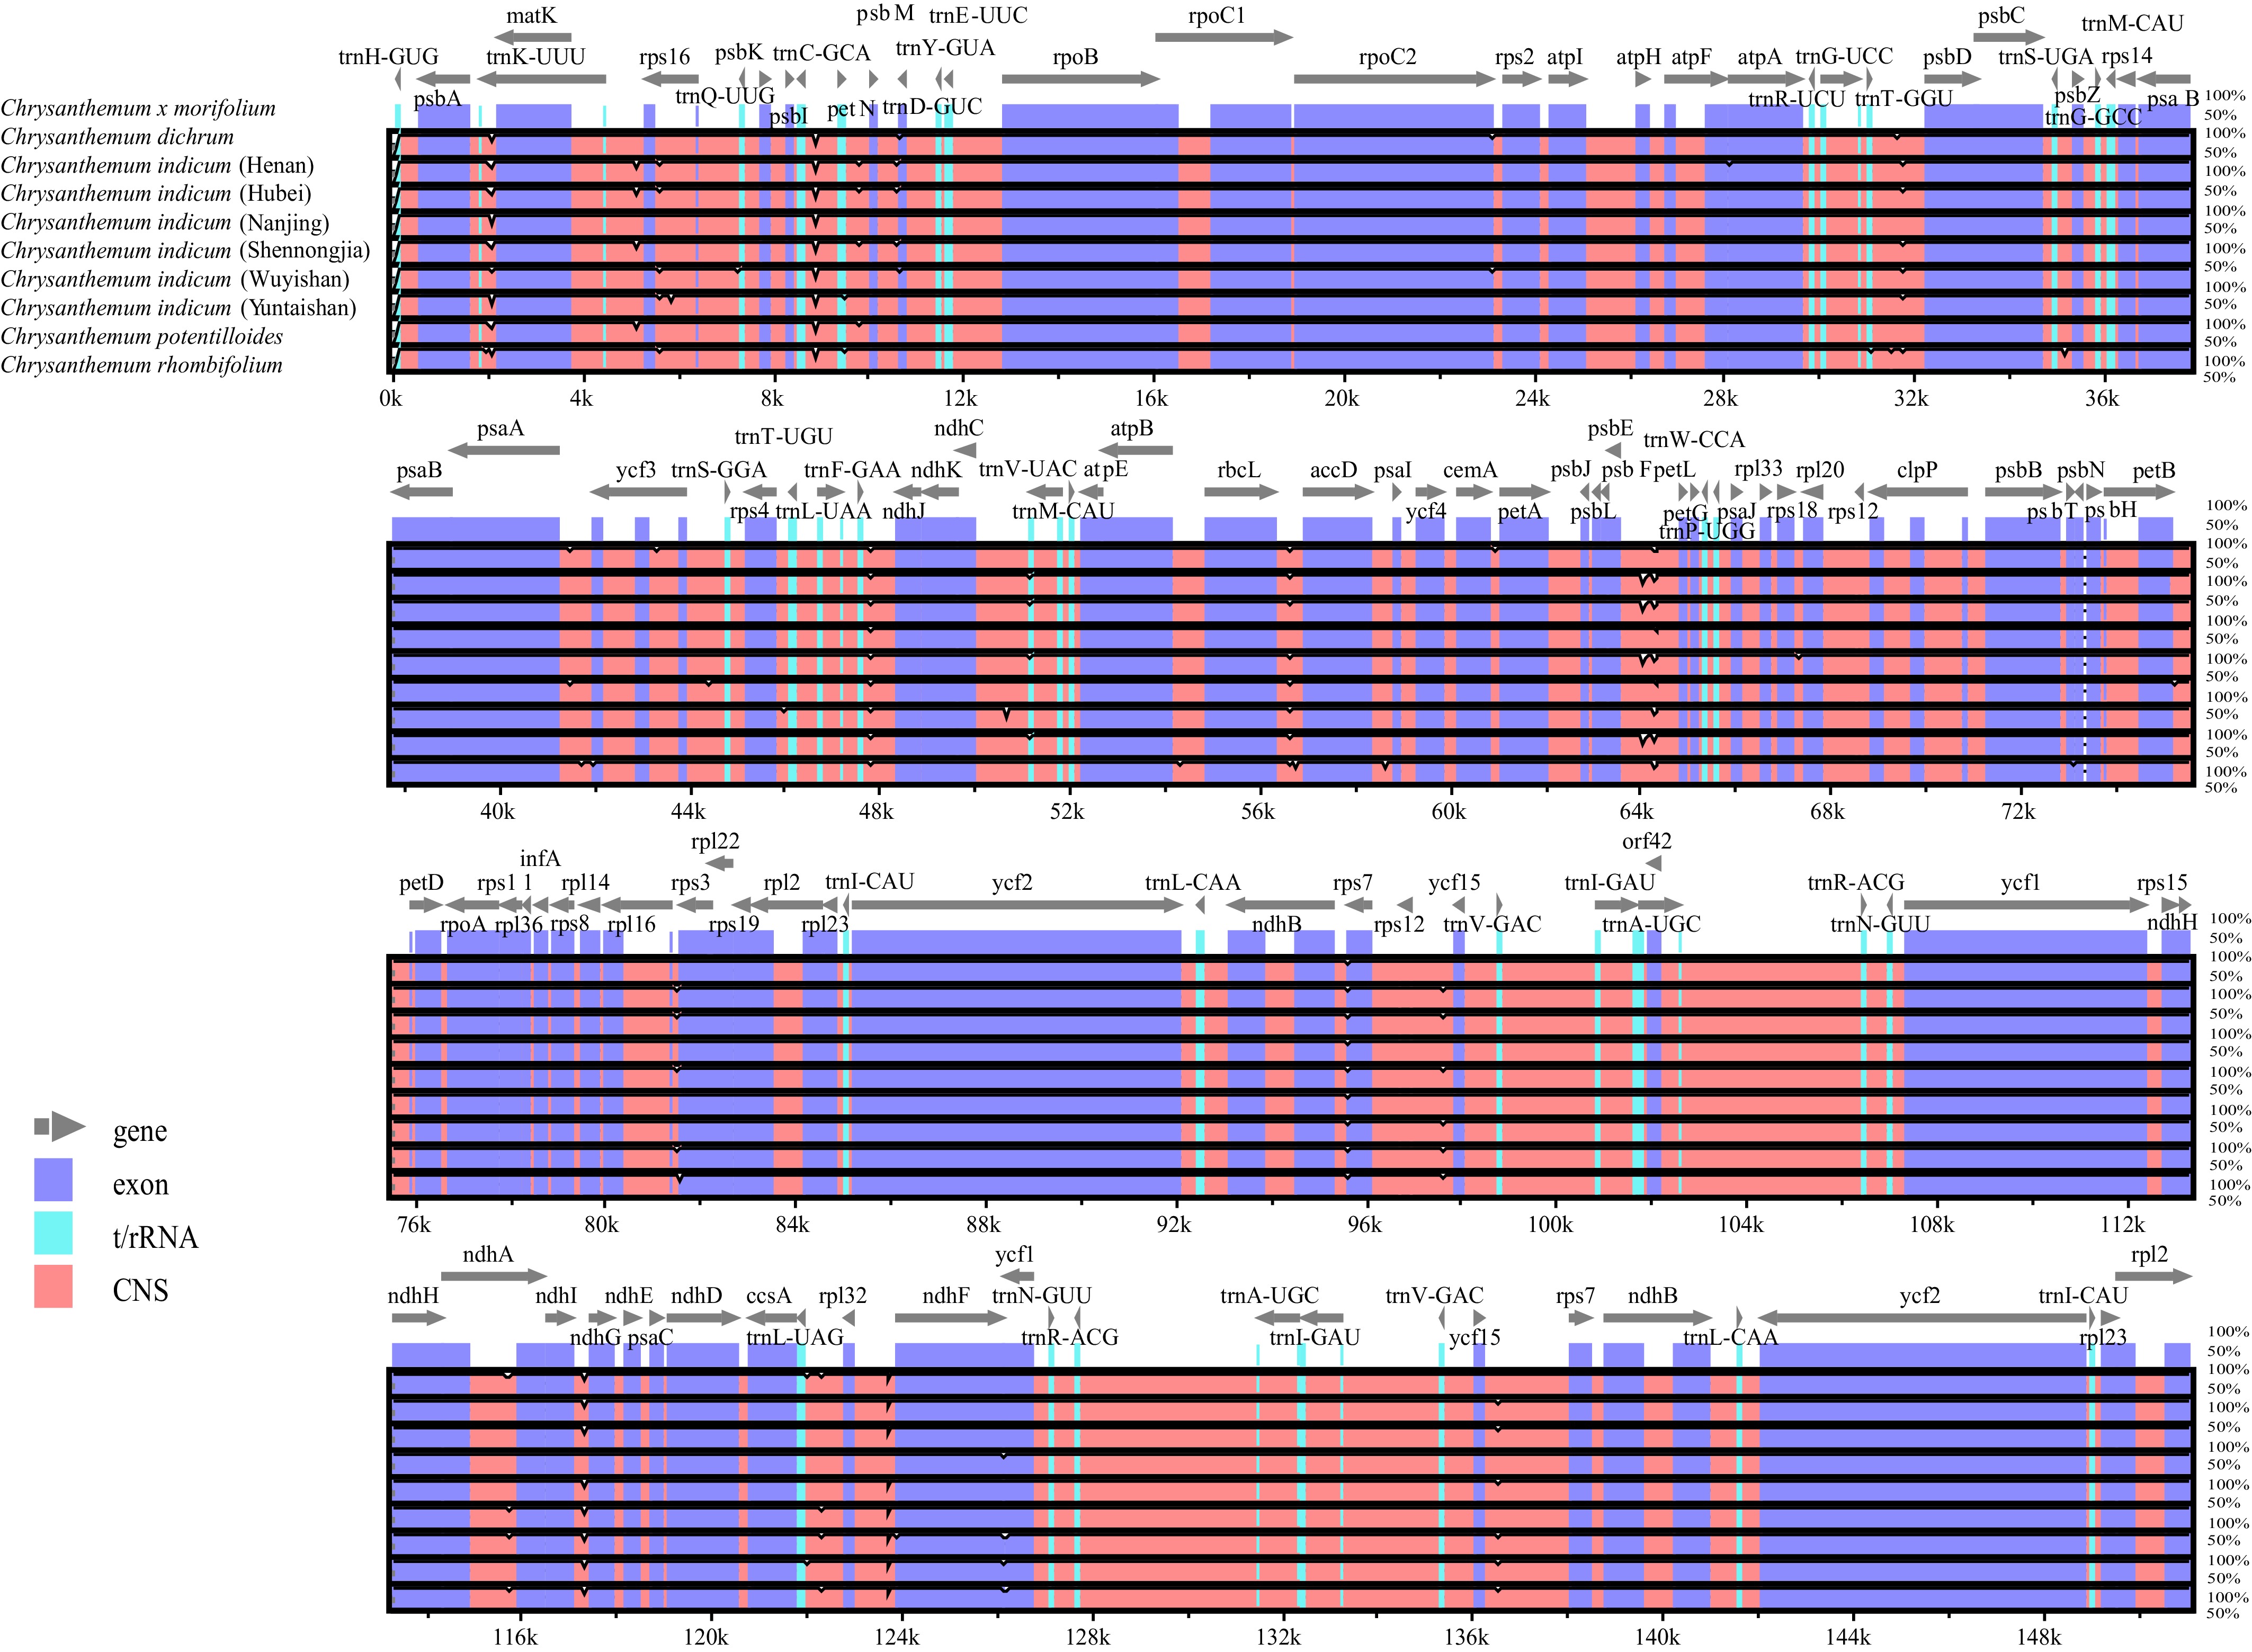
Figure 2.
Comparison of nine Chrysanthemum chloroplast genomes using the mVISTA program. Exons are presented in purple, t/rRNA is presented in blue, conserved non-coding sequences (CNS) are presented in pink.
-
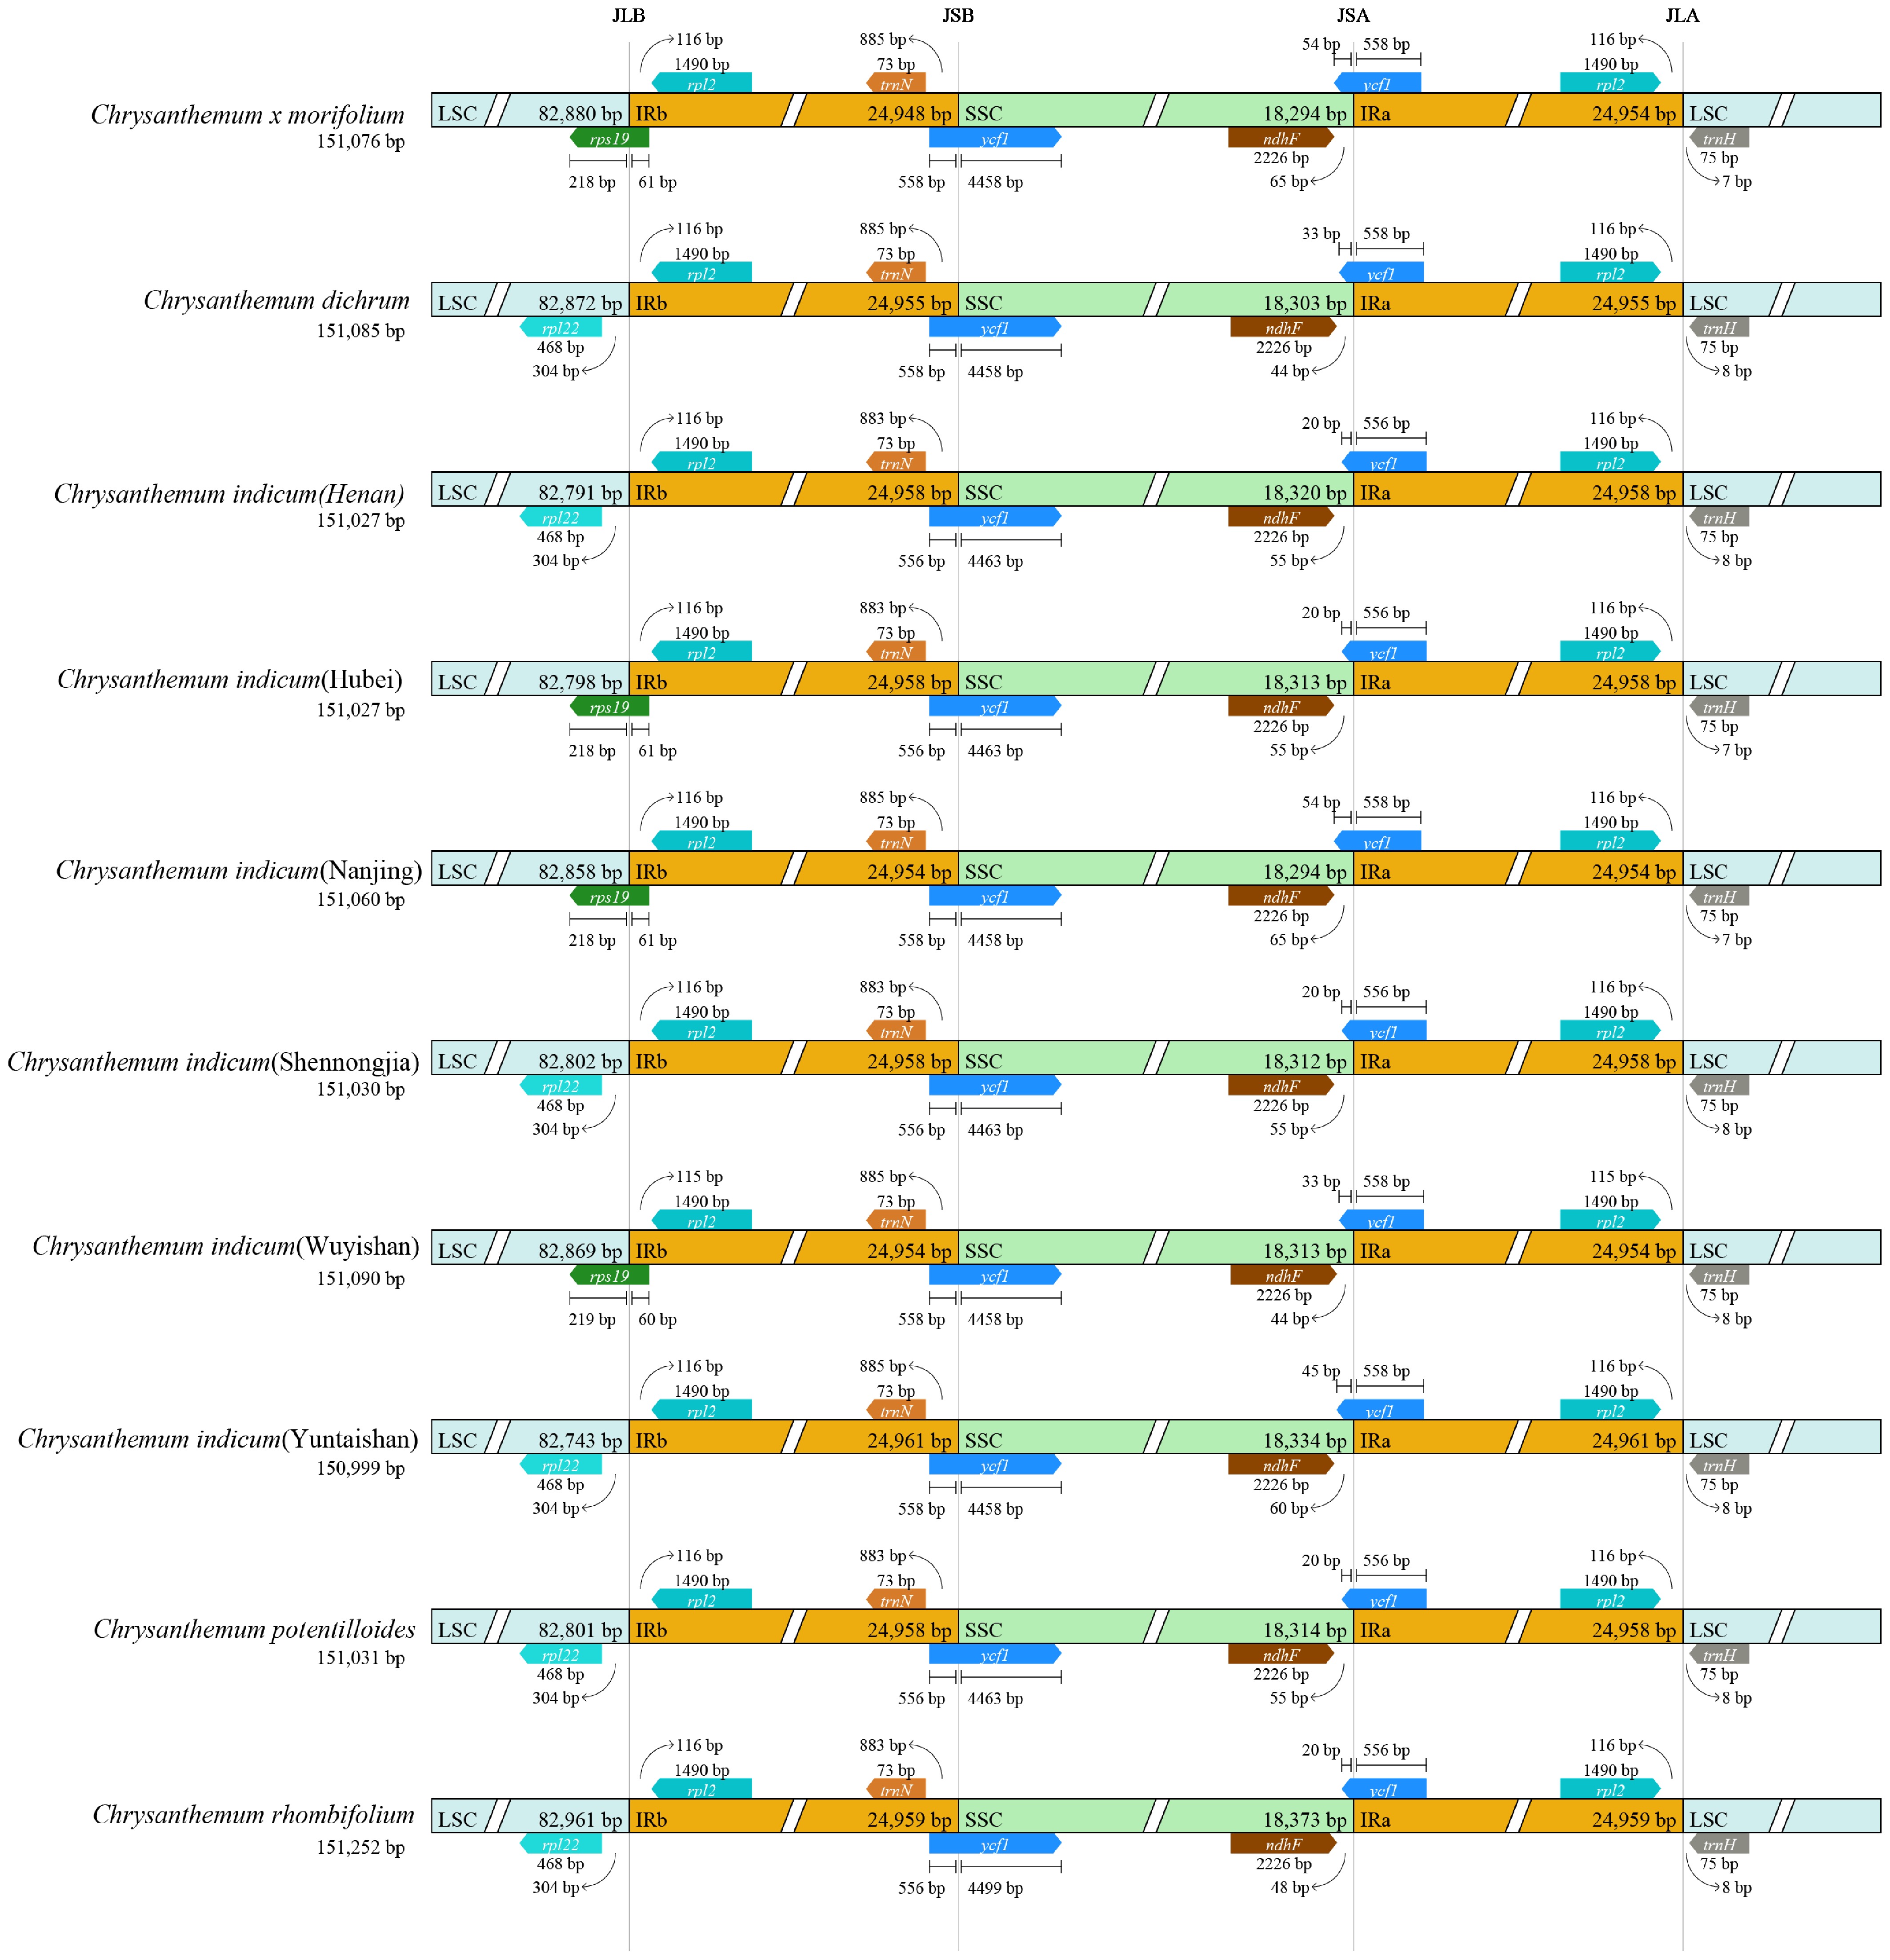
Figure 3.
The boundaries for comparing the inverted repeat (IR) and single copy (SC) regions among the chloroplast genomes of nine Chrysanthemum populations.
-
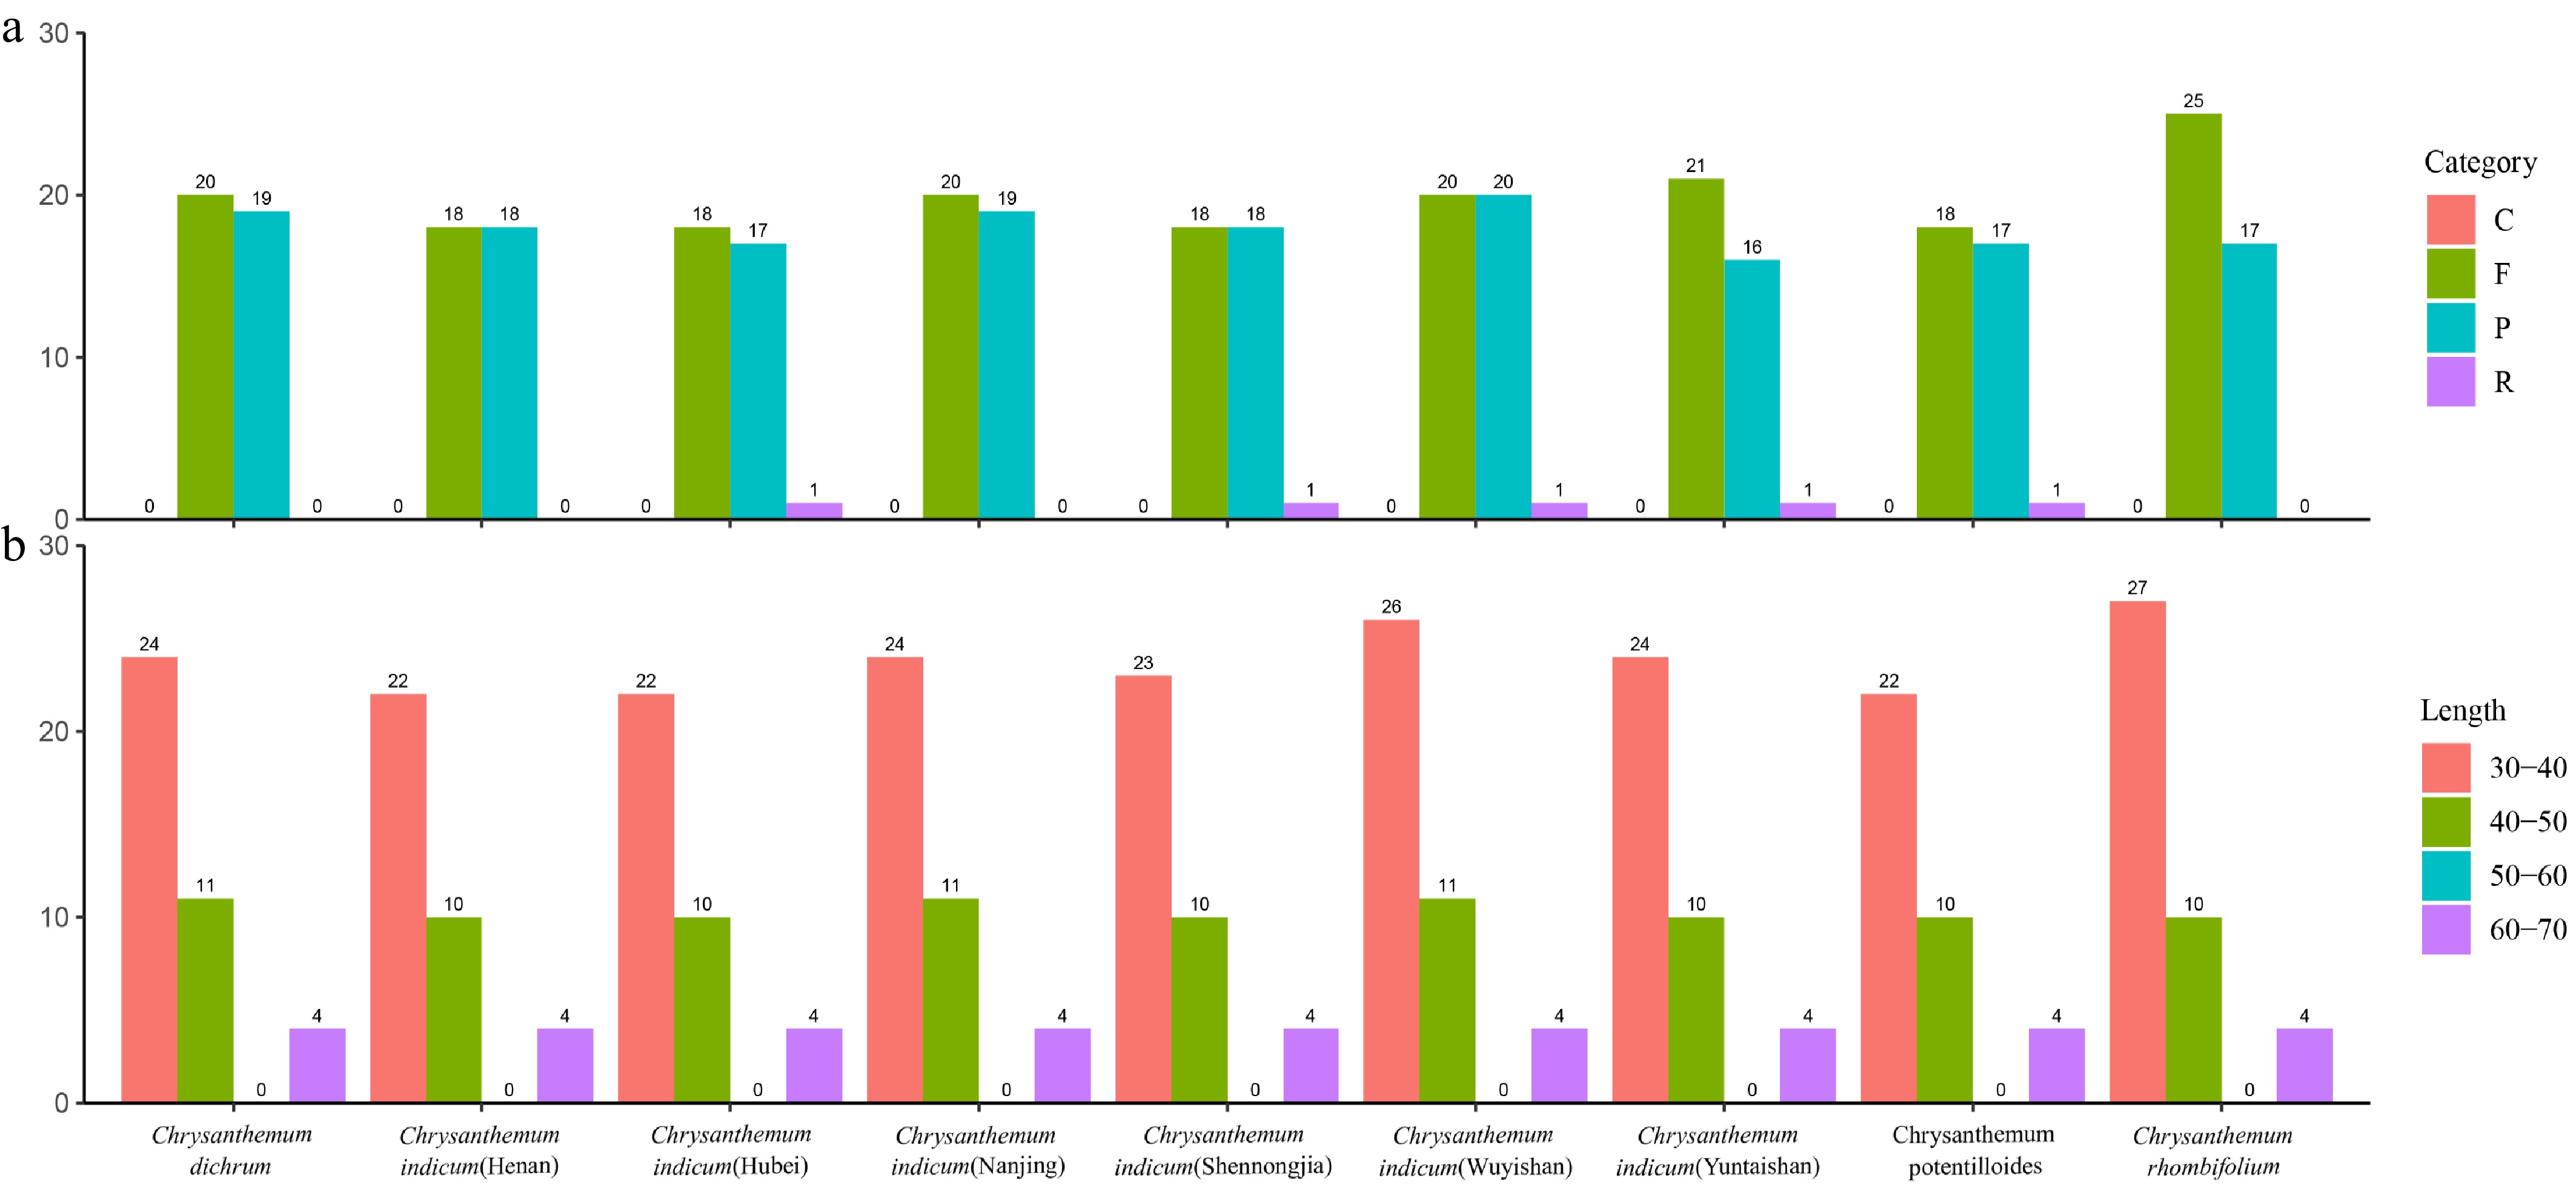
Figure 4.
Long repeat sequence analysis. (a) Palindromic repeats are presented in pink, forward repeats in green, reverse repeats in blue, and complement repeats in purple. (b) Repeats with a base length of 30–40 bp are presented in pink, repeats with a base length of 40–50 bp in green, repeats with a base length of 50–60 bp in blue, and repeats with a base length of 60–70 bp in purple.
-
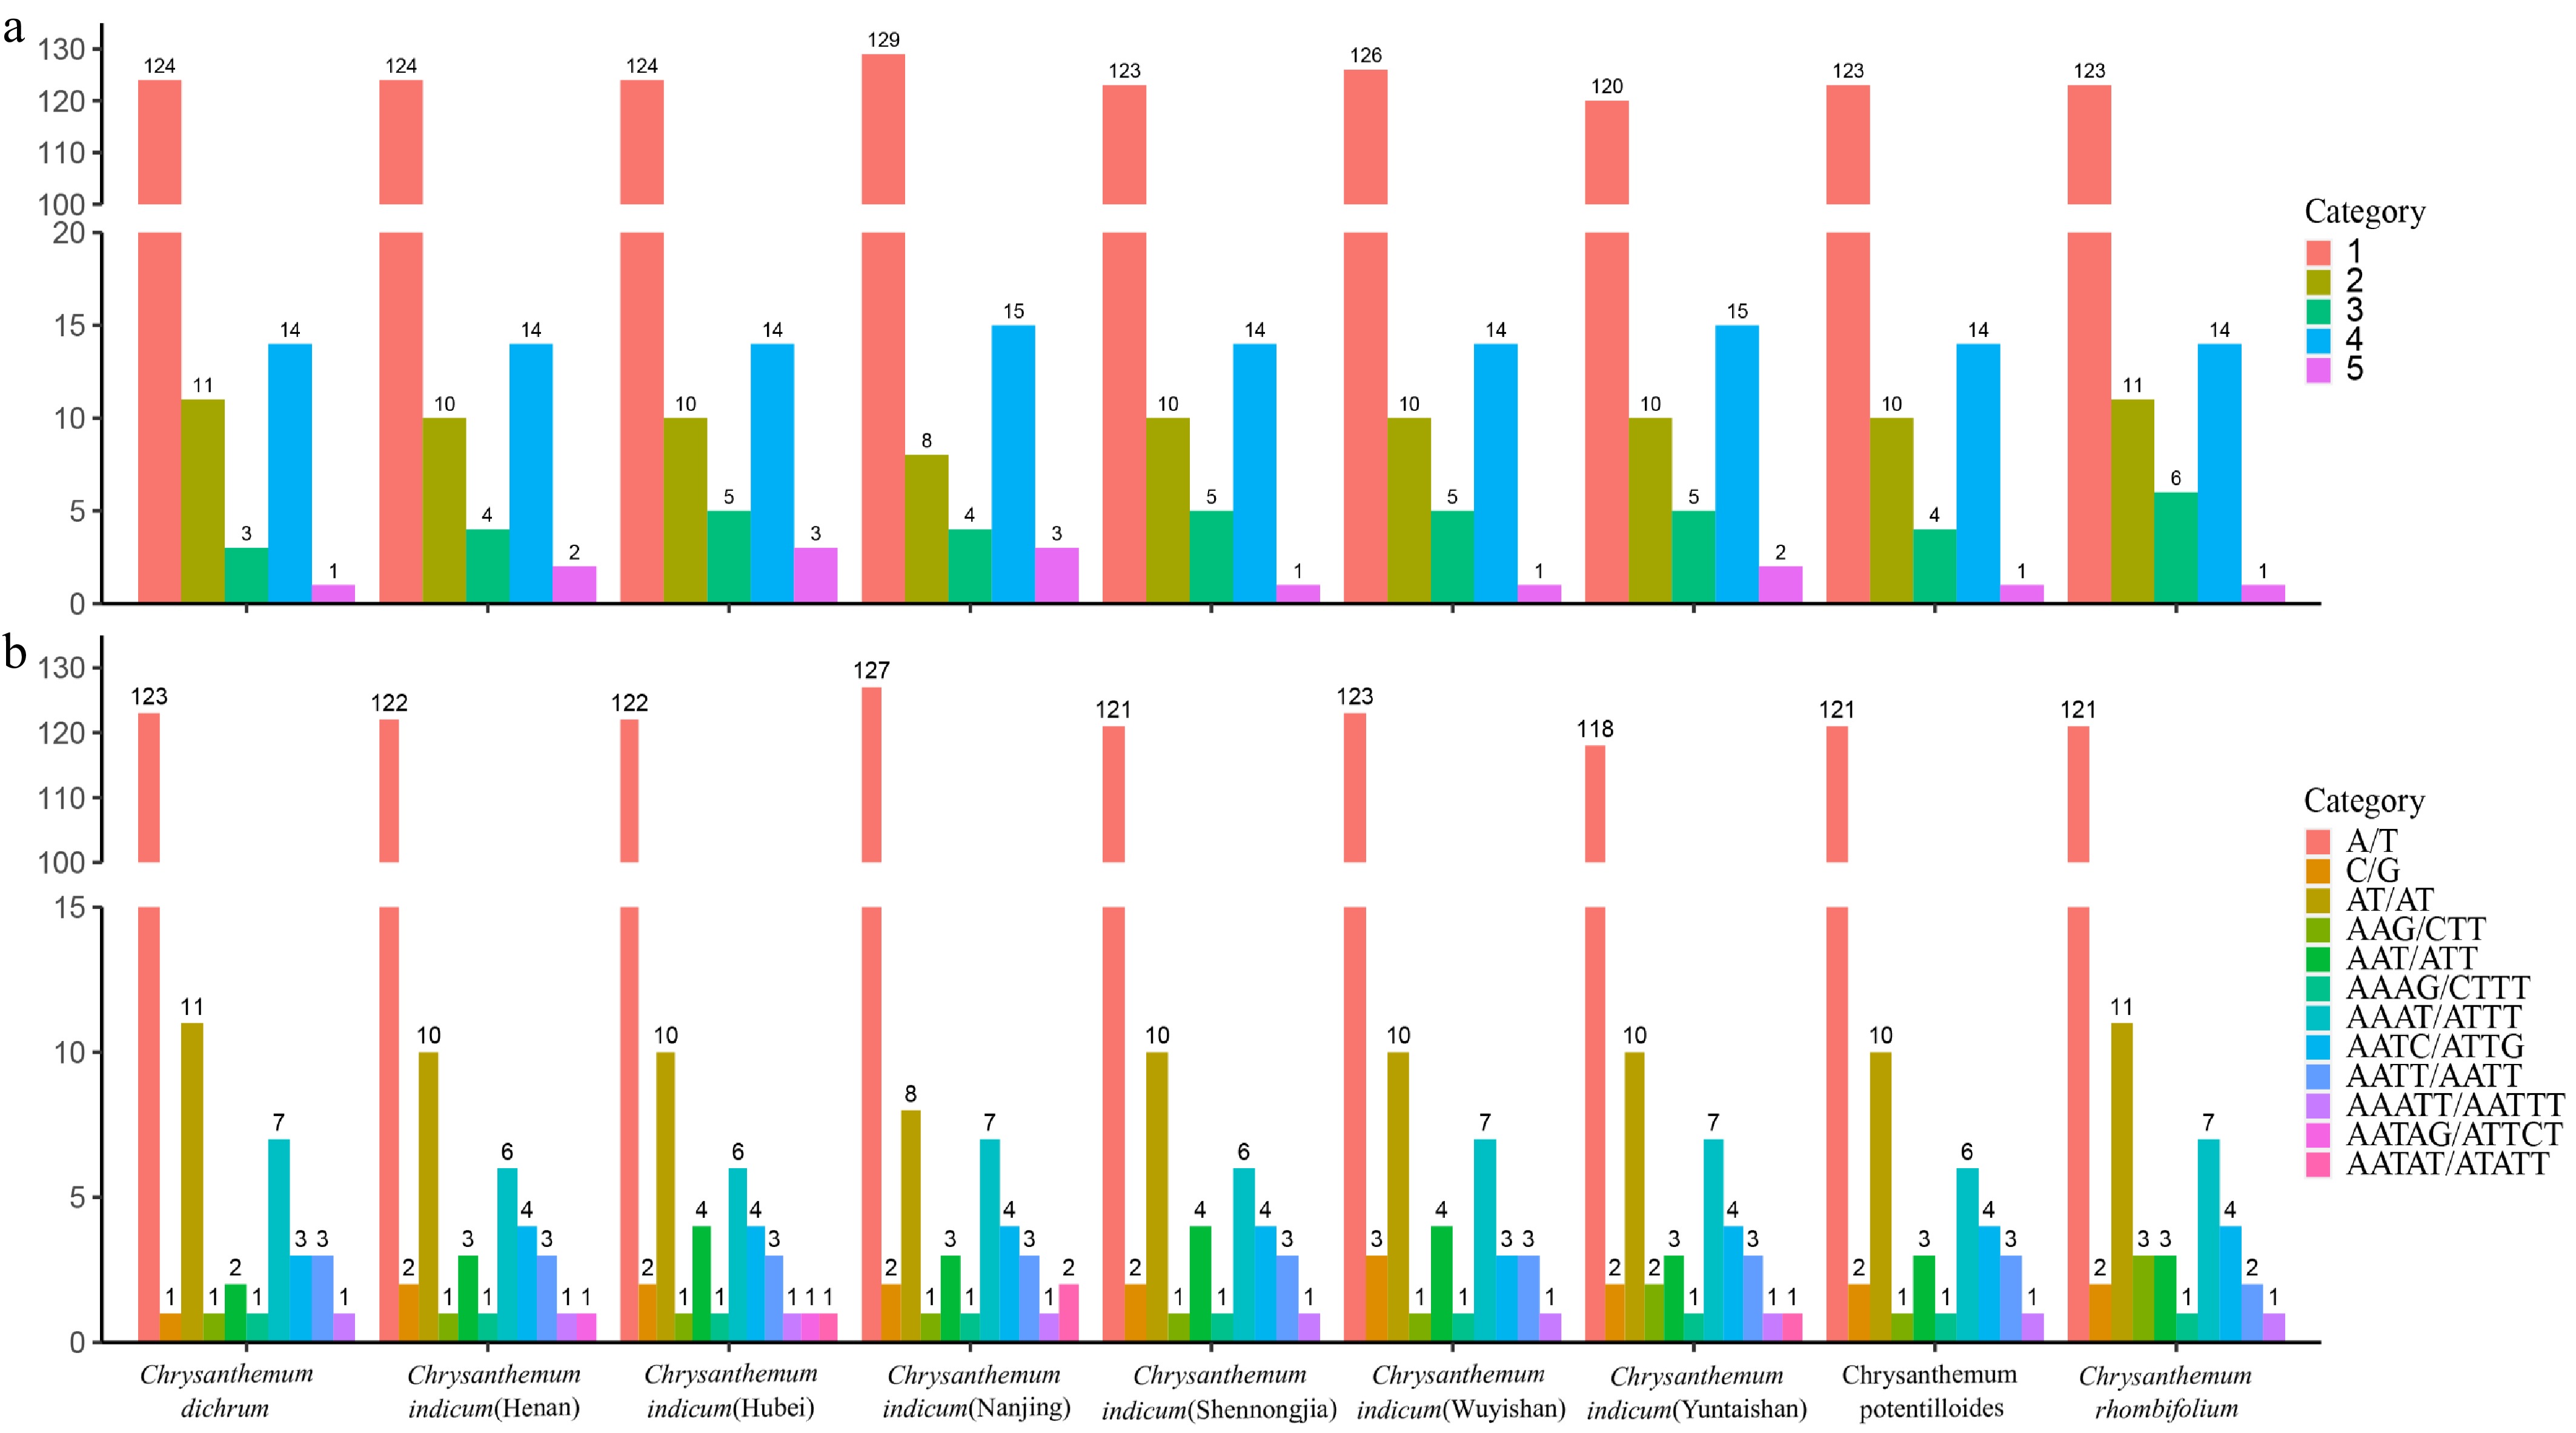
Figure 5.
Simple sequence repeat (SSR) analysis. (a) Number of different SSR types detected in the chloroplast genomes of nine Chrysanthemum genera. (b) Frequency of identified SSR motifs in the chloroplast genomes of nine Chrysanthemum genera.
-
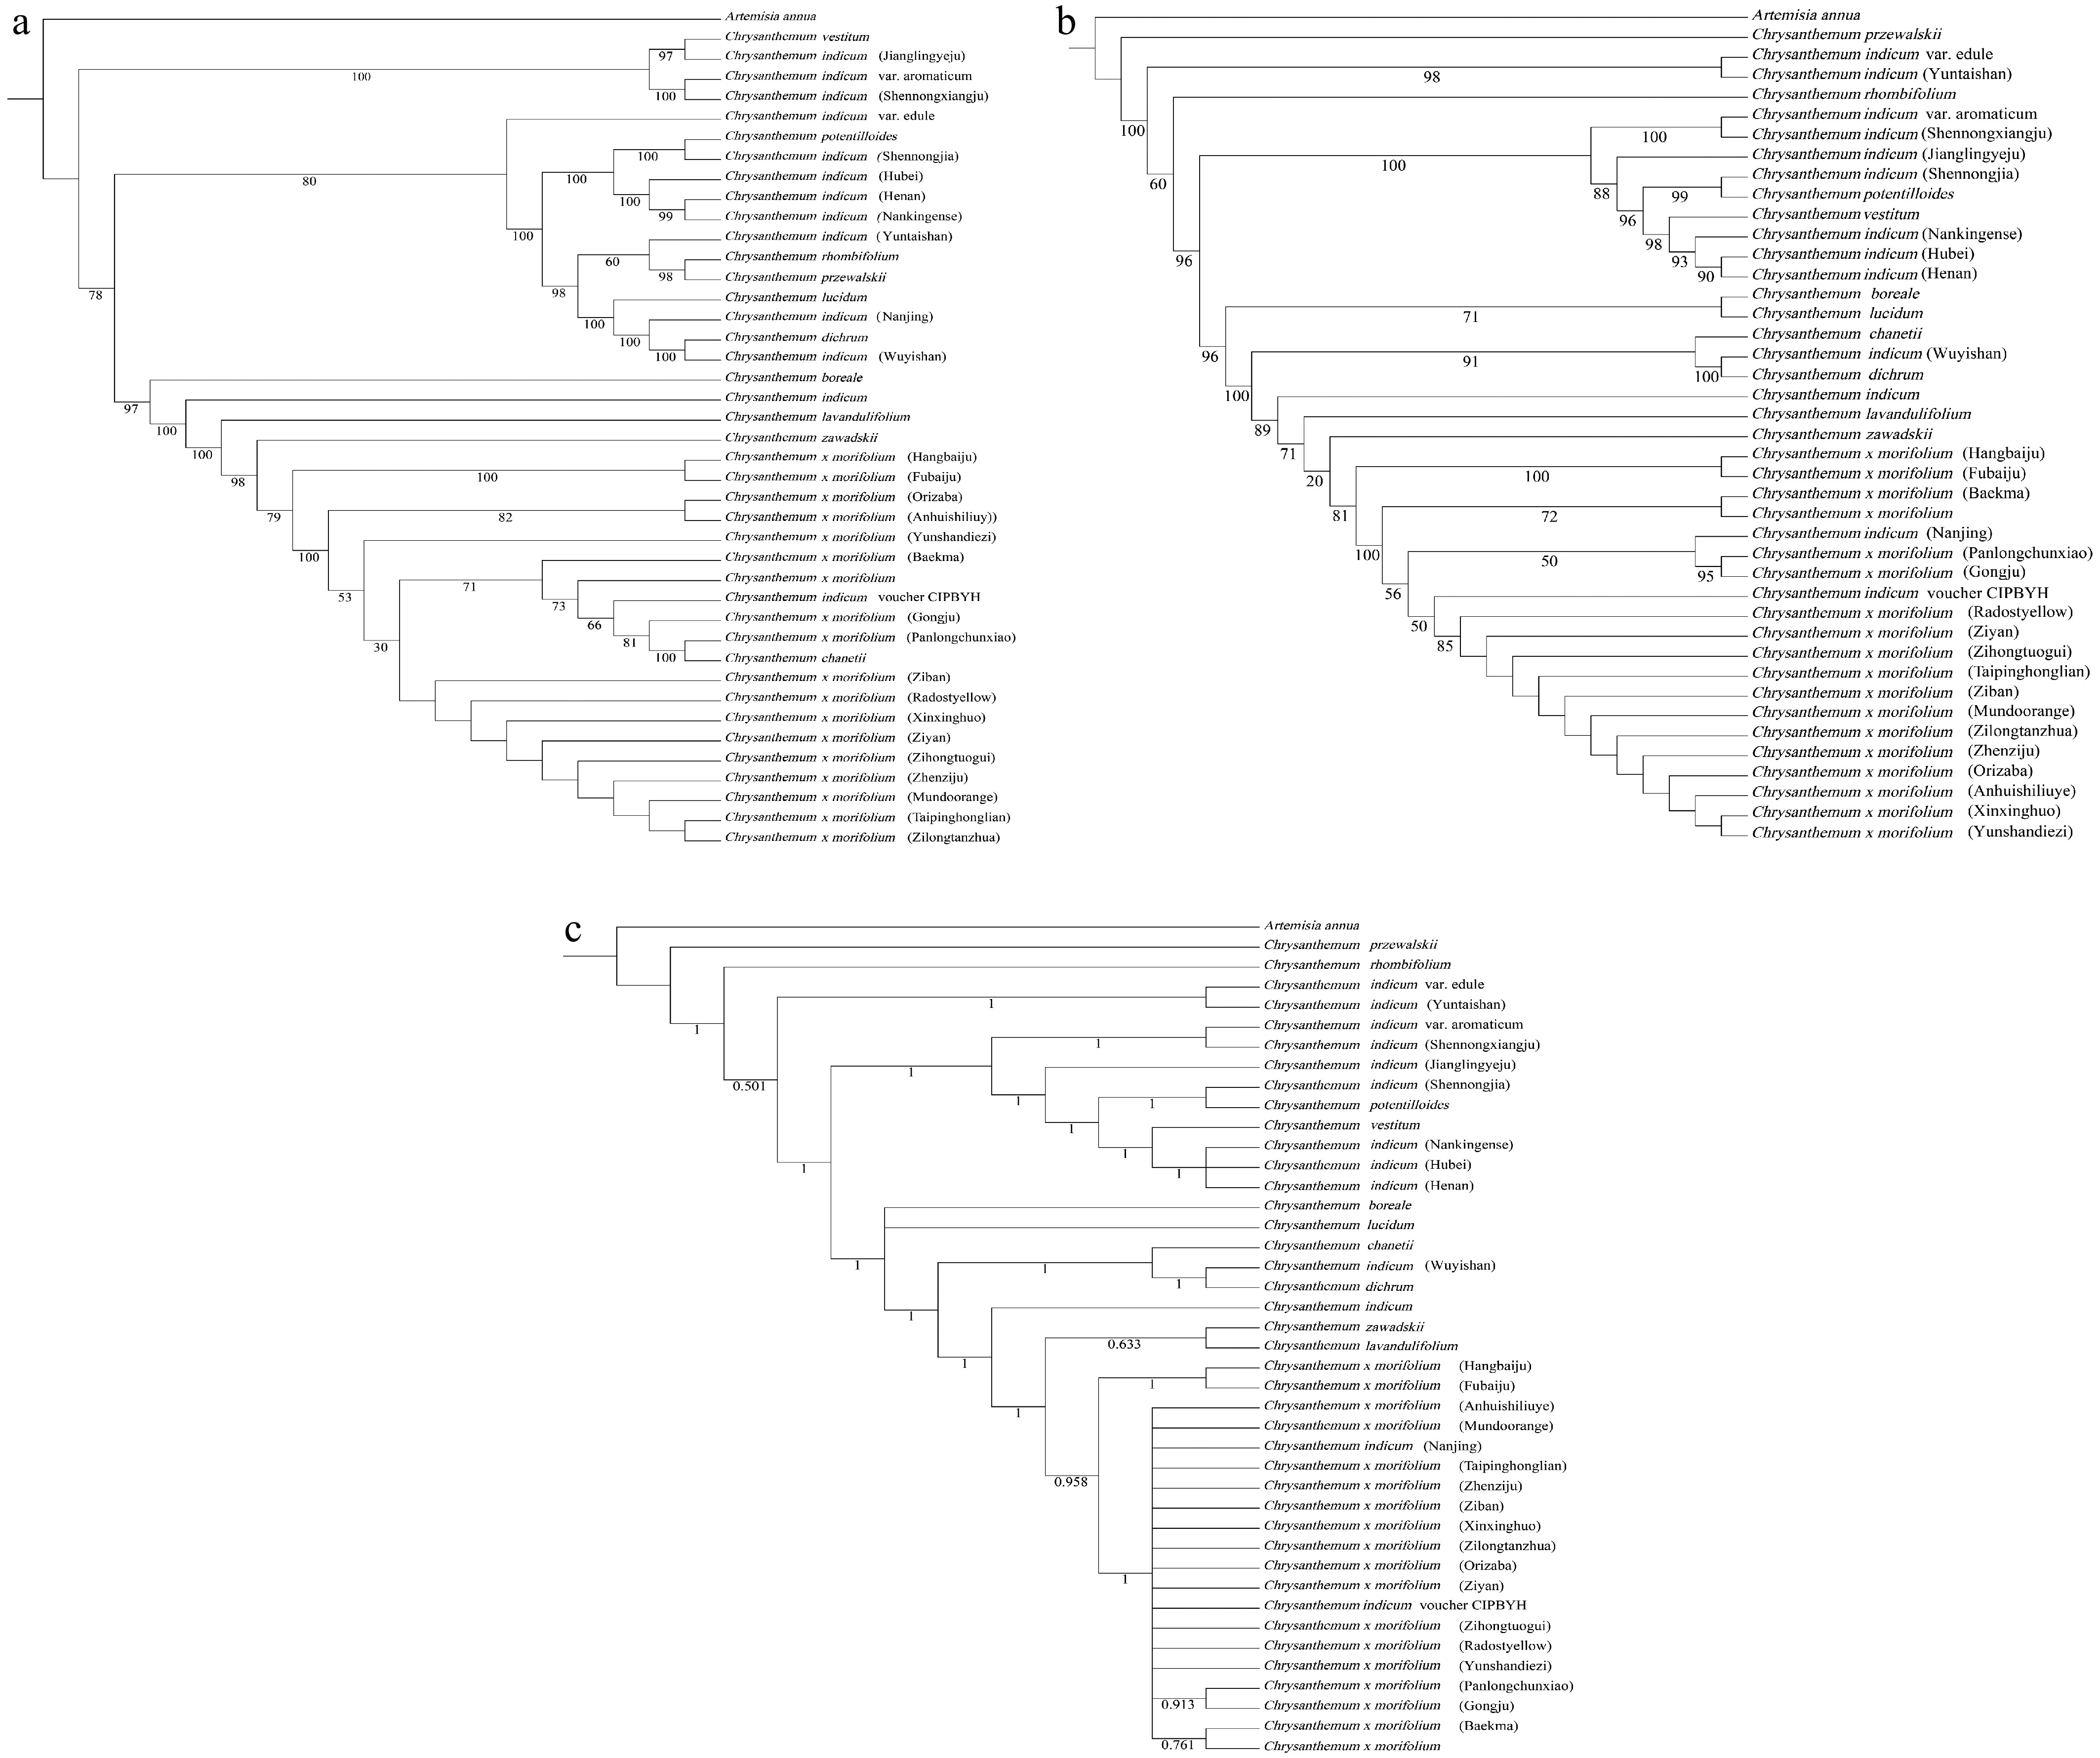
Figure 6.
The phylogenetic tree was constructed using maximum likelihood (ML) and Bayesian inference (BI) methods, and was based on the complete chloroplast genome and chloroplast CDS of 41 Chrysanthemum species. Artemisia annua was used as the outgroup for the analysis. (a) Maximum likelihood phylogenetic tree of Chrysanthemum plants using complete chloroplast genomes. (b) Maximum likelihood phylogenetic tree of Chrysanthemum plants using chloroplast CDS. (c) Bayesian inference phylogenetic tree of Chrysanthemum plants using chloroplast CDS.
-
Species Geographical region Total chloroplast DNA size (bp) Intergenic GC (%) Number of genes CDS tRNAS rRNAS Chrysanthemum indicum Hubei 151,027 37.47 128 85 35 8 Chrysanthemum indicum Henan 151,027 37.47 128 85 35 8 Chrysanthemum indicum Nanjing 151,060 37.45 128 85 35 8 Chrysanthemum indicum Shennongjia 151,030 37.48 128 85 35 8 Chrysanthemum indicum Wuyishan 151,090 37.46 128 85 35 8 Chrysanthemum indicum Yuntaishan 150,999 37.48 128 85 35 8 Chrysanthemum rhombifolium Chongqing 151,252 37.45 128 85 35 8 Chrysanthemum potentilloides Shaanxi 151,031 37.48 128 85 35 8 Chrysanthemum dichrum Hebei 151,085 37.47 128 85 35 8 Table 1.
Comparison of the chloroplast genome's characteristics in nine Chrysanthemum accessions.
-
Category of genes Group of genes Name of genes Genes for photosynthesis Subunits of ATP synthase atpA, atpB, atpE, atpF, atpH, atpI Subunits of Photosystem II psbA, psbB, psbC, psbD, psbE, psbF, psbI, psbJ, psbK, psbM, psbN, psbT, psbZ Subunits of (nicotinamide adenine dinucleotide) NADH-dehydrogenase ndhA, ndhB(2), ndhC, ndhD, ndhE, ndhF, ndhG, ndhH, ndhI, ndhJ, ndhK Subunits of cytochrome b/f complex petA, petB, petD, petG, petL, petN Subunits of Photosystem I psaA, psaB, psaC, psaI, psaJ Subunit of Rubisco rbcL Self replication Large subunit of ribosome rpl14, rpl16, rpl2(2), rpl20, rpl22, rpl23(2), rpl32, rpl33, rpl36 DNA-dependent RNA polymerase rpoA, rpoB, rpoC1, rpoC2 Small subunit of ribosome rps11, rps12(2), rps14, rps15, rps16, rps18, rps2, rps3, rps4, rps7(2), rps8 Other genes Subunit of acetyl-Coenzyme A (CoA)-carboxylase accD C-type cytochrome synthesis gene ccsA Envelope membrane protein cemA Protease clpP Translational initiation factor infA Maturase matK Genes with unknown functions Conserved open reading frames ycf1, ycf15(2), ycf2(2), ycf4, ycf3 Table 2.
Gene composition in nine Chrysanthemum chloroplast genomes.
Figures
(6)
Tables
(2)