-
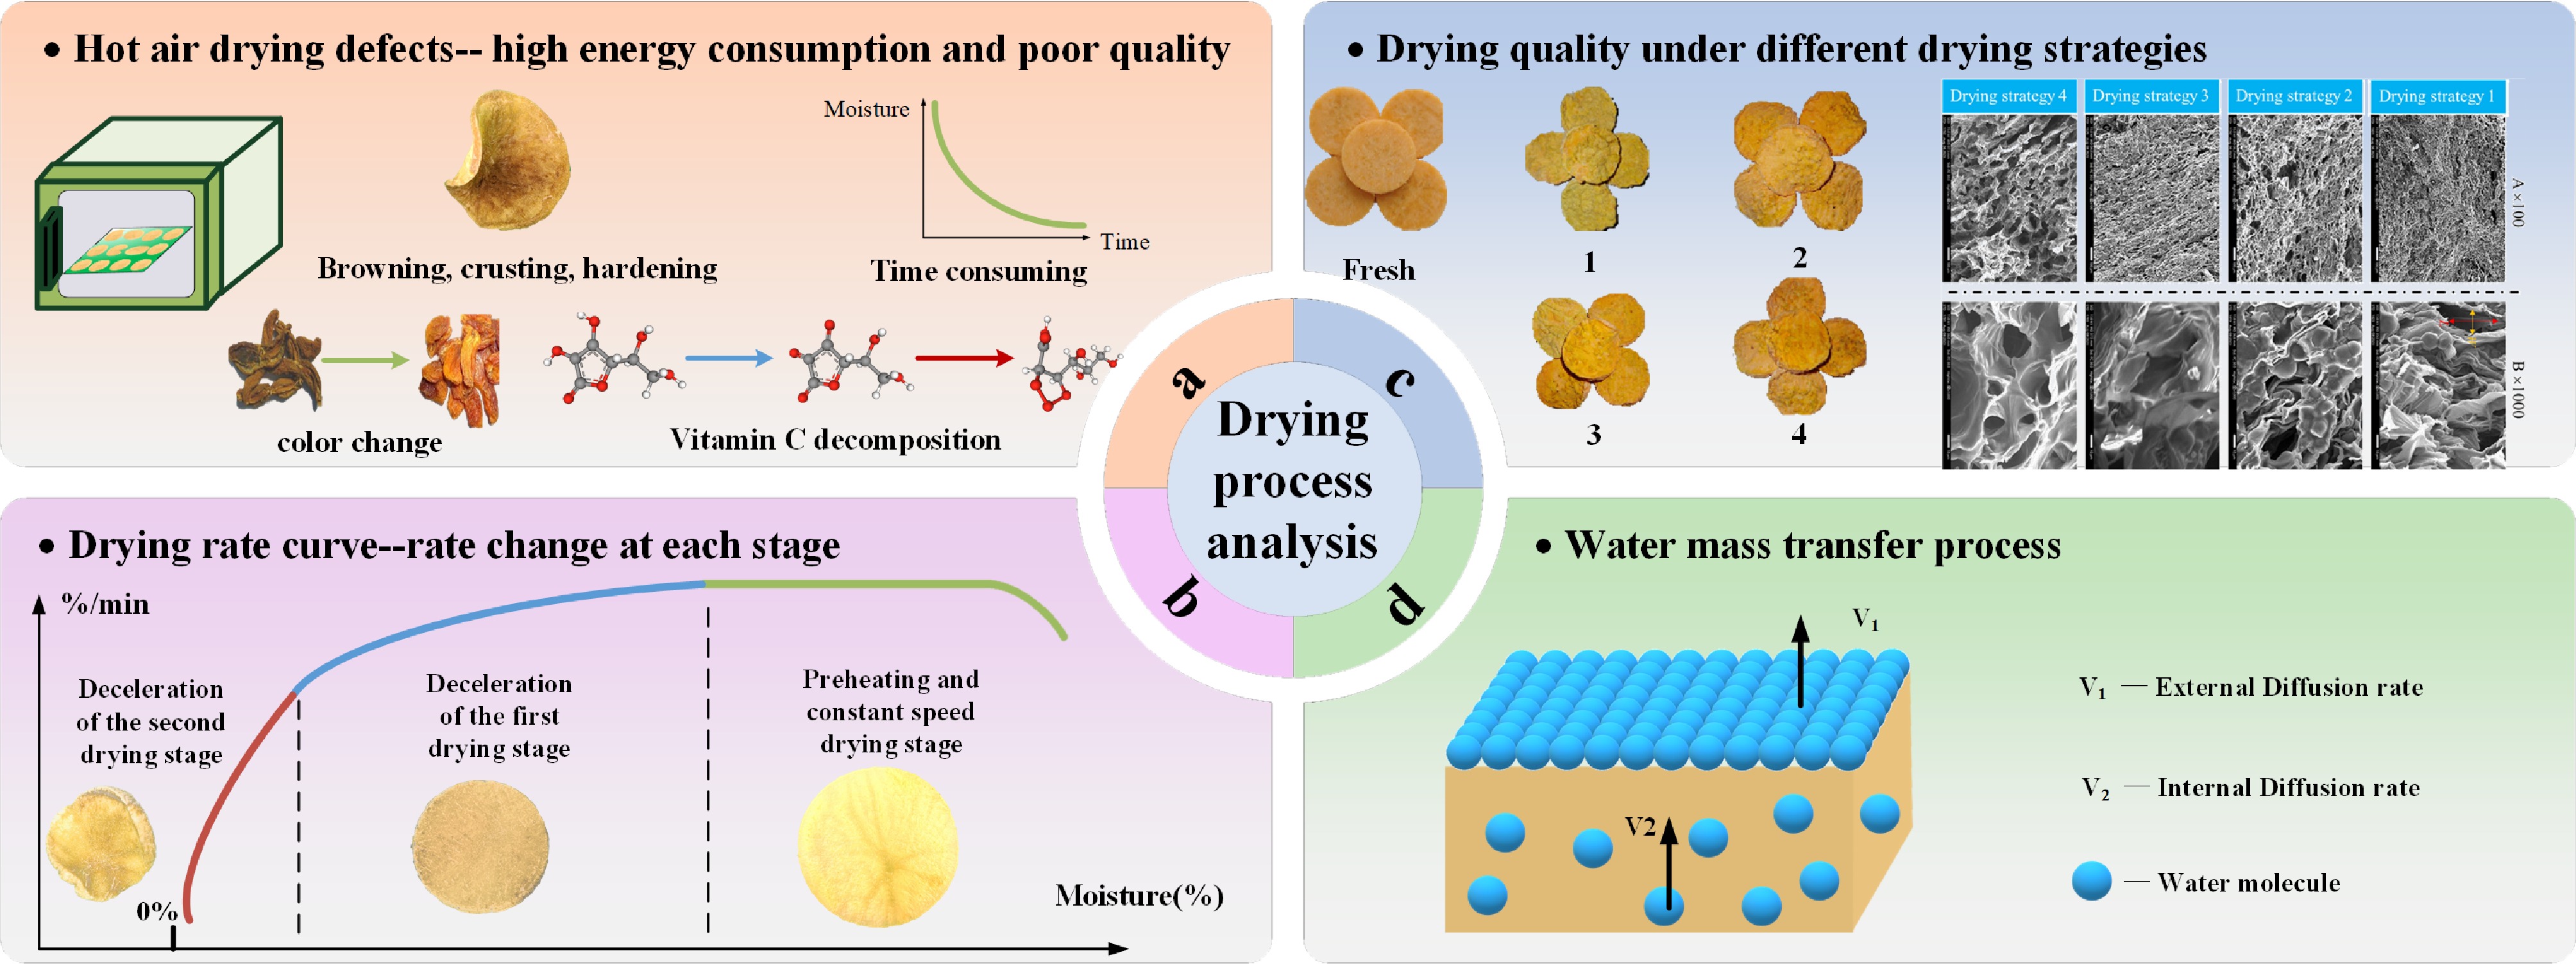
Figure 1.
Drying process analysis. (a) Hot air drying defects, high energy consumption and poor quality. (b) Drying quality under different drying strategies. (c) Drying rate curve, rate change at each stage[16]. (d) Water mass transfer process.
-
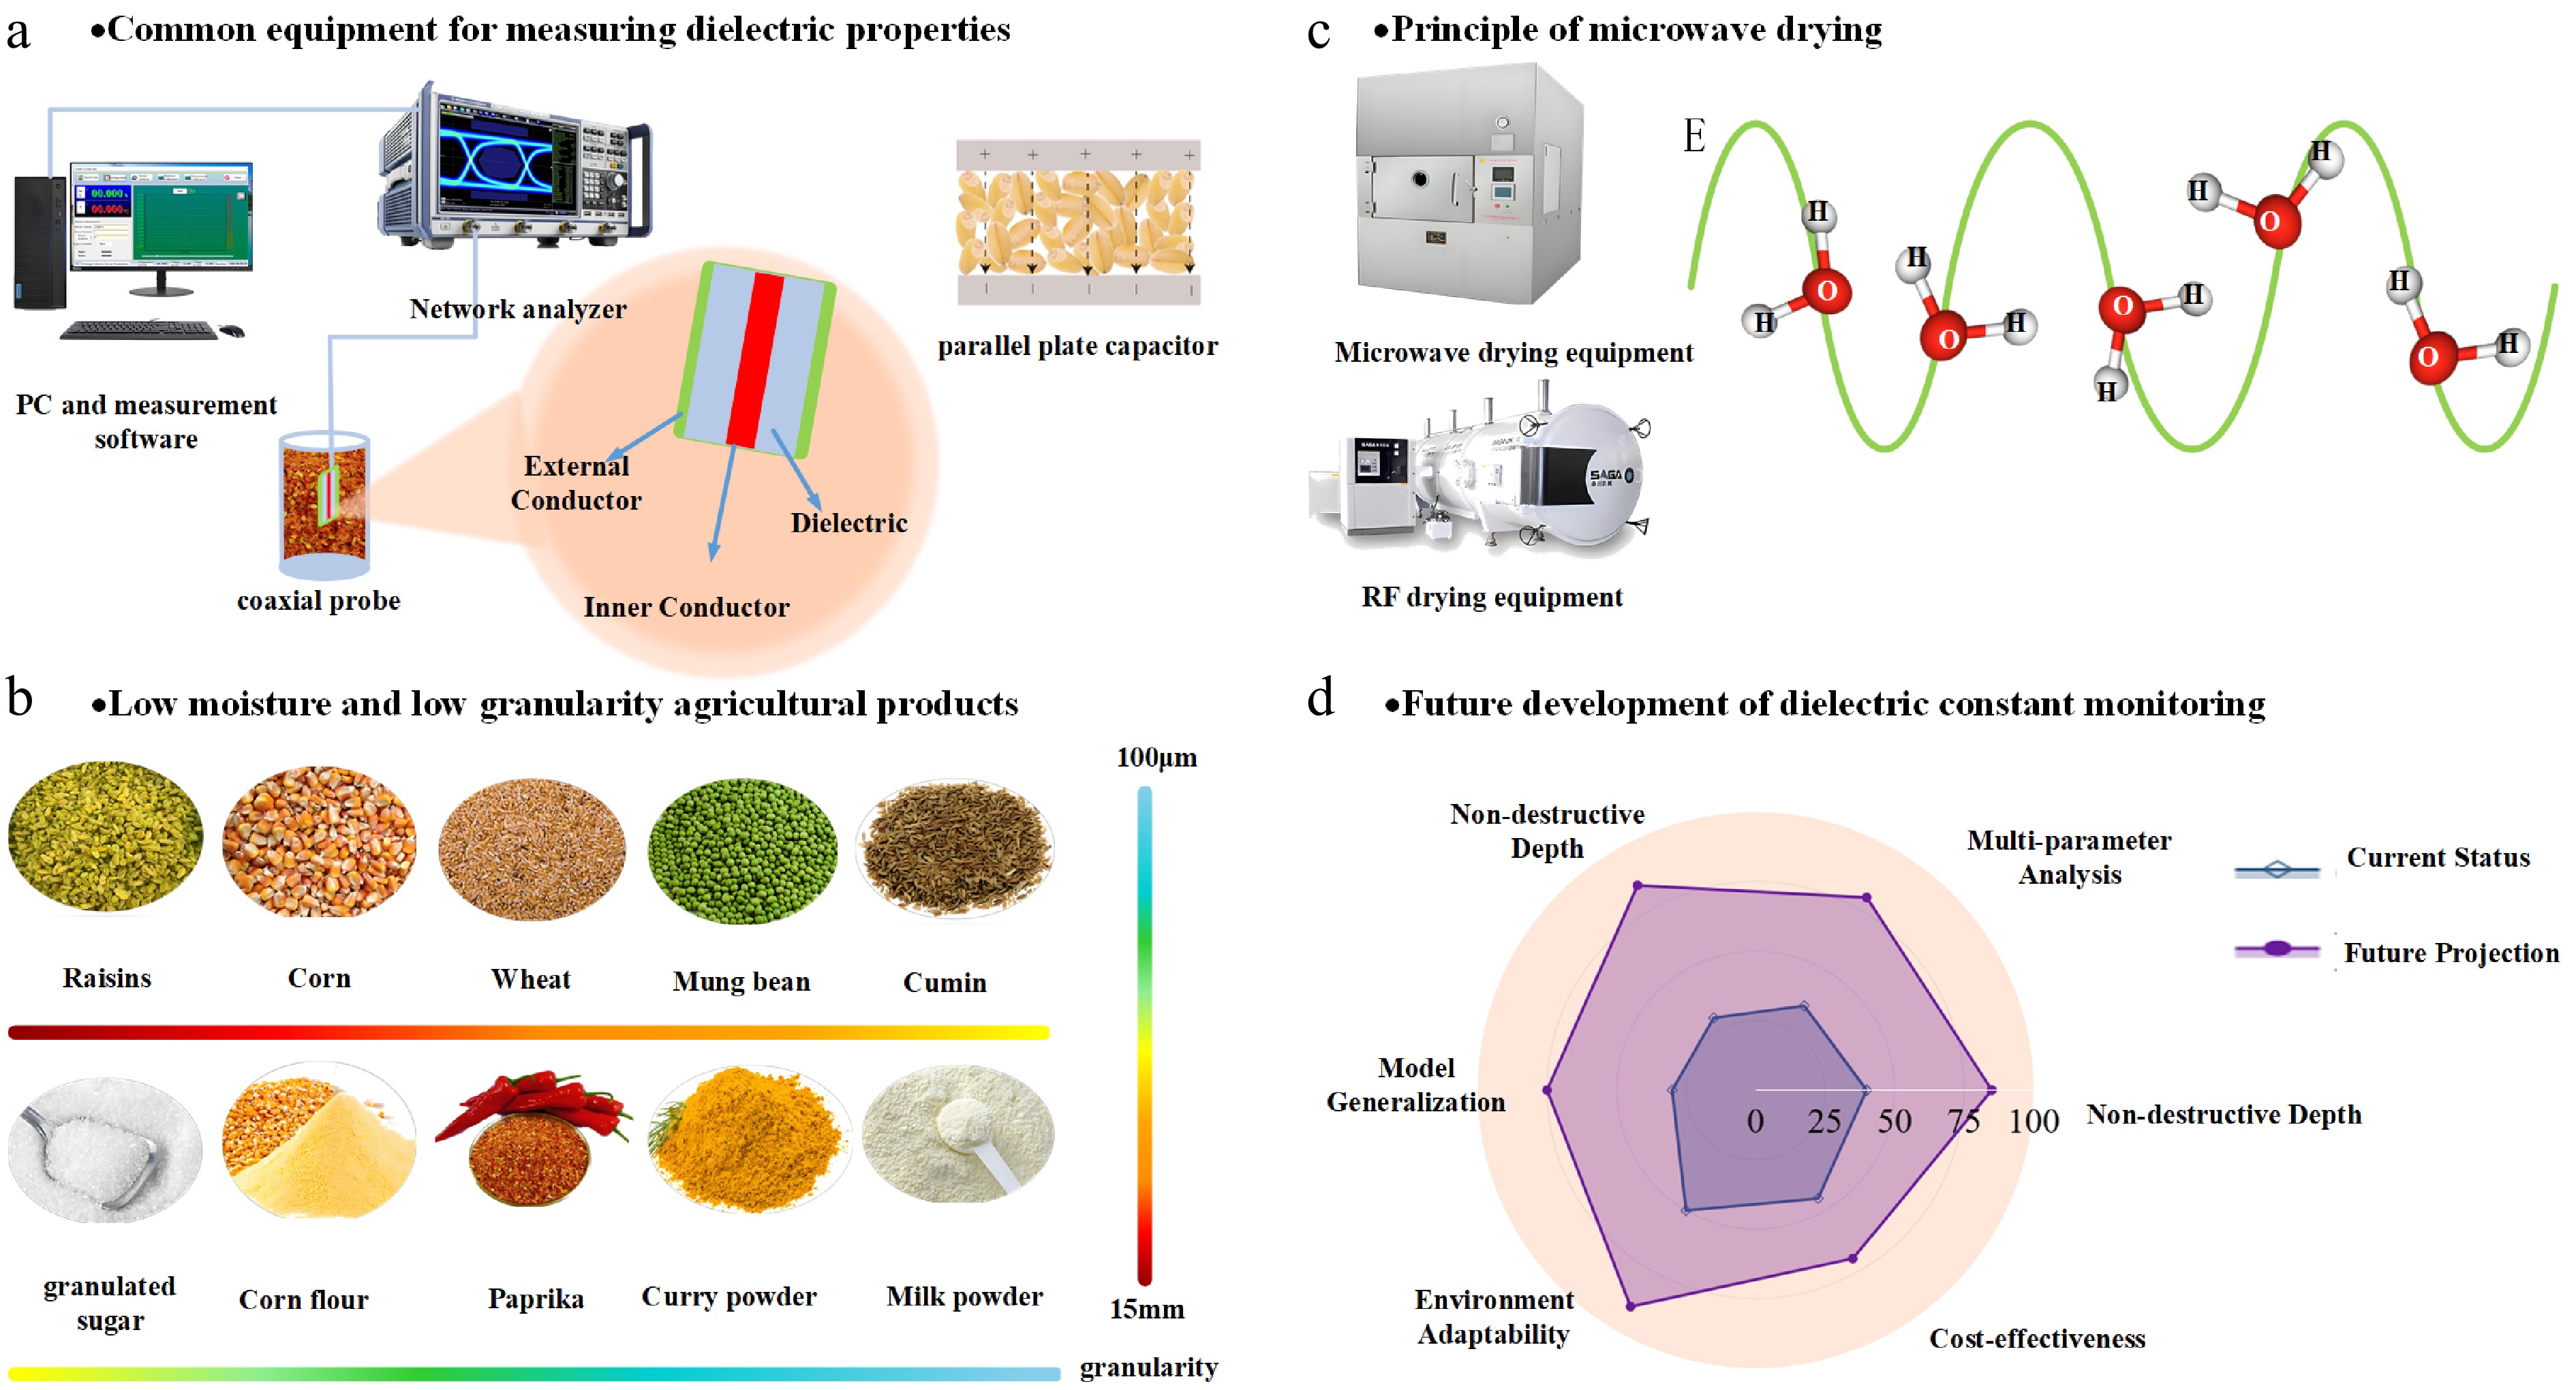
Figure 2.
The dielectric property detection drying process. (a) Common equipment for measuring dielectric properties. (b) Low moisture and low granularity agricultural products. (c) Principles of microwave drying.
-
-
-
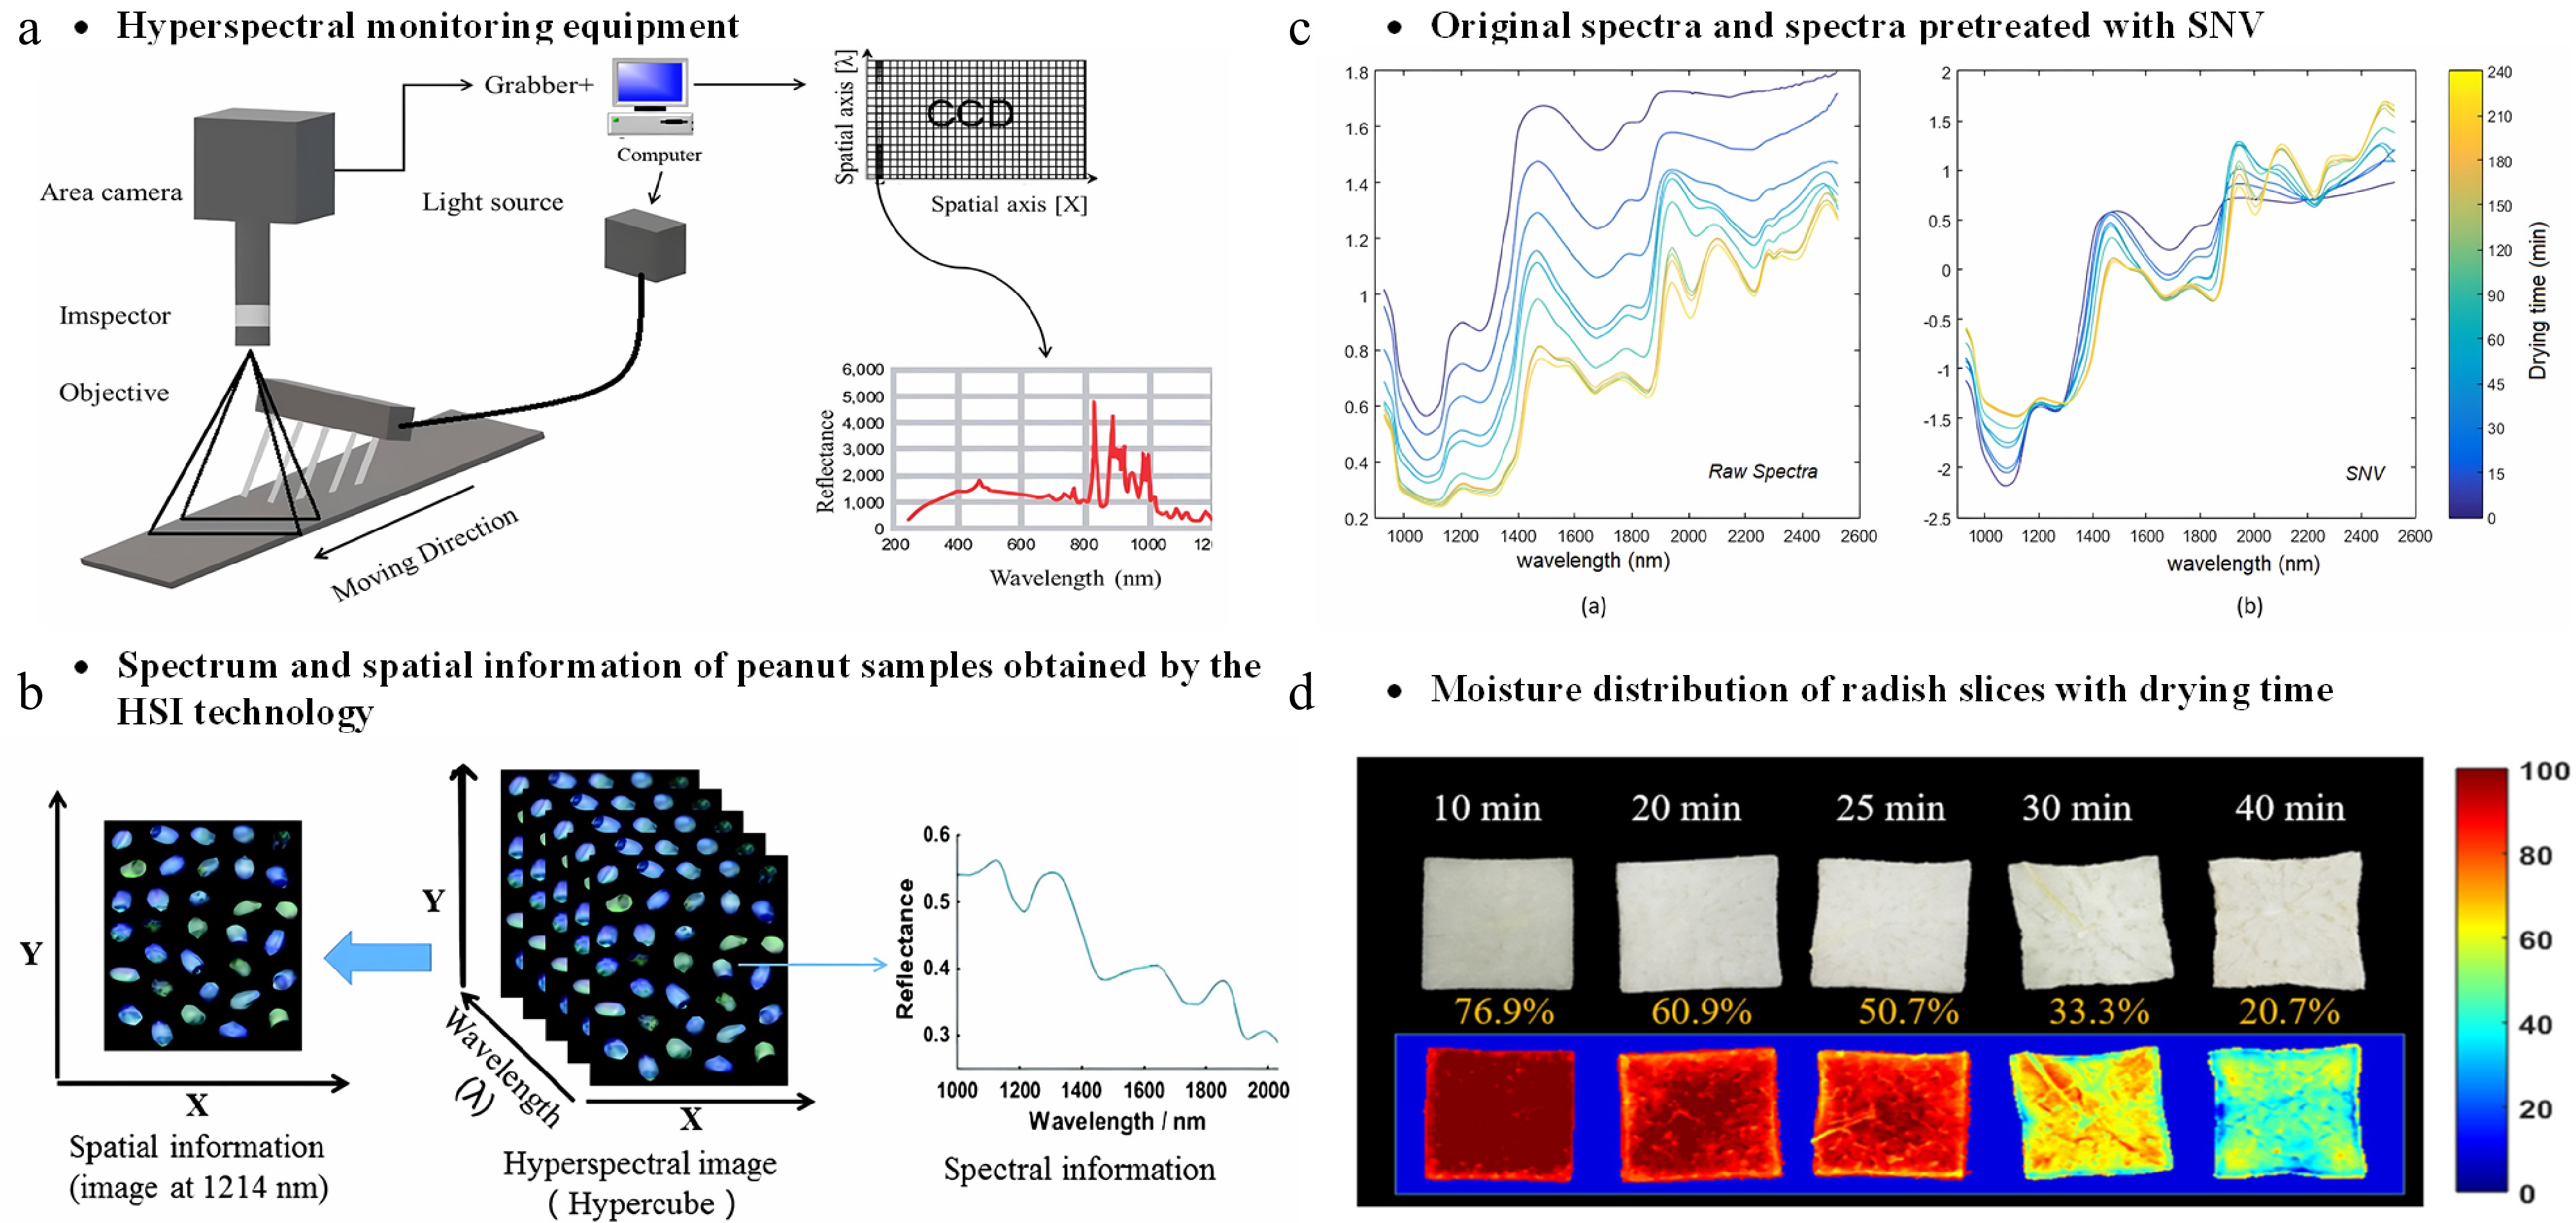
Figure 5.
Hyperspectral detection of drying process. (a) Hyperspectral monitoring equipmentr[73]. (b) Spectrum and spatial information of peanut samples obtained by the HSI technology[74]. (c) Original spectra and spectra pretreated with SNV[79]. (d) Moisture distribution of radish slices with drying time[75].
Figures
(5)
Tables
(0)