-
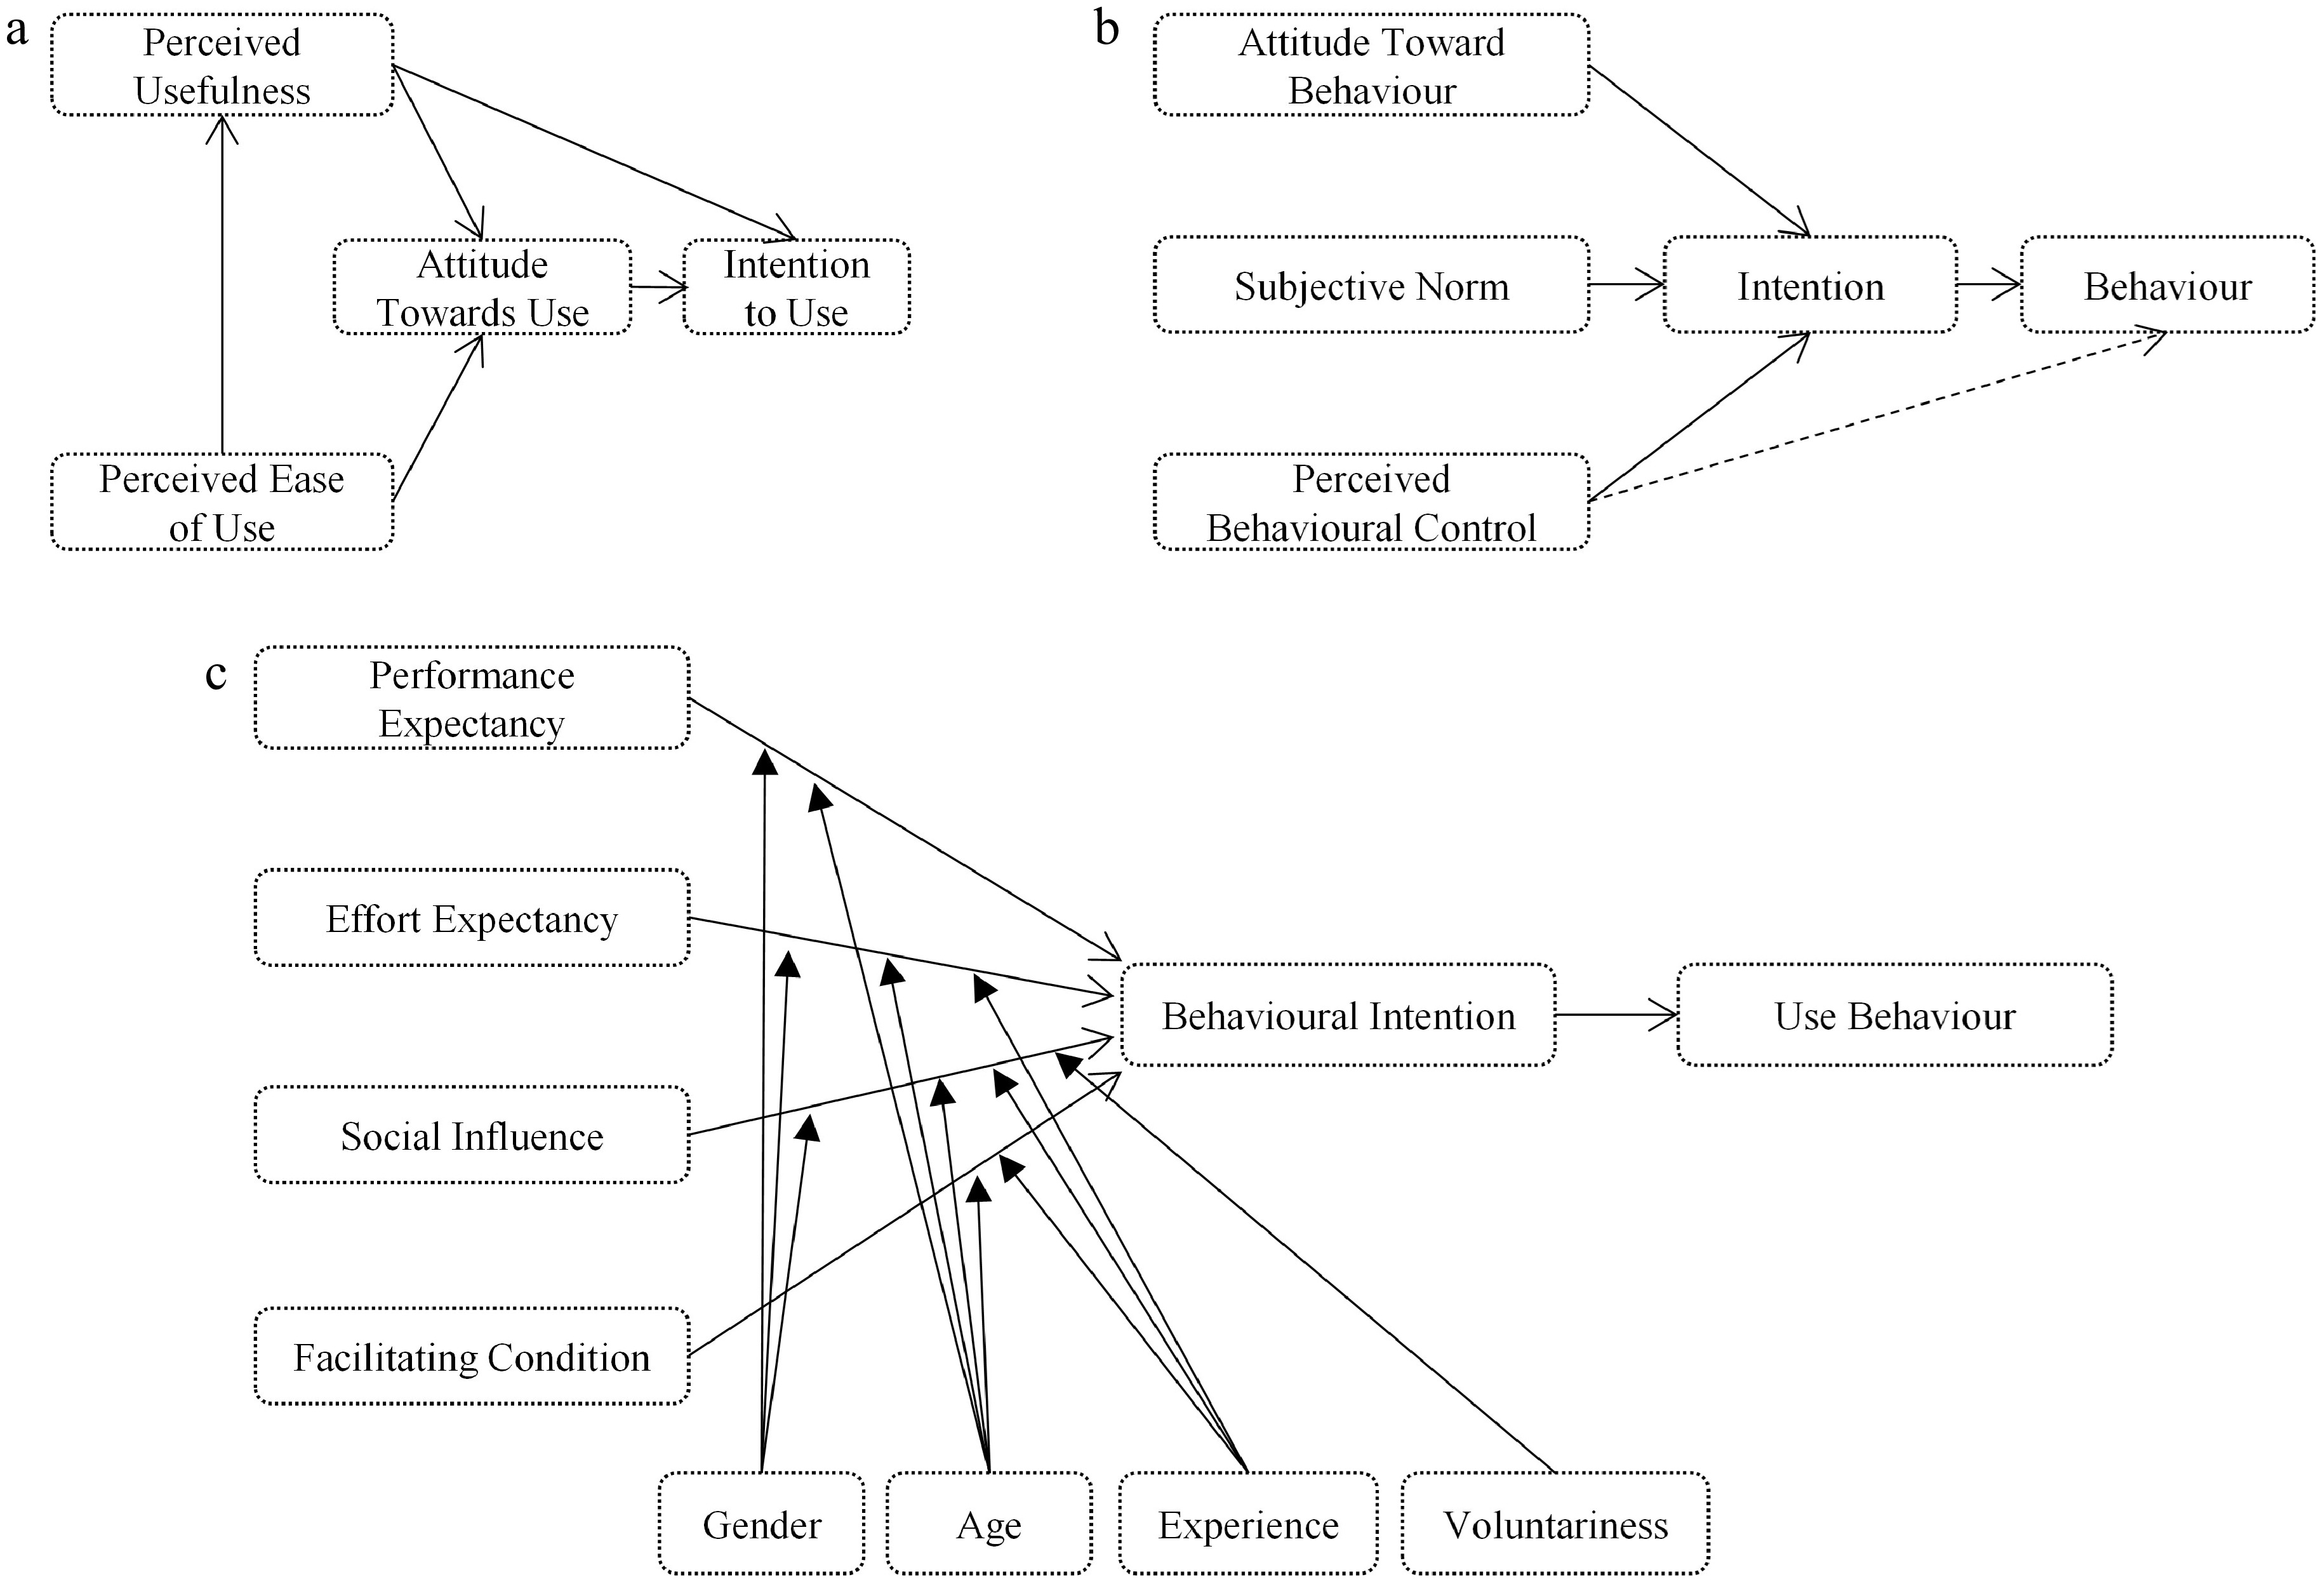
Figure 1.
The three main adopted categories of behavioural theories. (a) TAM, (b) TPB, and (c) UTAUT.
-
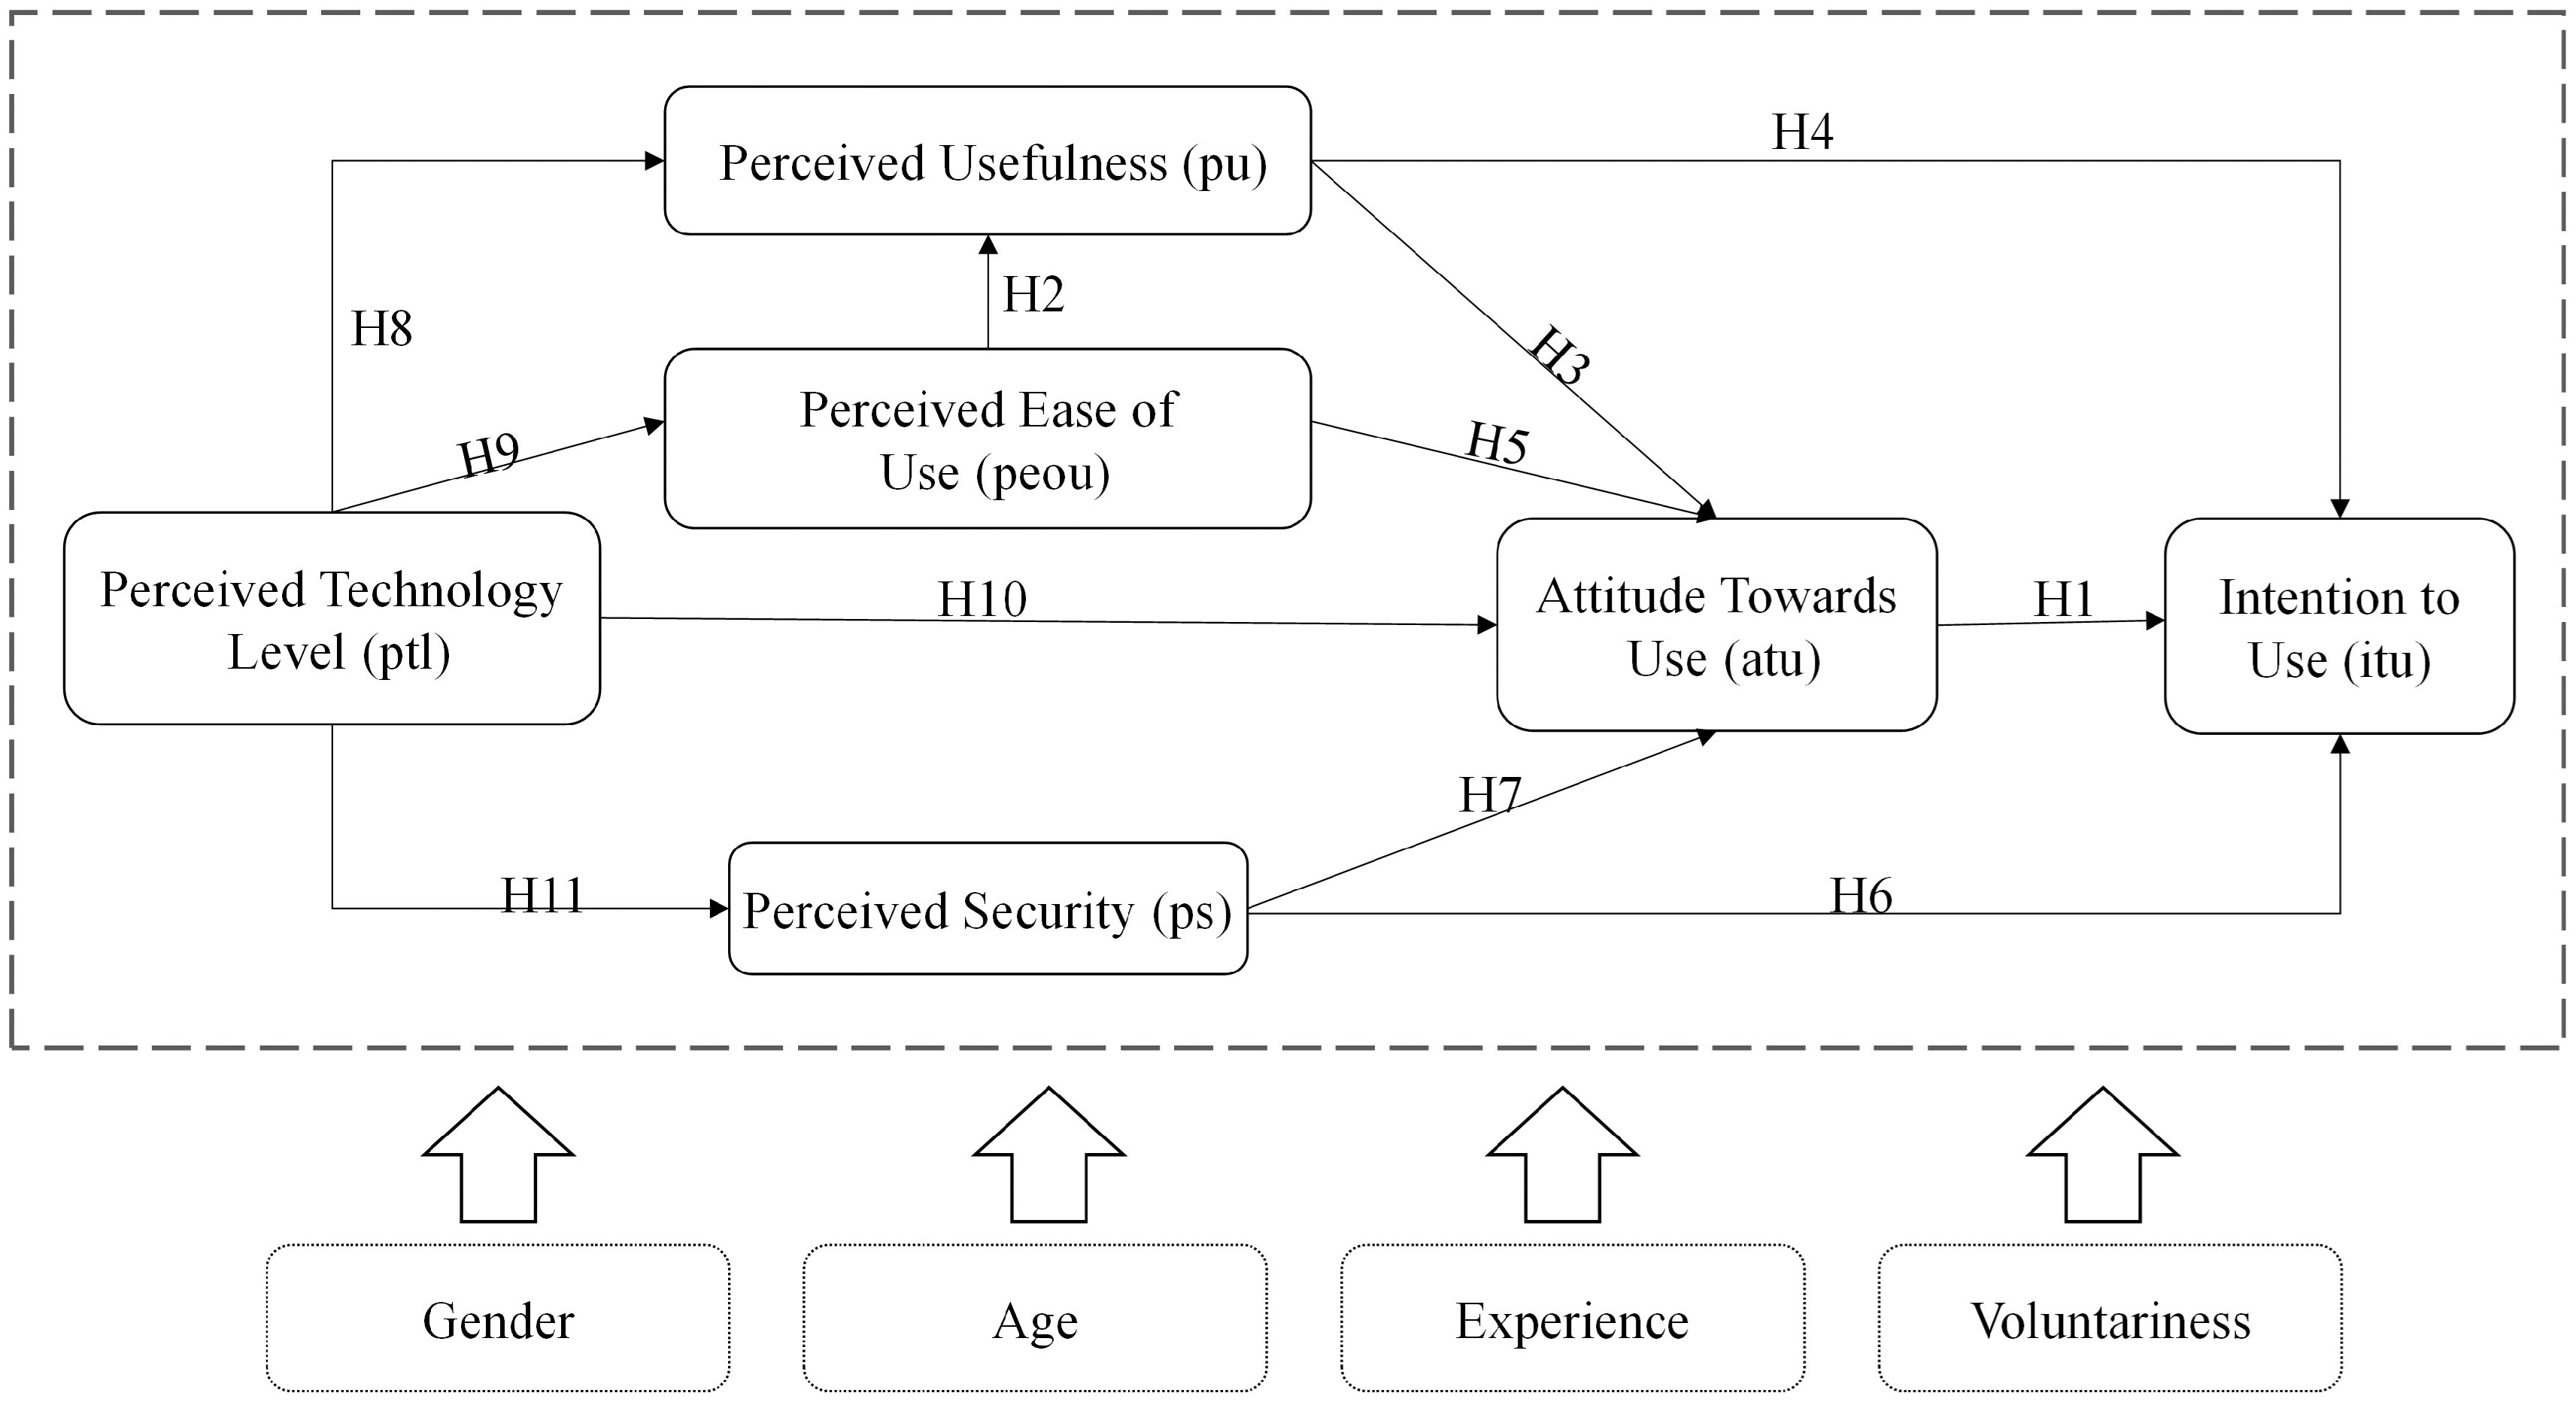
Figure 2.
The proposed extended technology acceptance model.
-
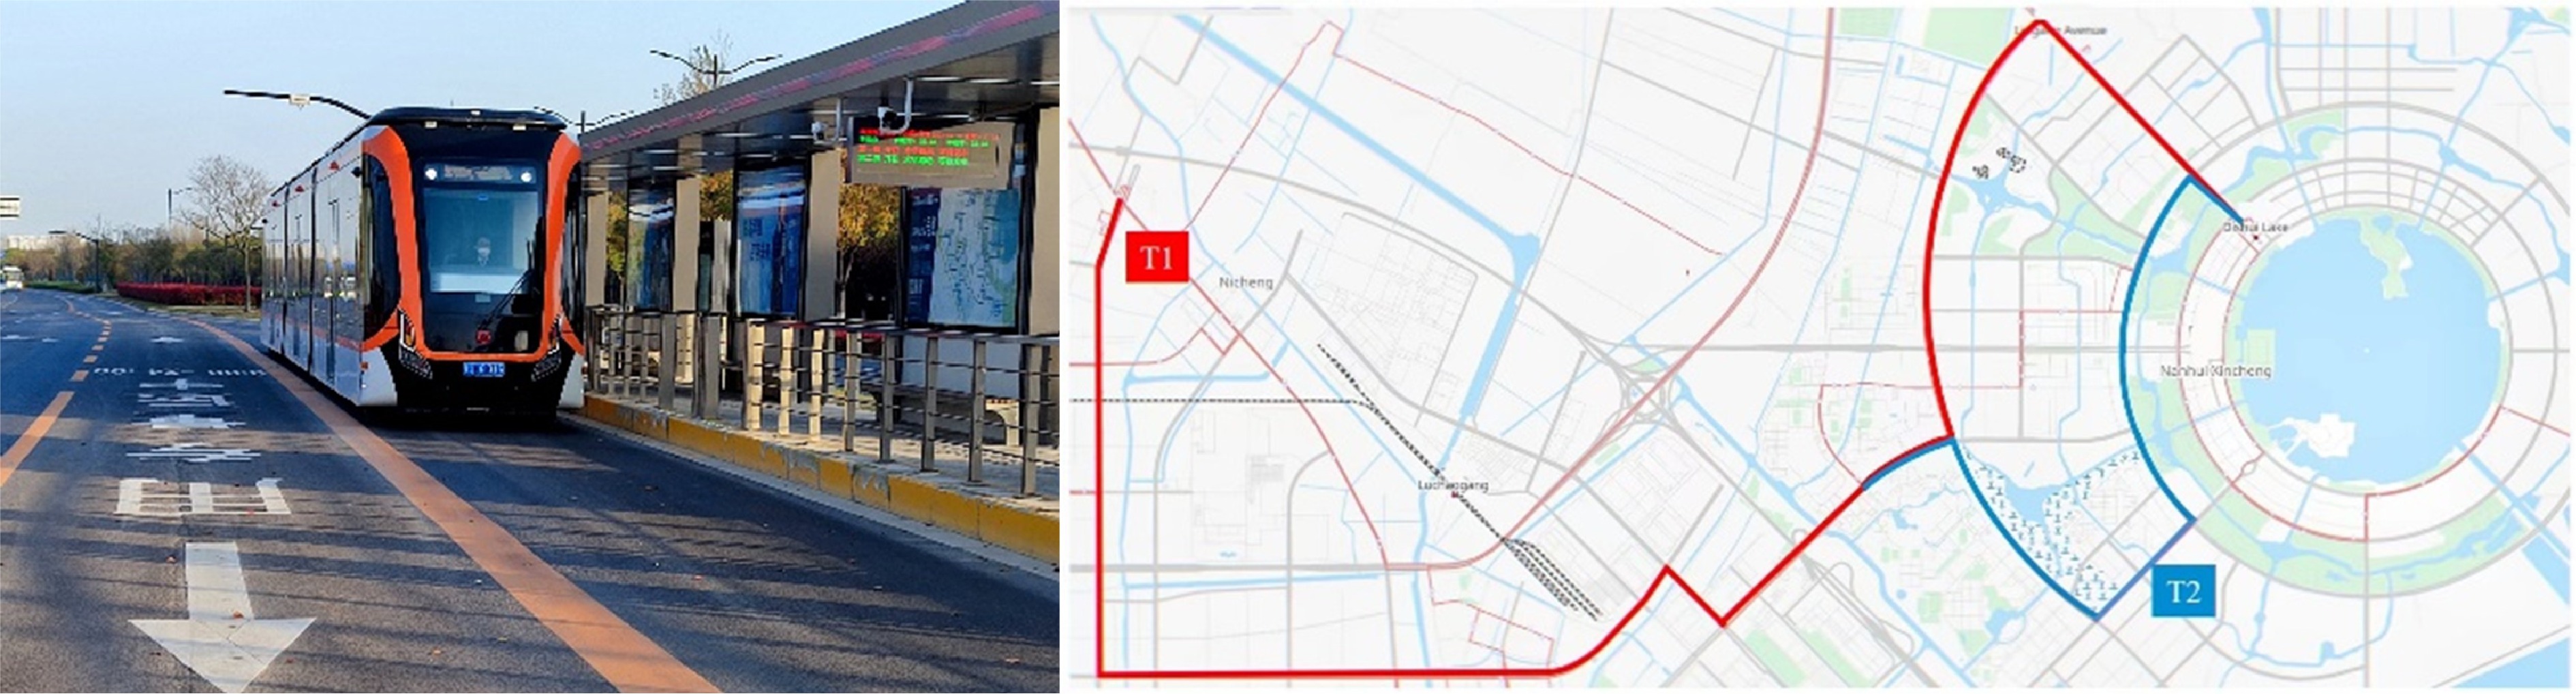
Figure 3.
Automated driving BRT in Lingang New City, Shanghai, China.
-
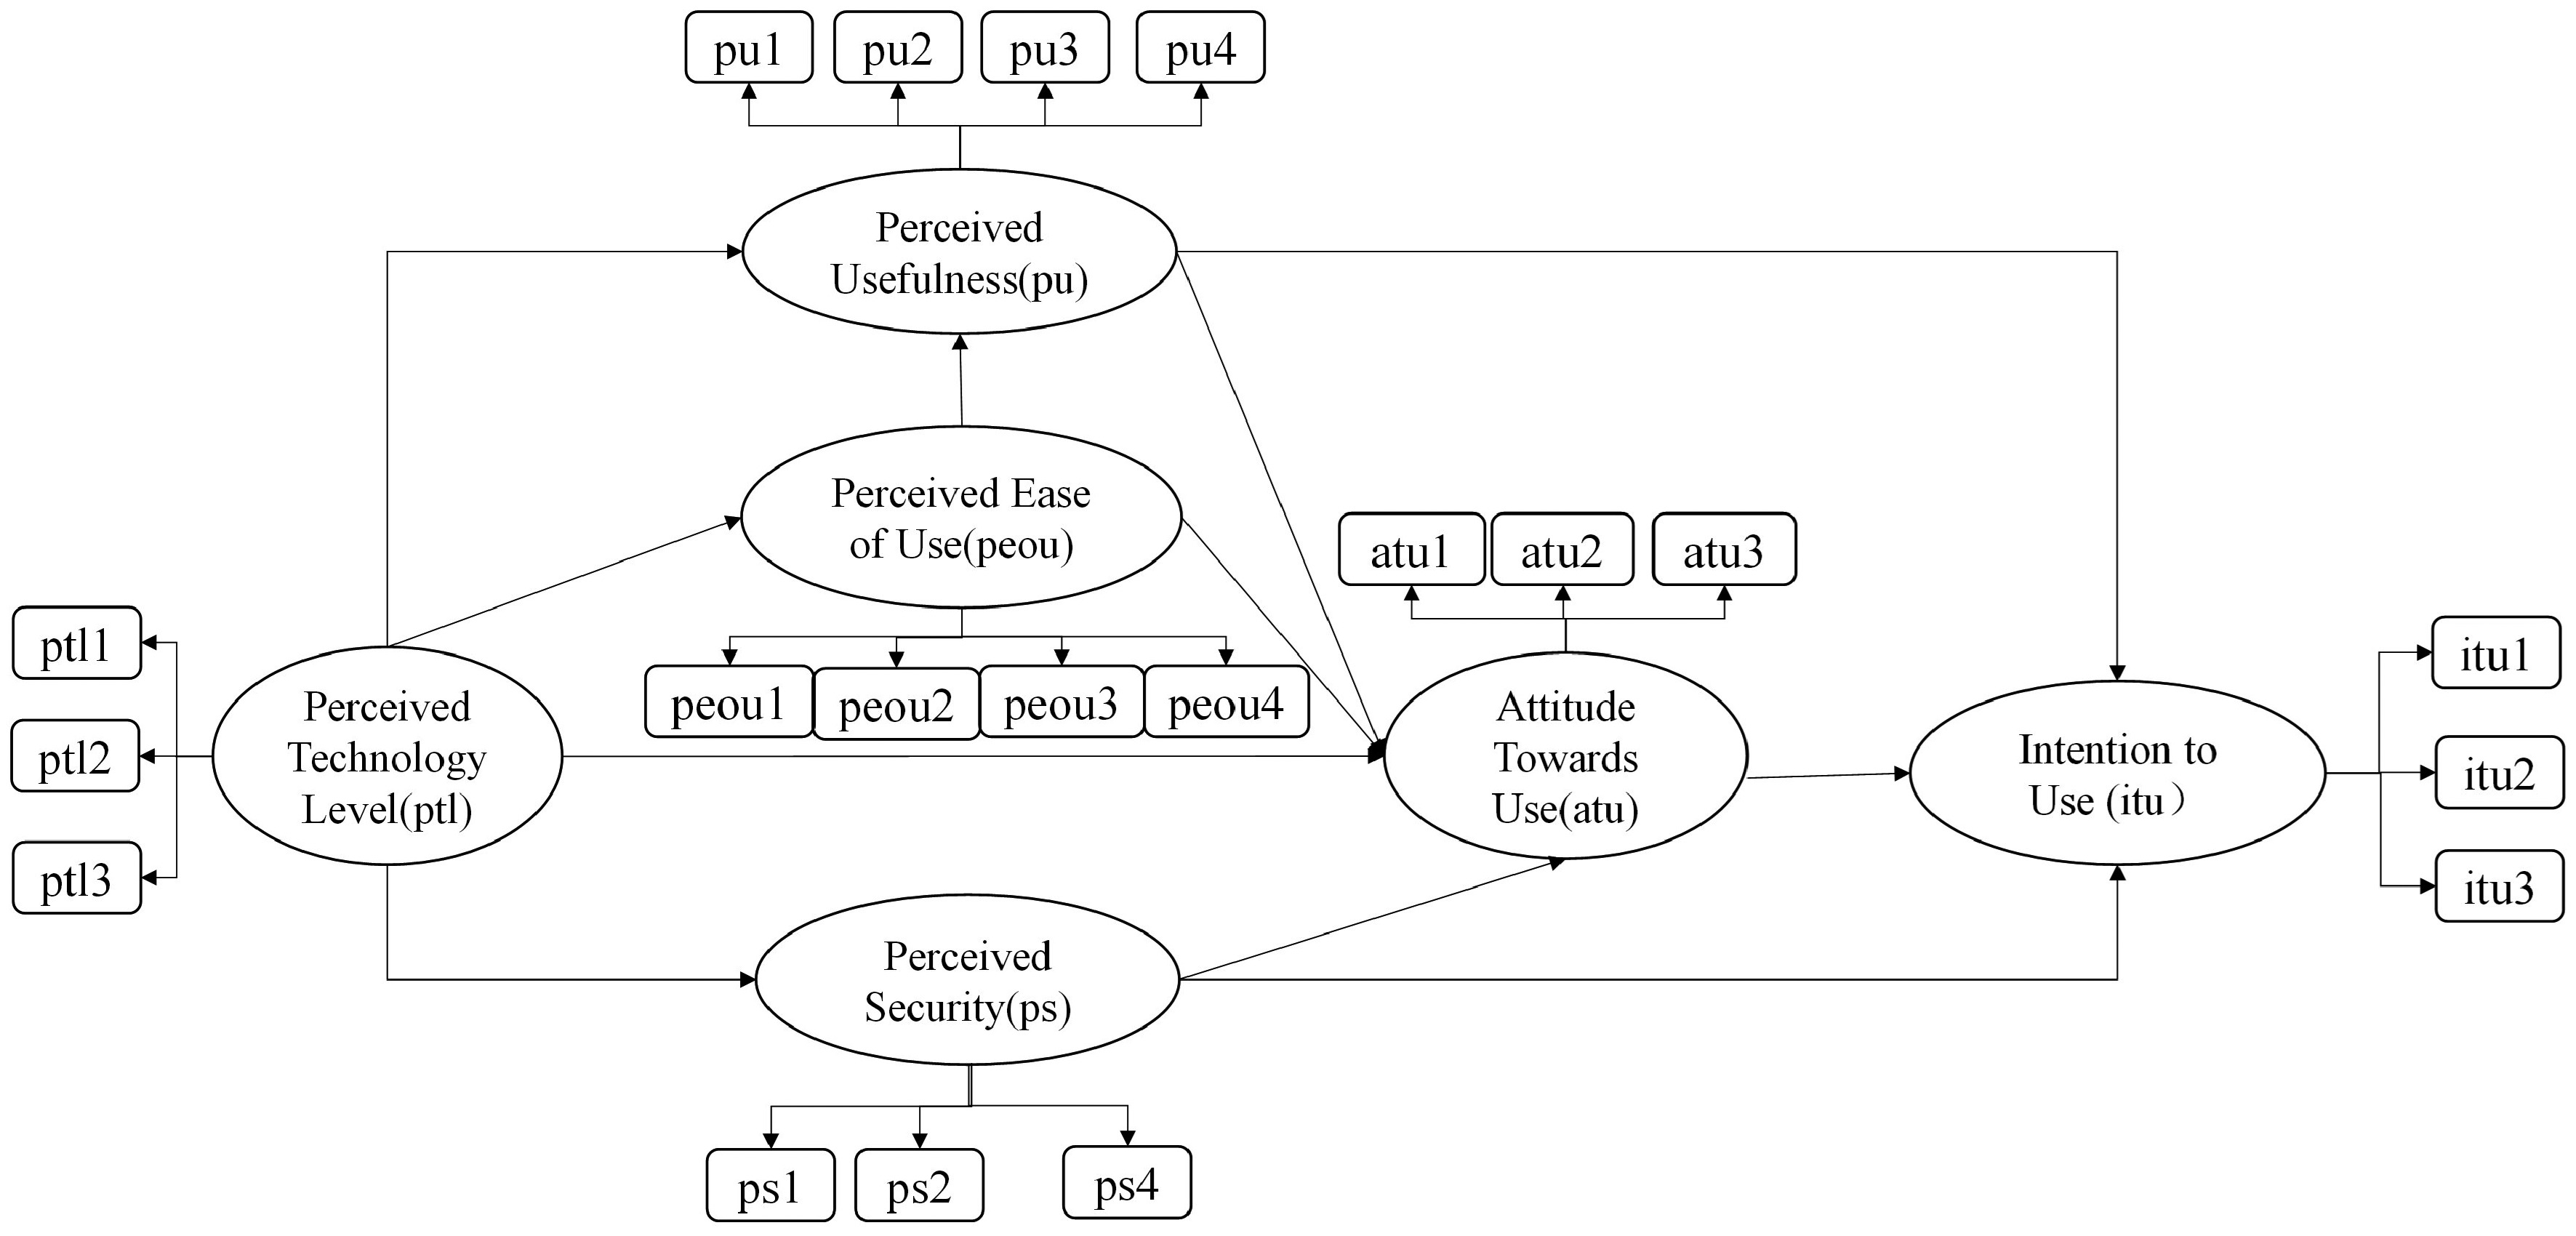
Figure 4.
Initial structural equation model of the extended TAM.
-
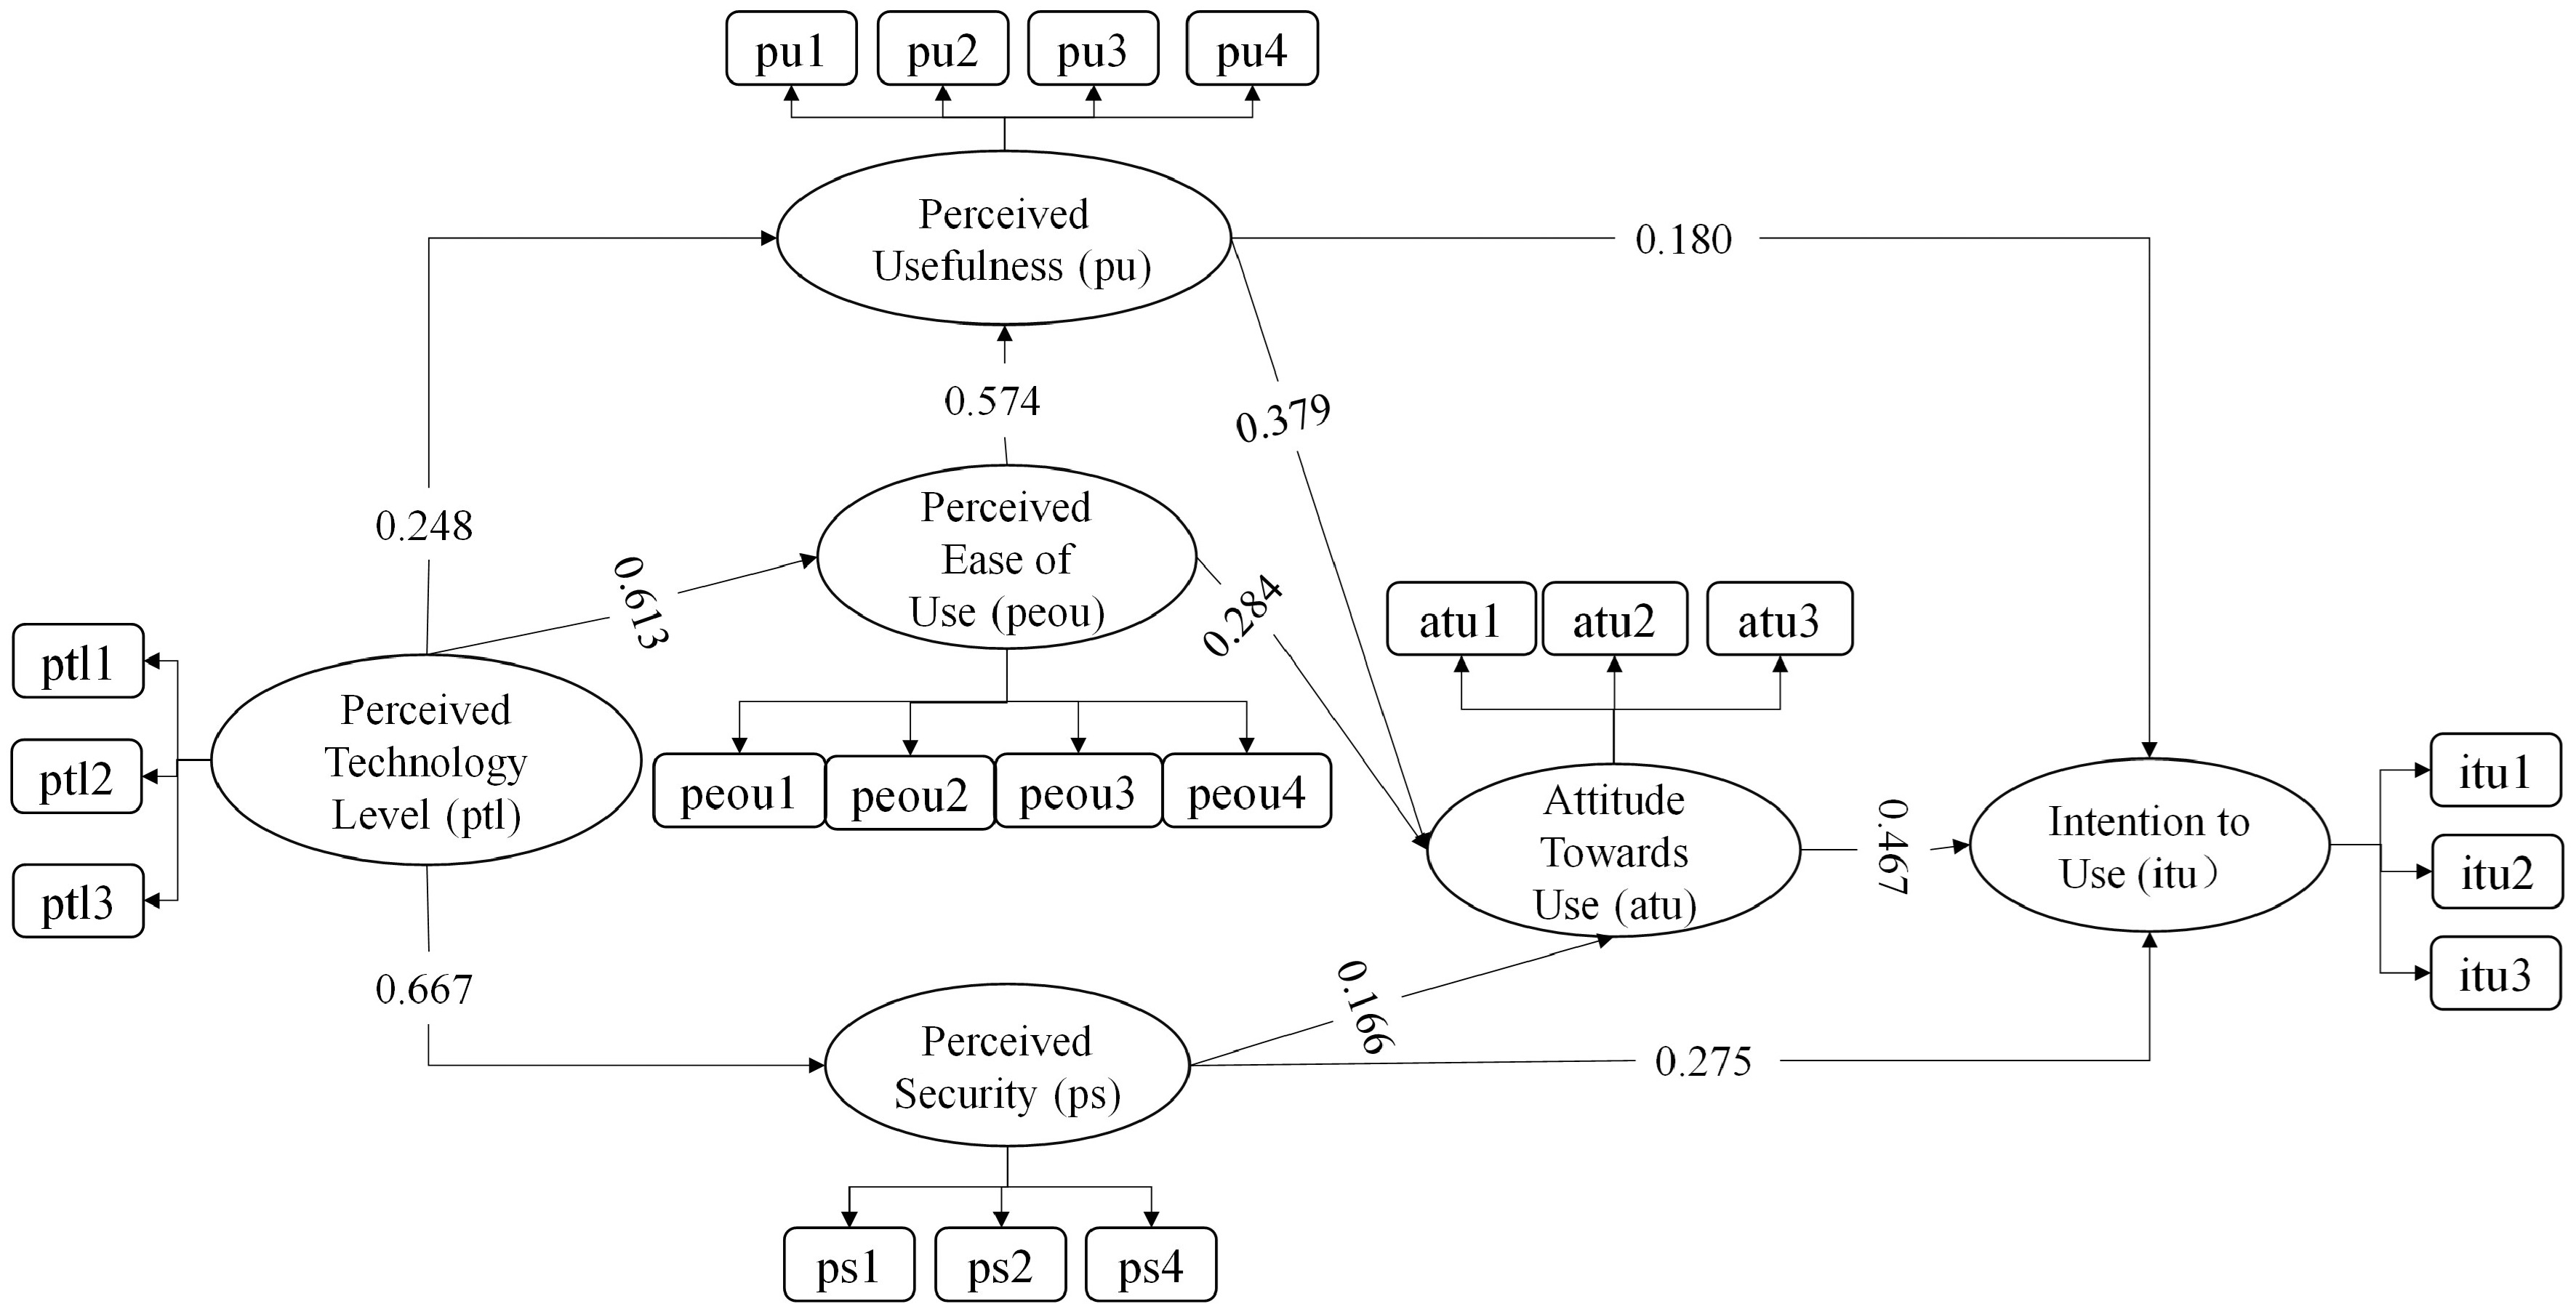
Figure 5.
The results of the path coefficients.
-
The behavioural theory model adopted Important influencing factors Sample size Measurement method Sources Extended TAM Trust, perceived ease of use, perceived safety, perceived usefulness, Intention to use, and attitudes towards use 300 PLS-SEM Xu et al.[17] Extended TAM Perceived usefulness, perceived ease of use, perceived risk, perceived comfort, trust, attitudes, intention to use 401 SEM Wu et al.[18] TAM and TPB Attitudes, trust, subjective norms, perceived usefulness, compatibility 173 SEM Rahman et al.[19] Extended UTAUT Performance expectations, effort expectations, social influence, facilitating conditions, anxiety, perceived price, and individual innovativeness − − Lee & Jung[20] Extended UTAUT Performance expectations, hedonic motivation, social influence, facilitating conditions 315 Factor analysis Madigand et al.[5] Extended TAM Trust, perceived usefulness, perceived ease of use, external control factors 552 SEM Choi & Ji[21] Extended TAM Individual differences, systemic influences, social characteristics, perceived usefulness, perceived ease of use, attitudes towards use, intention to use 268 SEM Herrenkind et al.[22] Extended TAM Perceived security risk, perceived privacy and security, perceived usefulness, perceived ease of use, attitudes towards use, intention to use 216 SEM Zhang et al.[23] Extended TAM Life choices, subjective well-being, travel quality factors, life domains, perceived usefulness, perceived ease of use, attitudes towards use, intention to use 268 PLS-SEM Herrenkind et al.[24] Extended TAM Personality innovation, driving pleasure, trust, perceived usefulness, perceived ease of use. 369 SEM Hegner et al.[25] Extended TPB Subjective norms, perceived behavioural control, perceived risk, attitudes, autonomous driving knowledge, Intention to use 906 SEM Jing et al.[26] Extended TAM Trust, social influence, personal characteristics, perceived ease of use, perceived usefulness, intention to use 647 PLS-SEM Zhang et al.[27] Extended TAM Environmental concerns, green perceived usefulness, perceived ease of use, intention to use 470 SEM Wu et al.[28] Table 1.
Studies on the acceptance of autonomous driving based on behavioural theory.
-
Anchoring theory Object Major factor Sources TAM Autonomous shuttle Extended using trust and perceived enjoyment. Chen[9] Autonomous electric buses Extended social impact, individual differences and system characteristics, Herrenkind et al.[22] Autonomous buses Perceived safety, bus service quality, and moderator variable Yan et al.[29] Autonomous buses Perceived risk, trust Wu et al.[18] UTAUT Automated road transport systems Performance expectancy, effort expectancy, social influence, socio-demographics Madigan et al.[30] UTAUT2 Autonomous public transport systems performance expectancy, effort expectancy, social influence, facilitating conditions, hedonic motivation, price value, habit, trust and safety, perceived usefulness, perceived risk, and behavioural intention Korkmaz et al.[31] TAM and TPB Autonomous shuttle Relative advantage, compatibility, complexity, trialability, observability, attitude, intention to use Moták et al.[32] UTAUT, TTF, and trust Autonomous buses Performance expectancy, effort expectancy, social influence, facilitating conditions, perceived risk, trust, task technology fit Cai et al.[16] UTAUT2 Autonomous modular transit Performance expectancy, social influence, hedonic motivations, trust, green perceived usefulness Rejali et al.[33] TIB Autonomous shuttle Social factors, feelings, safety perception, operation environment, behavioural intention Salonen & Haavisto[34] Table 2.
Representative studies on acceptance of autonomous buses.
-
Sources Trust Safety Cognition of technology Impact to PU and PEOU Multi-group analysis Chen[9] ○ √ √ √ ○ Herrenkind et al.[22] ○ √ √ ○ √ Yan et al.[29] √ ○ √ ○ ○ Wu et al.[18] ○ √ √ √ ○ Madigan et al.[30] √ √ ○ √ ○ Korkmaz et al.[31] ○ ○ ○ √ ○ Cai et al.[16] ○ √ √ √ ○ Salonen & Haavisto[34] √ √ ○ √ √ Current study ○ ○ ○ ○ ○ Table 3.
Factors considered in different models.
-
Name of latent variable Measuring
variableQuestion item Perceived technology level ptl1 Automated and connected vehicle technologies have begun to proliferate ptl2 Automated BRT systems are very advanced. ptl3 Automated and connected vehicle technologies can be applied to regular public transit. Perceived safety ps1 Automated BRT has a high level of safety quality. ps2 If there is a malfunction or danger, I believe that automated driving technology can protect my safety well. ps3 Automated BRT equipped with safety officers would make me feel very reassured. ps4 Automated rapid transit equipped with safe ride guidance (safety videos, posters, etc.) would make me feel very reassured. Perceived usefulness pu1 Automated BRT is convenient for my daily travel. pu2 The autonomous driving BRT runs smoothly. pu3 The autonomous driving BRT operates at a faster speed. pu4 The waiting time for the autonomous driving BRT is shorter compared to other modes of transportation. Perceived ease of use peou1 The process of taking the autonomous driving BRT is simple; even if I have never taken it before, I can easily take a ride. peou2 The station locations are very prominent and easy to find, so I can easily walk to the station. peou3 I can easily find the automated BRT route that I need to take to reach my destination. peou4 I am willing to take the autonomous driving BRT even if it requires transferring between different lines to reach my destination. Attitude towards use atu1 I support autonomous driving BRT. atu2 I think riding the autonomous driving BRT is a demonstration of support for new technologies. atu3 Autonomous driving technology will make public transportation more attractive to me. Intention to use itu1 I am willing to ride on the autonomous driving BRT. itu2 I am willing to recommend the autonomous driving BRT to others. itu3 I would prefer to take the autonomous driving BRT. Table 4.
Latent variables of the model and question items design.
-
Variable Title item Frequency Percentage (%) Gender Male 191 45.05 Female 233 54.95 Age (year) 18–24 46 10.85 25–34 235 55.42 35–50 127 29.95 51–65 15 3.54 65+ 1 0.24 Monthly income (CNY) < 5,000 29 6.84 5,000–10,000 150 35.38 10,001–20,000 178 41.98 20,001–30,000 49 11.56 > 30,000 18 4.25 Academic qualifications High school and below 12 2.83 3-year college degree 38 8.96 bachelor's degree 328 77.36 Masters' degree and above 46 10.85 Occupation Civil servant 5 1.18 Company employee 341 80.42 Public sector employee 34 8.02 Self-employed 9 2.12 Students 27 6.37 Retiree 6 1.42 Others 2 0.47 Family structure Single 71 16.75 Husband and wife 47 11.08 Couple living with children 269 63.44 Couple living with parents 37 8.73 Private car Yes 355 83.73 No 69 16.27 Driving licence Yes 374 88.21 No 50 11.79 Table 5.
Description of sample feature distribution.
-
Latent variable Measured variable Standard load Cronbach alpha CR AVE Attitude towards use atu1 0.814 0.697 0.831 0.622 atu2 0.725 atu3 0.823 Intention to use itu1 0.833 0.751 0.858 0.668 itu2 0.796 itu3 0.821 Perceived ease of use peou1 0.751 0.723 0.828 0.546 peou2 0.758 peou3 0.728 peou4 0.719 Perceived safety ps1 0.815 0.703 0.818 0.532 ps2 0.779 ps3 0.600 ps4 0.706 Perceived technology level ptl1 0.762 0.672 0.820 0.603 ptl2 0.753 ptl3 0.814 Perceived usefulness pu1 0.710 pu2 0.731 0.708 0.820 0.533 pu3 0.742 pu4 0.735 Underline means the measured variable does not well support the latent variable. Table 6.
Tests and analysis of model reliability.
-
Attitude towards use Perceived safety Perceived
technology levelPerceived
ease of usePerceived
usefulnessIntention to use Attitude towards use − − − − − − Perceived safety 0.635 − − − − − Perceived technology level 0.555 0.667 − − − − Perceived ease of use 0.671 0.675 0.613 − − − Perceived usefulness 0.671 0.733 0.600 0.726 − − Intention to use 0.706 0.704 0.623 0.722 0.712 − Arithmetic square root of AVE 0.789 0.795 0.777 0.739 0.730 0.817 Table 7.
Discriminant validity test results.
-
Path relationships p-value Path factor Significance Attitude towards use →
Intention to use0.000 0.468 Significant Perceived safety →
Attitude towards use0.038 0.129 Significant Perceived safety → Intention to use 0.000 0.275 Significant Perceived technology level →
Attitude towards use0.057 0.090 Not significant Perceived technology level → Perceived safety 0.000 0.667 Significant Perceived technology level → Perceptual ease of use 0.000 0.613 Significant Perceived technology level → Perceived usefulness 0.000 0.249 Significant Perceived ease of use →
Attitude towards use0.000 0.262 Significant Perceived ease of use →
Perceived usefulness0.000 0.574 Significant Perceived usefulness →
Attitude towards use0.000 0.368 Significant Perceived usefulness →
Intention to use0.001 0.180 Significant Underline means the path factor is not significant in the model. Table 8.
Model path coefficients and hypothesis testing results.
-
Path relationship Direct effect Indirect effect Total
affectSequence Attitude towards use → Intention to use 0.467 − 0.467 2 Perceived safety →
Intention to use0.275 0.077 0.352 4 Perceived technology level → Intention to use − 0.530 0.530 1 Perceived ease of use → Intention to use − 0.338 0.338 5 Perceived safety →
Attitude towards use0.166 − − − Perceived technology level → Perceived safety 0.667 − − − Perceived technology level → Perceived ease of use 0.613 − − − Perceived ease of use → Perceived usefulness 0.248 − − − Perceived ease of use → Attitude towards use 0.284 − − − Perceived ease of use → Perceived usefulness 0.574 − − − Perceived usefulness → Attitude towards use 0.379 − − − Perceived usefulness → Intention to use 0.180 0.177 0.357 3 Table 9.
Influence factor coefficients.
-
Path relationships Gender p-value Standardised estimate Attitude towards use →
Intention to useMale 0.000 0.465 Female 0.000 0.445 Perceived safety →
Attitude towards useMale 0.979 −0.002 Female 0.001 0.287 Perceived safety →
Intention to useMale 0.007 0.189 Female 0.000 0.340 Perceived technology level → Perceived safety Male 0.000 0.622 Female 0.000 0.696 Perceived technology level → Perceived ease of use Male 0.000 0.562 Female 0.000 0.644 Perceived technology level → Perceived usefulness Male 0.000 0.249 Female 0.001 0.234 Perceived ease of use →
Attitude towards useMale 0.000 0.306 Female 0.002 0.227 Perceived ease of use →
Perceived usefulnessMale 0.000 0.582 Female 0.000 0.584 Perceived usefulness →
Attitude towards useMale 0.000 0.483 Female 0.000 0.333 Perceived usefulness →
Intention to useMale 0.001 0.270 Female 0.055 0.129 Table 10.
Results of path effects regarding the impact of gender for each group.
-
Path relationship Age (year) p-value Standardised estimate Attitude towards use → Intention to use < 35 0.000 0.463 > 35 0.000 0.459 Perceived safety →
Attitude towards use< 35 0.014 0.203 > 35 0.330 0.096 Perceived safety →
Intention to use< 35 0.000 0.310 > 35 0.001 0.218 Perceived technology level → Perceived safety < 35 0.000 0.653 > 35 0.000 0.700 Perceived technology level → Perceived ease of use < 35 0.000 0.654 > 35 0.000 0.529 Perceived technology level → Perceived usefulness < 35 0.003 0.176 > 35 0.000 0.351 Perceived ease of use → Attitude towards use < 35 0.000 0.326 > 35 0.019 0.240 Perceived ease of use → Perceived usefulness < 35 0.000 0.629 > 35 0.000 0.513 Perceived usefulness → Attitude towards use < 35 0.000 0.295 > 35 0.000 0.502 Perceived usefulness → Intention to use < 35 0.000 0.296 > 35 0.069 0.127 Table 11.
Results of path effects regarding the impact of age for each group.
-
Path relationship Monthly
income (CNY)p-value Standardised estimate Attitude towards use → Intention to use < 10,000 0.000 0.543 ≥ 10,000 0.000 0.395 Perceived safety →
Attitude towards use< 10,000 0.010 0.257 ≥ 10,000 0.156 0.100 Perceived safety →
Intention to use< 10,000 0.000 0.246 ≥ 10,000 0.000 0.283 Perceived technology level → Perceived safety < 10,000 0.000 0.689 ≥ 10,000 0.000 0.655 Perceived technology level → Perceived ease of use < 10,000 0.000 0.608 ≥ 10,000 0.000 0.626 Perceived technology level → Perceived usefulness < 10,000 0.001 0.239 ≥ 10,000 0.000 0.262 Perceived ease of use → Attitude towards use < 10,000 0.000 0.310 ≥ 10,000 0.002 0.254 Perceived ease of use → Perceived usefulness < 10,000 0.000 0.605 ≥ 10,000 0.000 0.545 Perceived usefulness → Attitude towards use < 10,000 0.009 0.281 ≥ 10,000 0.000 0.456 Perceived usefulness → Intention to use < 10,000 0.013 0.161 ≥ 10,000 0.004 0.220 Table 12.
Results of path effects regarding the impact of income for each group.
-
Path relationship Academic qualifications p-value Standardised estimate Attitude towards use → Intention to use Lower than a bachelor's degree 0.000 0.411 Bachelor's degree and above 0.000 0.477 Perceived safety → Attitude towards use Lower than a bachelor's degree 0.710 0.084 Bachelor's degree and above 0.006 0.184 Perceived safety → Intention to use Lower than a bachelor's degree 0.164 0.204 Bachelor's degree and above 0.000 0.275 Perceived technology level → Perceived ease of use Lower than a bachelor's degree 0.000 0.723 Bachelor's degree and above 0.004 0.659 Perceived technology level → Perceived ease of use Lower than a bachelor's degree 0.000 0.716 Bachelor's degree and above 0.000 0.601 Perceived technology level → Perceptual usefulness Lower than a bachelor's degree 0.510 0.110 Bachelor's degree and above 0.000 0.261 Perceived ease of use → Attitude towards use Lower than a bachelor's degree 0.011 0.485 Bachelor's degree and above 0.000 0.255 Perceived ease of use → Perceived usefulness Lower than a bachelor's degree 0.000 0.688 Bachelor's degree and above 0.000 0.564 Perceived usefulness → Attitude towards use Lower than a bachelor's degree 0.379 0.207 Bachelor's degree and above 0.000 0.396 Perceived usefulness → Intention to use Lower than a bachelor's degree 0.042 0.316 Bachelor's degree and above 0.002 0.169 Table 13.
Results on academic qualifications effects for each group.
Figures
(5)
Tables
(13)