-
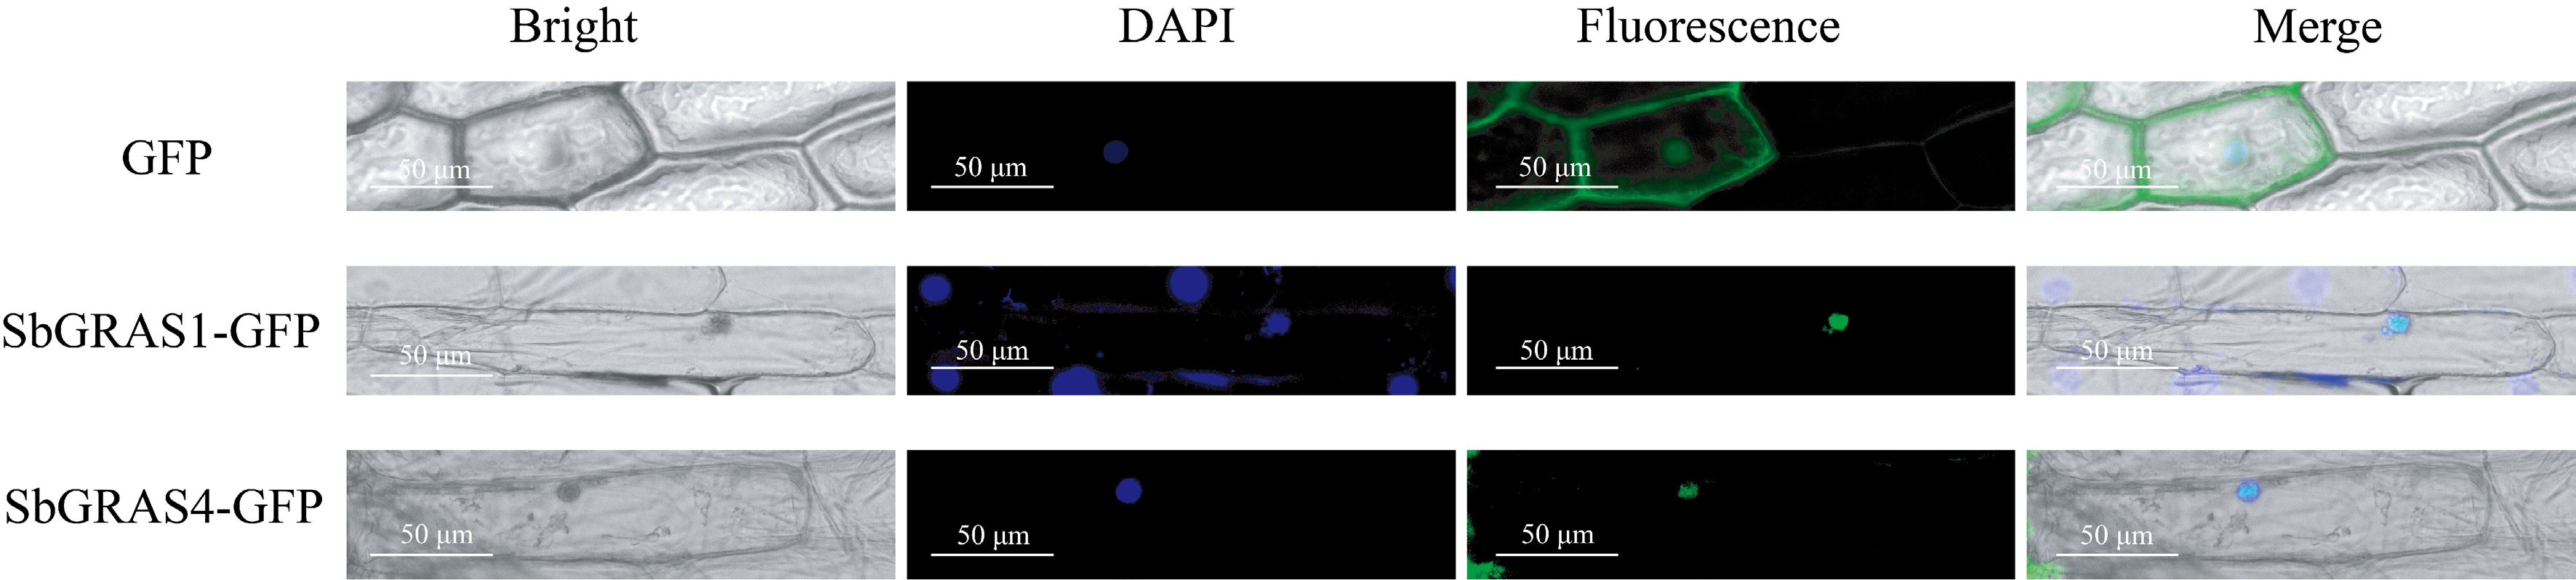
Figure 1.
Subcellular localization analysis. SbGRAS1 and SbGRAS4 are constructed onto the pEarleyGate103 vector. Scale bars = 50 μm.
-
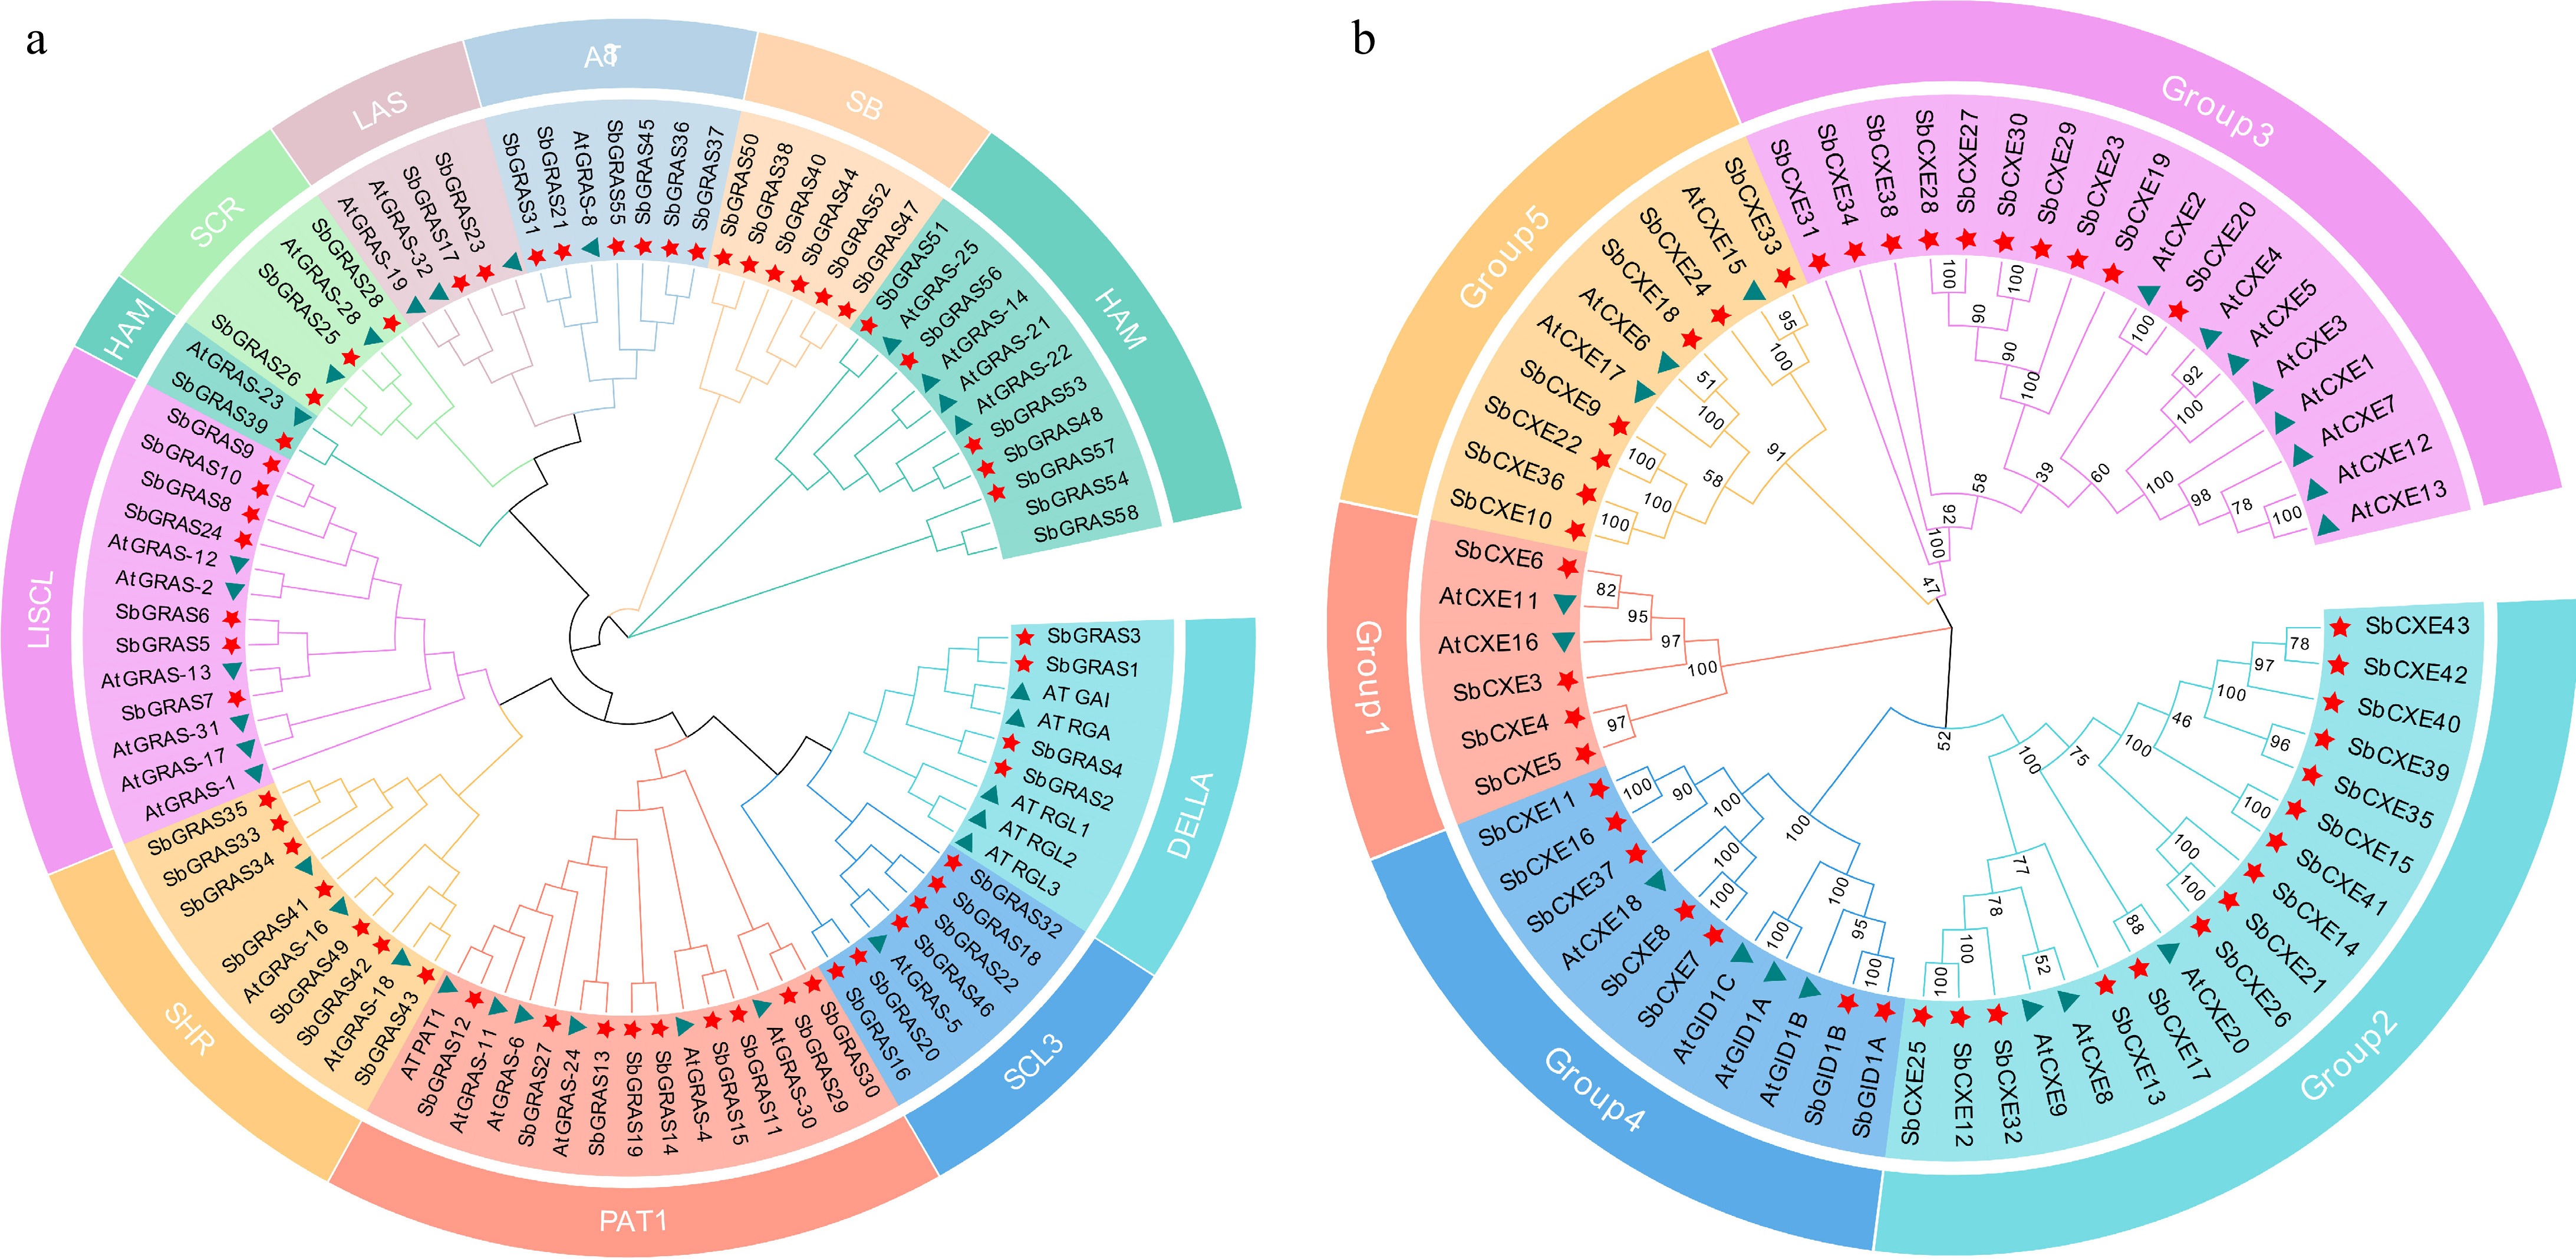
Figure 2.
Phylogenetic analysis of GRAS and CXE based on A. thaliana and S. baicalensis protein sequences. (a) GRAS proteins are divided into ten subfamilies, each of which is represented by a different color. Green triangles represent GRASs in A. thaliana, and red stars represent GRASs in S. baicalensis. (b) CXE proteins are divided into five subfamilies, each of which is represented by a different color. Green triangles represent CXE in A. thaliana, and red stars represent CXE in S. baicalensis. The phylogenetic tree was constructed by MEGA X using the neighbor-joining (NJ) method.
-
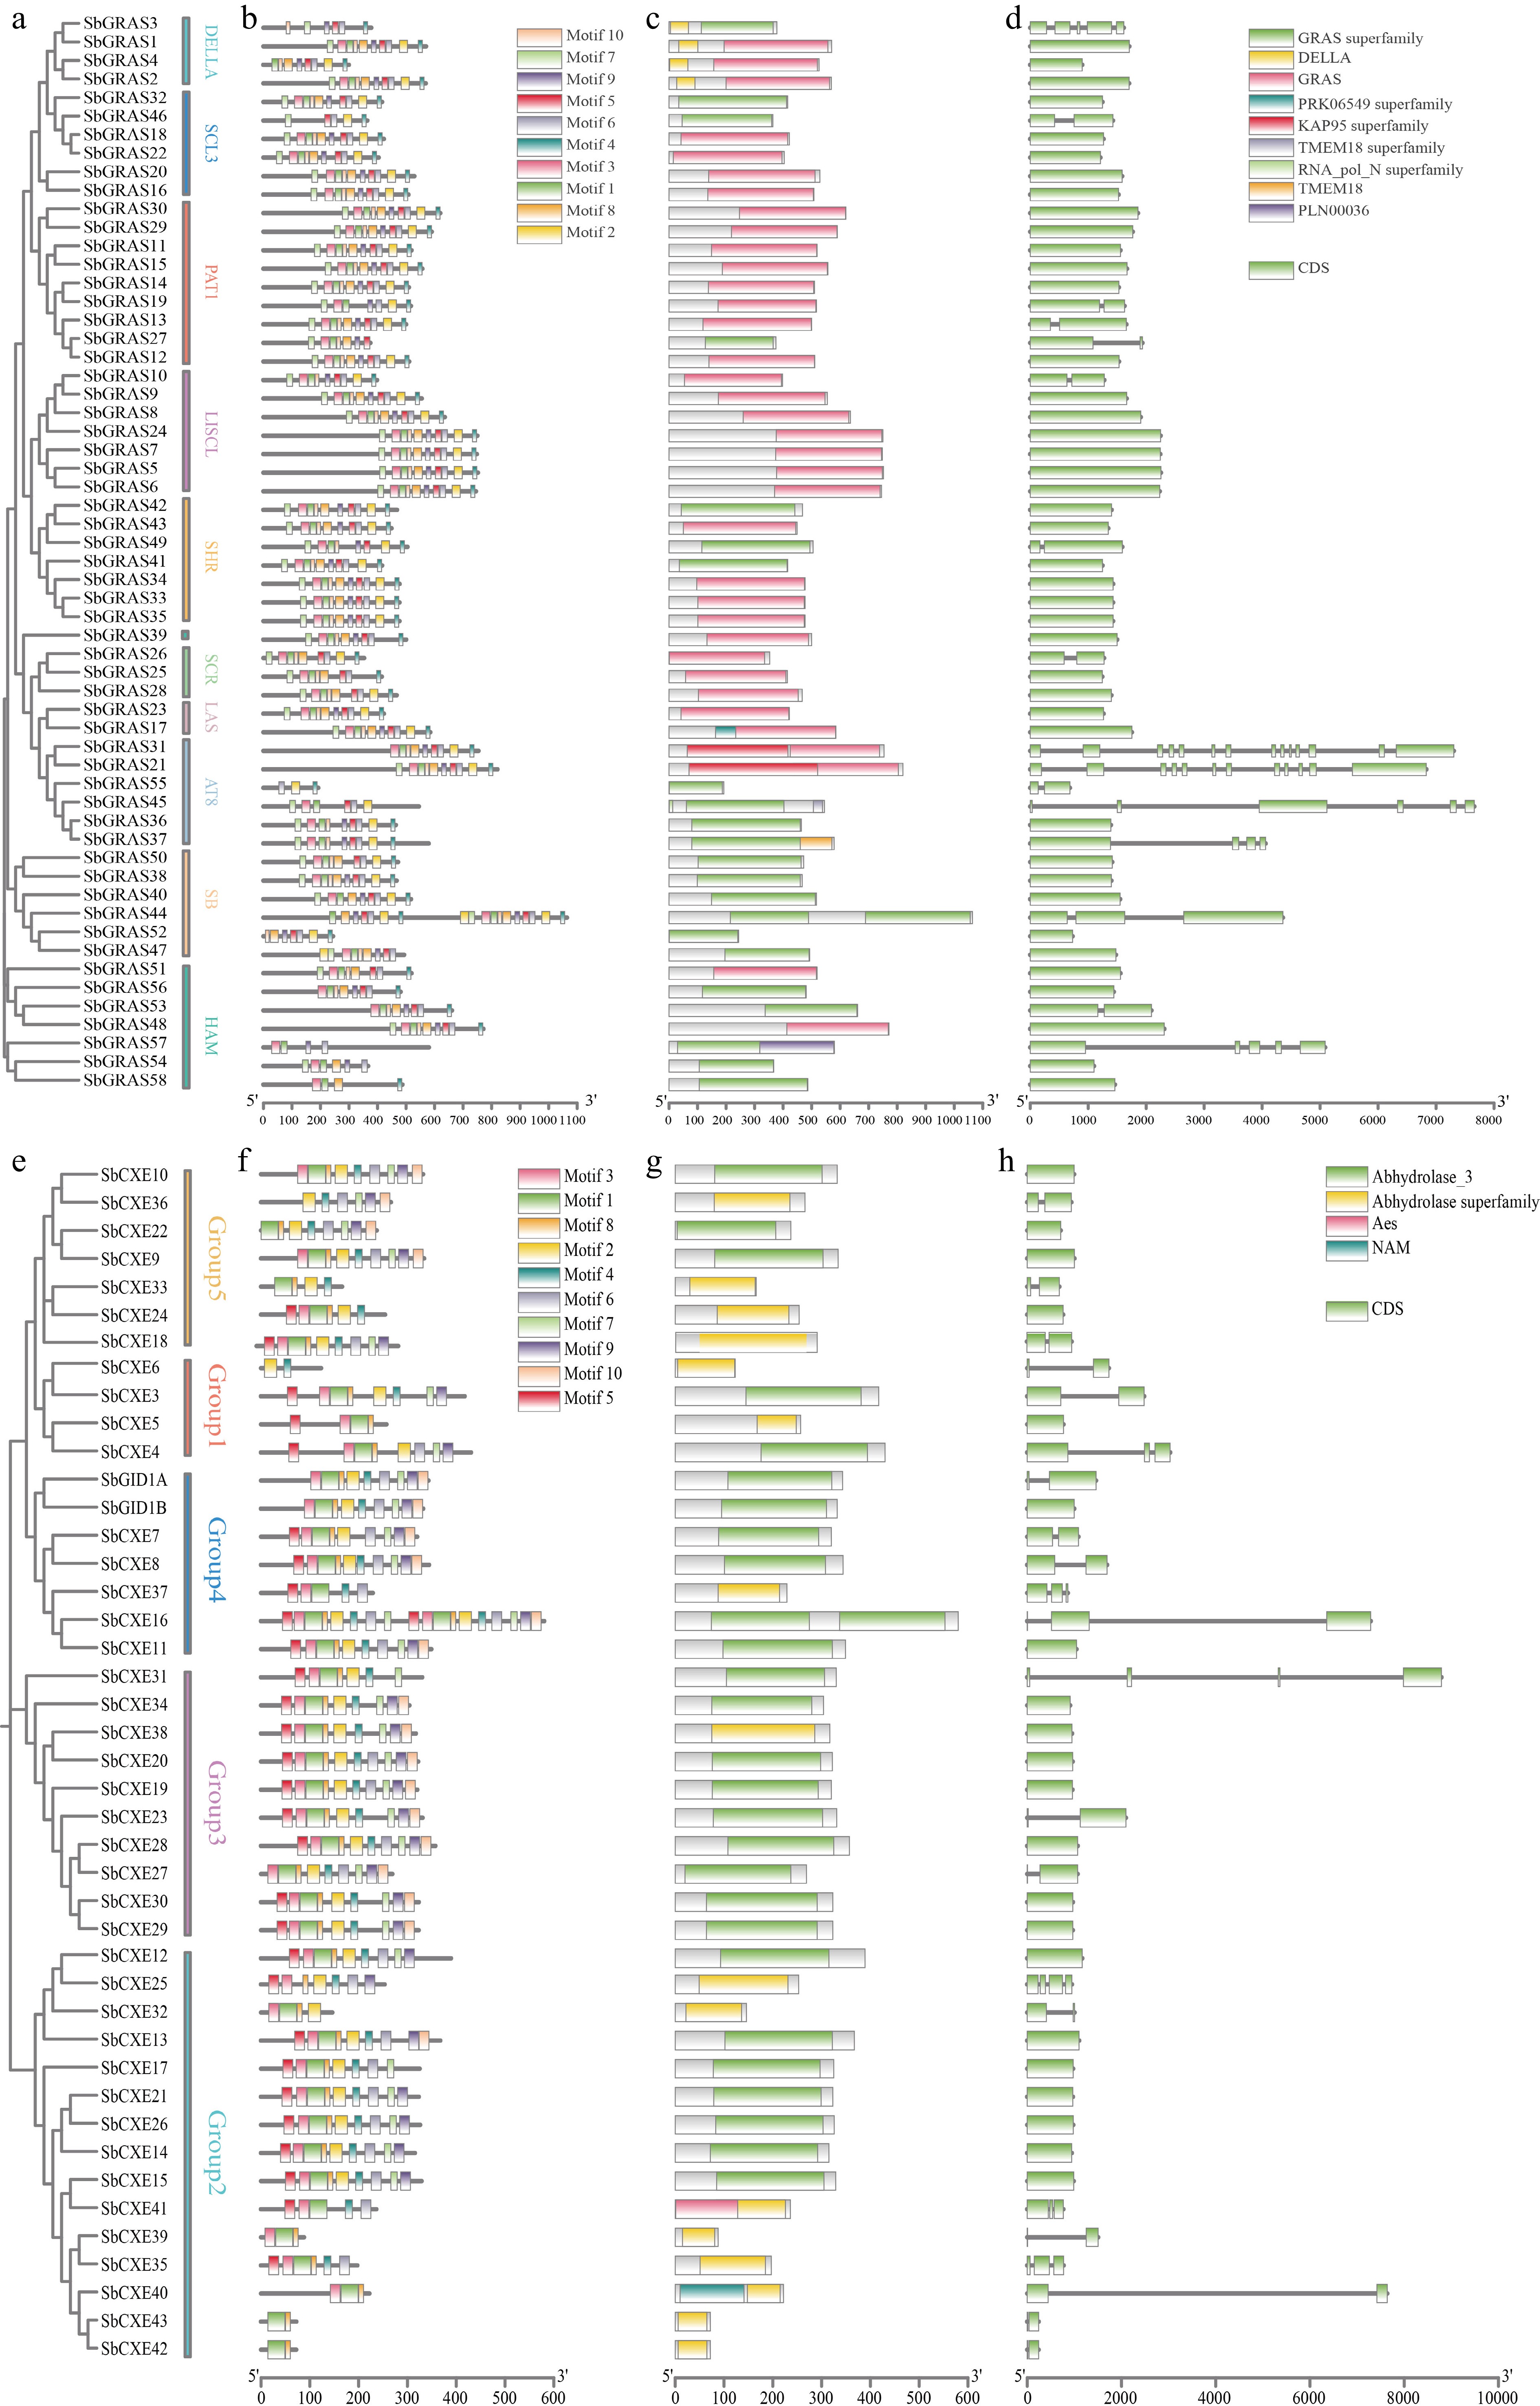
Figure 3.
Phylogeny, gene motifs, domains, and structural analyses of the S. baicalensis GRAS and CXE families. (a) Phylogenetic tree and grouping of the S. baicalensis GRAS family. (b) Gene motifs of GRAS in S. baicalensis. (c) GRAS family domains of S. baicalensis. (d) Gene structures of GRAS family in S. baicalensis. (e) Phylogenetic tree and grouping of the S. baicalensis CXE family. (f) Gene motifs of CXE in S. baicalensis. (g) CXE family domains of S. baicalensis. (h) Gene structures of CXE family in S. baicalensis.
-
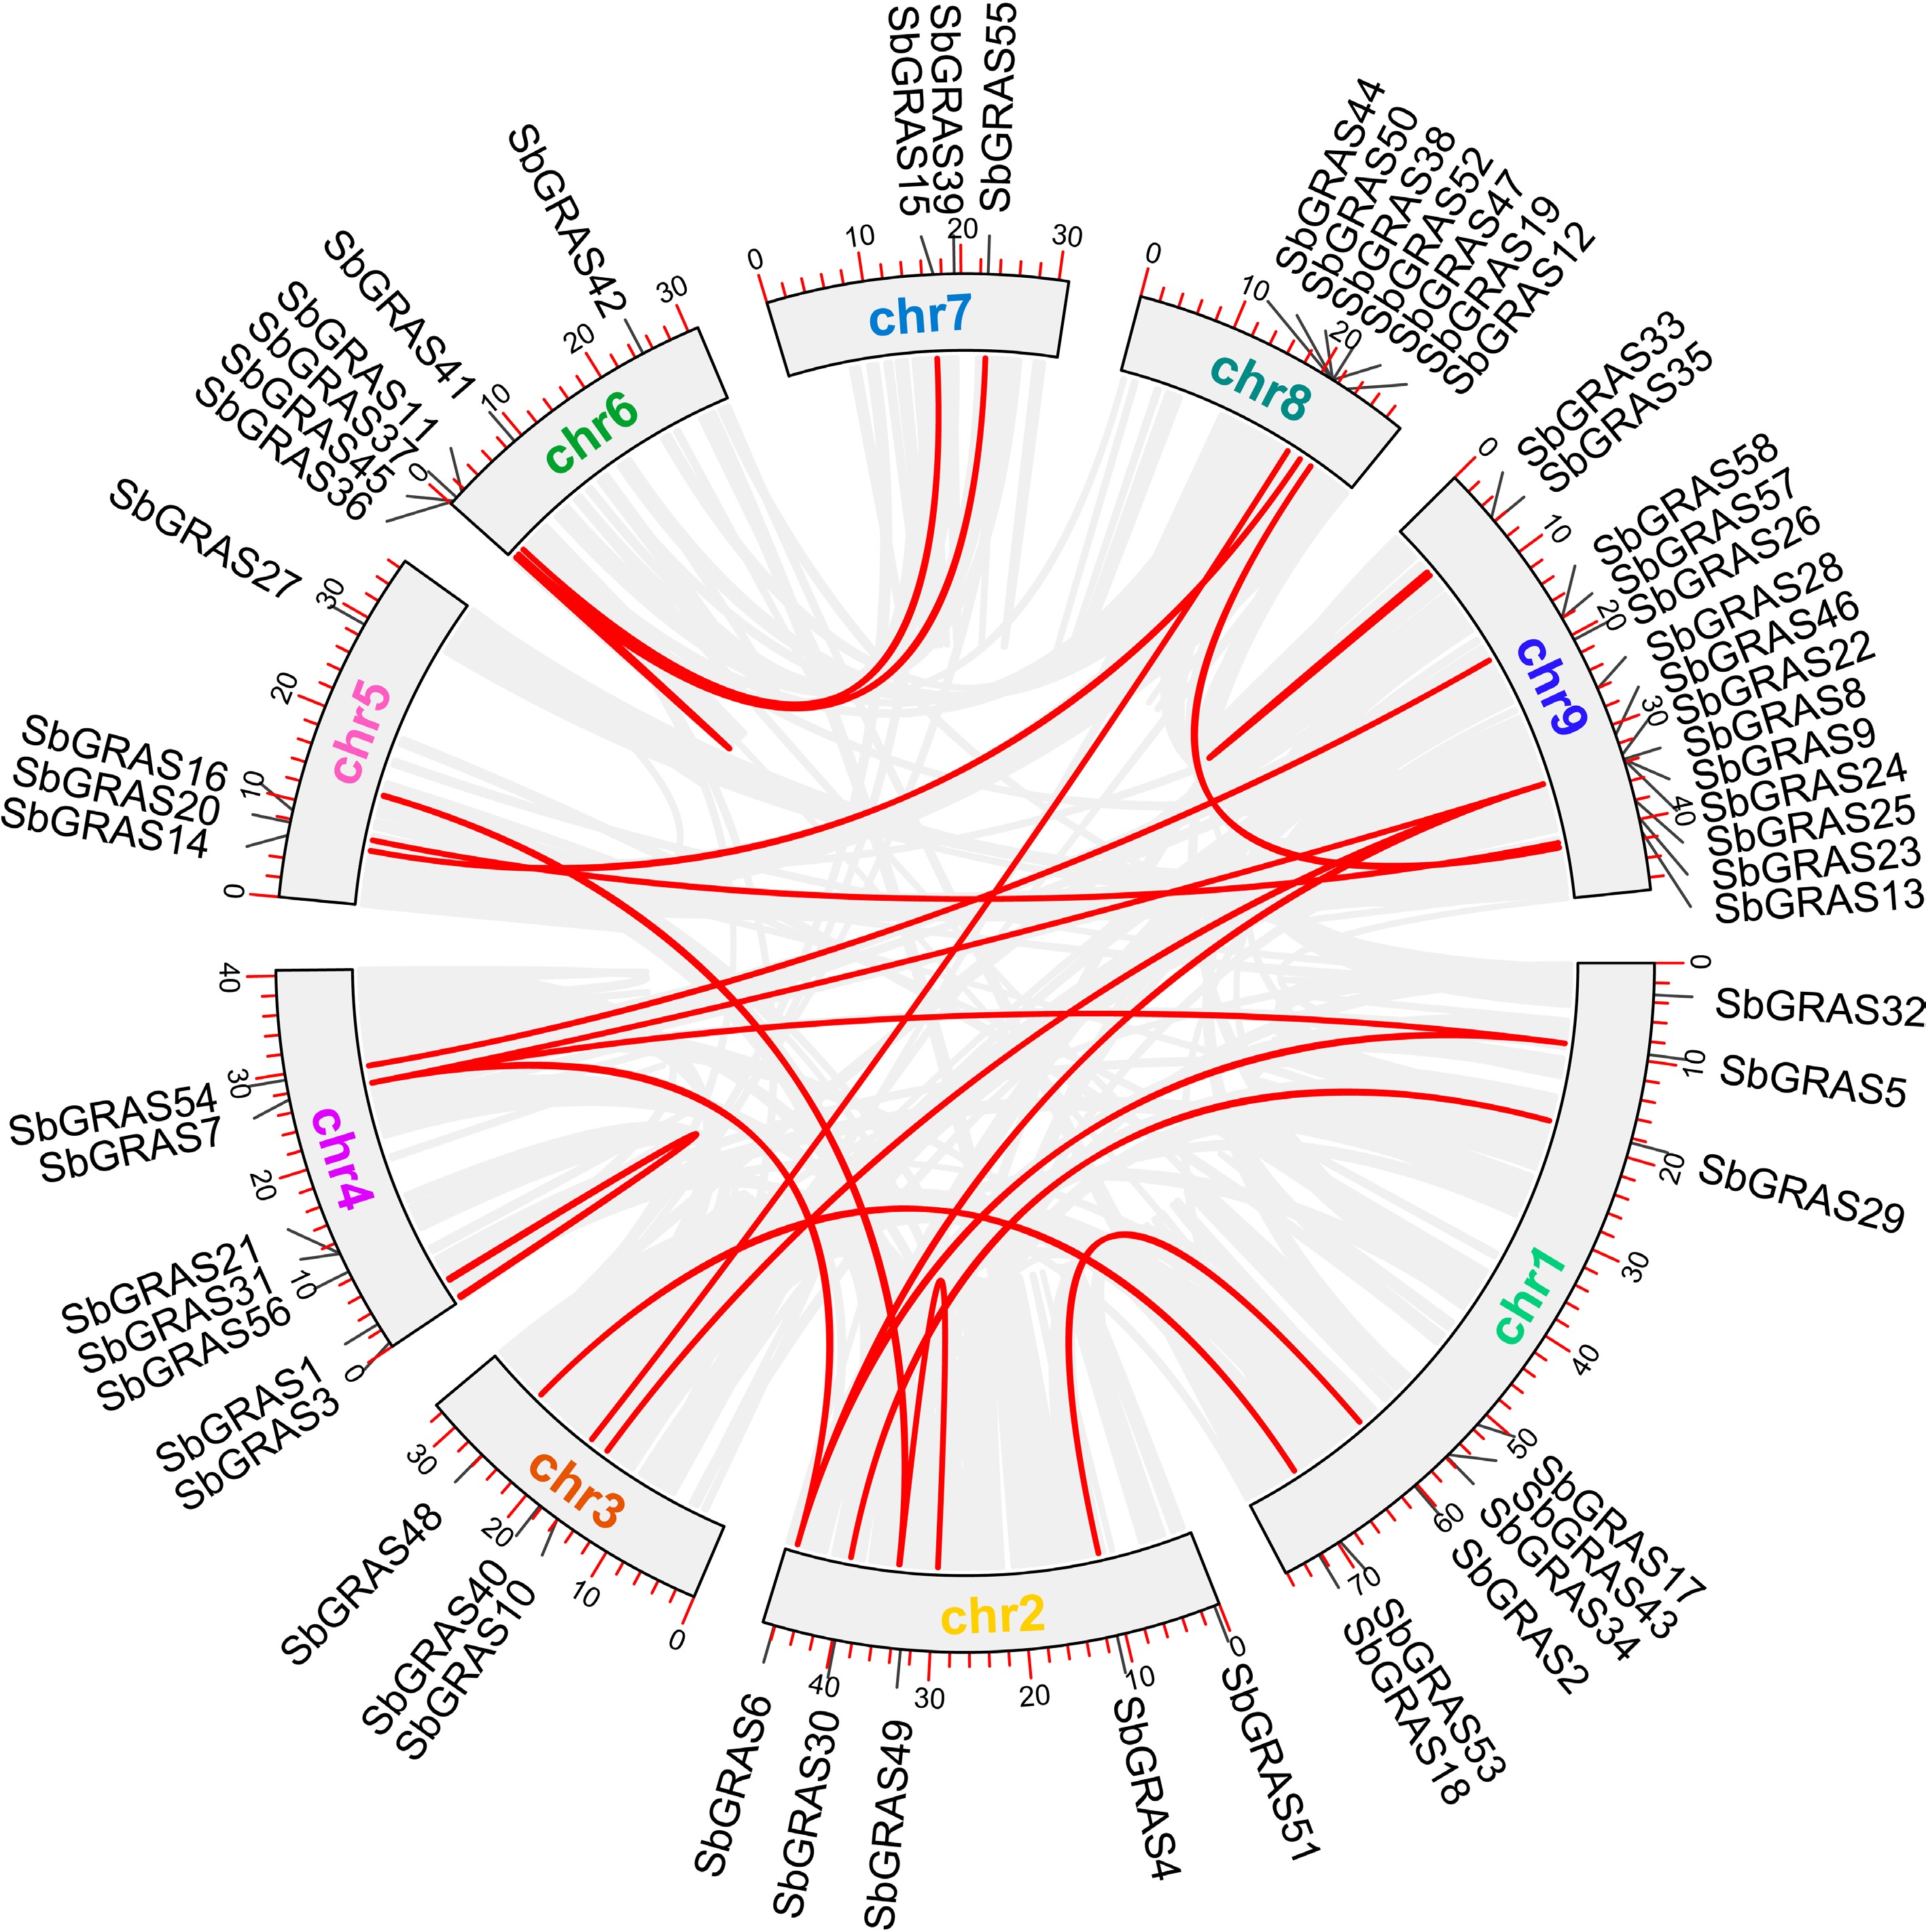
Figure 4.
SbGRAS chromosomal duplication analysis. Red lines represent SbGRAS gene pairs.
-
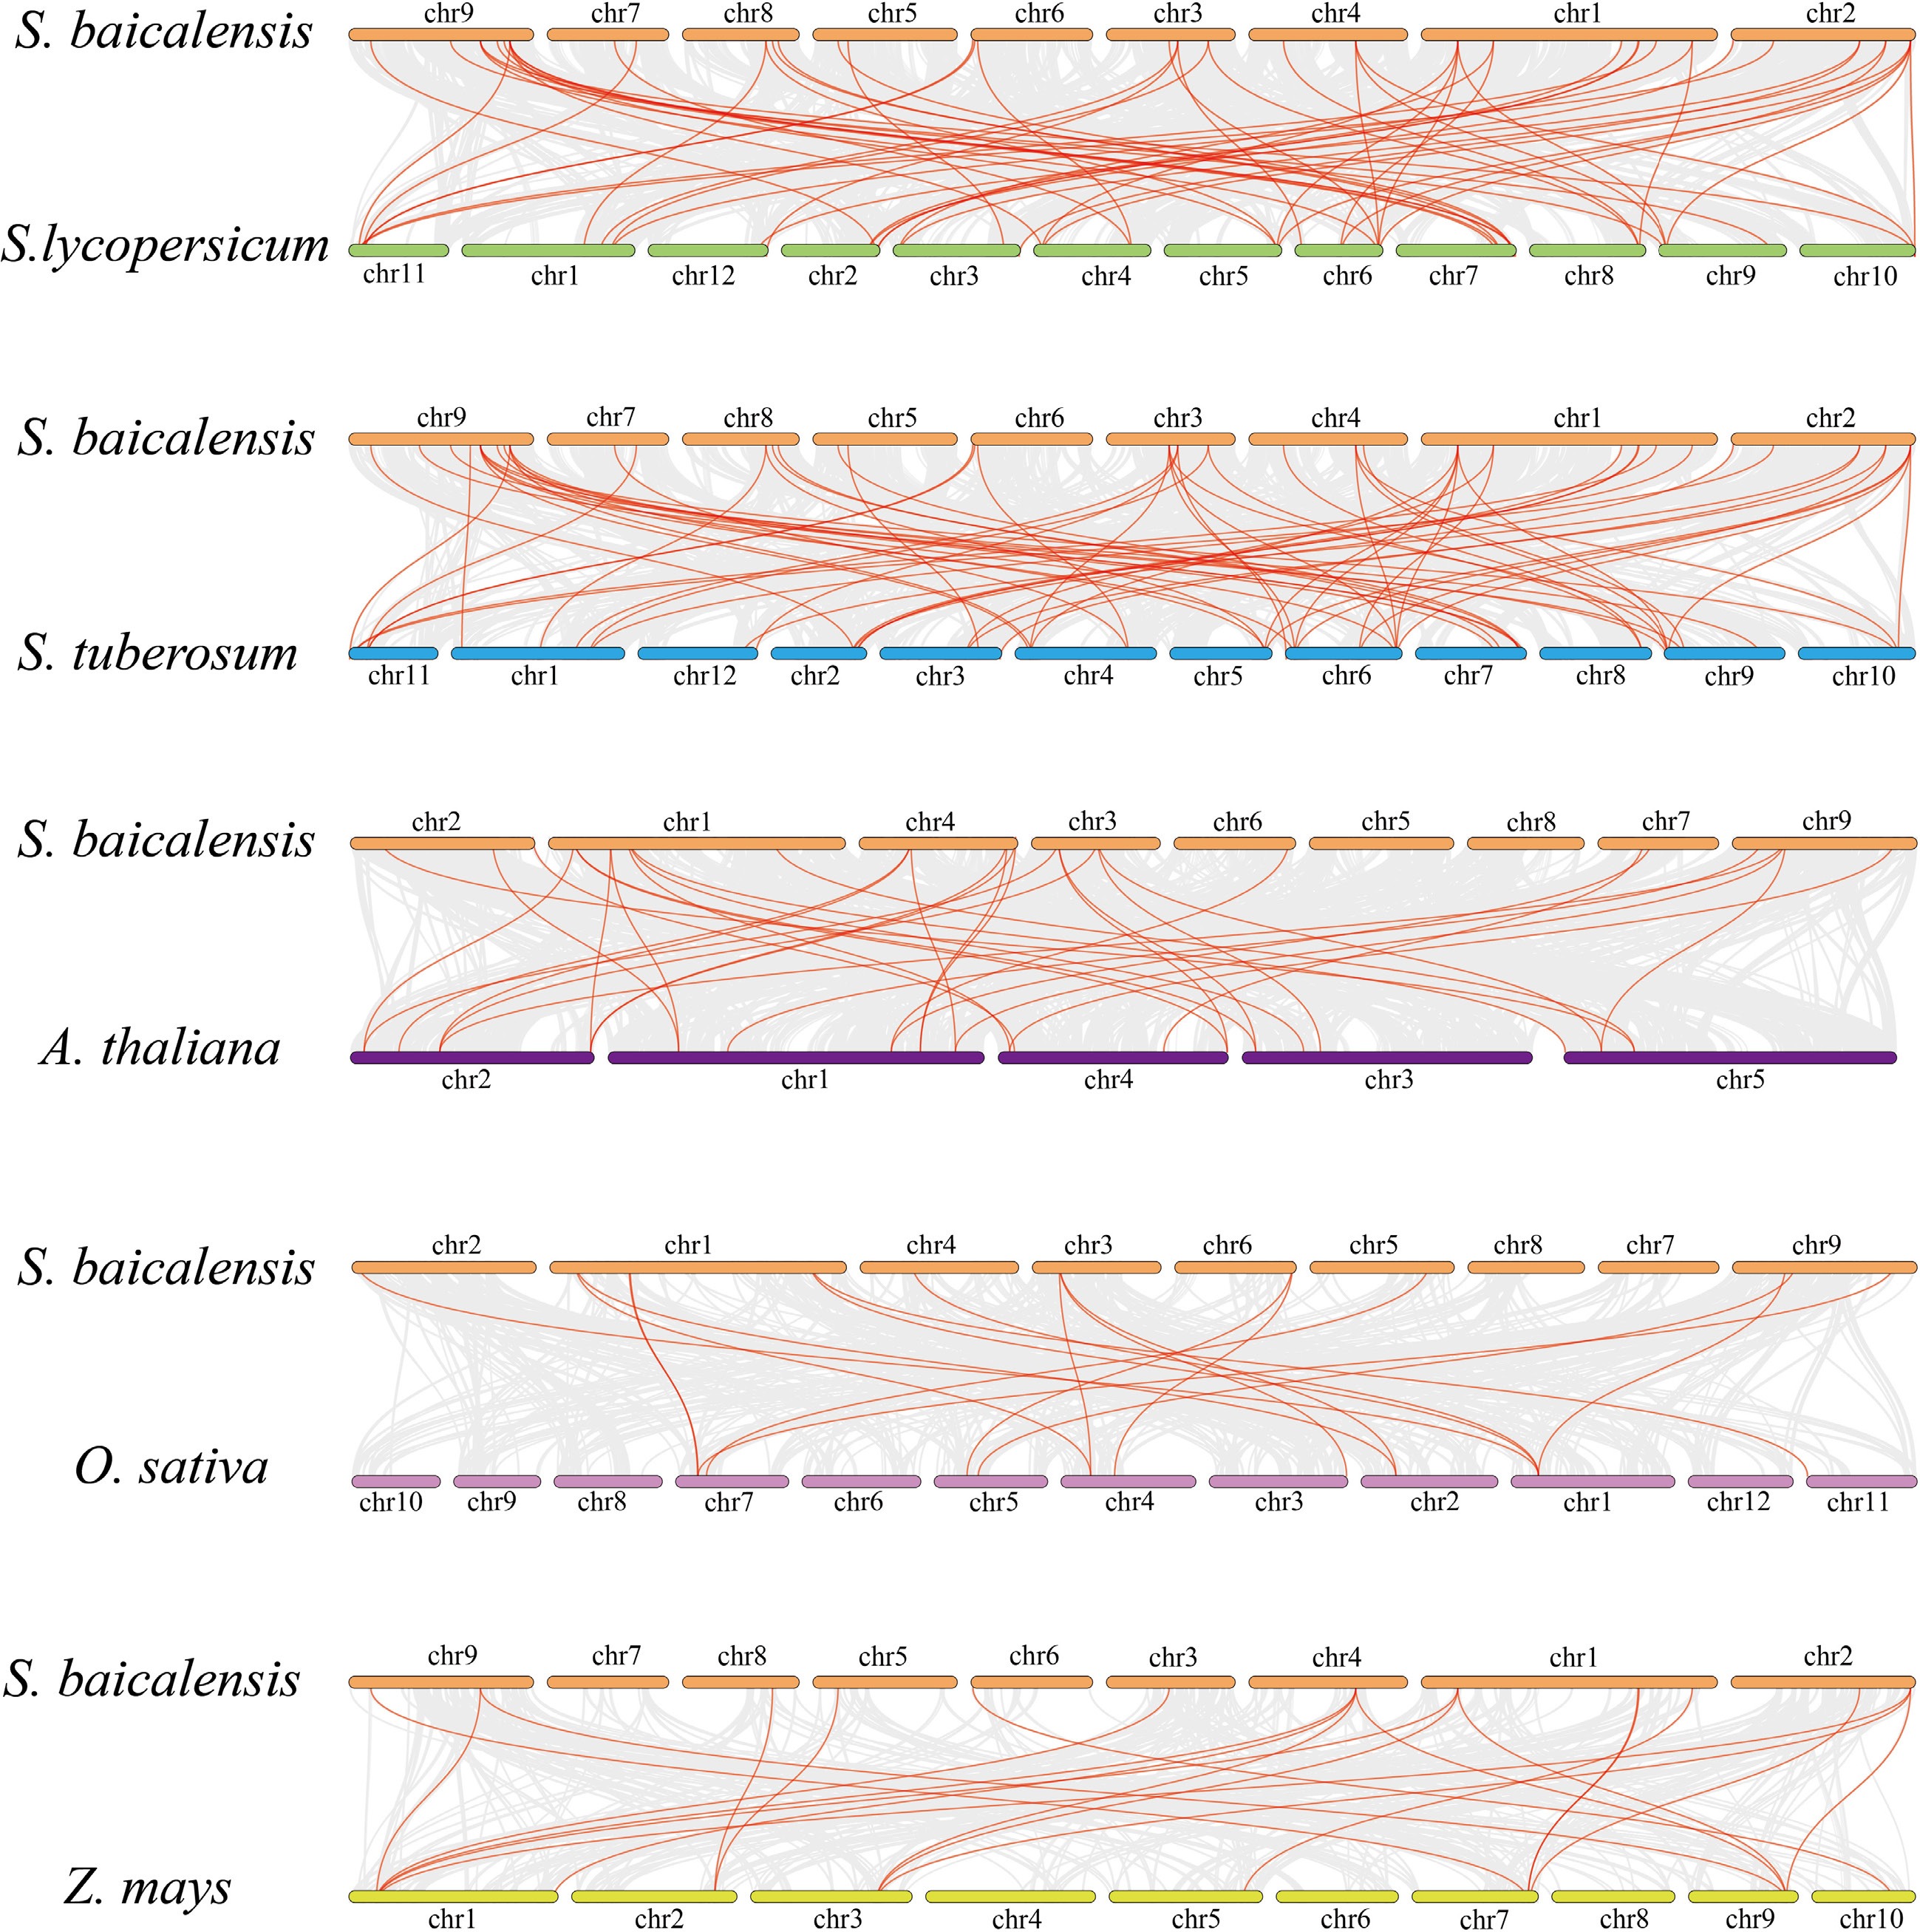
Figure 5.
Homology analysis of S. bacalensis and the remaining four plants. Gray lines indicate the homology genes of S. bacalensis and other species, and red lines indicate the GRAS of S. baicalensis and other species.
-
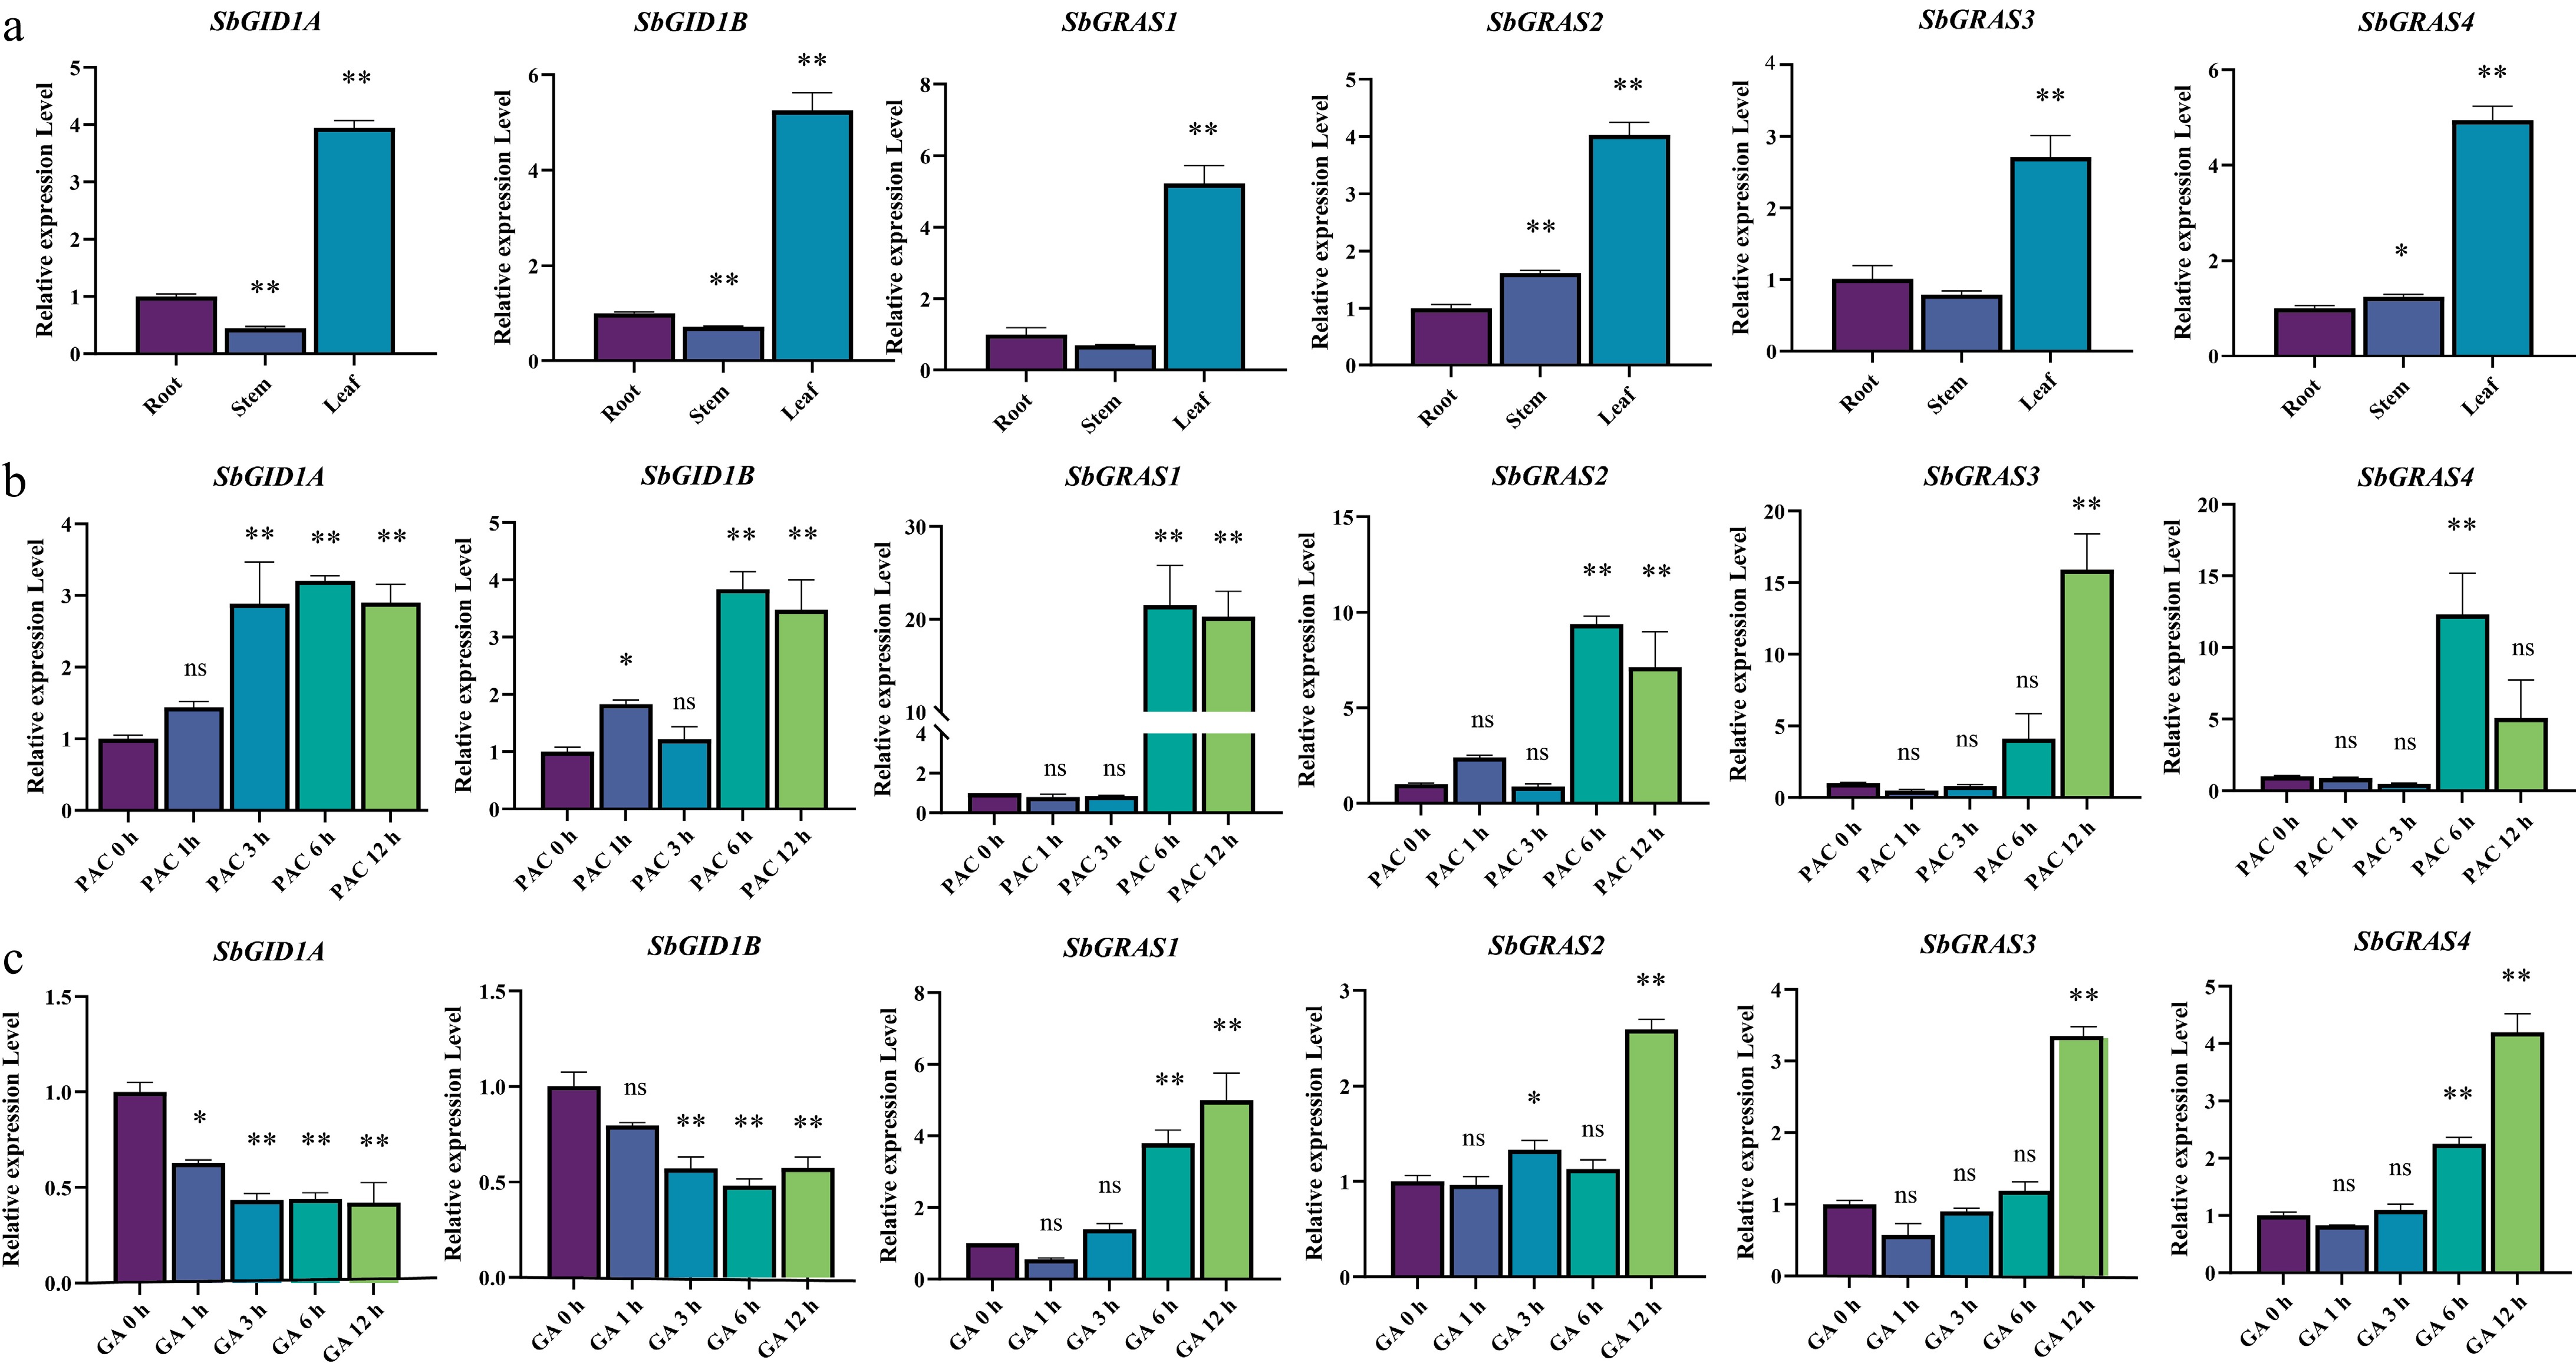
Figure 6.
Expressions of SbGRAS and SbCXE. (a) Expression levels of SbGRAS and SbCXE in tissues. (b) Relative expression levels of SbGRAS and SbCXE in S. baicalensis treated with 50 μM PAC were determined by RT-qPCR. (c) Relative expression levels of SbGRAS and SbCXE in S. baicalensis treated with 100 μM GA3 were determined by RT-qPCR. Data are expressed as mean ± SD, n = 3. Asterisks indicate a significant difference from 0 h, as determined by the one-way ANOVA Dunnett test: * p < 0.05; ** p < 0.01.
-
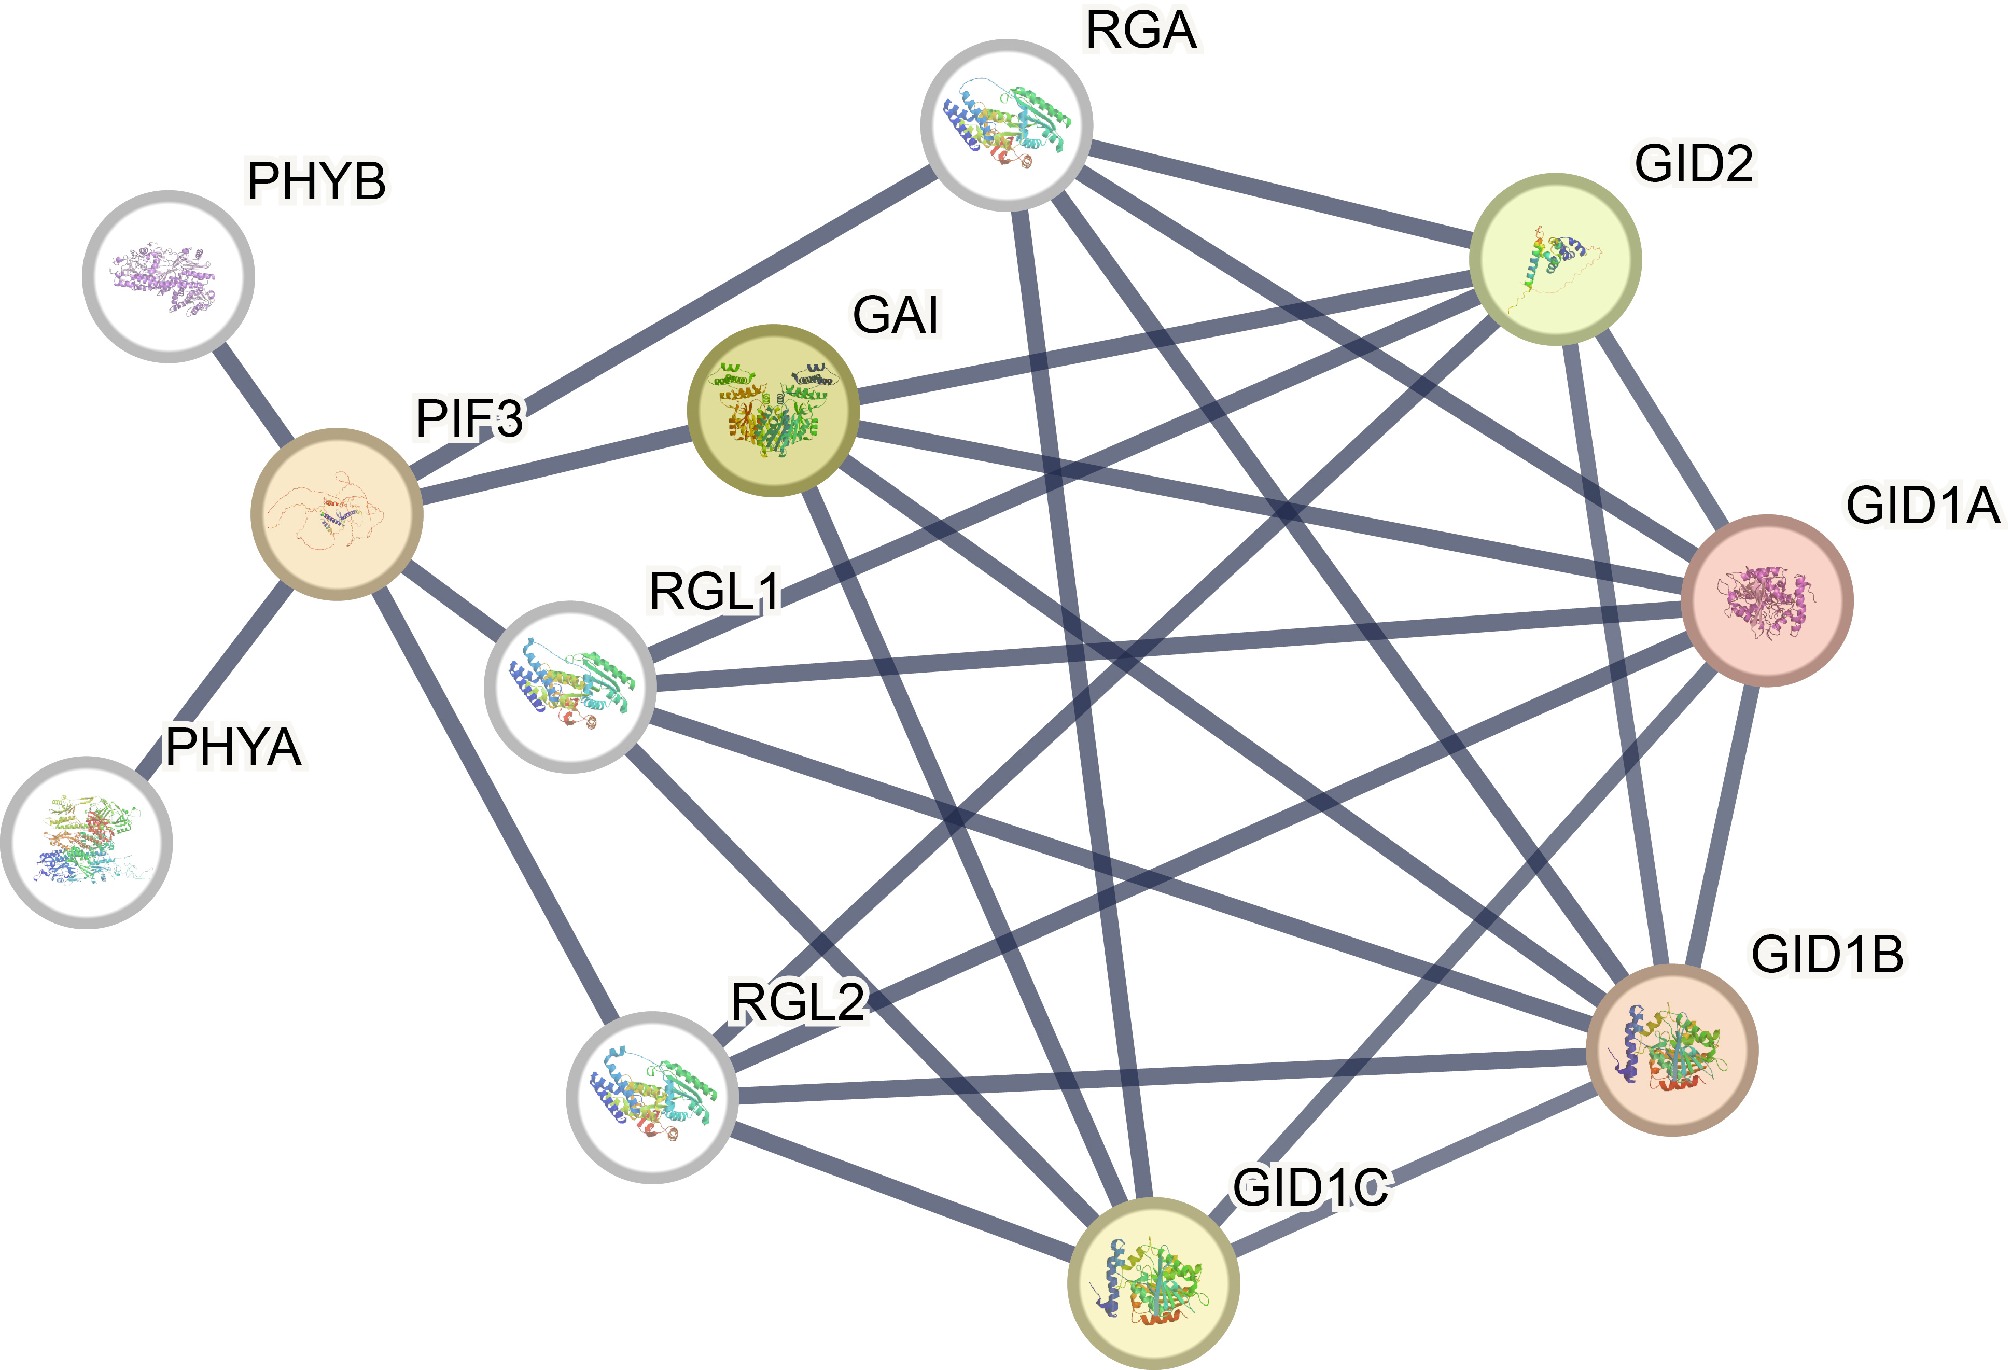
Figure 7.
Protein-protein interaction networks of GRAS proteins. Line thicknesses reflect the strengths of the interactions between proteins.
-
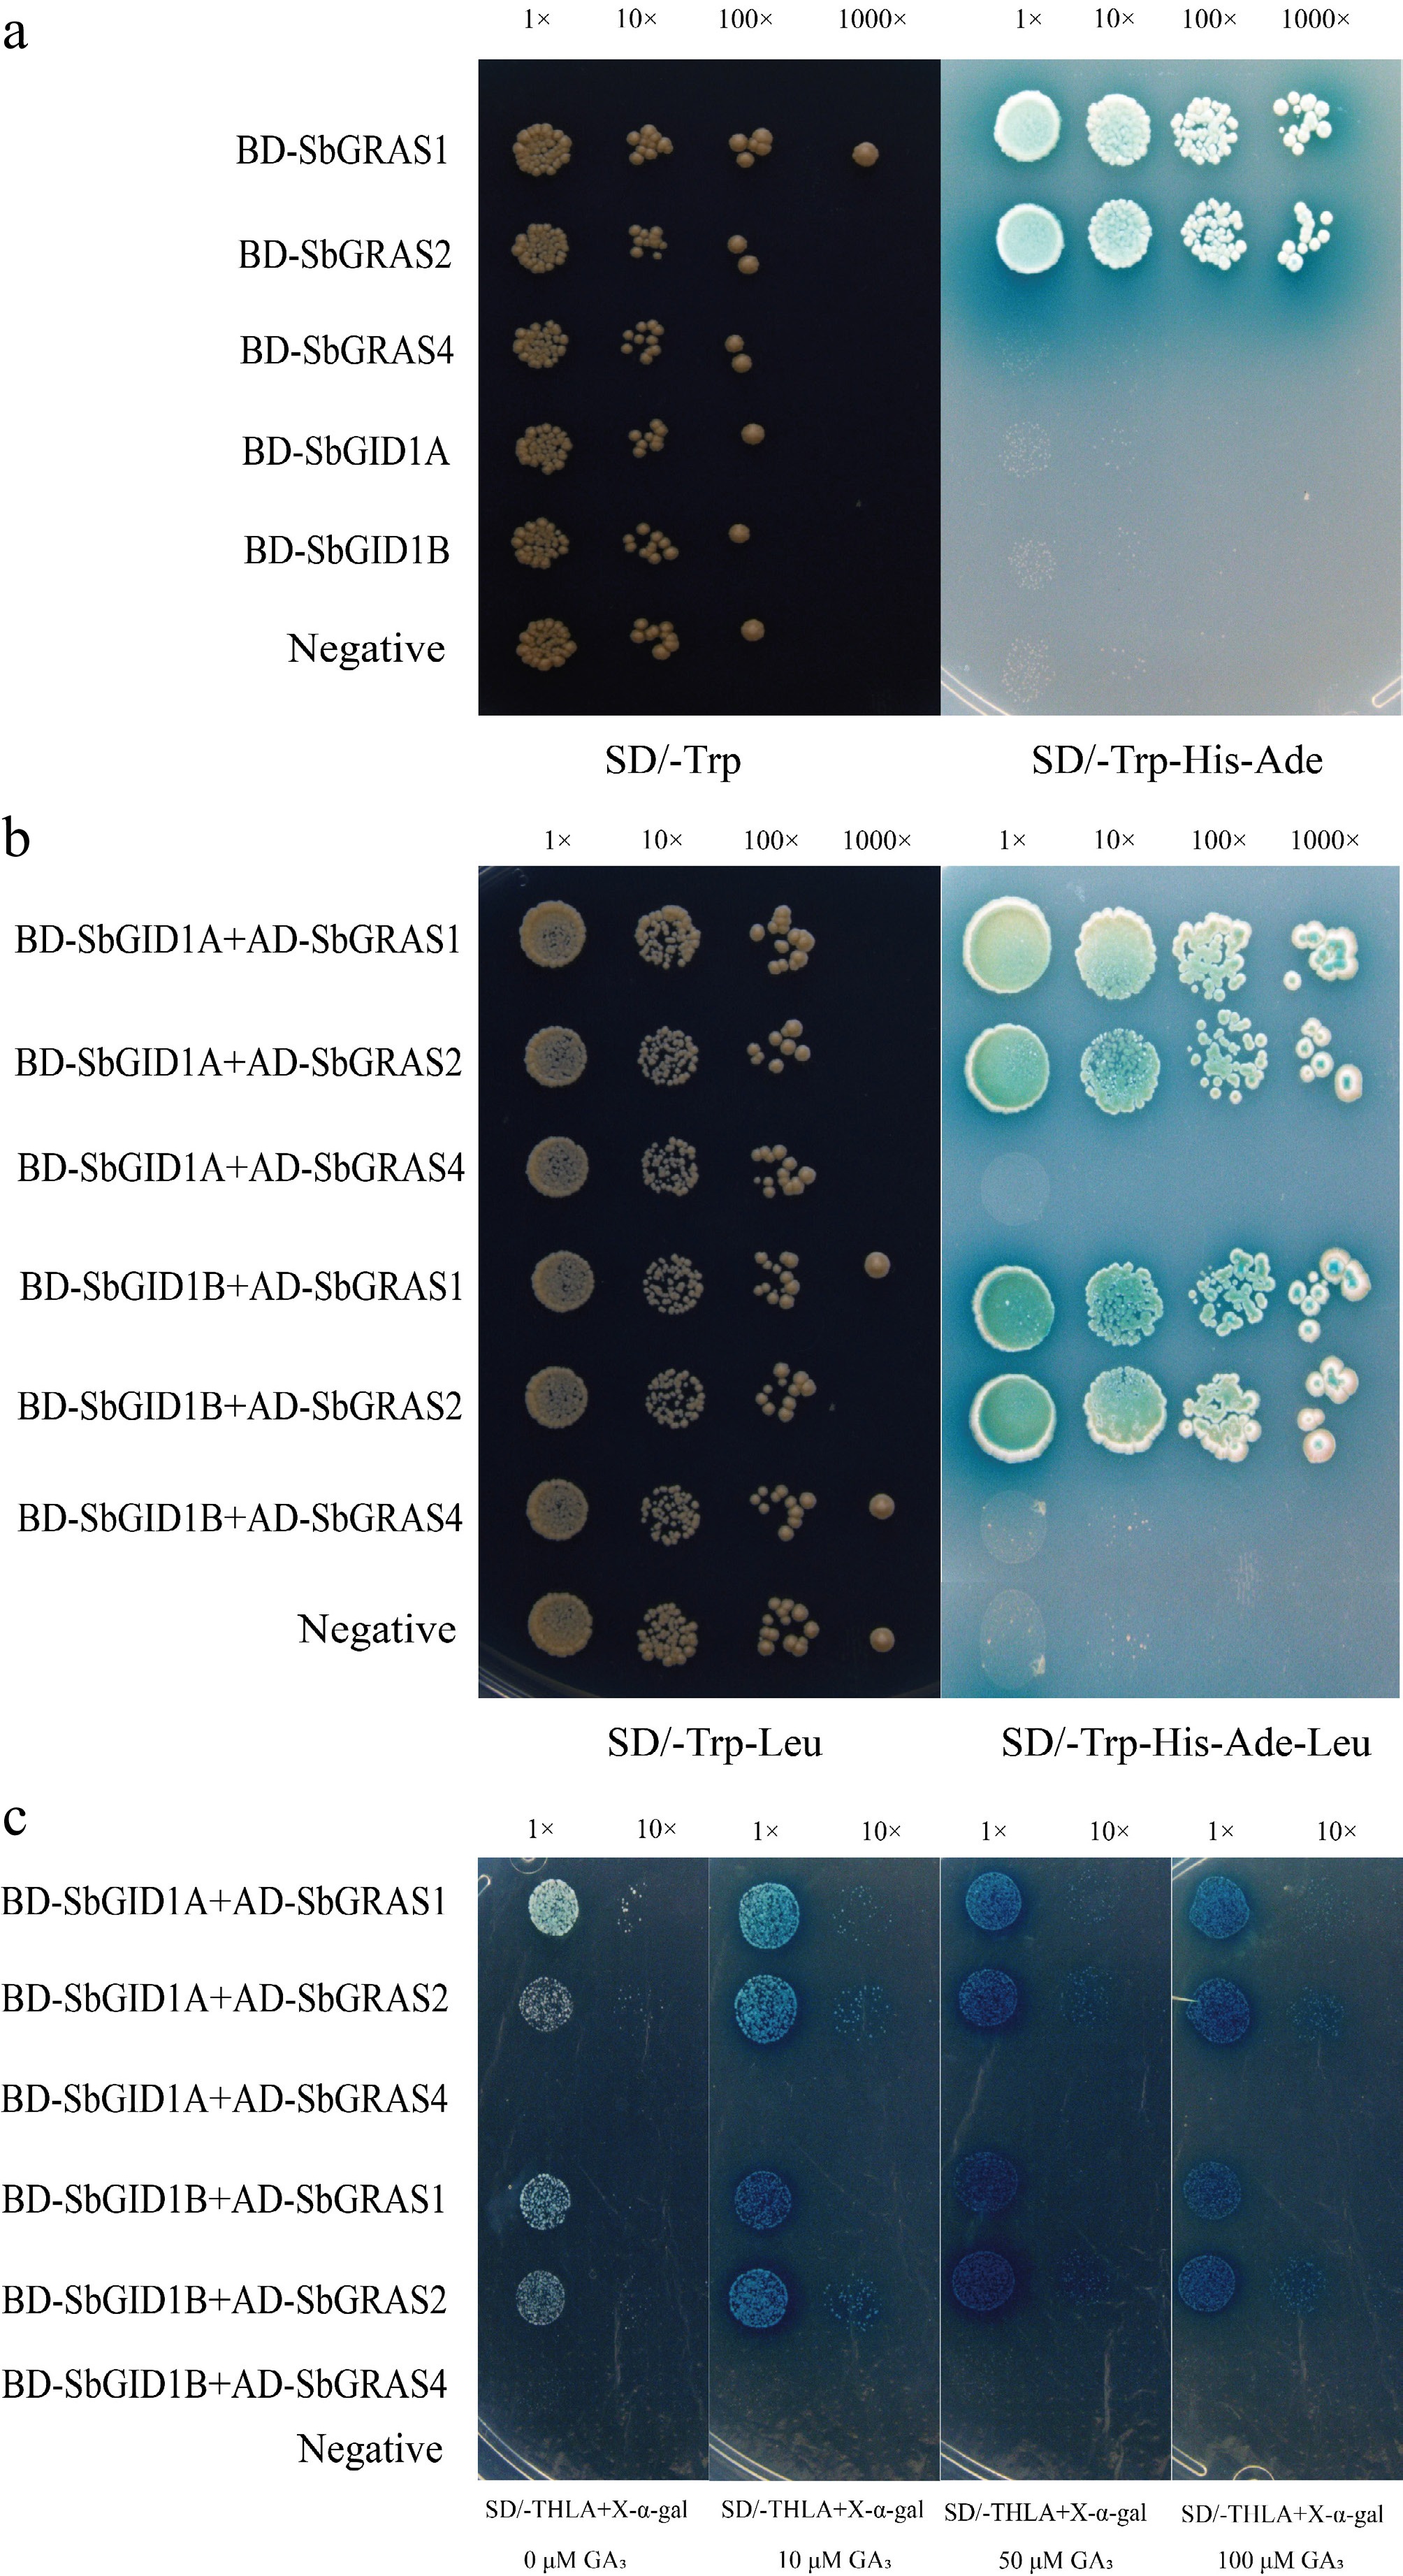
Figure 8.
SbGID1s interaction with SbDELLAs. (a) Transcriptional activity of SbGID1s and SbDELLAs. The negative control (pGBKT7). (b) Interaction between SbGID1s and SbDELLAs. The negative control (pGBKT7 + pGADT7). (c) Facilitated the interaction between SbDELLAs and SbGID1s by adding 10 μM GA3/50 μM GA3/100 μM GA3 to SD/-THLA medium. Negative control (pGBKT7 + pGADT7).
Figures
(8)
Tables
(0)