-
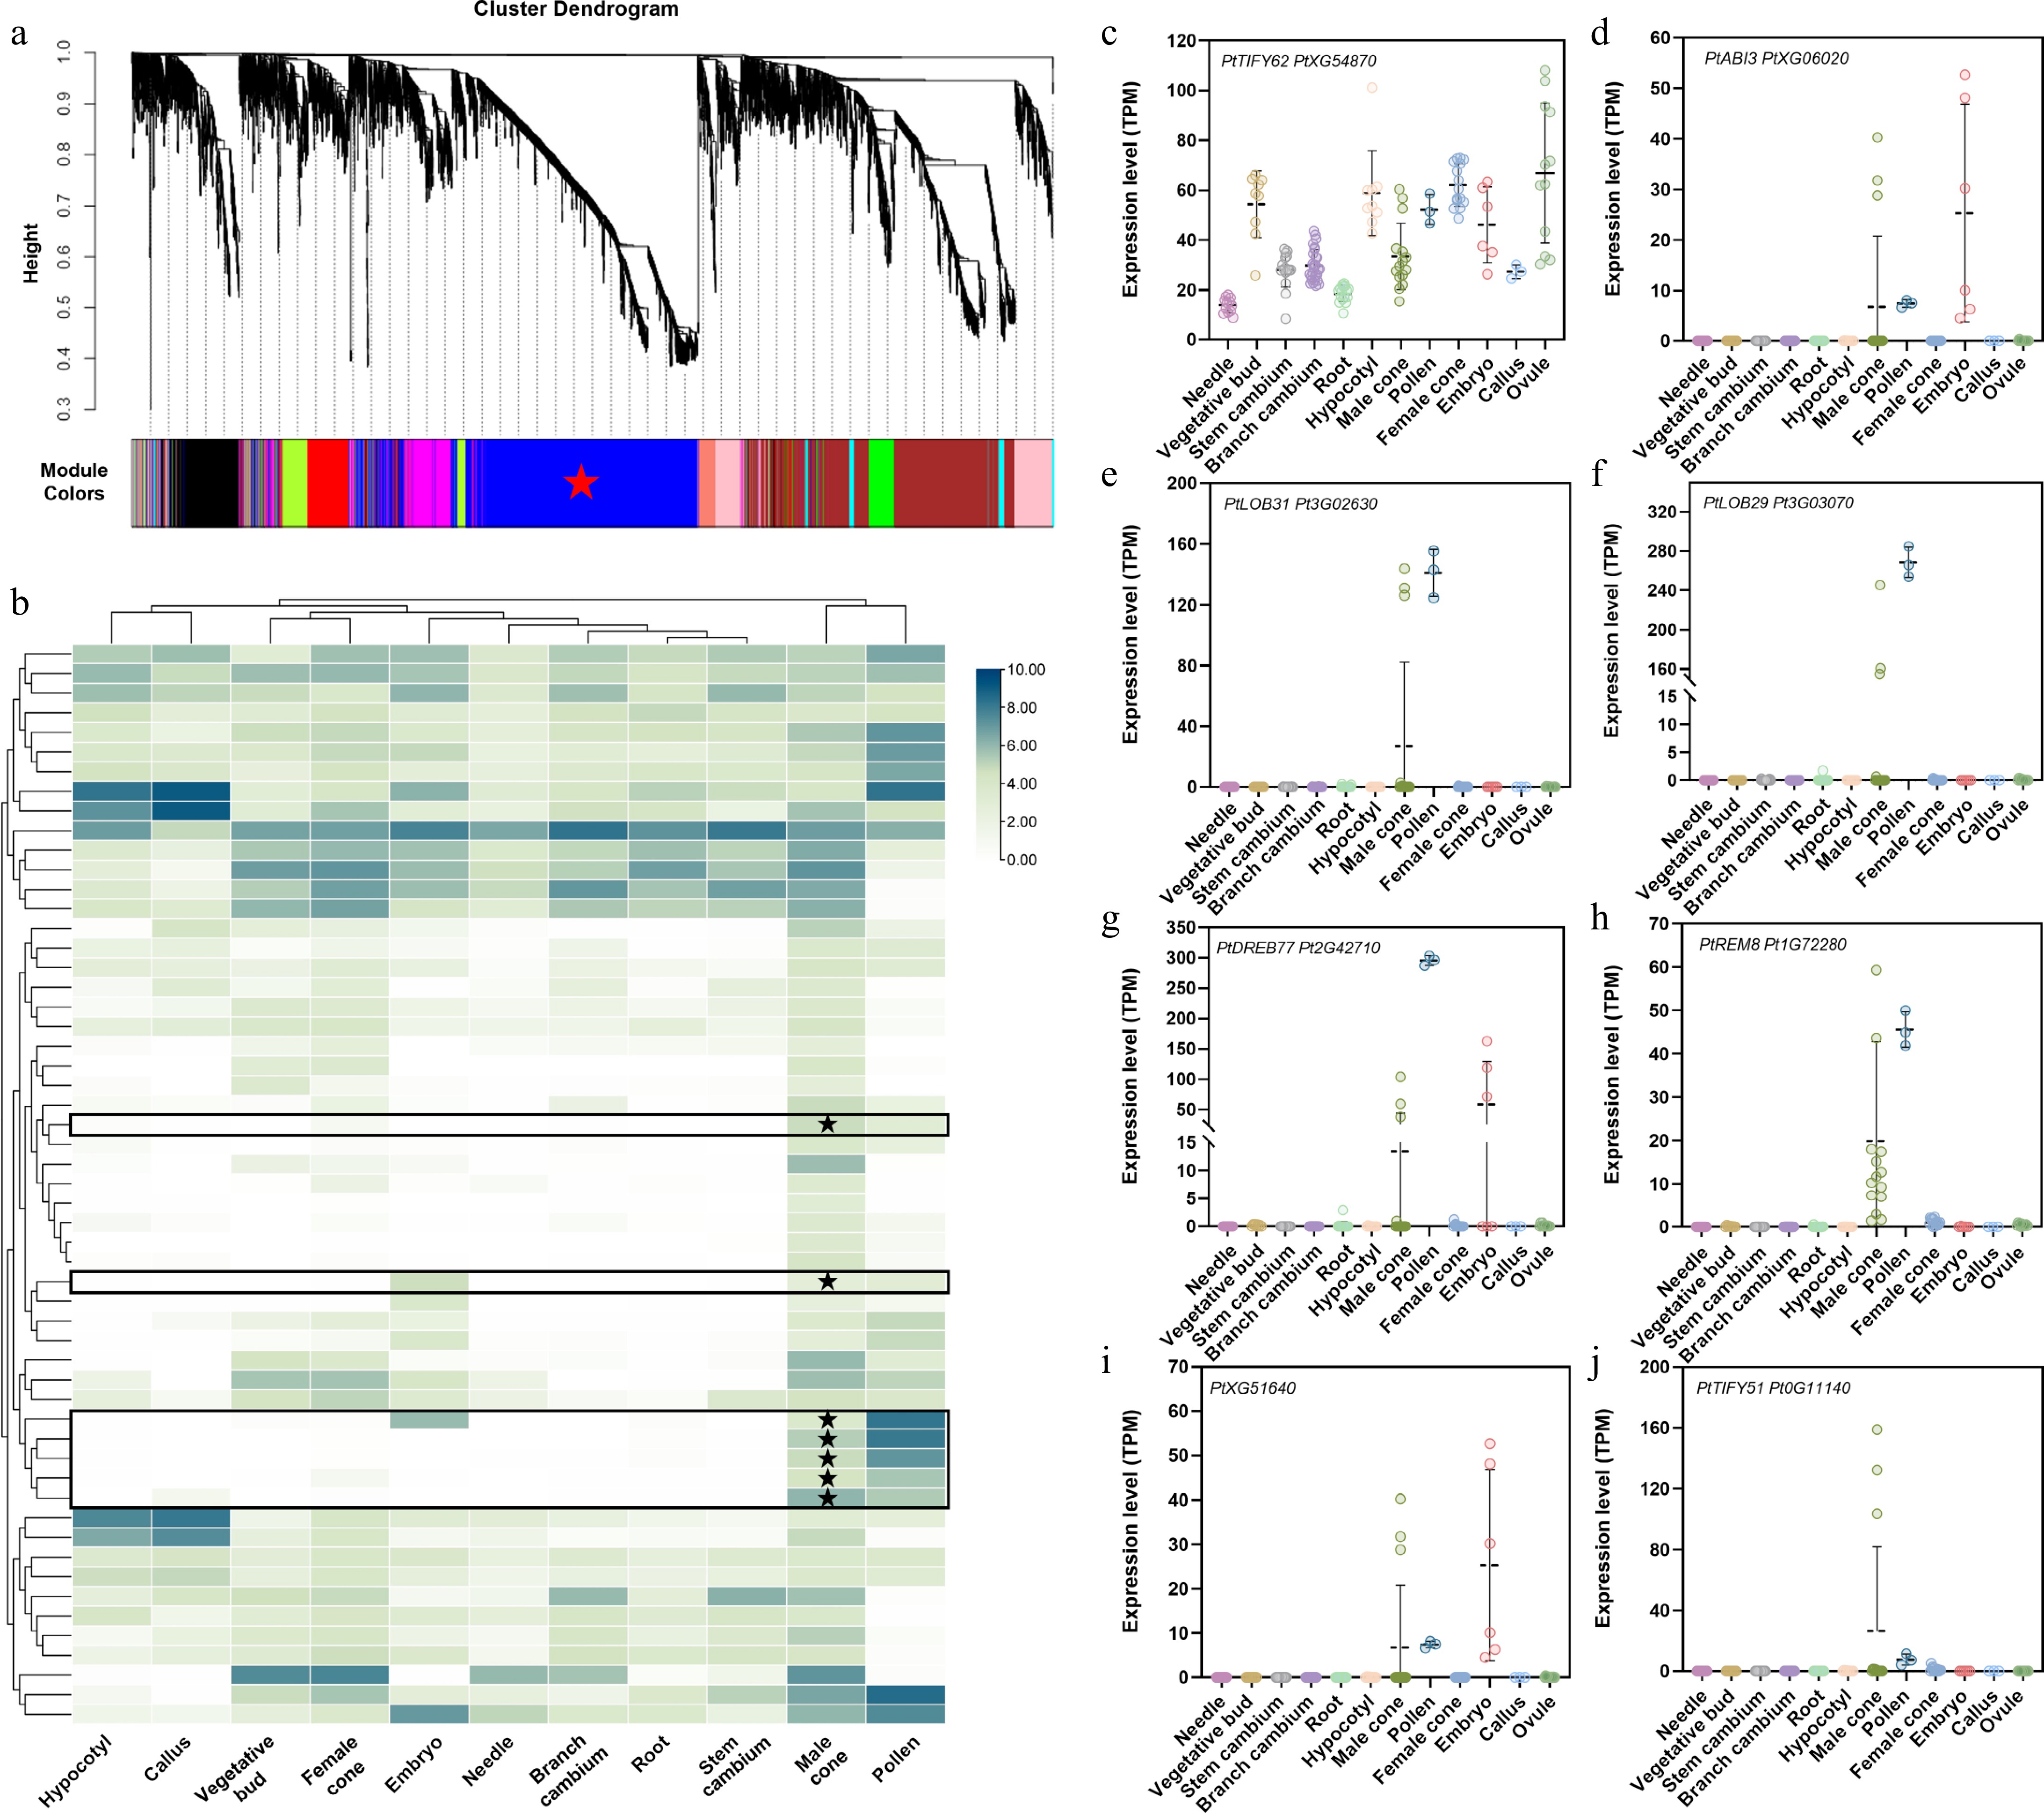
Figure 1.
Identification of transcription factors associated with DAL1 expression during the development of the male cone in P. tabuliformis. (a) WGCNA analysis of genes at different developmental stages of the male cone. Cluster dendrograms were obtained using the gene average chain hierarchical clustering method based on topological overlap. Co-expressed gene modules are indicated by different color bars below the dendrogram. (b) Expression of core transcription factors related to the resetting process of PtDAL1 in male cones in different tissues, where expression has been log-transformed. (c)–(j) Expression of core transcription factors related to the resetting process of PtDAL1 in the male cone in different tissues.
-
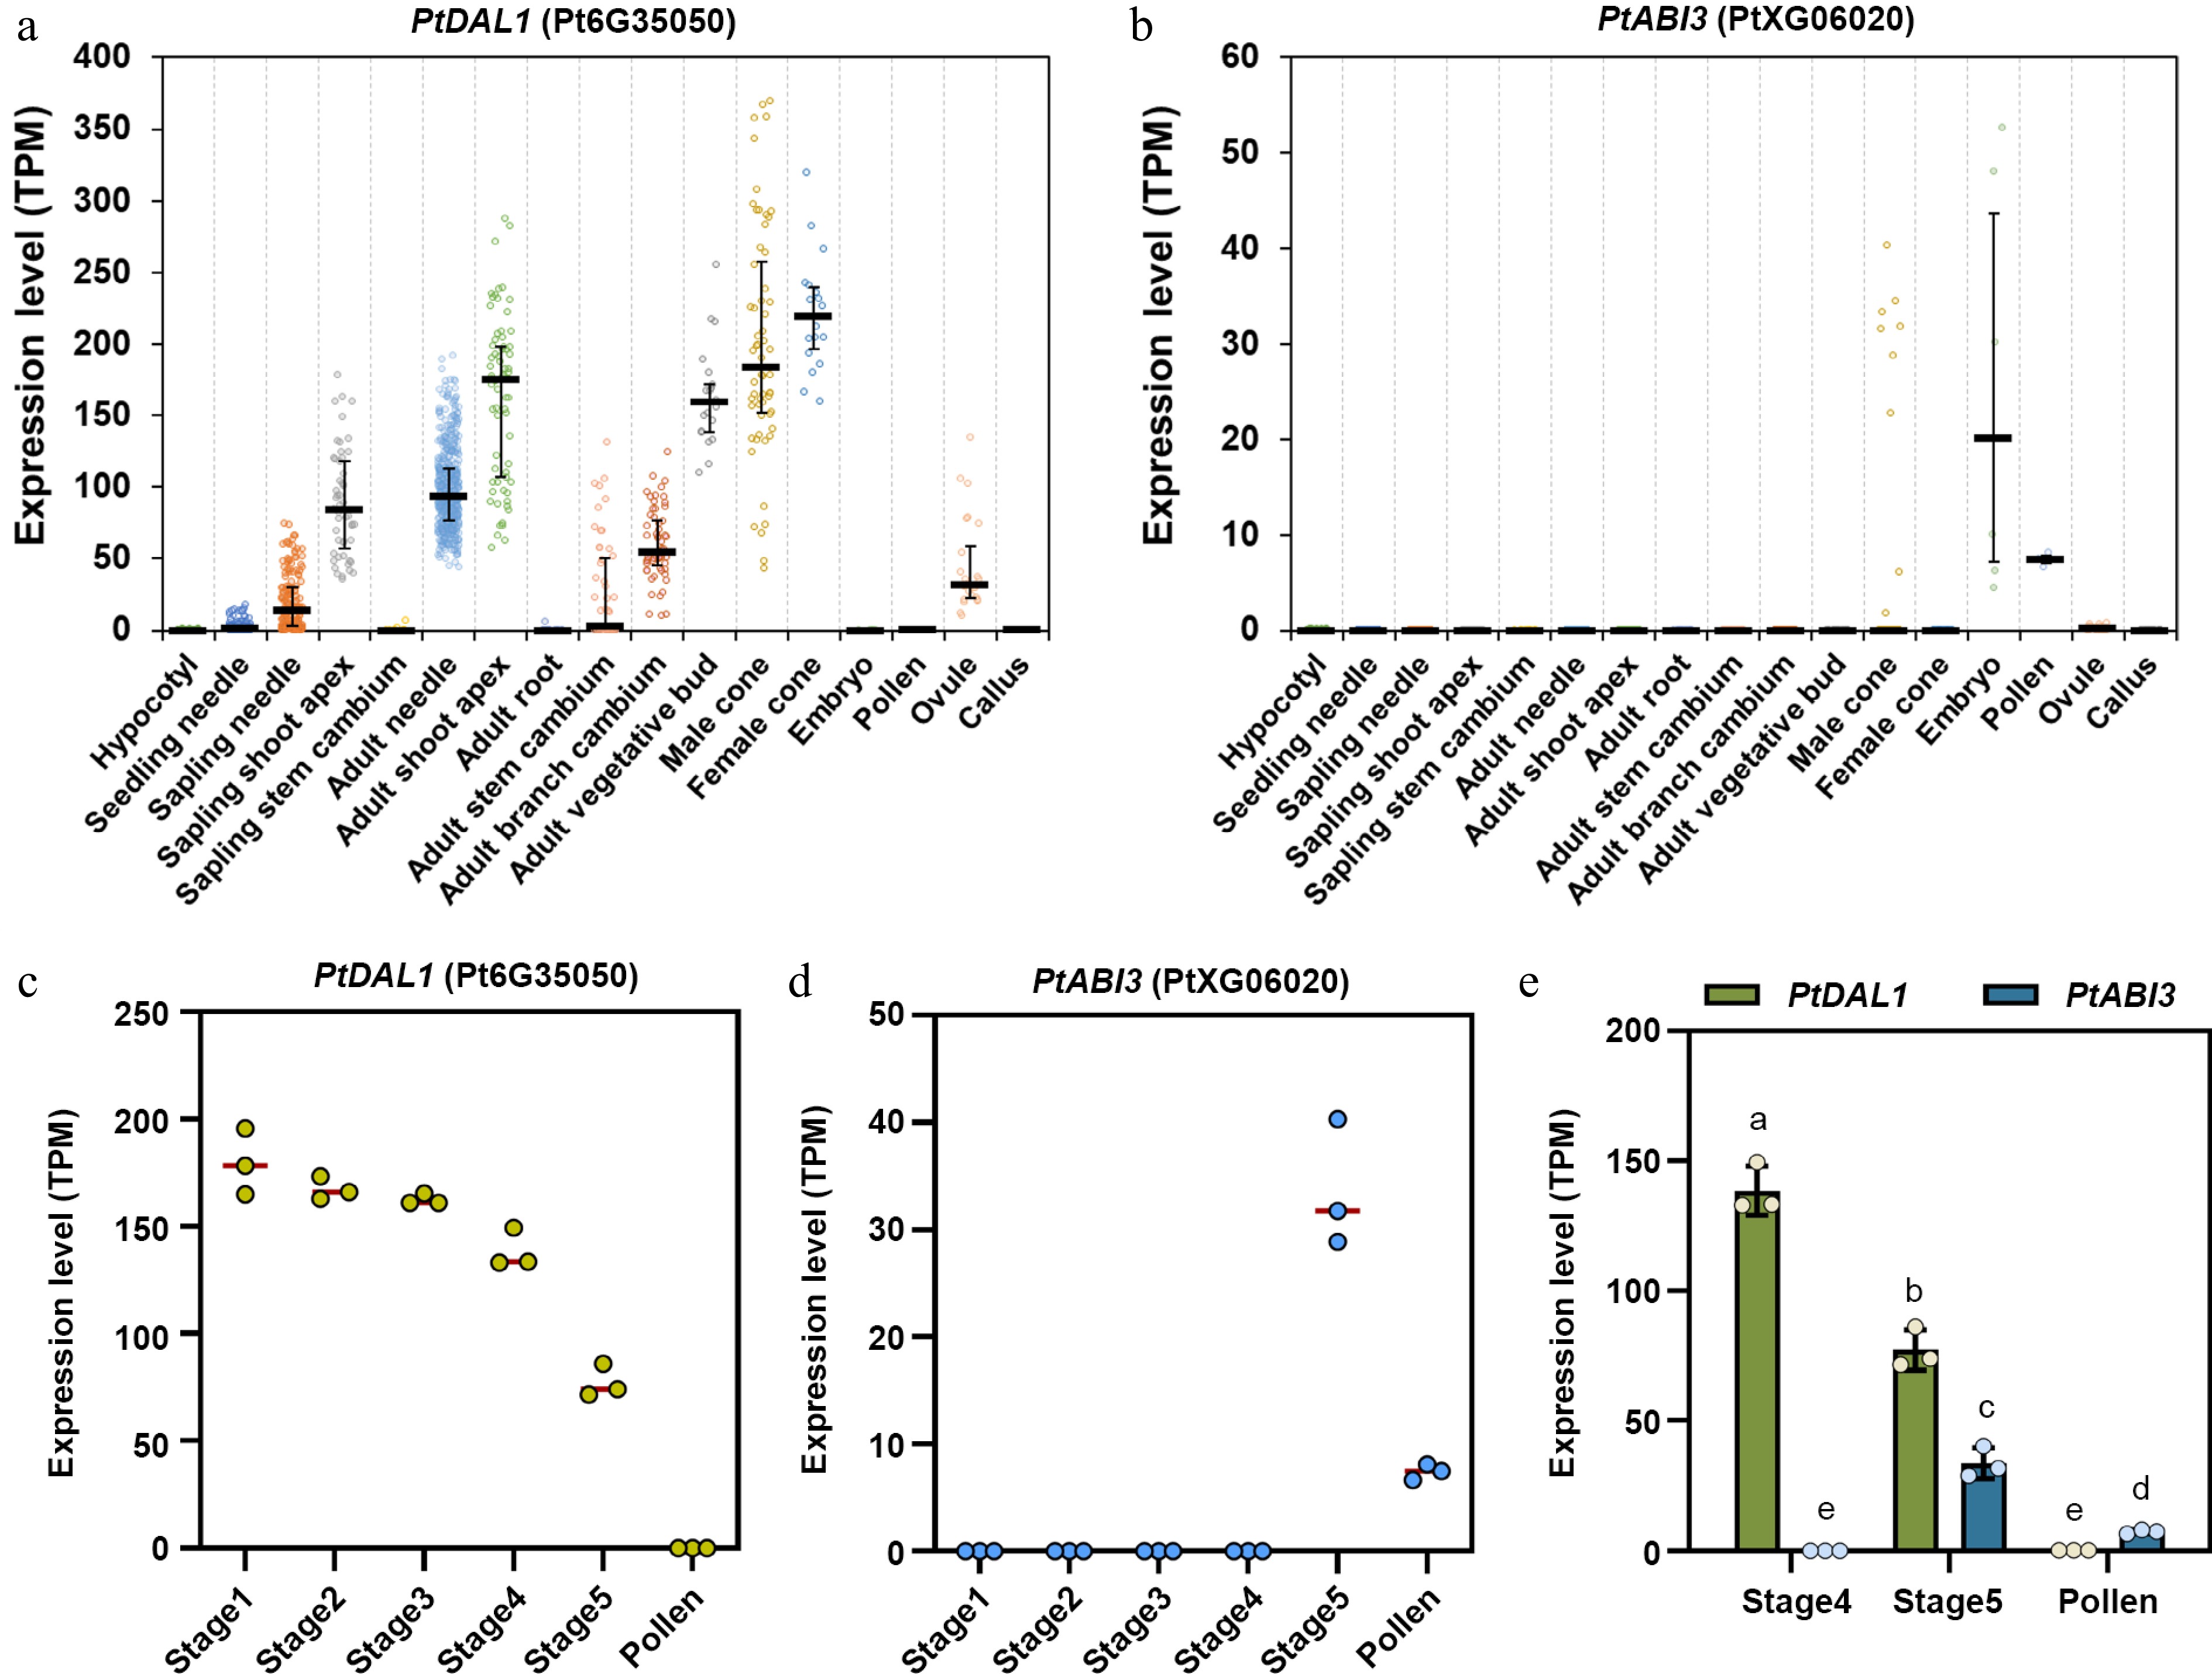
Figure 2.
Expression patterns of PtDAL1 and PtABI3 in different tissues and developmental stages of P. tabuliformis. (a), (b) Expression patterns of PtDAL1 and PtABI3 in different tissues of P. tabuliformis, showing a clear spatial complementary relationship. (c), (d) Expression patterns of PtDAL1 and PtABI3 during pollen development in P. tabuliformis, showing a clear temporal complementary relationship[28]. (e) Expression patterns of PtDAL1 and PtABI3 in the final two stages of male cone development and pollen in P. tabuliformis.
-
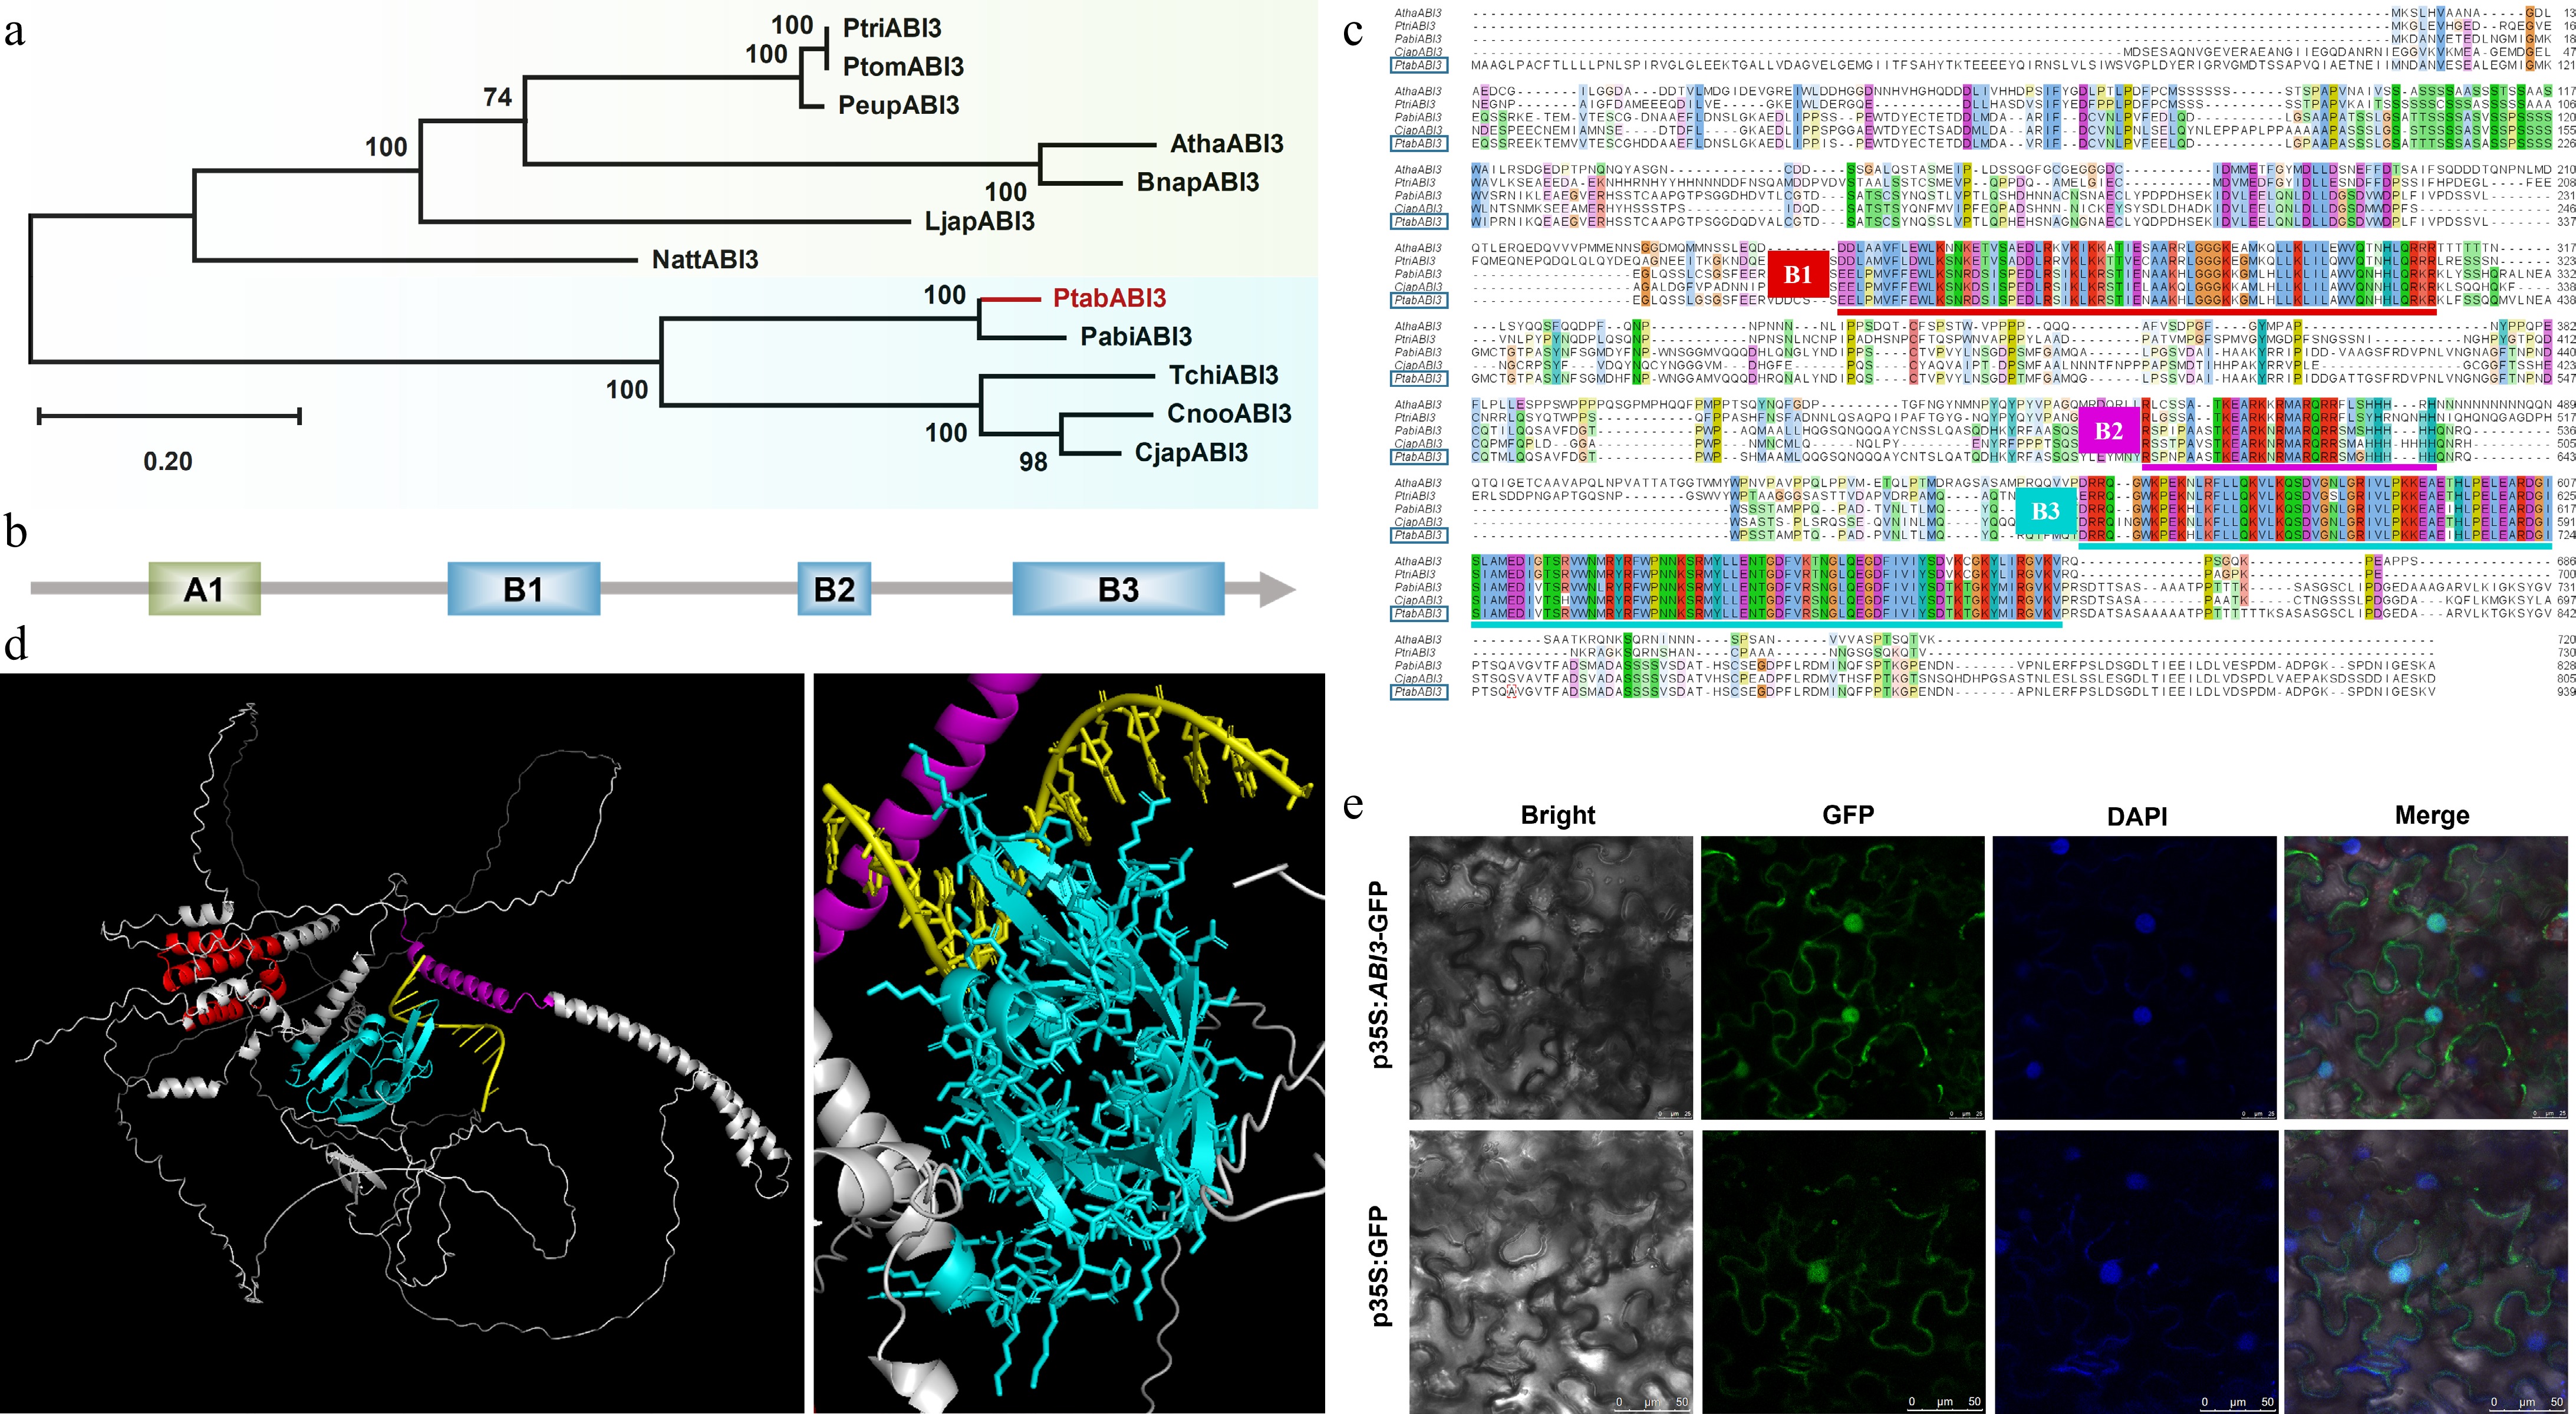
Figure 3.
Phylogenetic and structural analysis of PtABI3. (a) The phylogenetic tree of PtABI3, with the species and sequence information used presented in Supplementary Table S4. PtABI3 is highlighted in red in the phylogenetic tree. (b) Schematic diagram of the conserved domains in the PtABI3 protein, including four conserved domains: A1, B1, B2, and B3. (c) Multiple sequence alignment of the amino acid sequences of the ABI3 proteins, with conserved domains marked by horizontal lines of different colors. The PtABI3 sequence is highlighted with a blue box. (d) Three-dimensional structure prediction of PtABI3, where red represents the B1 domain, purple represents the B2 domain, and cyan represents the B3 domain. The right figure is a magnified view of the left figure, showing the binding pattern of PtABI3 with the DNA sequence. (e) Subcellular localization of the PtABI3 protein in N. benthamiana epidermal cells.
-

Figure 4.
Overexpression of PtABI3 in A. thaliana. (a), (b) Compared to wild-type (WT) Arabidopsis, all 35S::PtABI3 lines exhibit a distinct late-flowering and delayed-development phenotype. (c), (d) Representative images of inflorescences from 35S::PtABI3_8 lines and WT Arabidopsis. (e), (f) Images of 35S::PtABI3_8 lines during development, showing the number of rosette leaves immediately before and at the bolting stage. (g) The number of rosette leaves was counted at the first flowering stage for both wild-type and 35S::PtABI3 lines, **** p < 0.0001.
-

Figure 5.
PtABI3 binds directly to the RY motif in the PtDAL1 promoter region to inhibit its expression. (a) A dual luciferase reporter assay was performed on the full-length PtABI3 protein and the PtDAL1 promoter. Differential analysis indicated that PtABI3 significantly inhibits the PtDAL1 promoter (**, p < 0.01). (b) Dual luciferase reporter assays were performed using different domains of PtABI3 and the PtDAL1 promoter. (*, p < 0.05, ns, p > 0.05). (c) Schematic diagram of the truncation sites in the PtDAL1 promoter region. (d) Schematic diagram of vector construction. (e), (f) Dual luciferase reporter assay of PtABI3_B3 and five PtDAL1 promoter fragments. (g) Quantitative detection of dual luciferase assay LUC (firefly luciferase) fluorescence values. (h) Dual luciferase assay of PtABI3_B3 and PtDAL1-4 in P. tabuliformis callus. (i) Direct binding of PtABI3_B3 to the PtDAL1-4 promoter in a yeast one-hybrid system. (j) EMSA using a biotin-labeled DNA probe containing the RY motif from PtDAL1-4 and purified GST-PtABI3_B3 protein. GST protein, unlabeled probes (competitors), and mutant probes were used as controls.
-
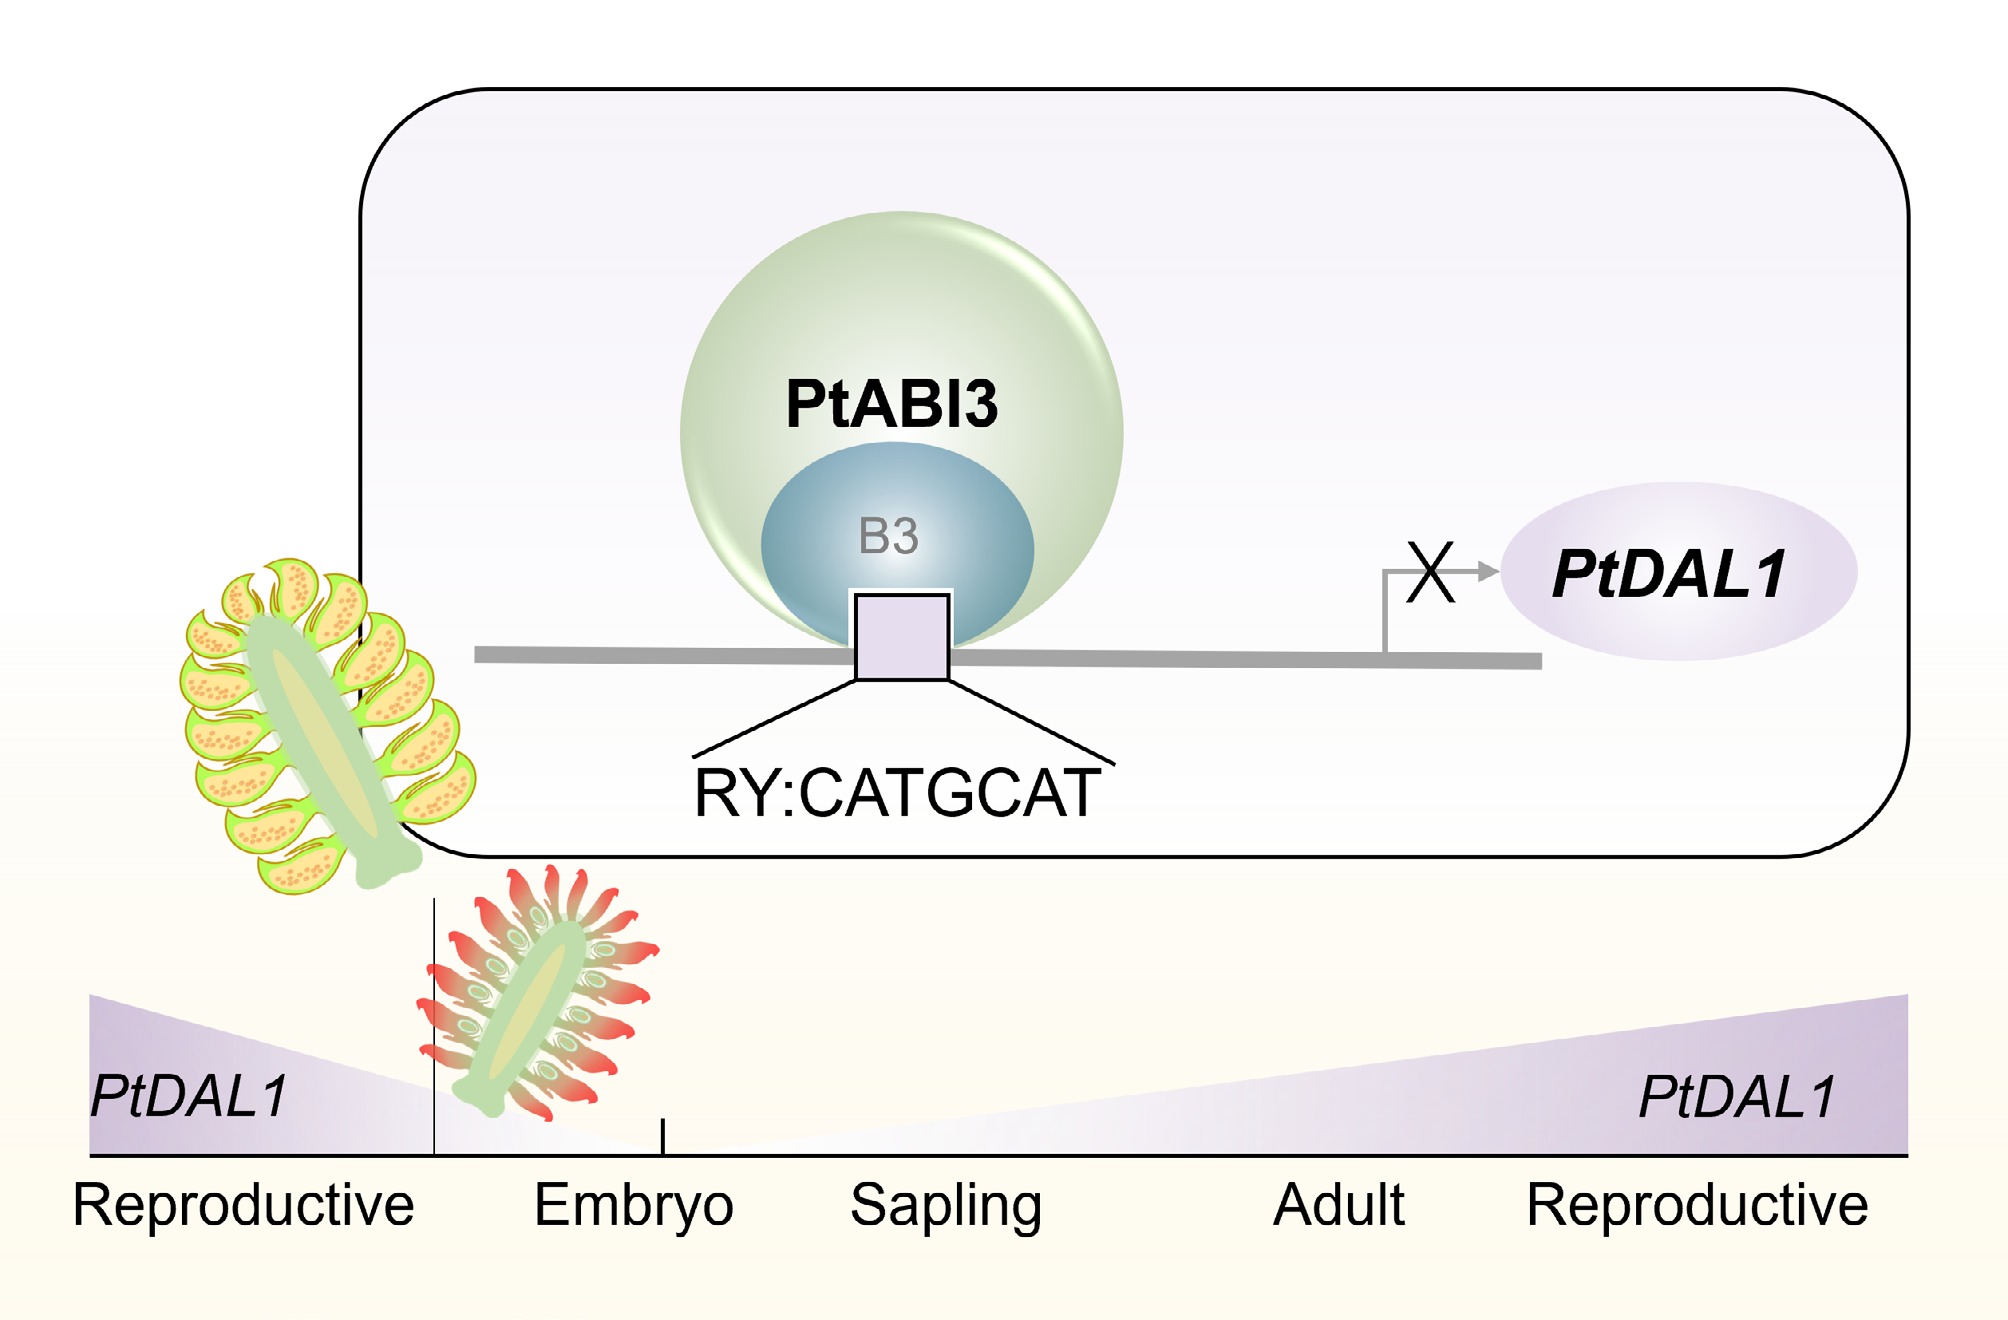
Figure 6.
Schematic diagram of PtABI3 inhibition of PtDAL1 during male gametophyte development. The age biomarker DAL1 is reset during intergenerational alternation. During male gametophyte development, PtABI3 directly binds to the RY motif on the PtDAL1 promoter through the B3 domain, directly inhibiting its expression.
Figures
(6)
Tables
(0)