-
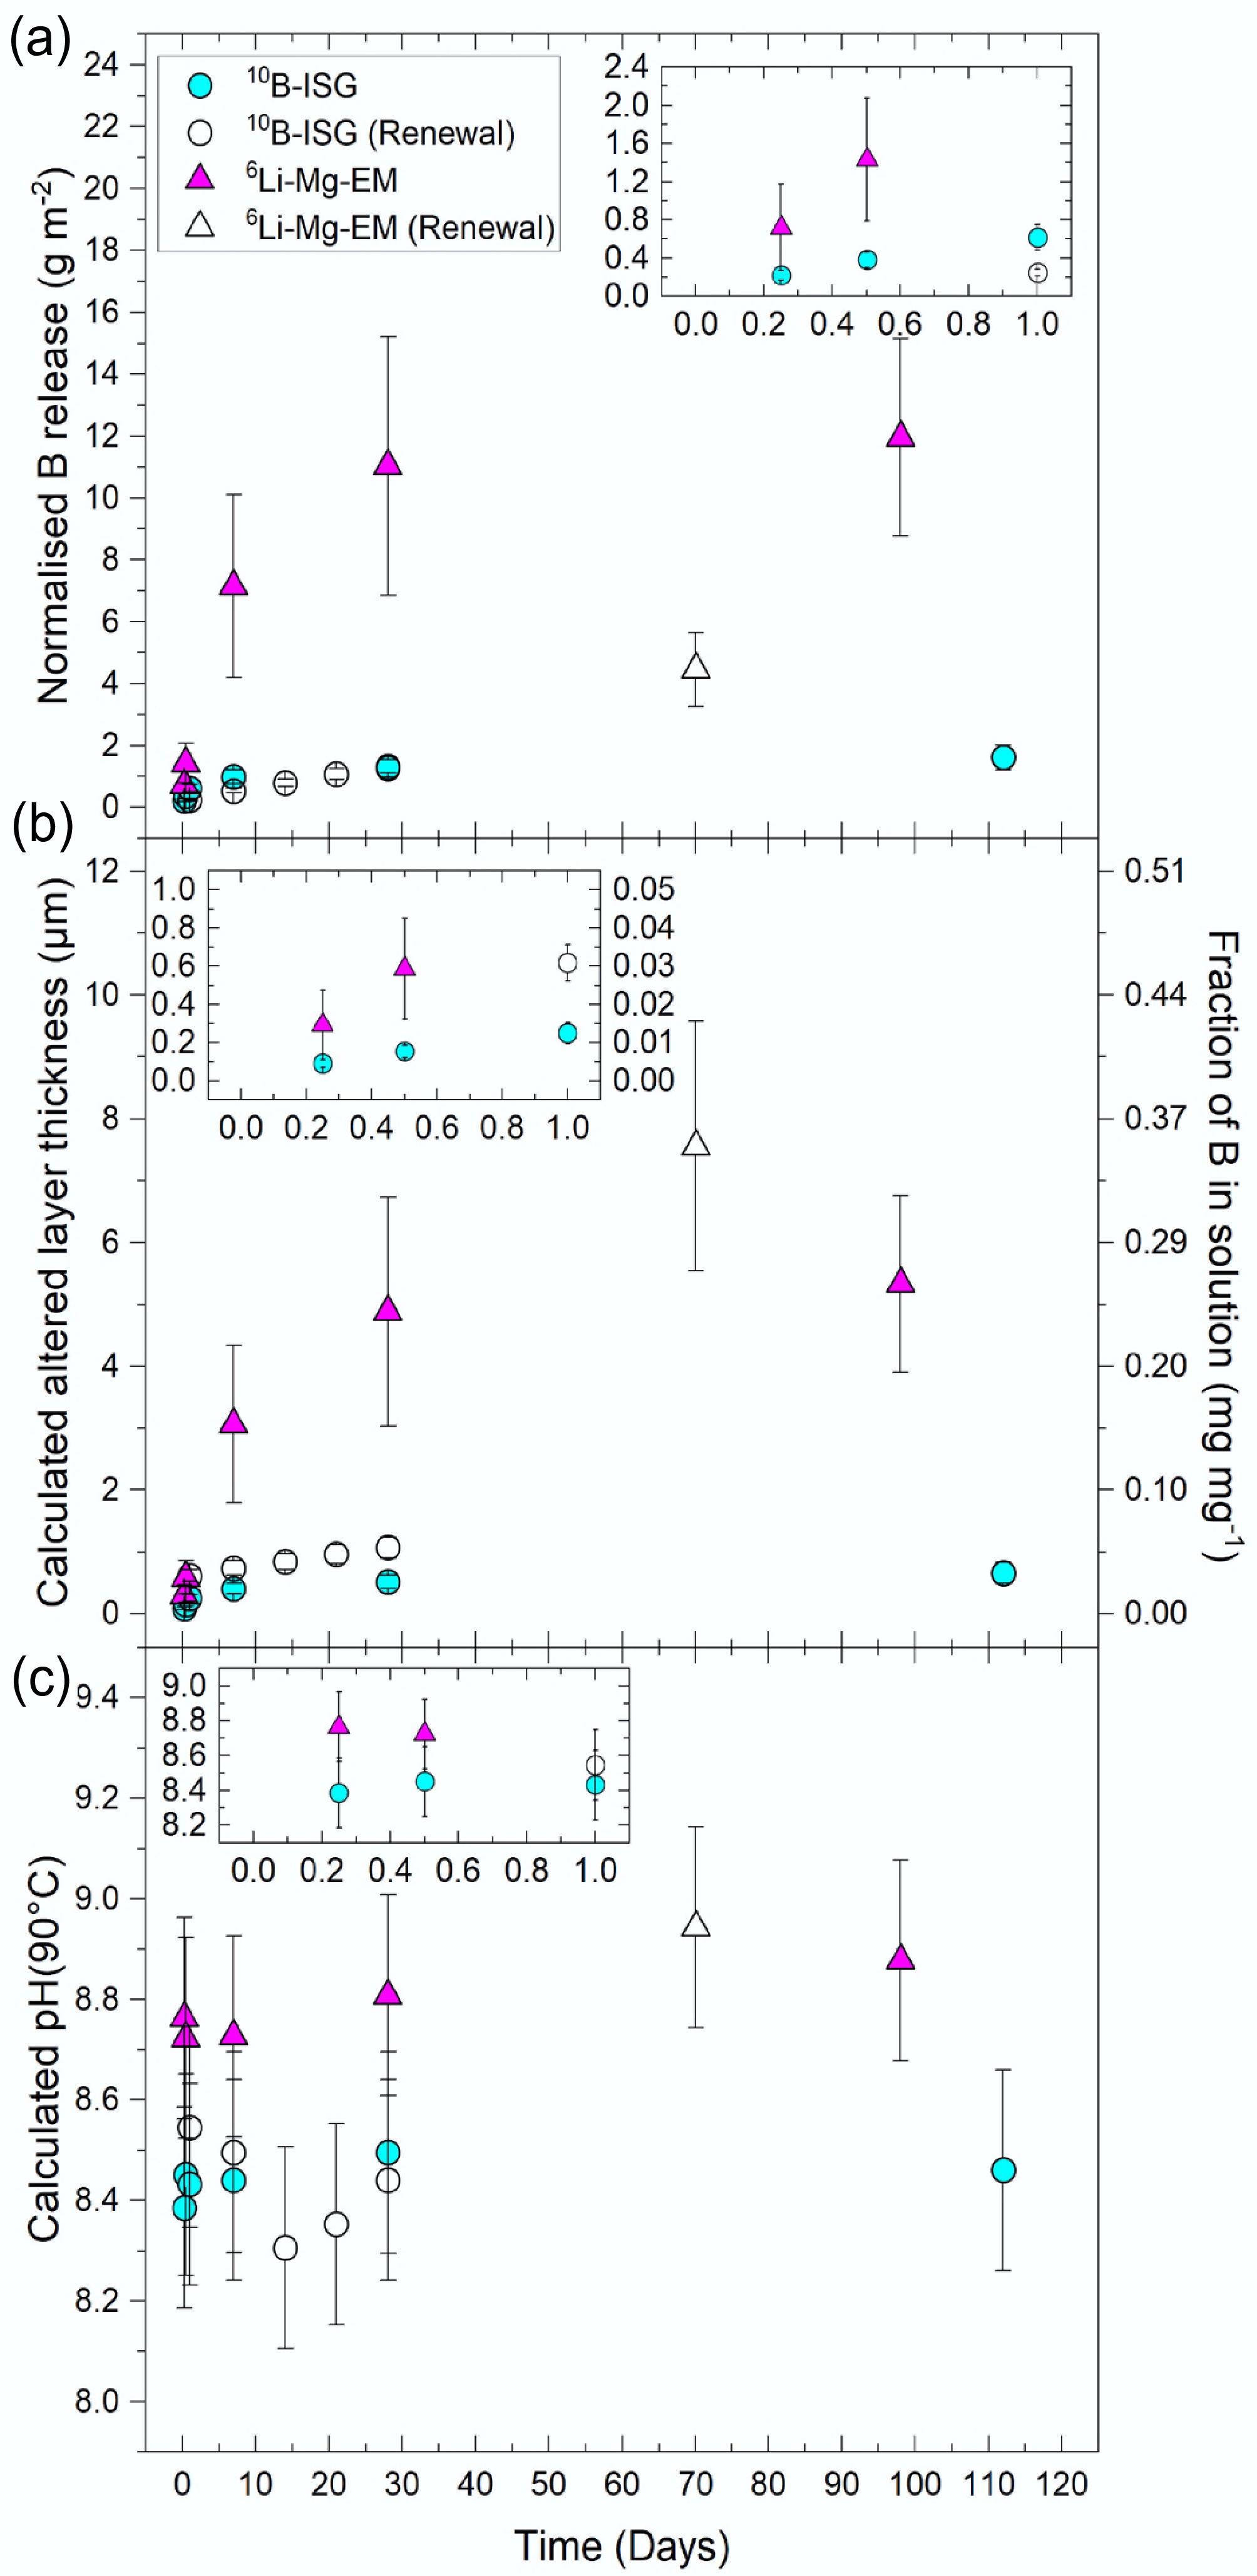
Figure 1.
The (a) normalised boron (B) releases, (b) altered layer thicknesses (primary vertical axis) calculated from the leached fractions of B (secondary vertical axis), and (c) calculated solution pH90°C from PHREEQC modelling using the measured solution concentrations as a function of time for 10B-ISG and 6Li-Mg-EM. Normalised B releases were calculated by normalising B concentrations to experiment geometric SA/V ratios and elemental mass fractions of B in the pristine glasses. Points are given as averages (n ≥ 3), with uncertainties on (a) and (b) propagated from 1SD associated with the concentration measurements, geometric surface areas and pristine glass compositions (26.7% relative SD for 6Li-Mg-EM, 15.5% relative SD for 10B-ISG). Uncertainties on the calculated pH90°C values are given to ±0.2 pH units, with this uncertainty encompassing the calculated pH value ranges obtained from the uncertainties associated with the measured solution concentrations used in calculating these pH90°C values (data not shown). Insets in each subplot include the same data but at times of up to 1 d. Altered layer thicknesses for the solution renewal experiment samples are presented as cumulative values that include the initial 28 d before renewal.
-
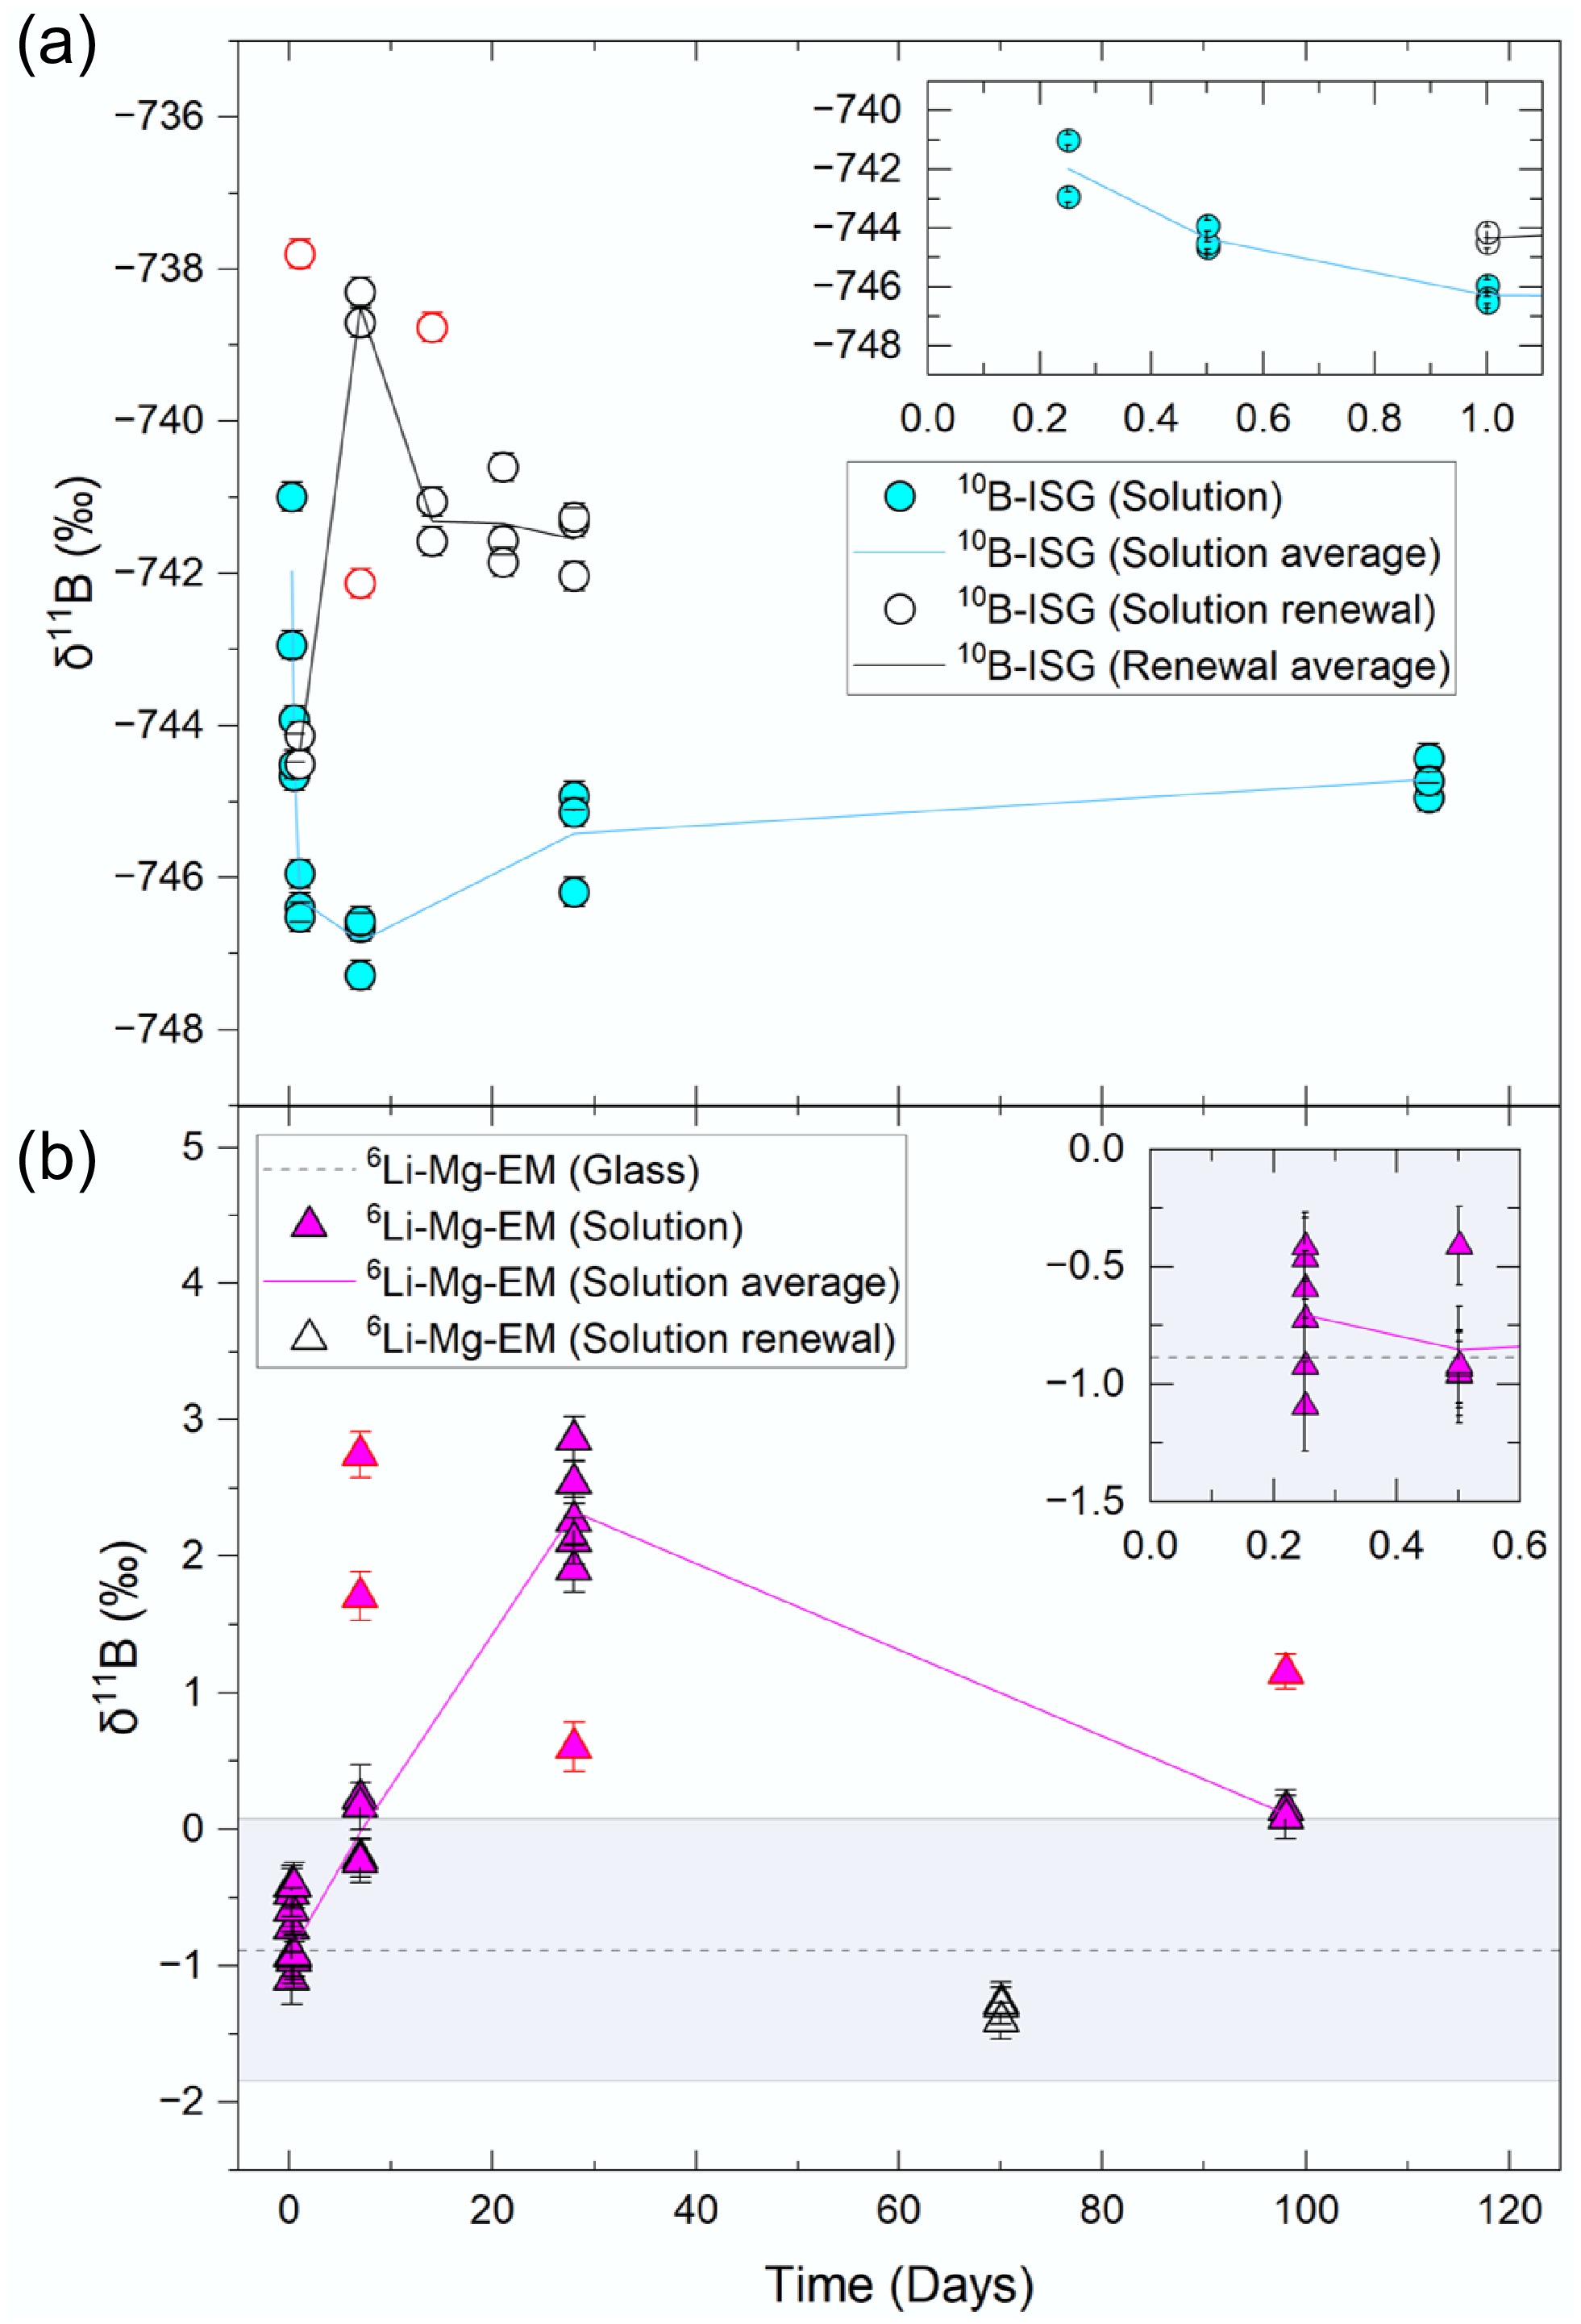
Figure 2.
Solution δ11B values for the (a) 10B-ISG and (b) 6Li-Mg-EM experiments relative to their respective pristine glass values. Individual points are given for each aliquot analysed, with uncertainties given to 2SD. Outliers are shown as points with red borders. Lines represent the mean value of all aliquots (excluding outliers) at a given time. The measured pristine glass value is shown for 6Li-Mg-EM as a dotted line (mean) with the shaded region representing the uncertainty (2SD) associated with this value. The measured pristine glass value for 10B-ISG (−767.54 ± 6.44‰) is not visible on the scale used.
-
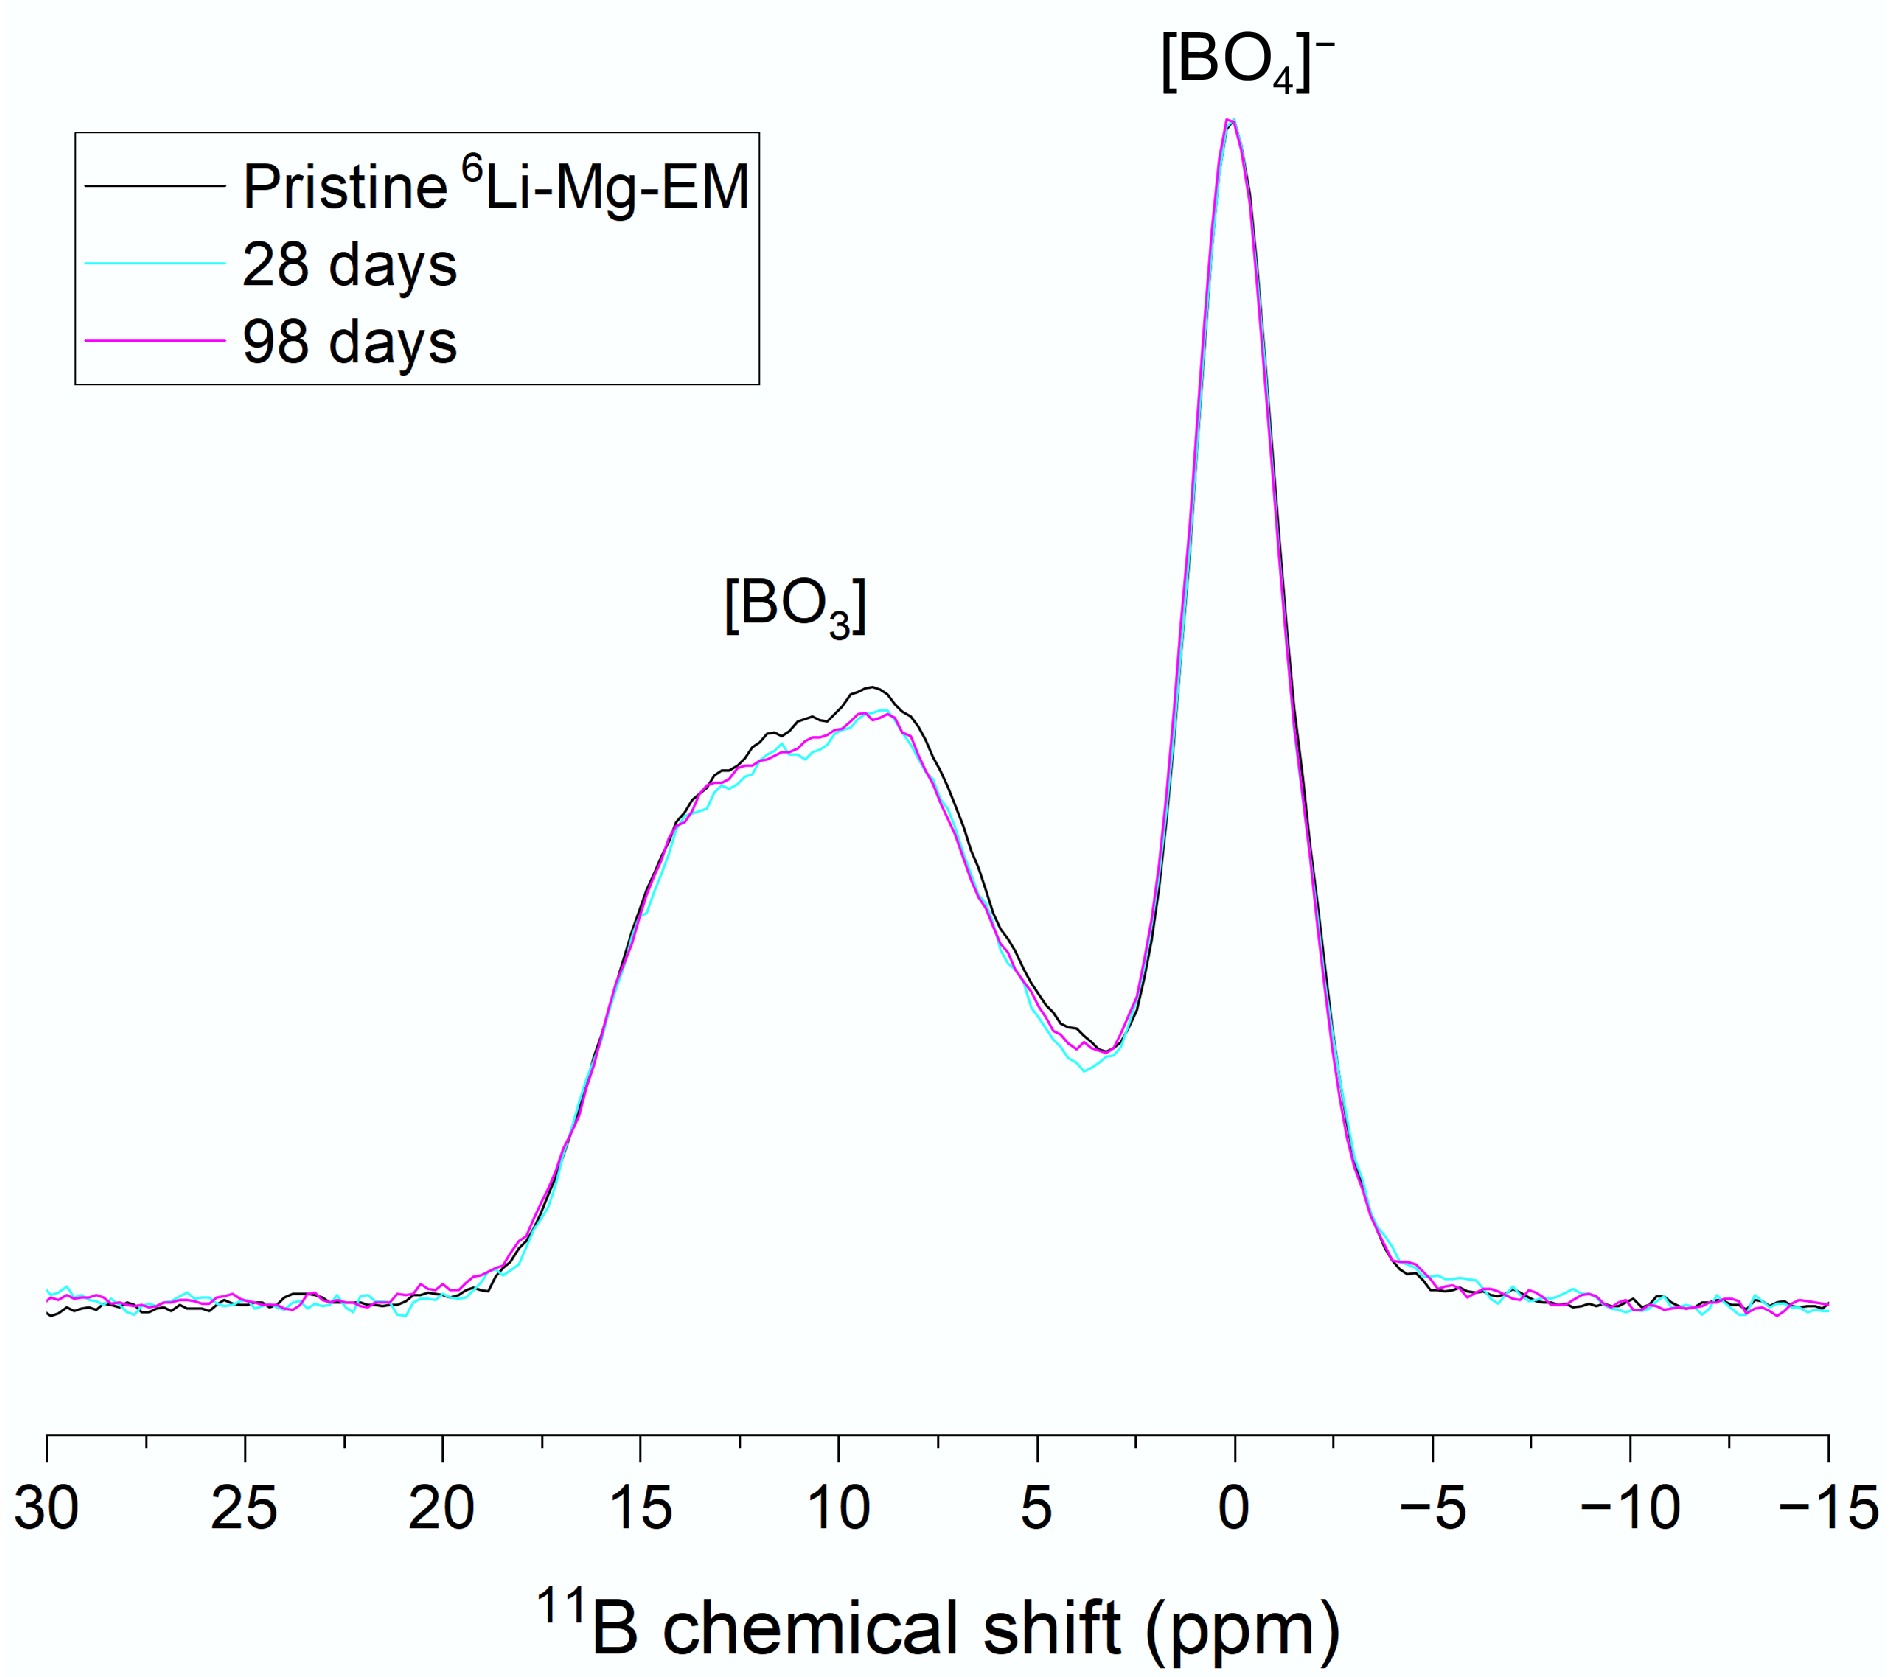
Figure 3.
11B MAS-NMR spectra of 6Li-Mg-EM after 0 (black line), 28 (cyan line) and 98 d (magenta line) of alteration. Labels indicate the positions of the [BO4]− unit peaks and the [BO3] unit doublet. Spectra were normalised to a given [BO4]− peak intensity to compare changes in [BO3] doublet intensities.
-
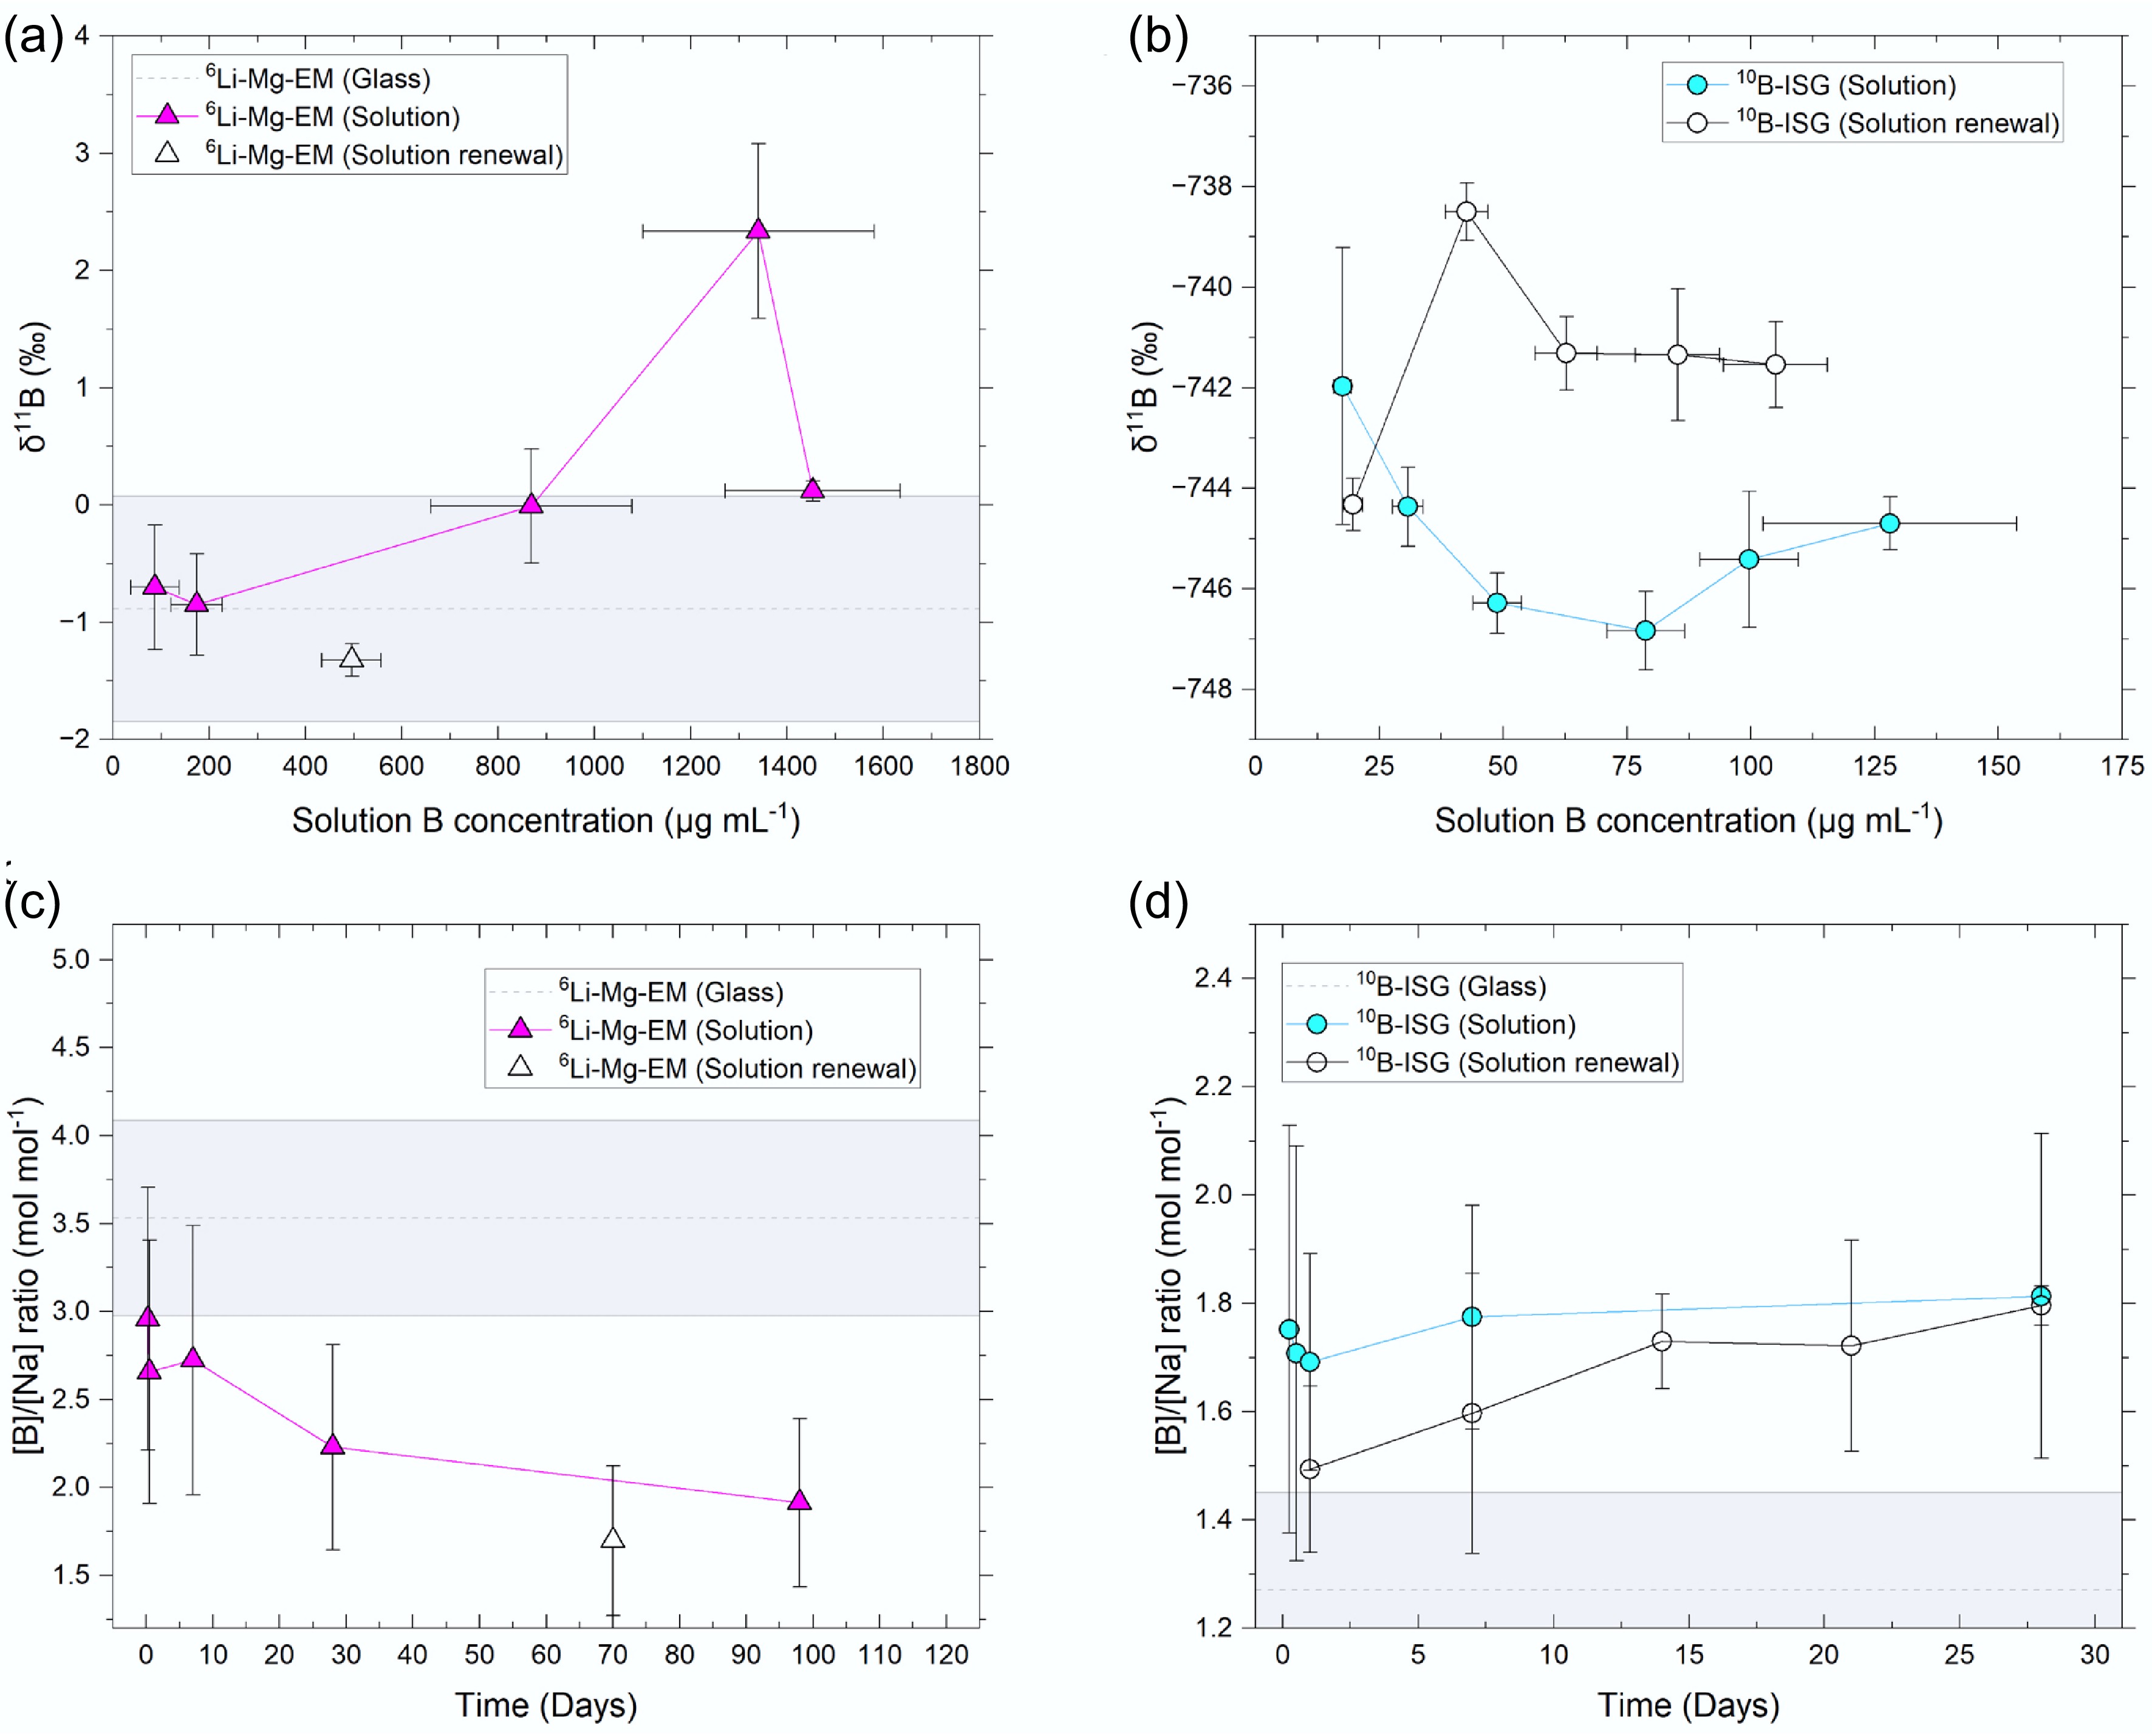
Figure 4.
Solution δ11B values plotted against B concentrations for the (a) 6Li-Mg-EM and (b) 10B-ISG experiments, and solution B to Na concentration ratios against time for the (c) 6Li-Mg-EM and (d) 10B-ISG experiments. Uncertainties are given to 1SD on concentrations and 2SD on δ11B values. Measured pristine glass values are shown as dotted lines (mean) with the shaded region representing the uncertainties on the measurements. The pristine glass δ11B value for 10B-ISG (−767.54 ± 6.44‰) was not visible on the scale used.
-
-
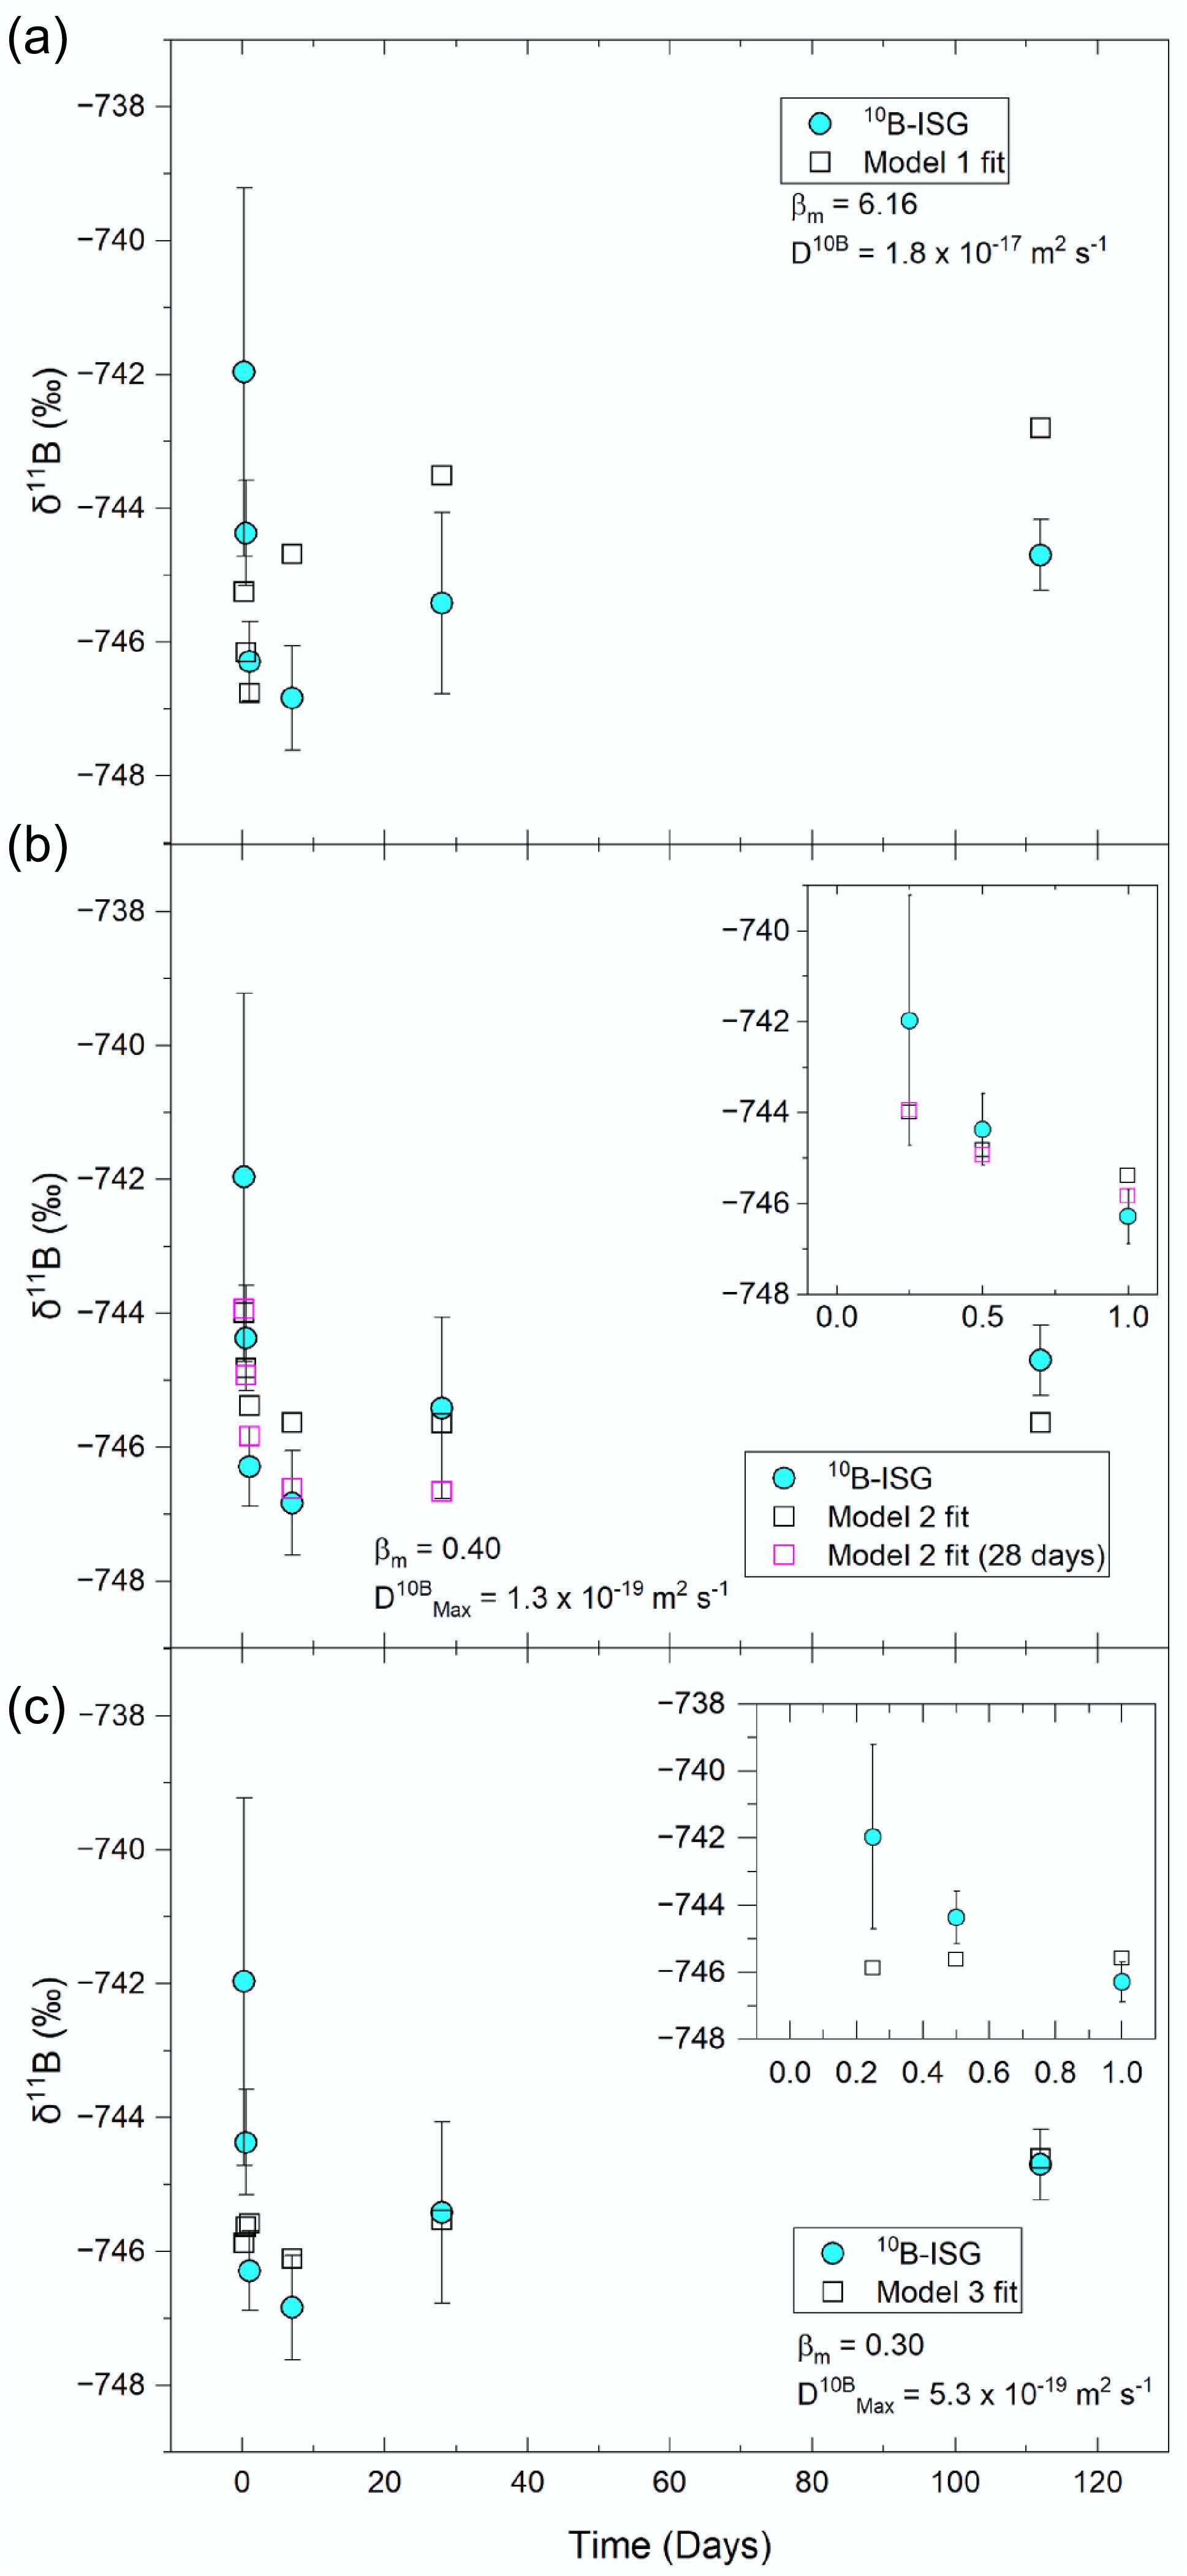
Figure 6.
Representative diffusion model fits to the measured 10B-ISG (non-renewal) experiment solution δ11B values using (a) Model 1, (b) Model 2, and (c) Model 3 (data provided in Supplementary Table S2). Model 1 assumed a constant bulk apparent diffusivity of B in the altered layer, Model 2 assumed a bulk apparent diffusivity which was time-dependent, and Model 3 assumed apparent diffusivities were spatially dependent in the altered layer upon access to water species. Fits varied βm and D10B using eB as distance (Model 1), varied βm whilst holding D10BMax using eB-eSi as distance (Model 2), and varied βm, βc, α and D10BMax using eB as distance (Model 3) (data for these fits are given in rows 2, 5 and 7 of Supplementary Table S2, respectively). For Model 2, additional fits are given for the model fitted to the ≤ 28-d data (excluding the 112-d value).
Figures
(6)
Tables
(0)