-
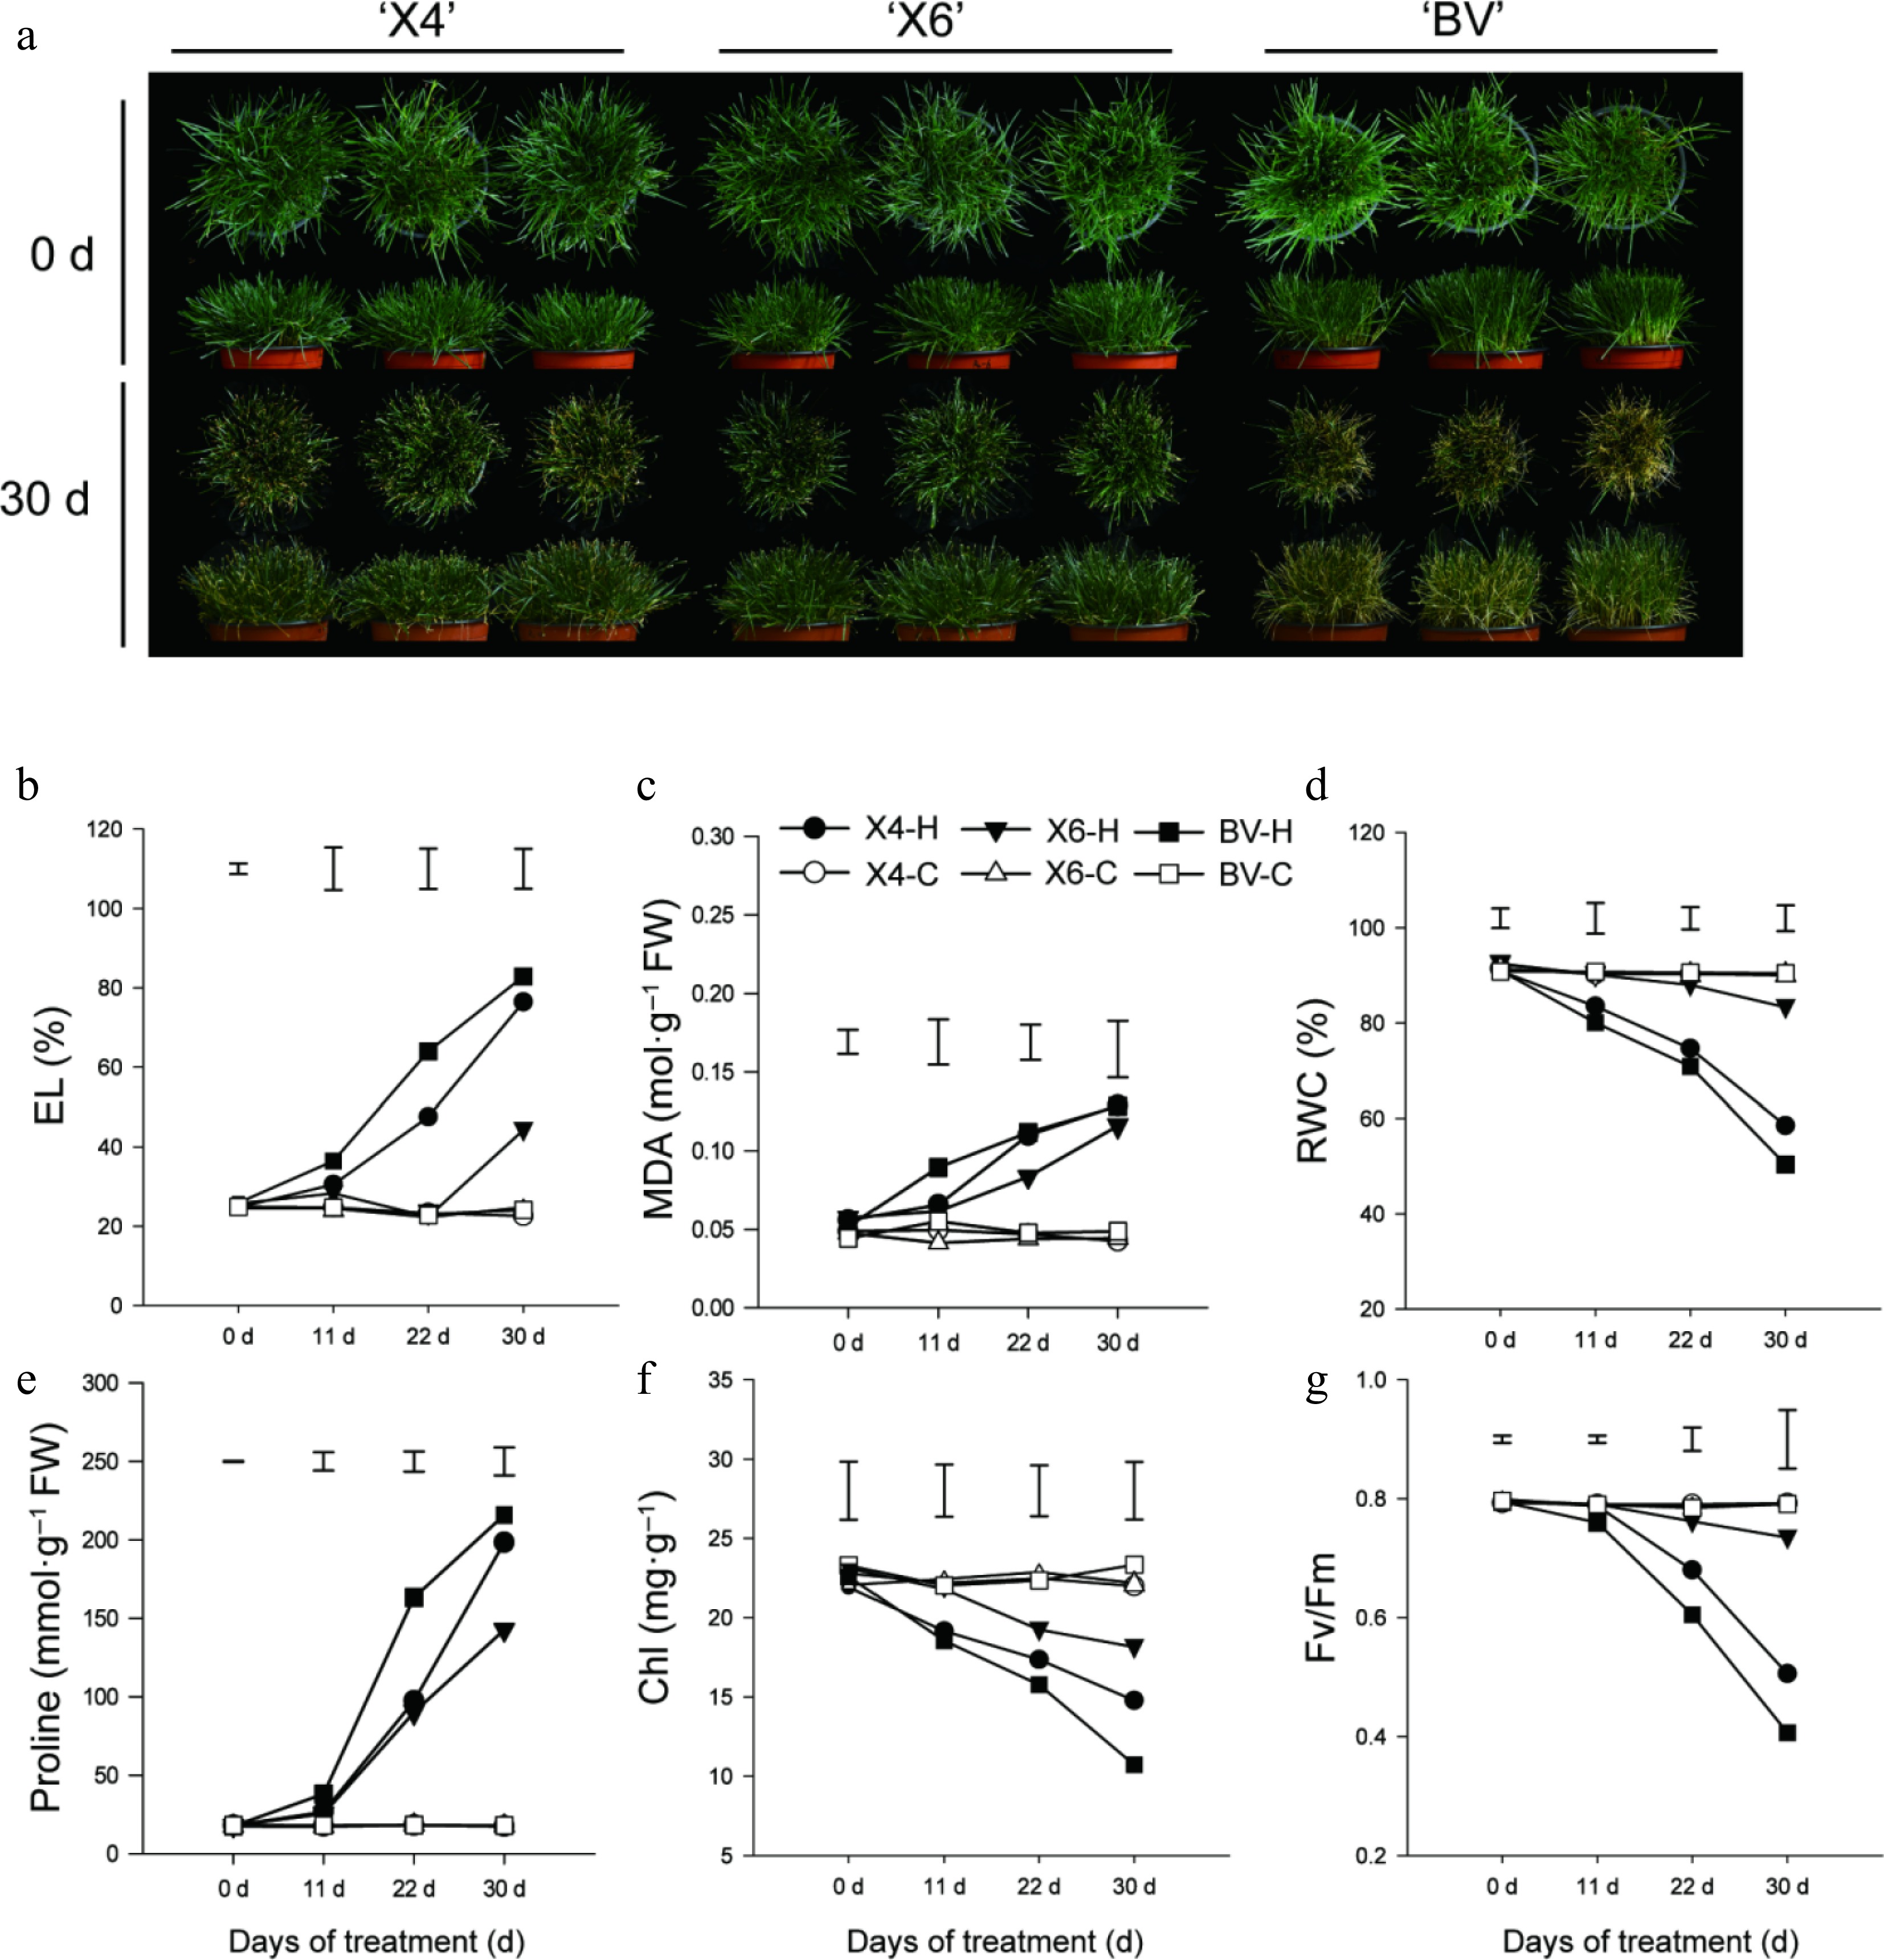
Figure 1.
Characterization of heat tolerance for three perennial varieties. (a) Phenotypes of three varieties before and after 30 d of heat tolerance. (b)–(g) Electrolyte leakage rate (EL), MDA content, relative water content (RWC), proline (Pro) content, chlorophyll (Chl) content, and photochemical efficiency (Fv/Fm) of three varieties subjected to heat stress at 38/30 °C (day/night) or under the control condition (25/20 °C). Data are means ± SE (n = 3), and the different letters above columns represent statistically significant differences at p = 0.05.
-
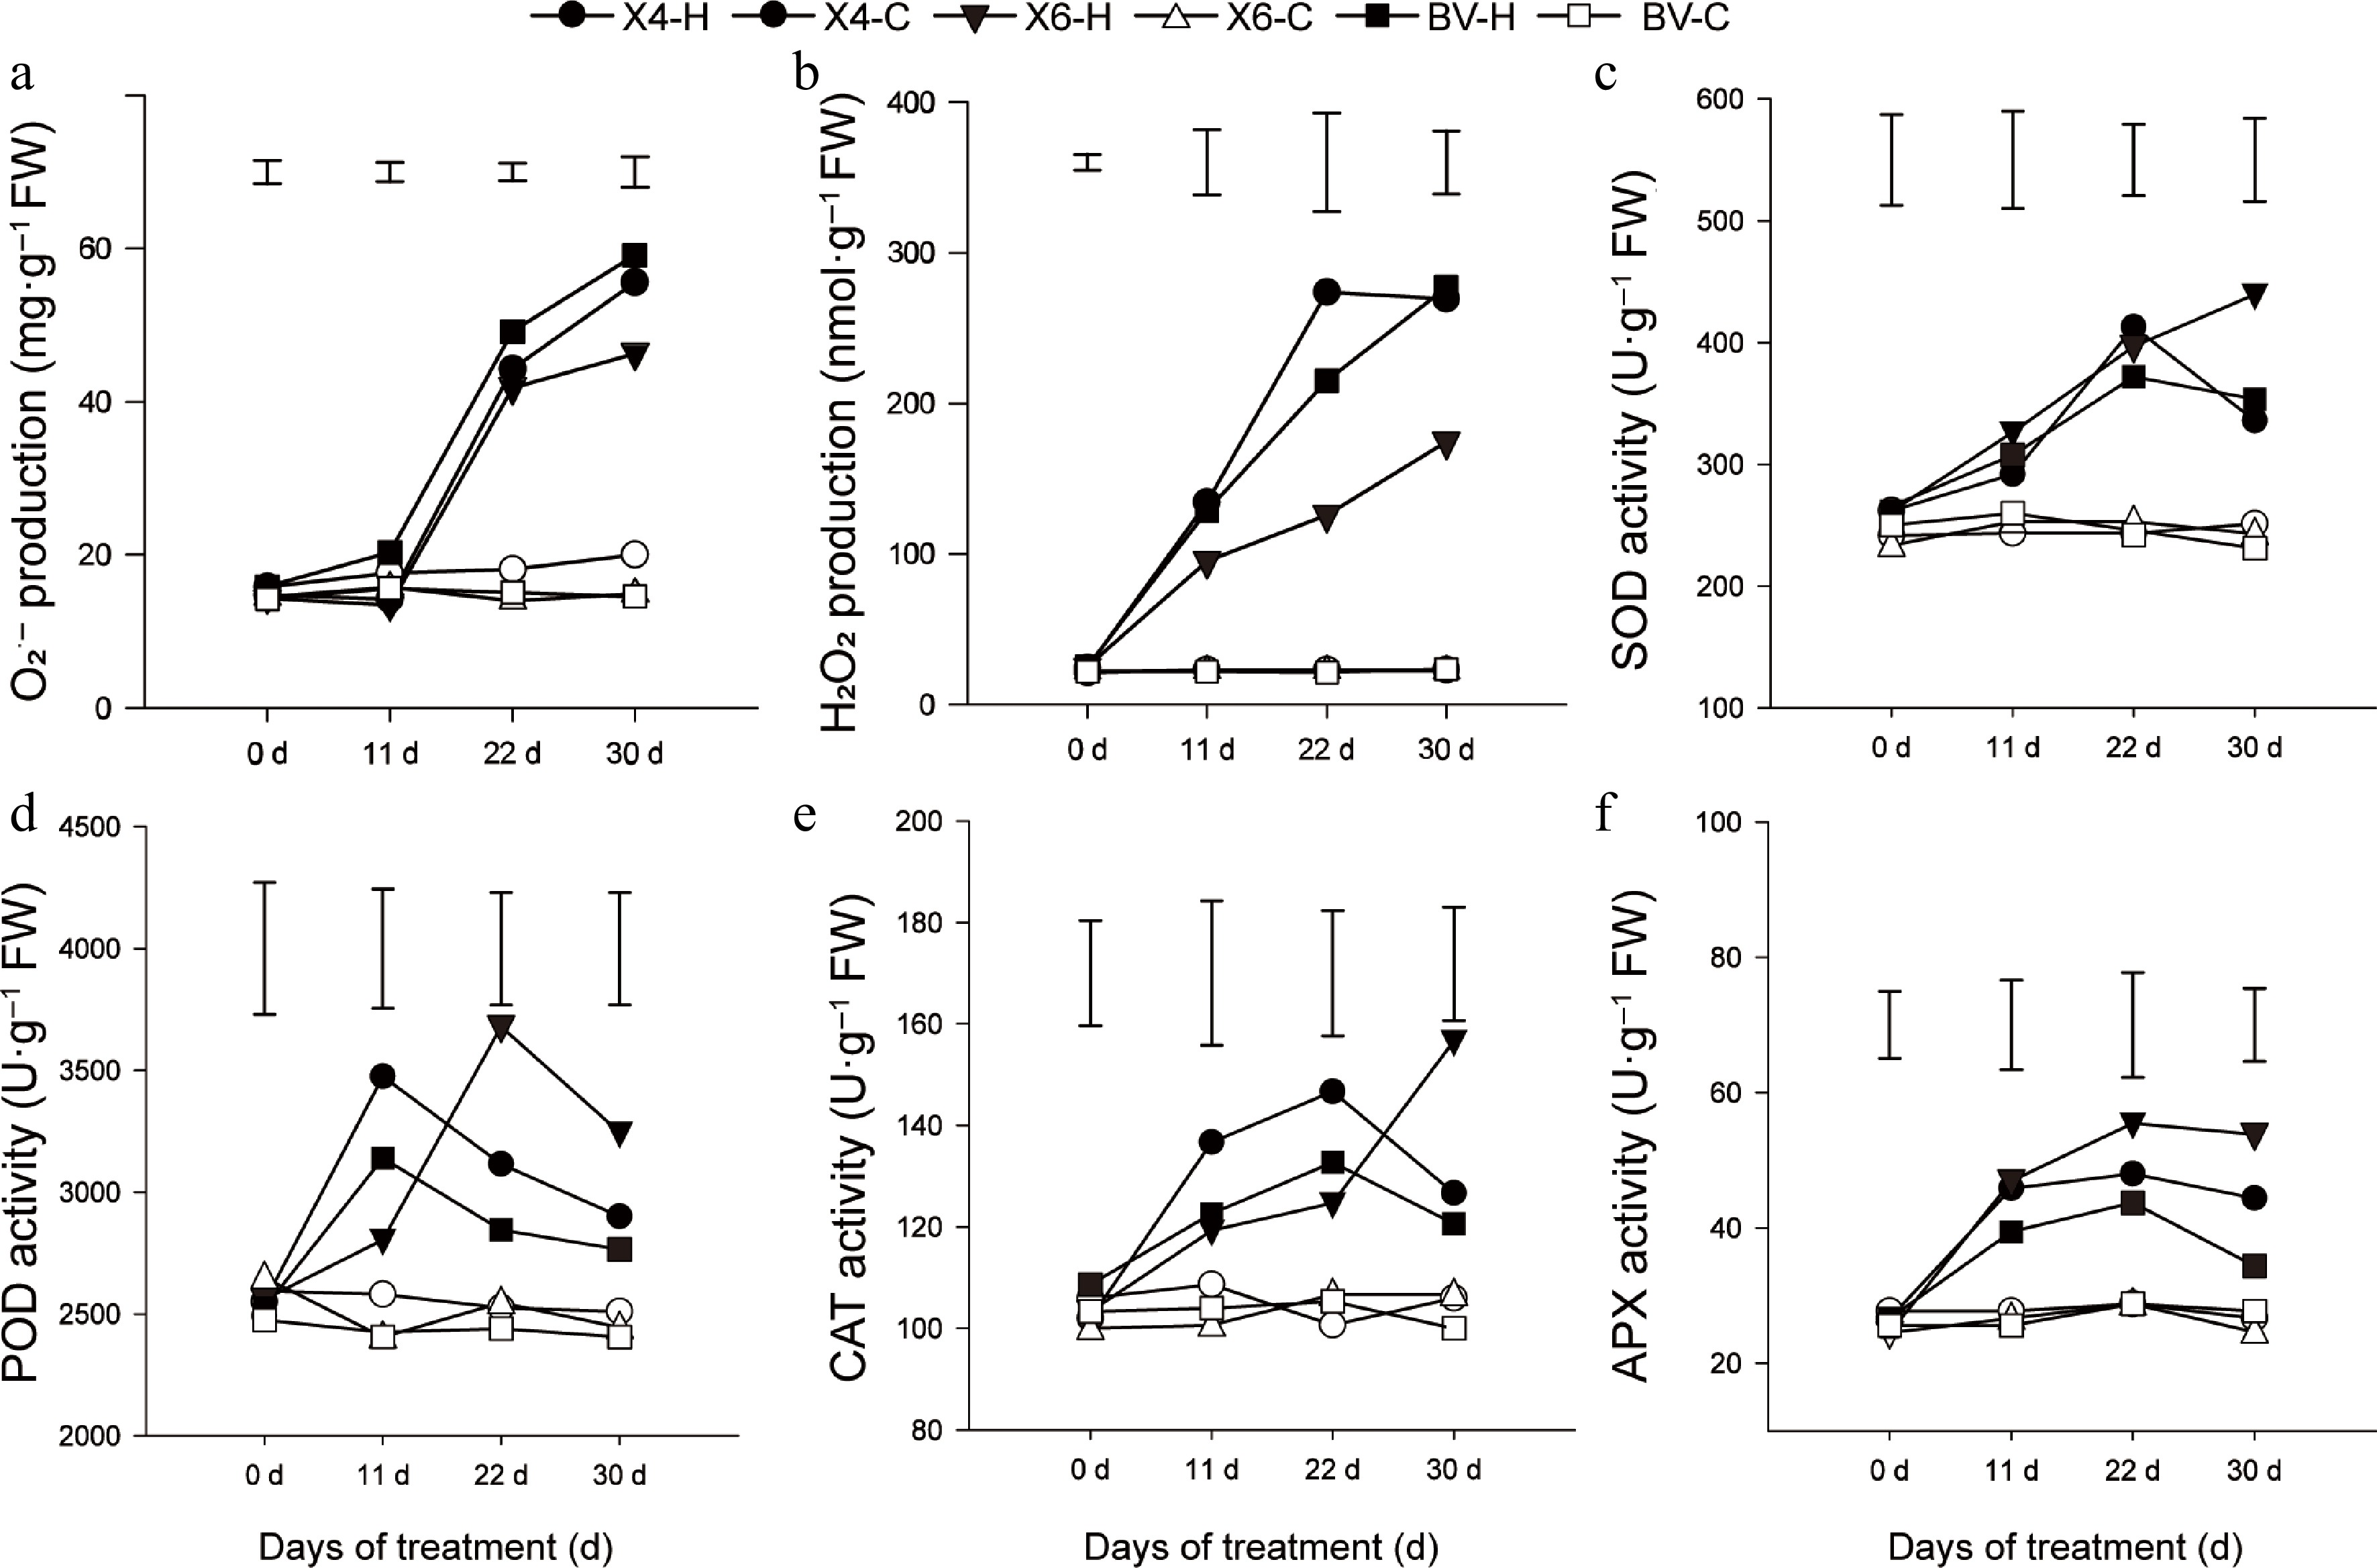
Figure 2.
Reactive oxygen species (ROS) status and activities of ROS-scavenging enzymes of three perennial varieties. (a), (b) Production of O2·– and H2O2 contents. (c)–(f) Activities of SOD, POD, CAT, and APX of perennial ryegrass subjected to heat stress at 38/30 °C (day/night) or under the control condition (25/20 °C). Data are means ± SE (n = 3), and the different letters above columns represent statistically significant differences at p = 0.05.
-
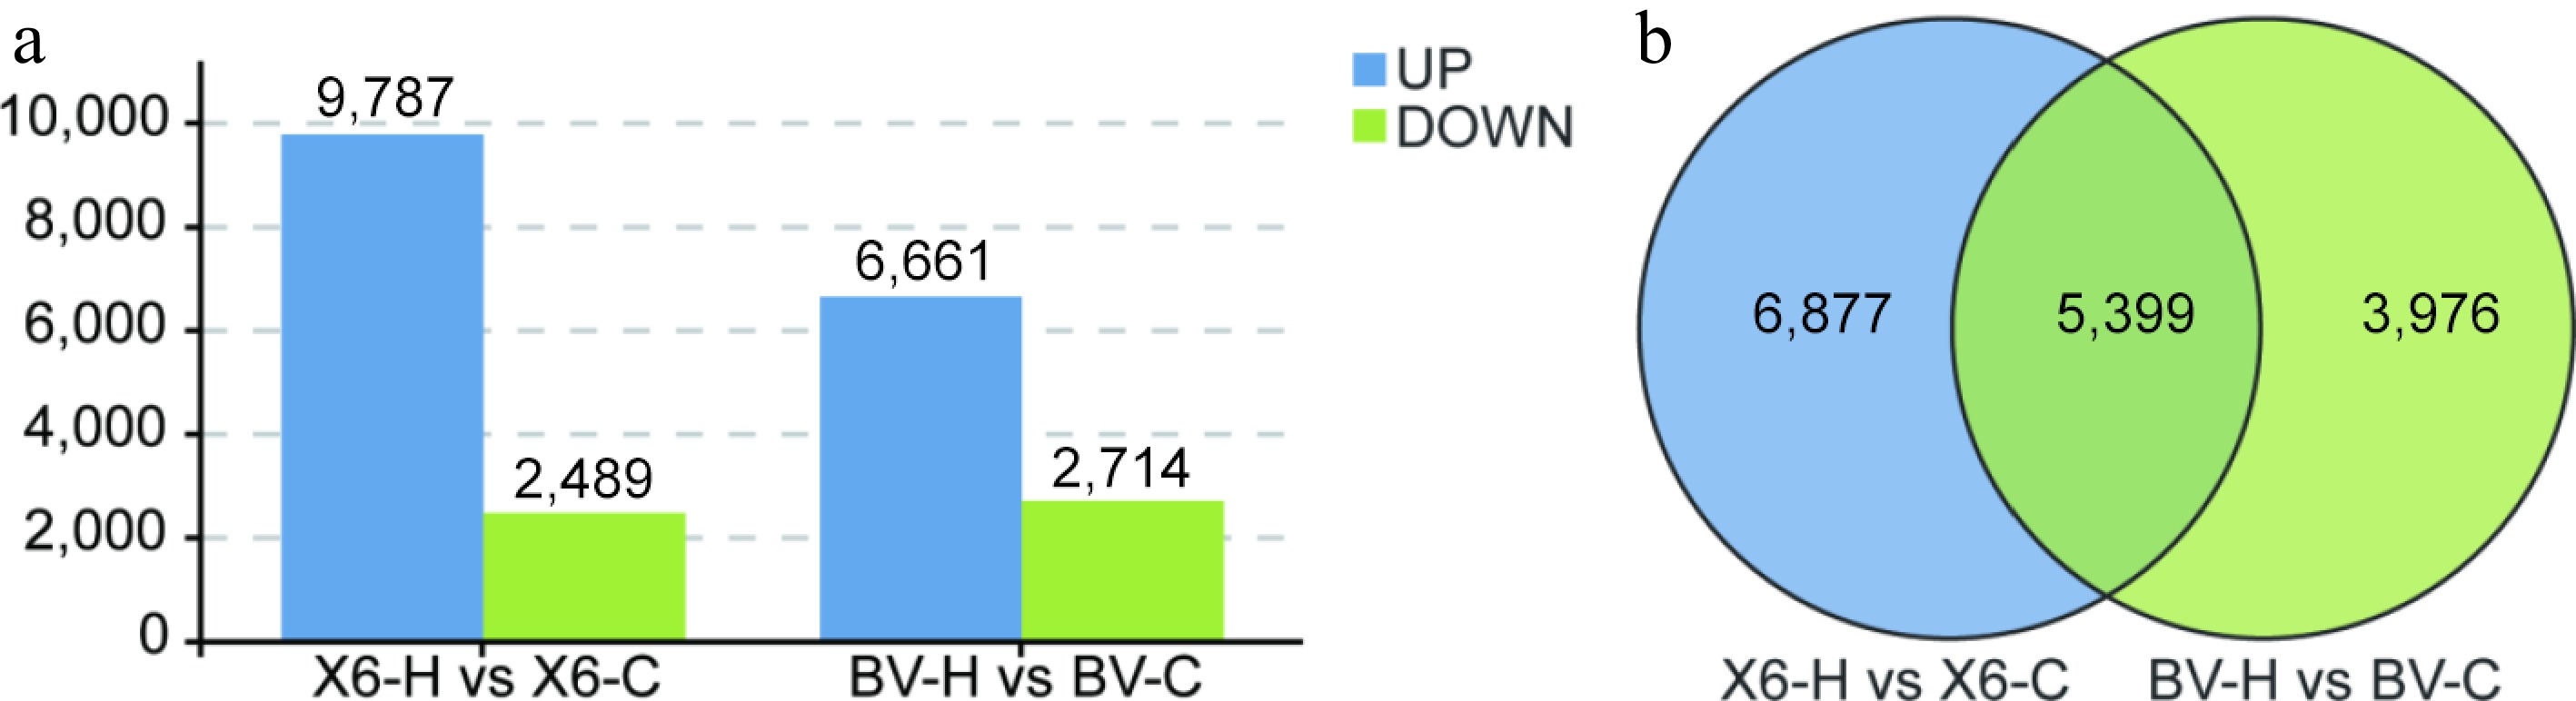
Figure 3.
Number of differentially expressed genes (DEGs) of two ryegrass varieties with contrasting heat tolerance. (a) Number of up- or down-regulated DEGs. (b) Venn diagram of DEGs in different groups between 'X6-H vs X6-C' and 'BV-H vs BV-C'.
-
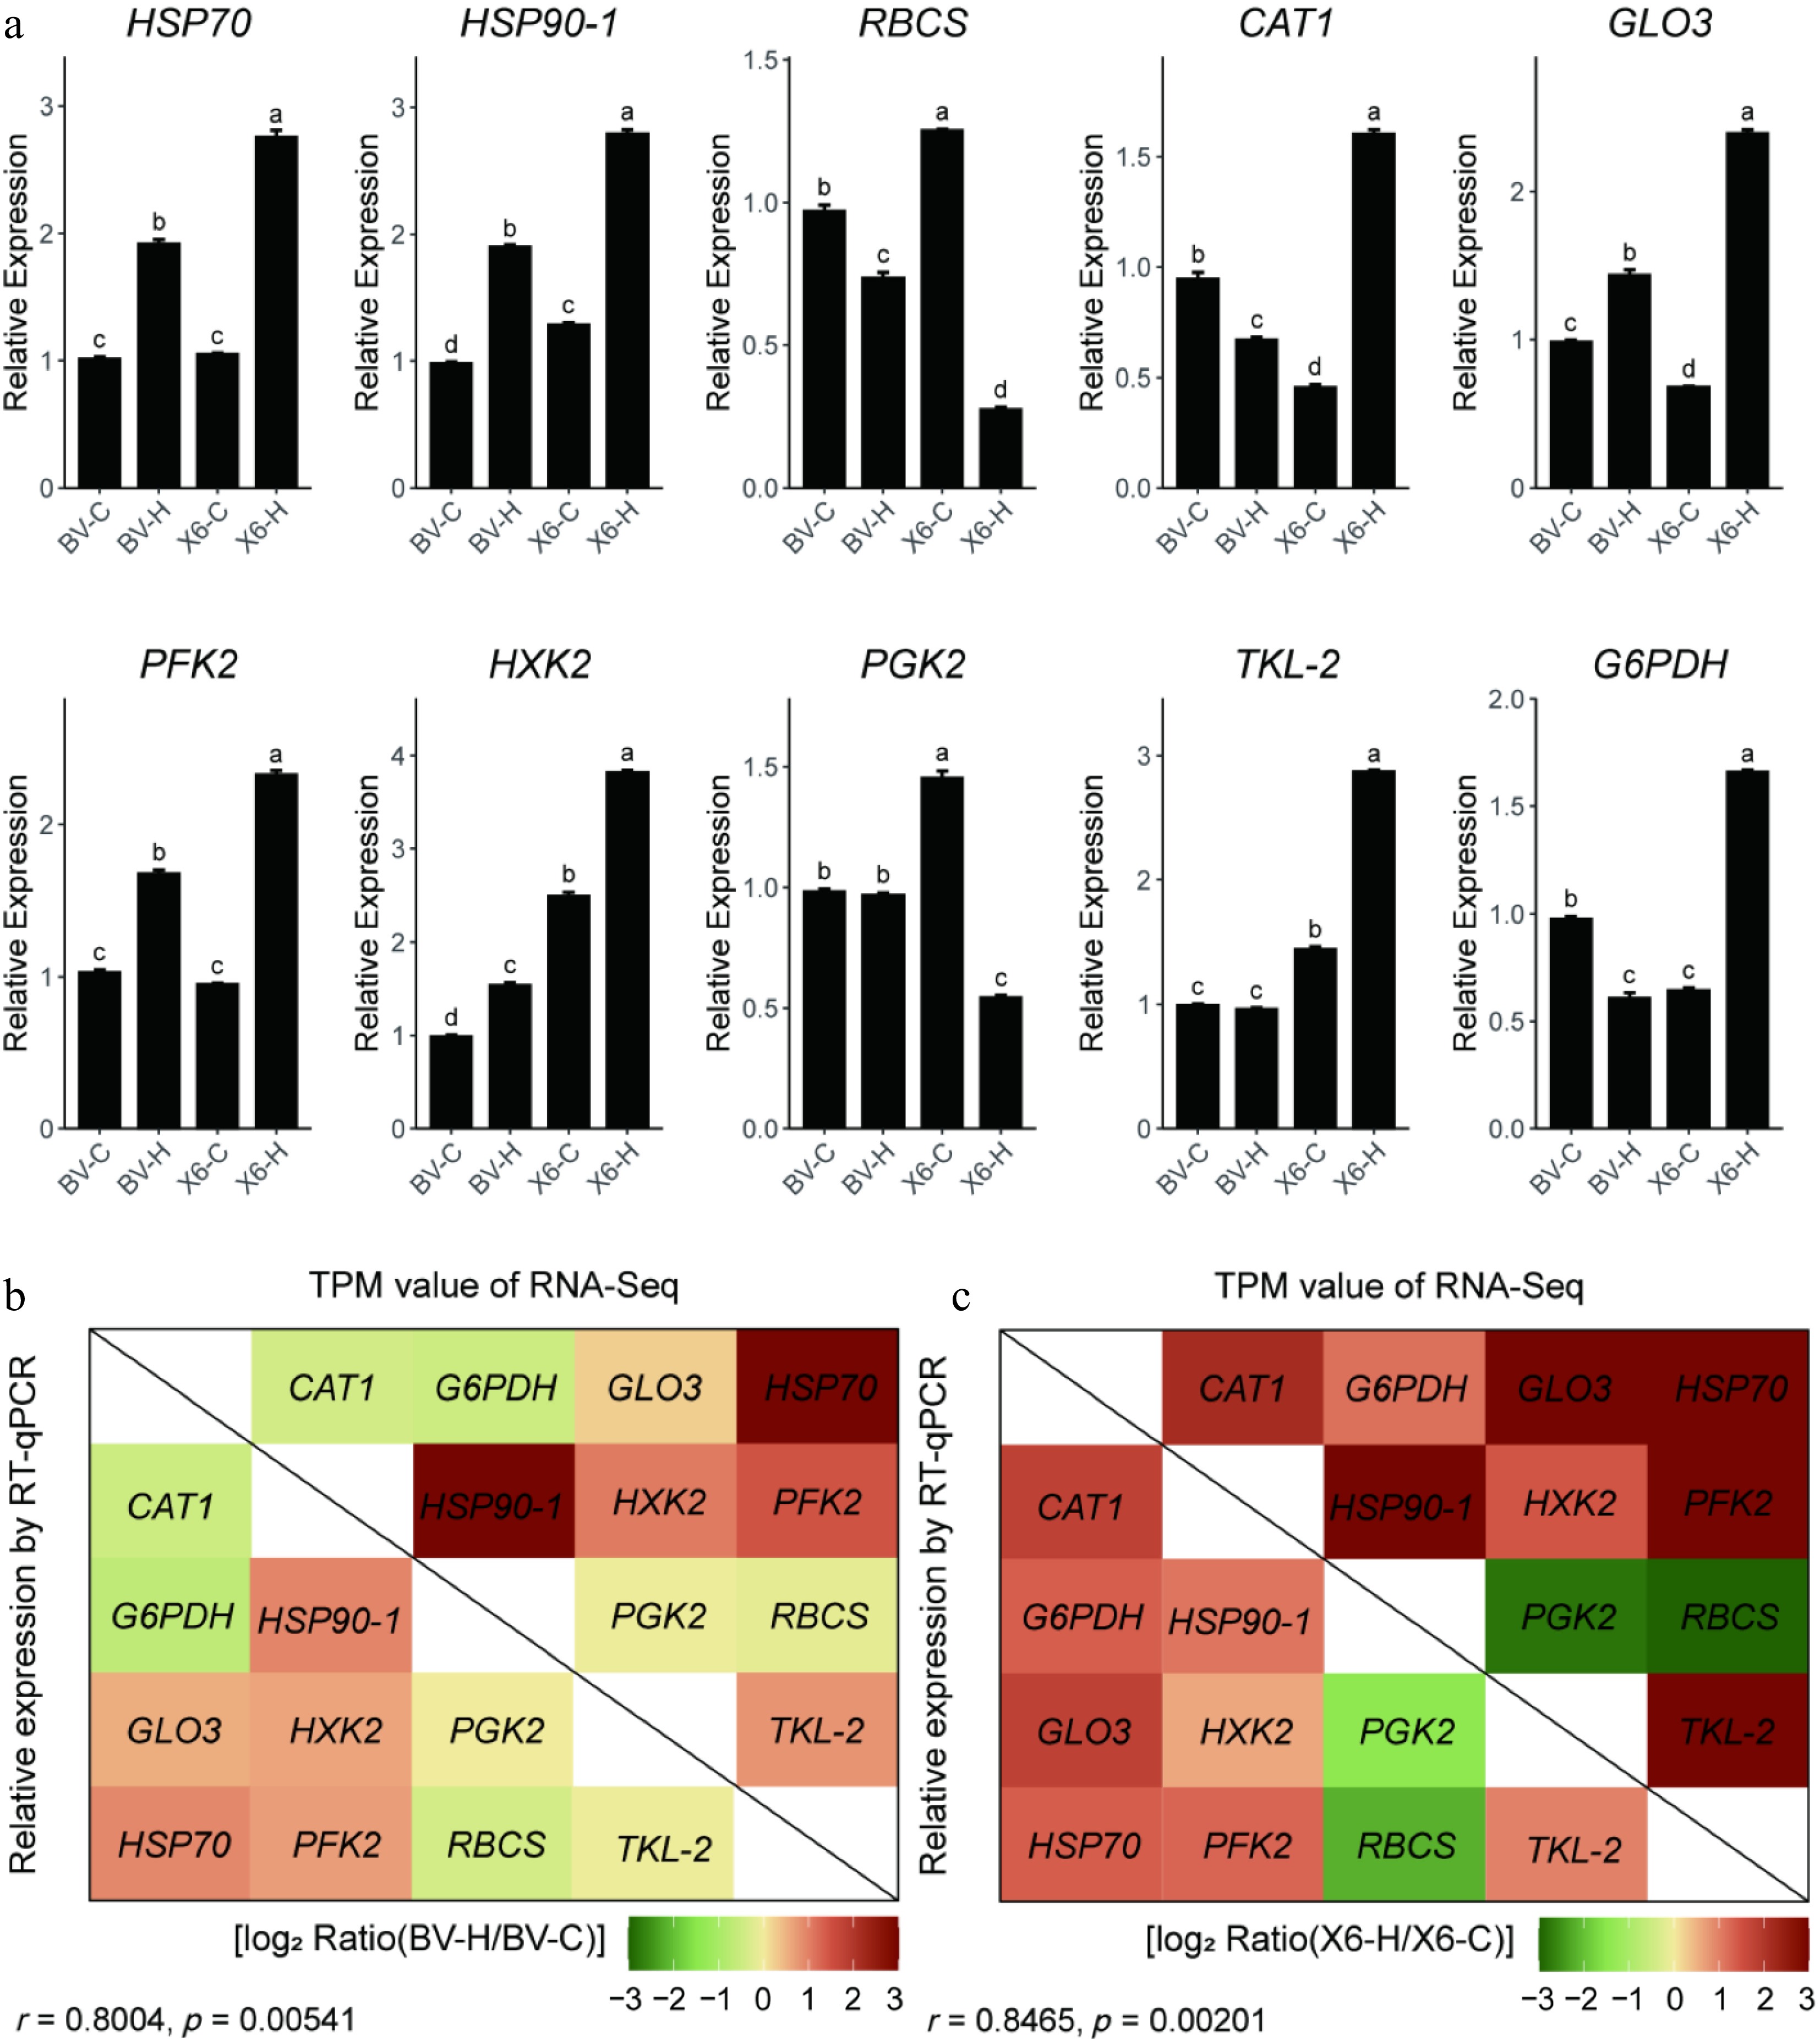
Figure 4.
Verification of RNA-Seq data by real-time quantitative RT-PCR. (a) Relative expression of ten genes identified as DEGs in the RNA-seq using real-time PCR. (b), (c) Correlation analysis between relative expression values of RT-qPCR and TPM values of RNA-seq. Data in (a) are means ± SE (n = 4) and the different letters above columns represent statistically significant differences at p = 0.05.
-
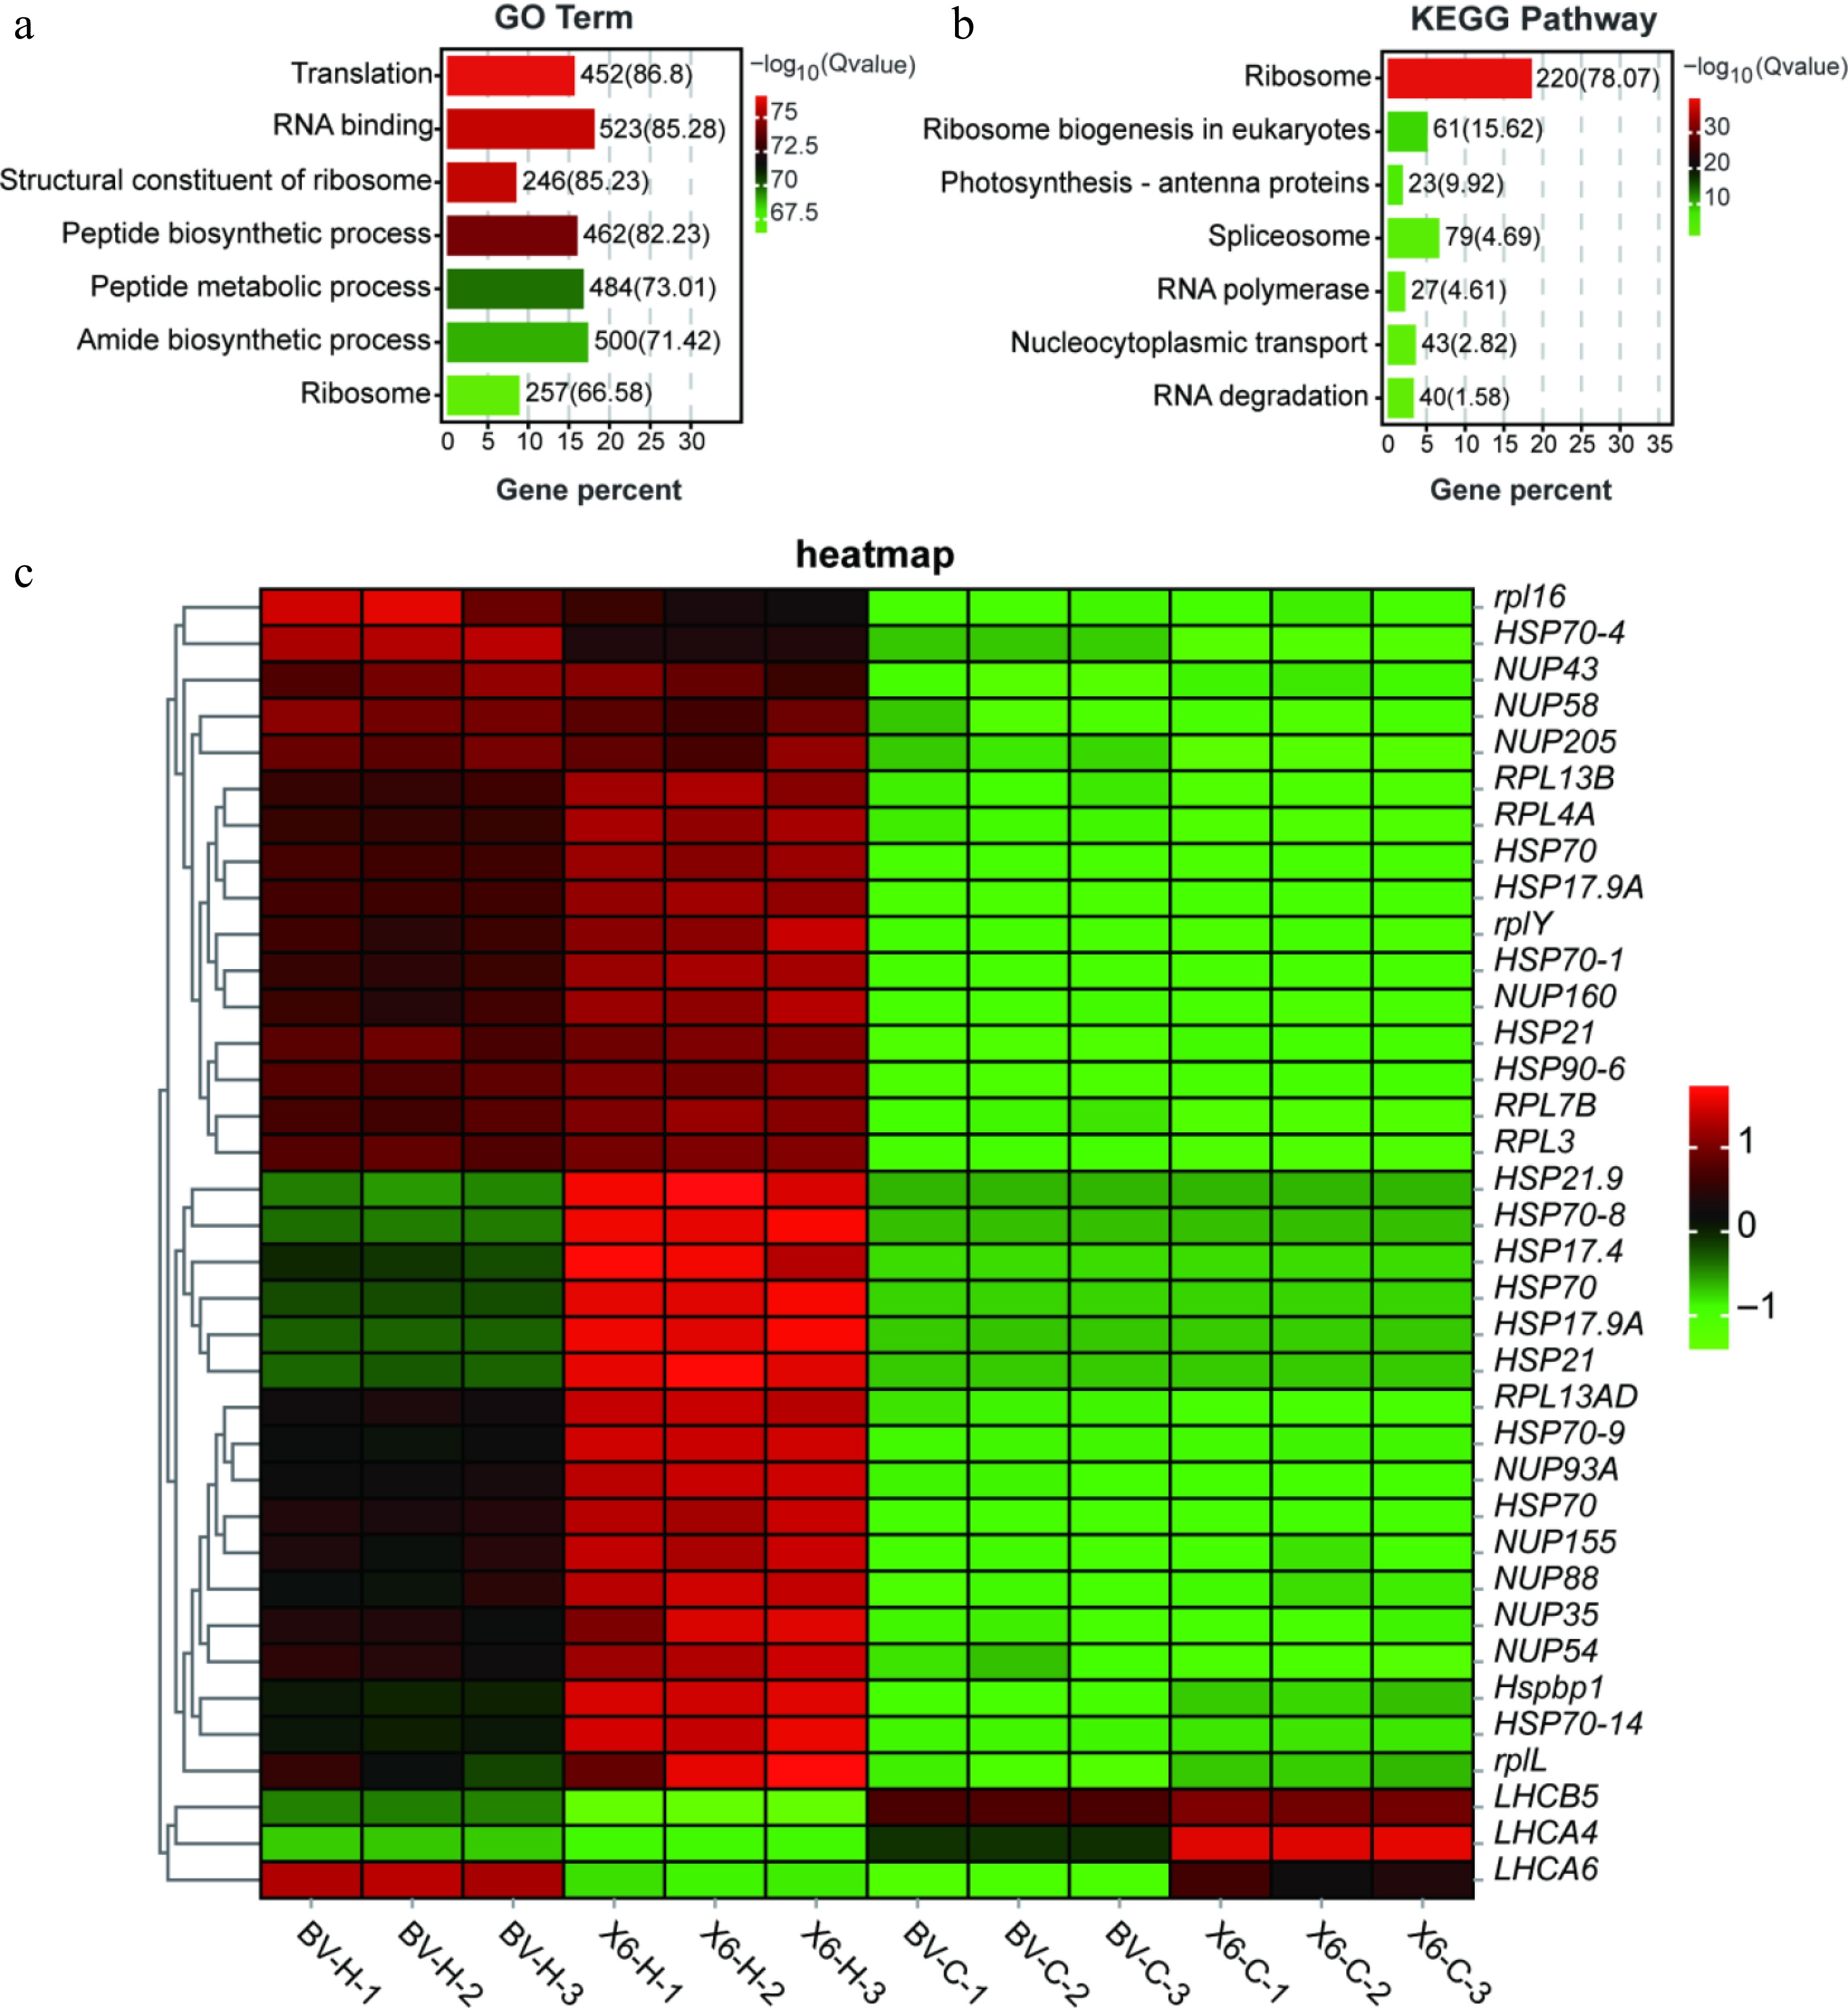
Figure 5.
Gene Ontology (GO) and KEGG analyses of common heat-responsive DEGs between two ryegrass varieties with contrasting heat tolerance. (a), (b) GO and KEGG analyses of the 5,399 common heat-responsive DEGs between two ryegrass varieties. (c) Heatmap of representative common DEGs among the samples.
-
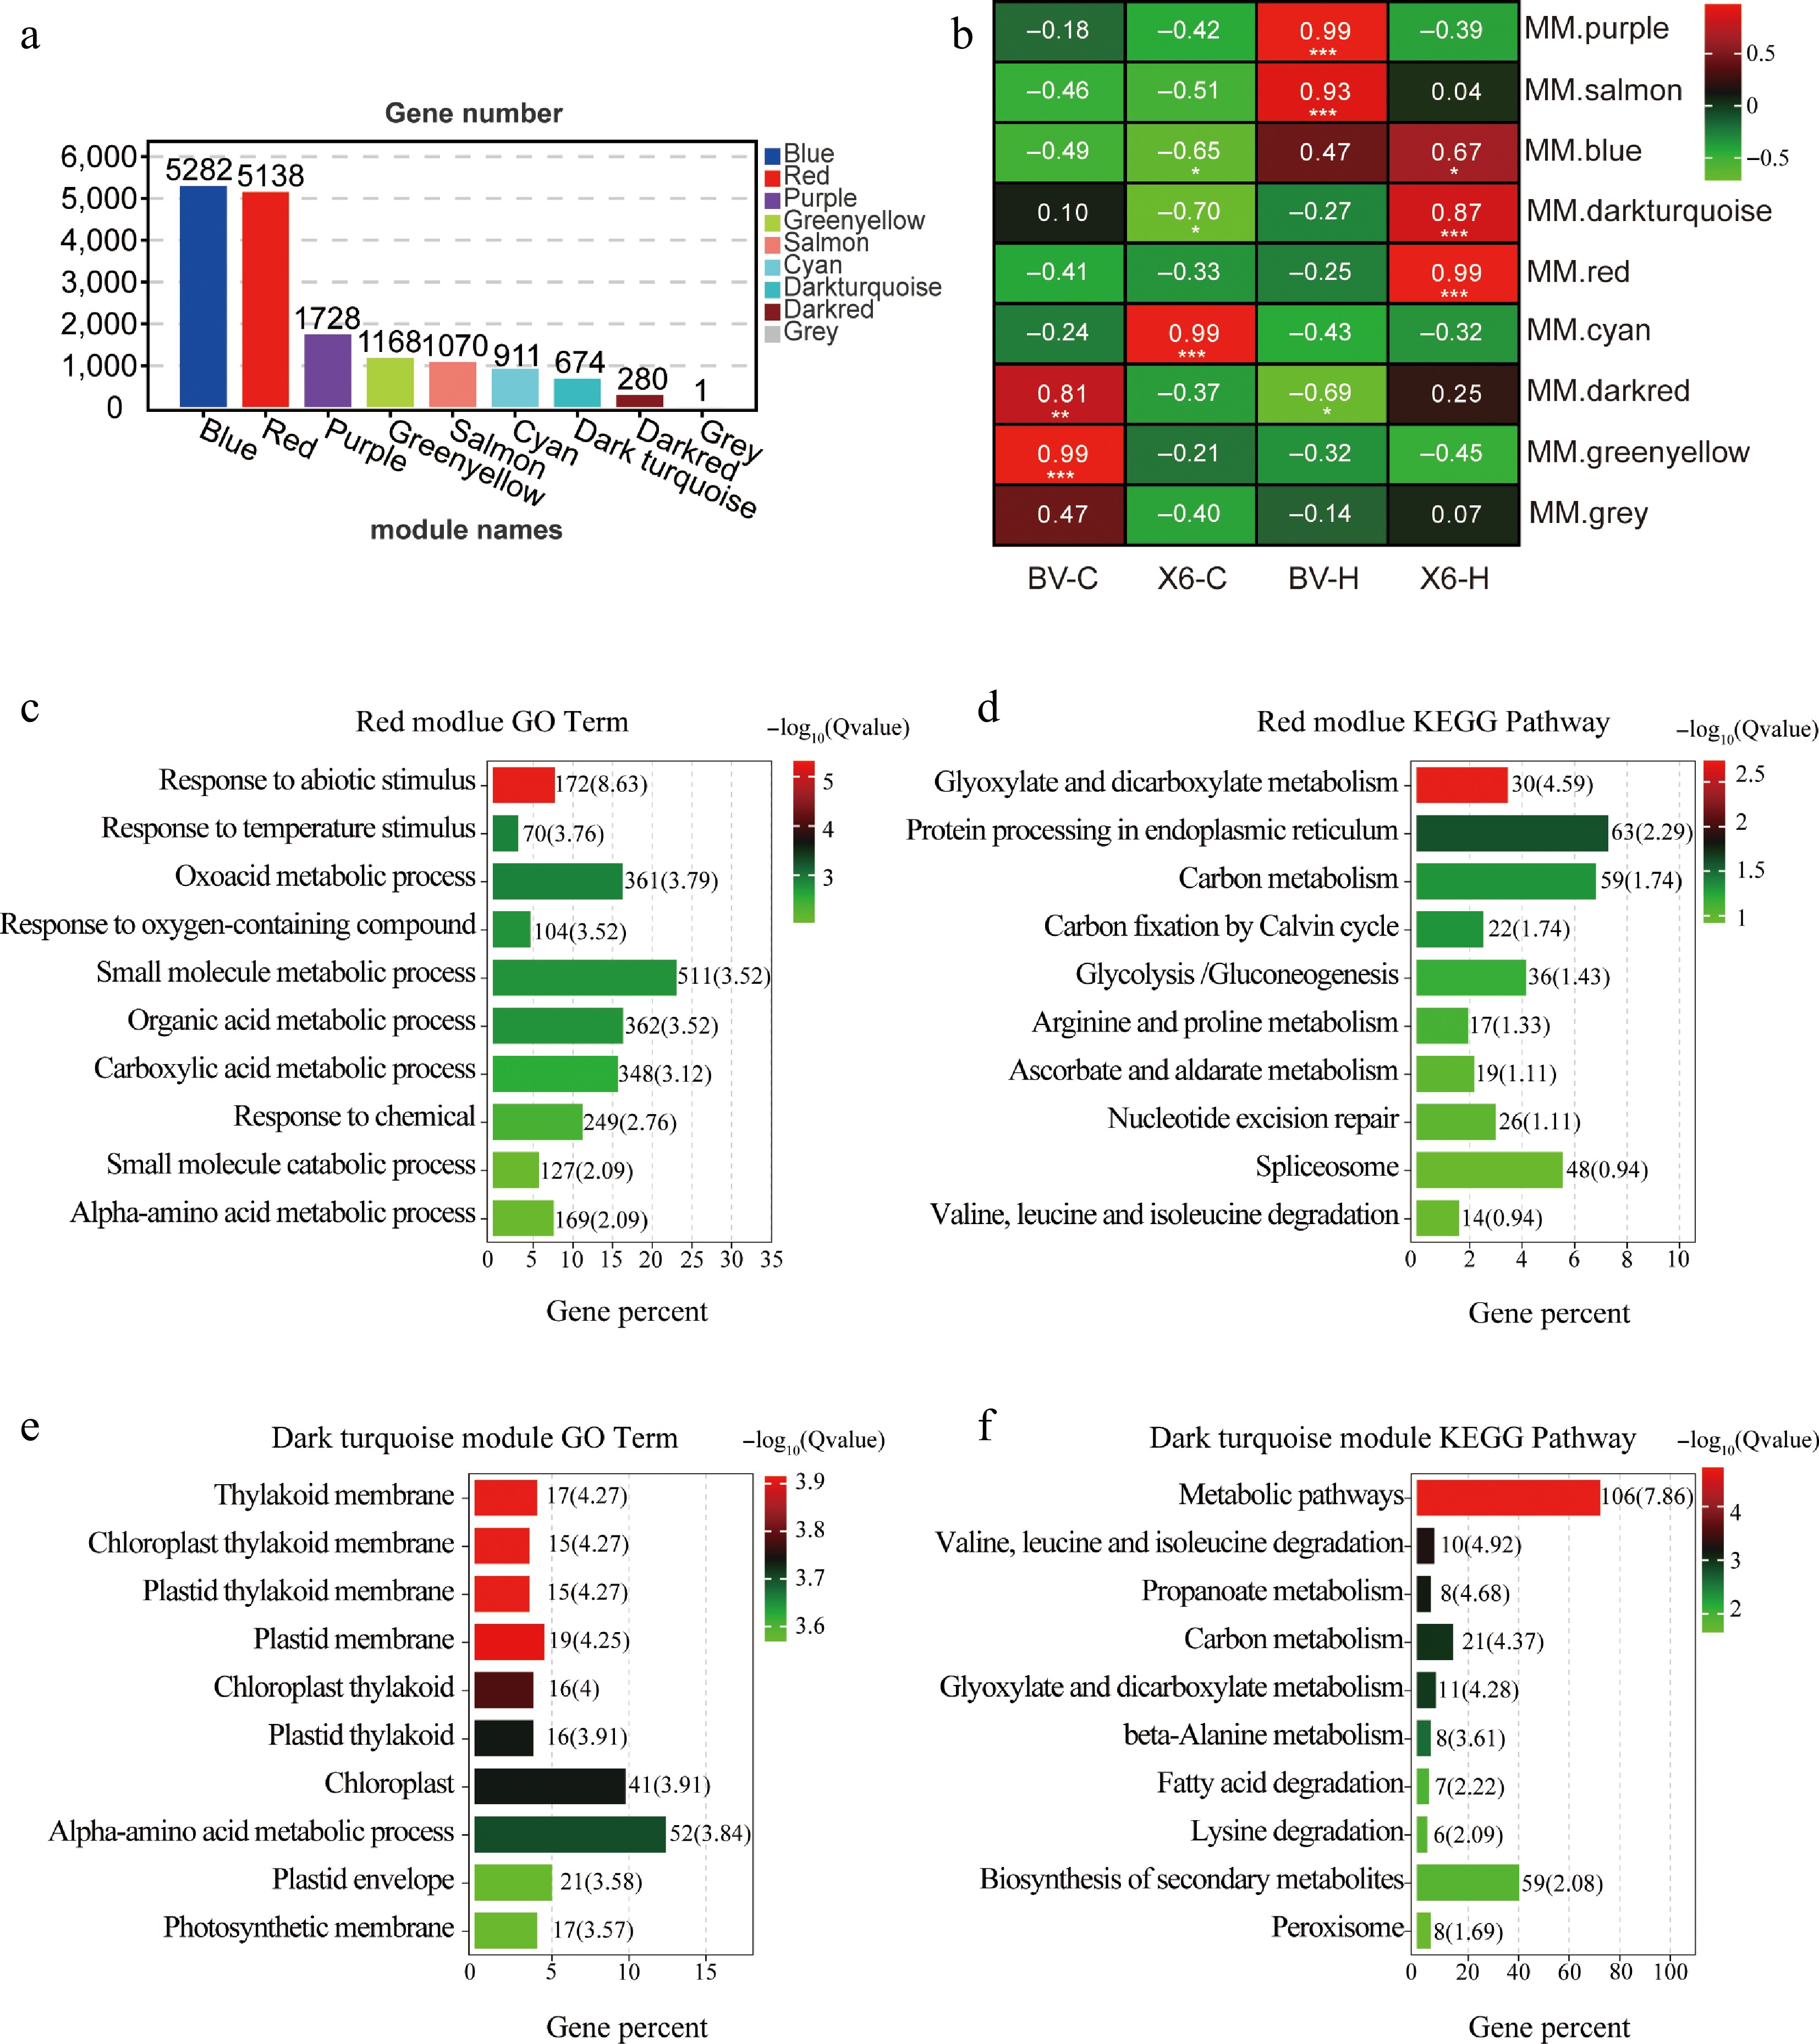
Figure 6.
Weighted gene co-expression network analysis (WGCNA) of modules comprising specific DEGs in heat-treated 'X6' (X6-H) and GO and KEGG analysis of these specific DEGs. (a) Number of DEGs in eight modules generated from WGCNA. (b) Modules and traits correlation analysis pinpointed that the Red module and the Dark turquoise module had significant correlations with 'X6-H'. (c), (d) Top ten GO and KEGG enriched terms for DEGs in the Red module. (e), (f) Top ten GO and KEGG enriched terms for DEGs in the Dark turquoise module.
-
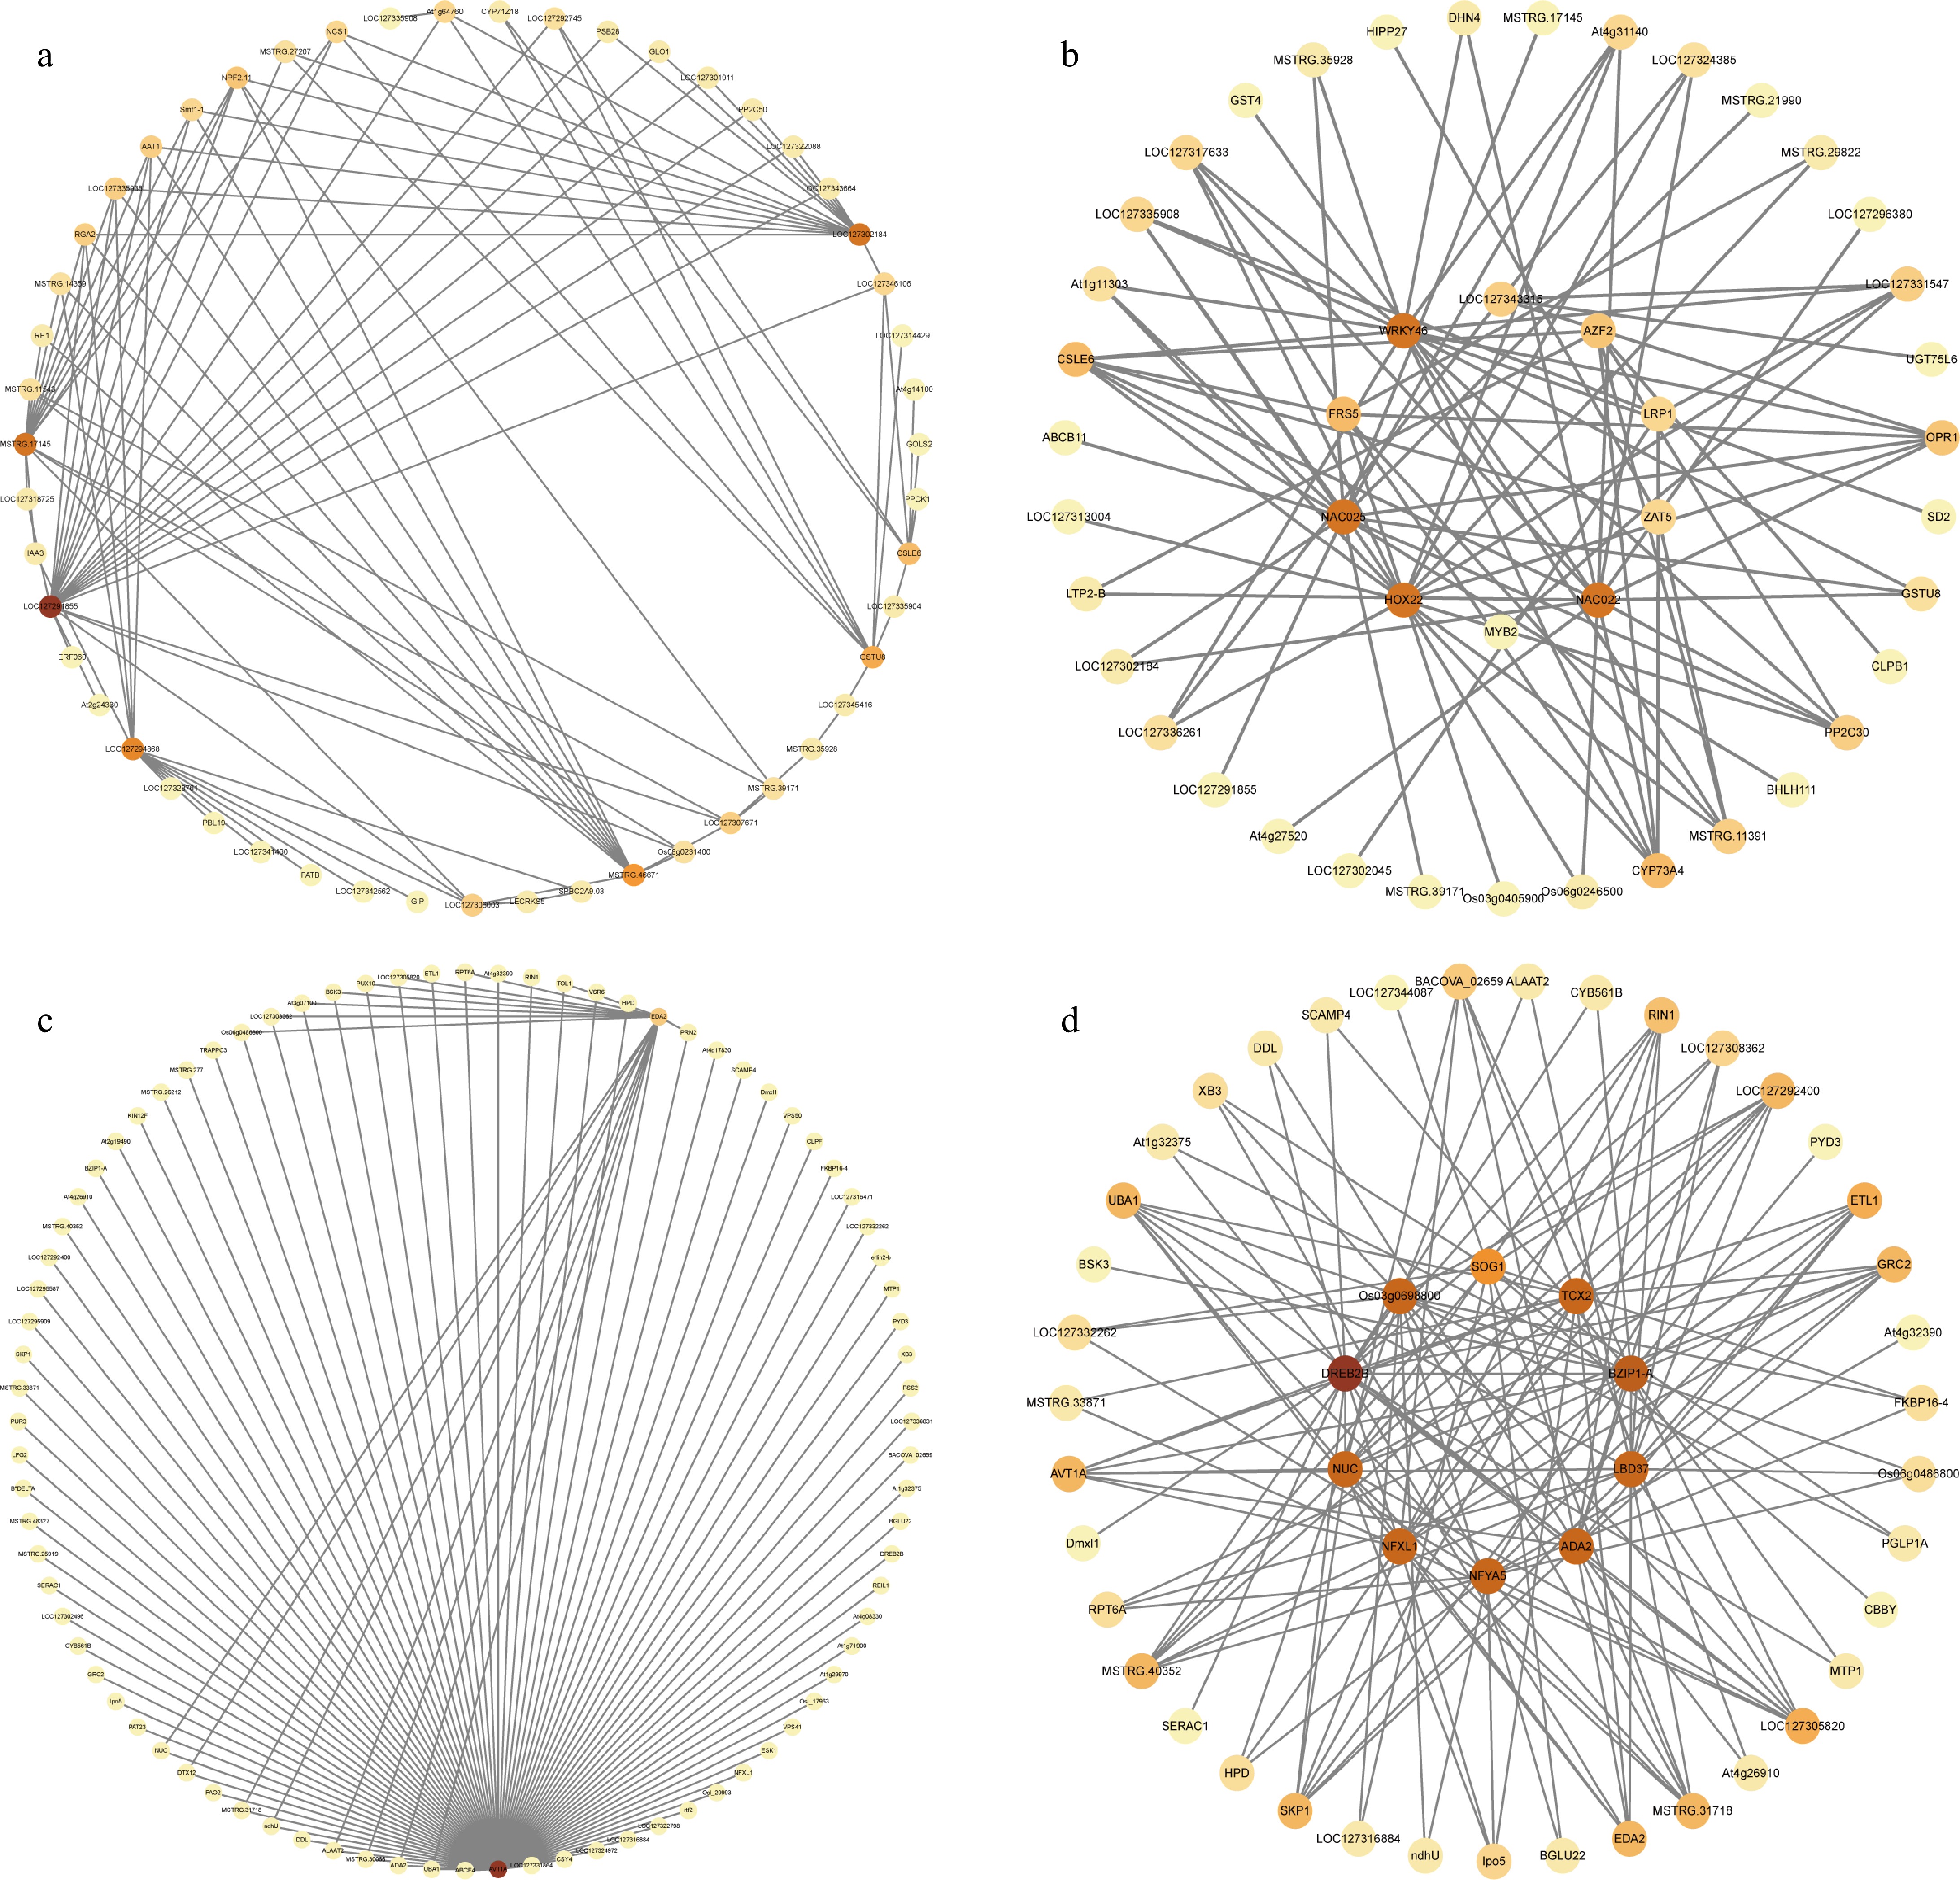
Figure 7.
Gene co-expression network analysis of modules comprising specific DEGs in heat-treated 'X6' (X6-H). (a), (b) Co-expression network of the top 100 genes with connectivity and the top ten transcription factors with connectivity in the Red module. (c), (d) Co-expression network of the top 100 genes with connectivity and the top ten transcription factors with connectivity in the Dark turquoise module.
Figures
(7)
Tables
(0)