-
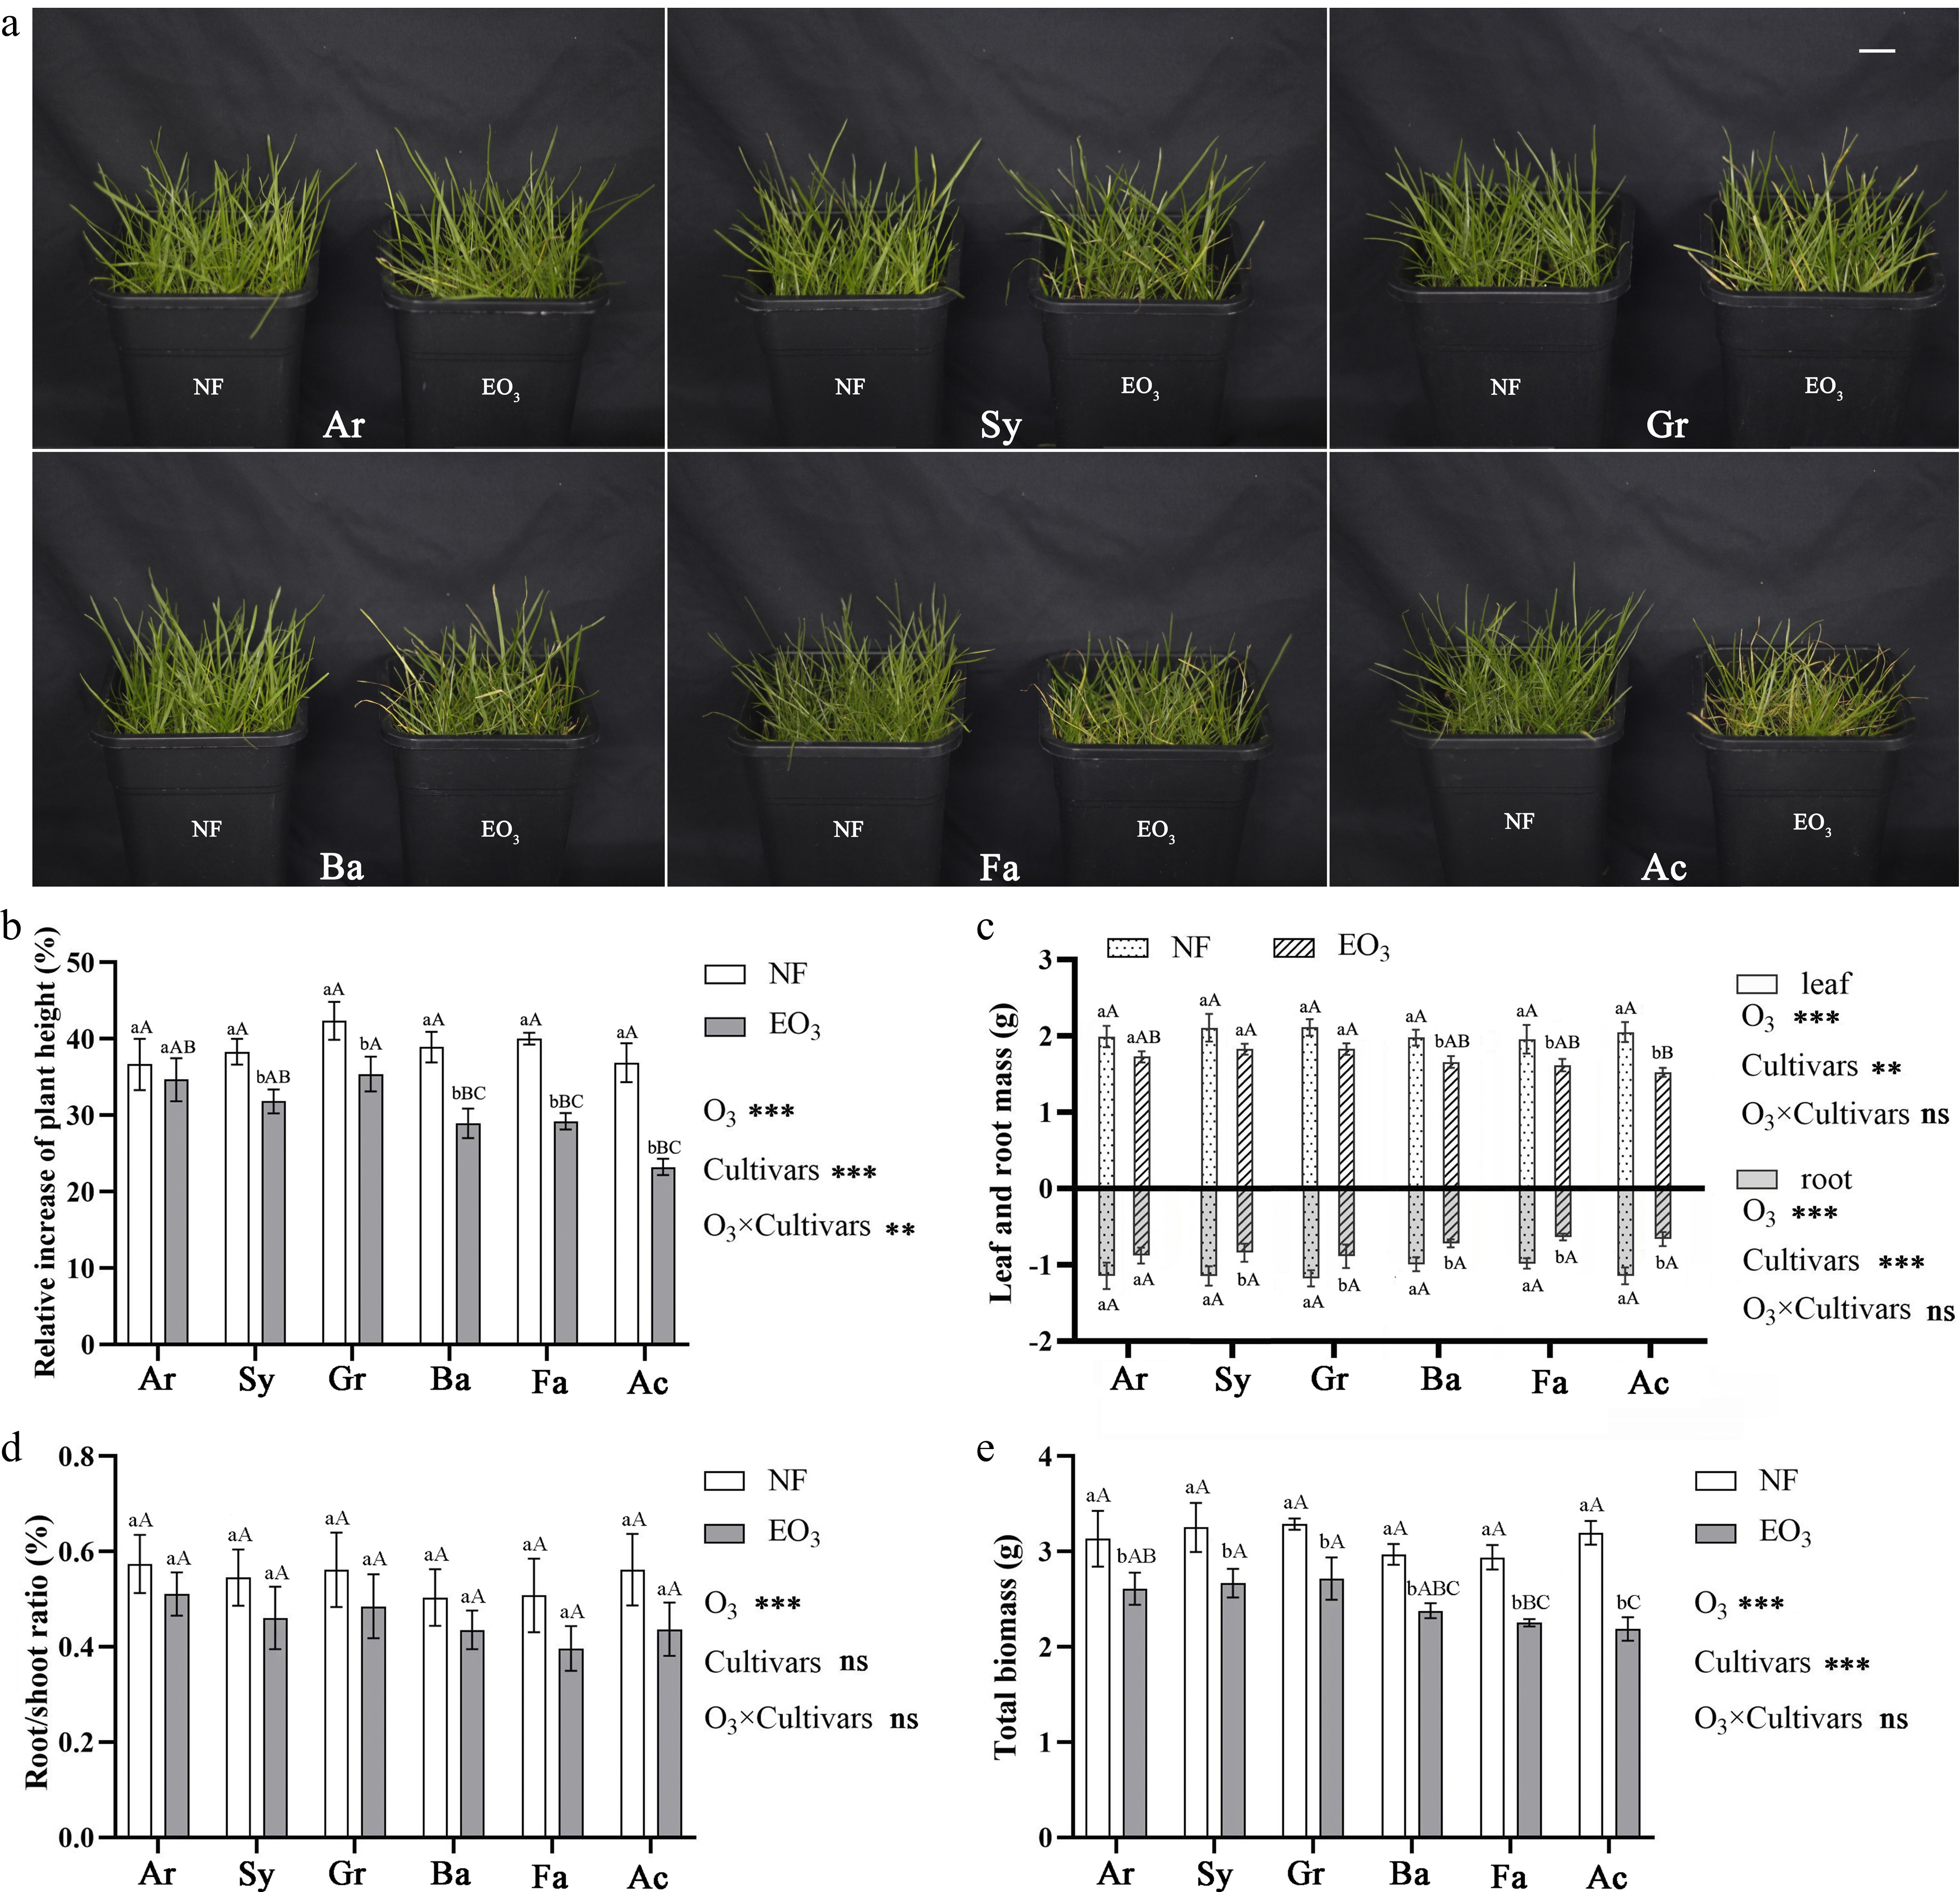
Figure 1.
Growth status of Kentucky bluegrass different cultivars under (a) ozone stress, and (b) effects of ozone stress on the relative increase of plant height, (c) leaf mass and root mass, (d) root/shoot ratio, and (e) total biomass of Kentucky bluegrass cultivars. The scale in (a) is 2 cm. * represents the significance of two-way ANOVA: * p < 0.05, ** p < 0.01, *** p < 0.001, ns: no significant difference (Tukey test). Different lowercase letters and capital letters indicate significant difference between different treatment groups of the same cultivar, or differences among cultivars under the same treatment (p < 0.05). NF, non-filtered ambient air, as a control; EO3, non-filtered ambient air + 80 ppb O3. The name of cultivars are shown in Table 1.
-
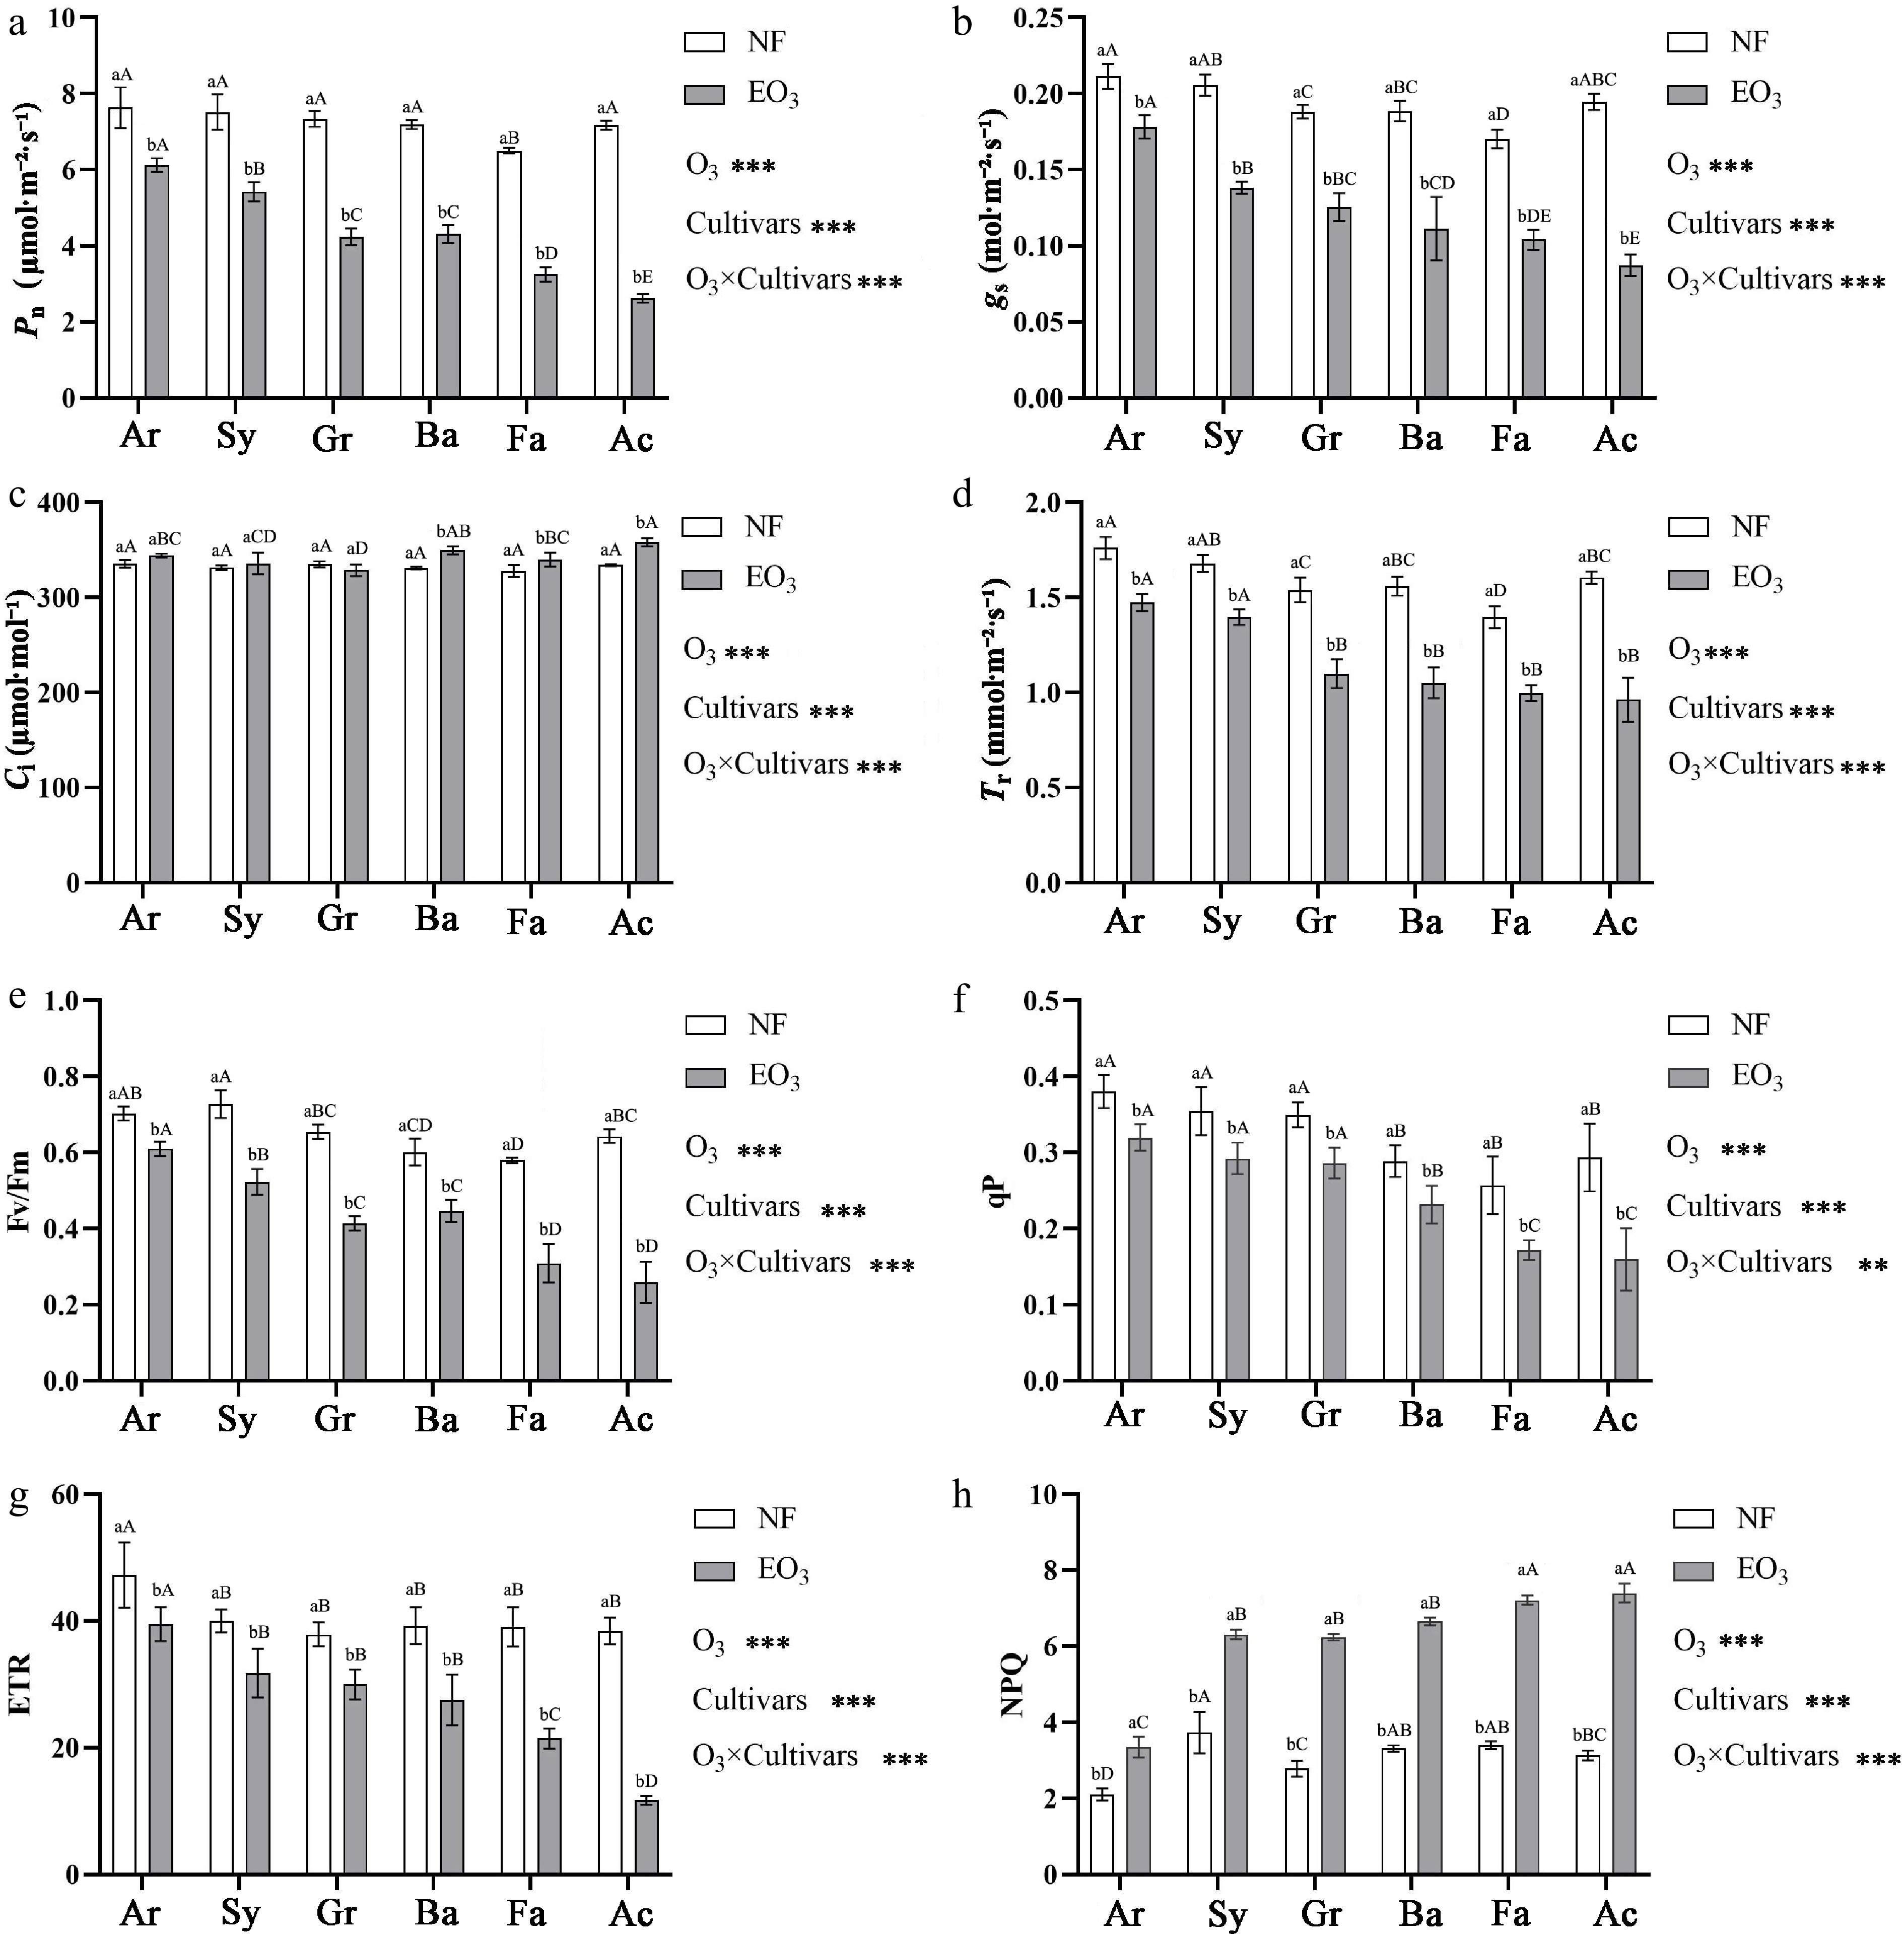
Figure 2.
Effects of ozone stress on the net photosynthetic rate (Pn, a), stomatal conductance (gs, b), intercellular CO2 concentration (Ci, c), transpiration rate (Tr, d), and chlorophyll fluorescence parameters (Fv/Fm, e; qP, f; ETR, g; NPQ, h) of Kentucky bluegrass cultivars. Notes for statistical analysis, abbreviations, and cultivar names are provided in Table 1 and Fig. 1.
-
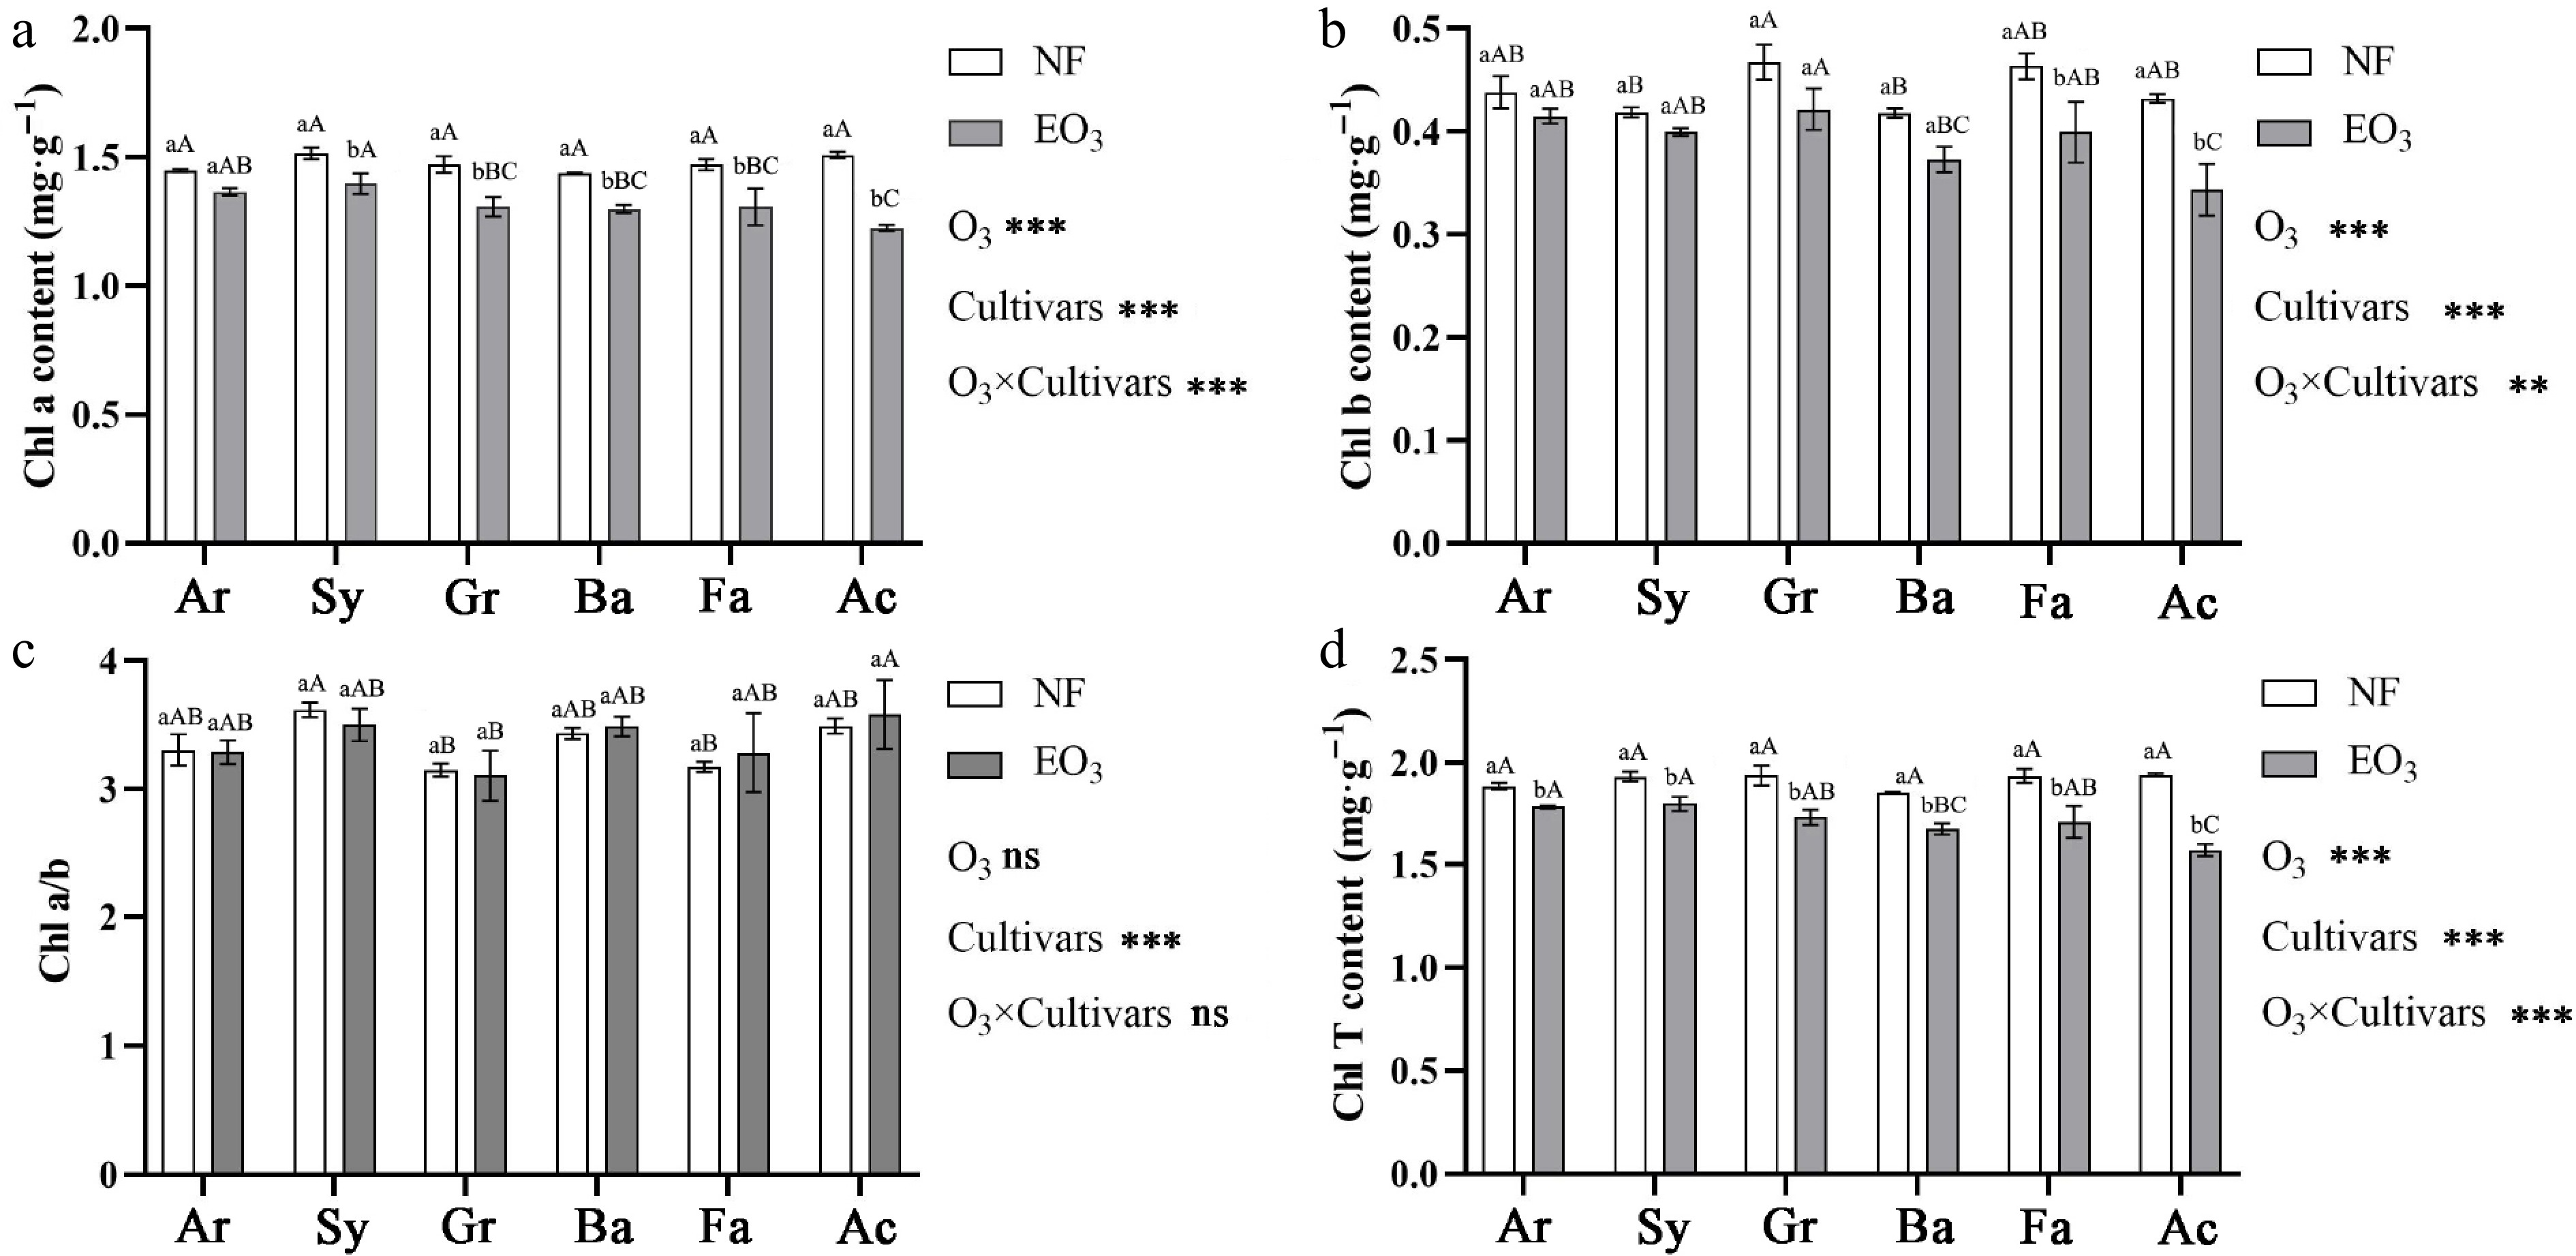
Figure 3.
Effects of ozone stress on (a) chlorophyll a (Chl a), (b) chlorophyll b (Chl b), (c) chlorophyll a/chlorophyll b (Chl a/b), and (d) total chlorophyll (Chl T) content of Kentucky bluegrass cultivars. Notes for statistical analysis, abbreviations, and cultivar names are provided in Table 1 and Fig. 1.
-
-
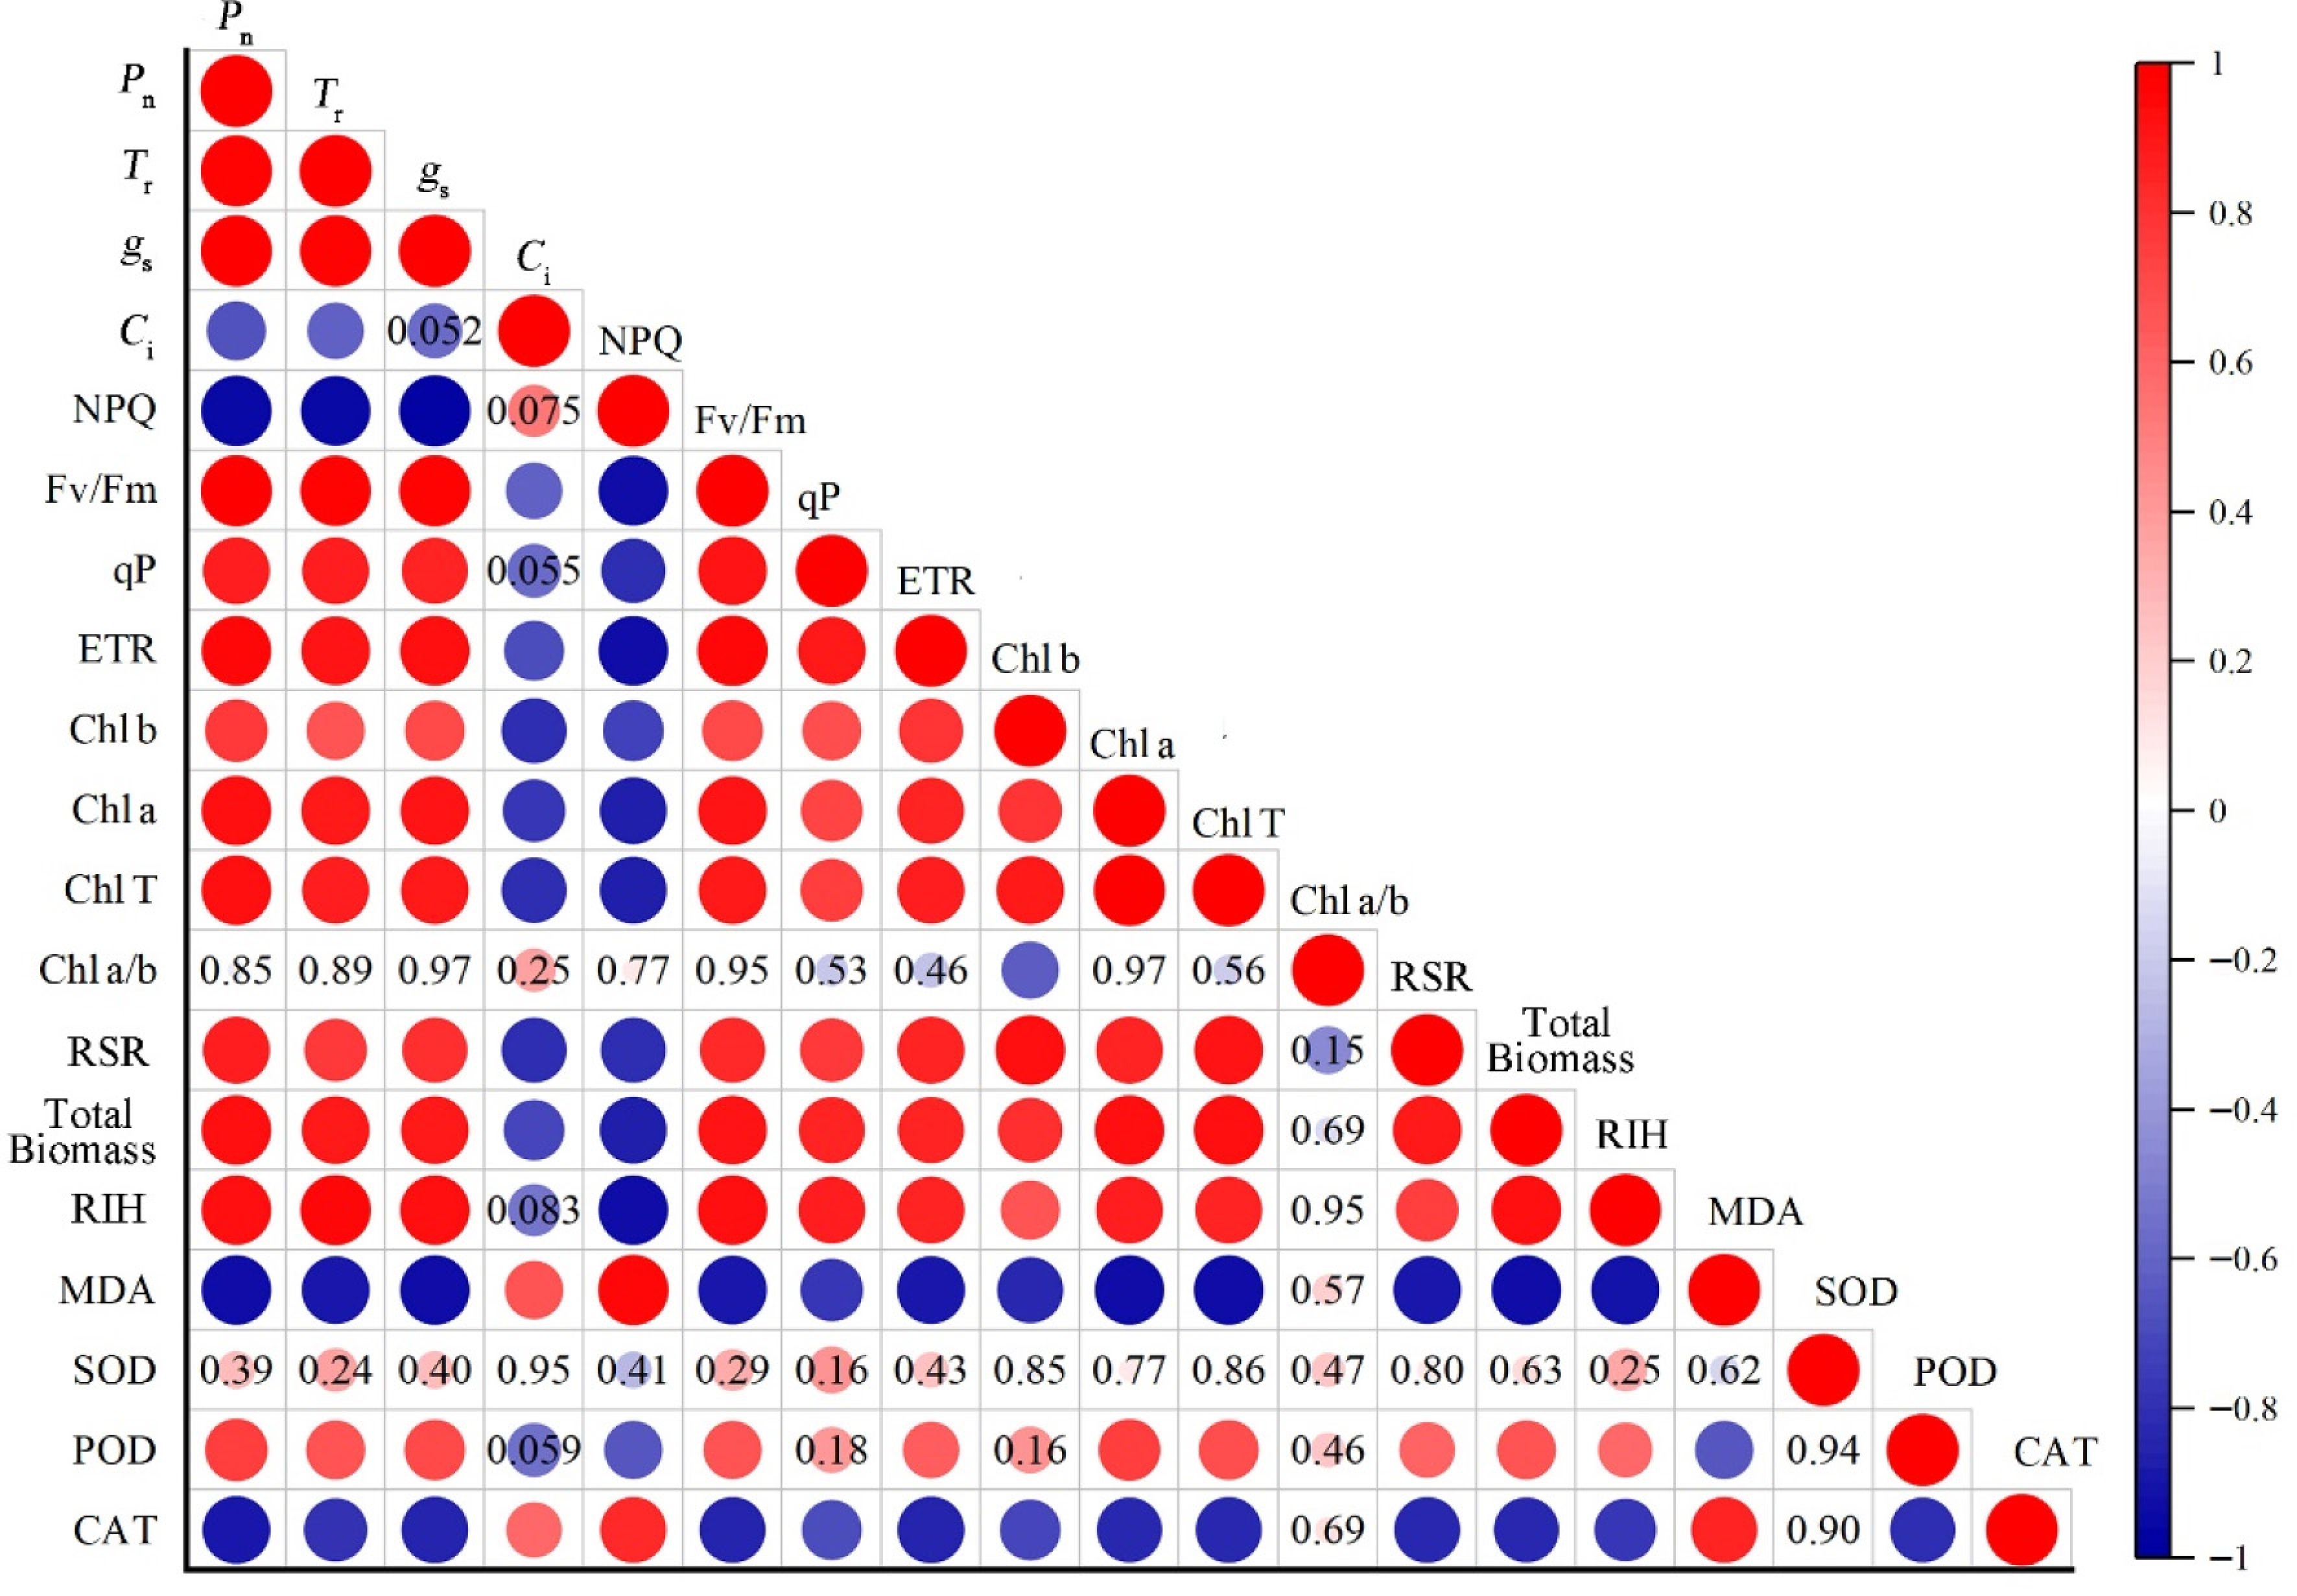
Figure 5.
Pearson's correlation analysis of growth and physiological indexes of Kentucky bluegrass. Pn: net photosynthetic rate; Tr: transpiration rate; gs: stomatal conductance; Ci: intercellular CO2 concentration; NPQ: non-photochemical quenching; Fv/Fm: maximum photochemical efficiency; qP: photochemical quenching; ETR: electron transport rate; Chl b: chlorophyll b; Chl a: chlorophyll a; Chl T: total chlorophyll; Chl a/b: chlorophyll a/b; RSR: root/shoot ratio; RIH: relative increase of plant height; MDA: malondialdehyde; SOD: superoxide dismutase; POD: peroxidase; CAT: catalase. The significance level is p < 0.05. The color scale represents the degree of correlation and the colored circles marked with numbers indicate non-significant correlations.
-
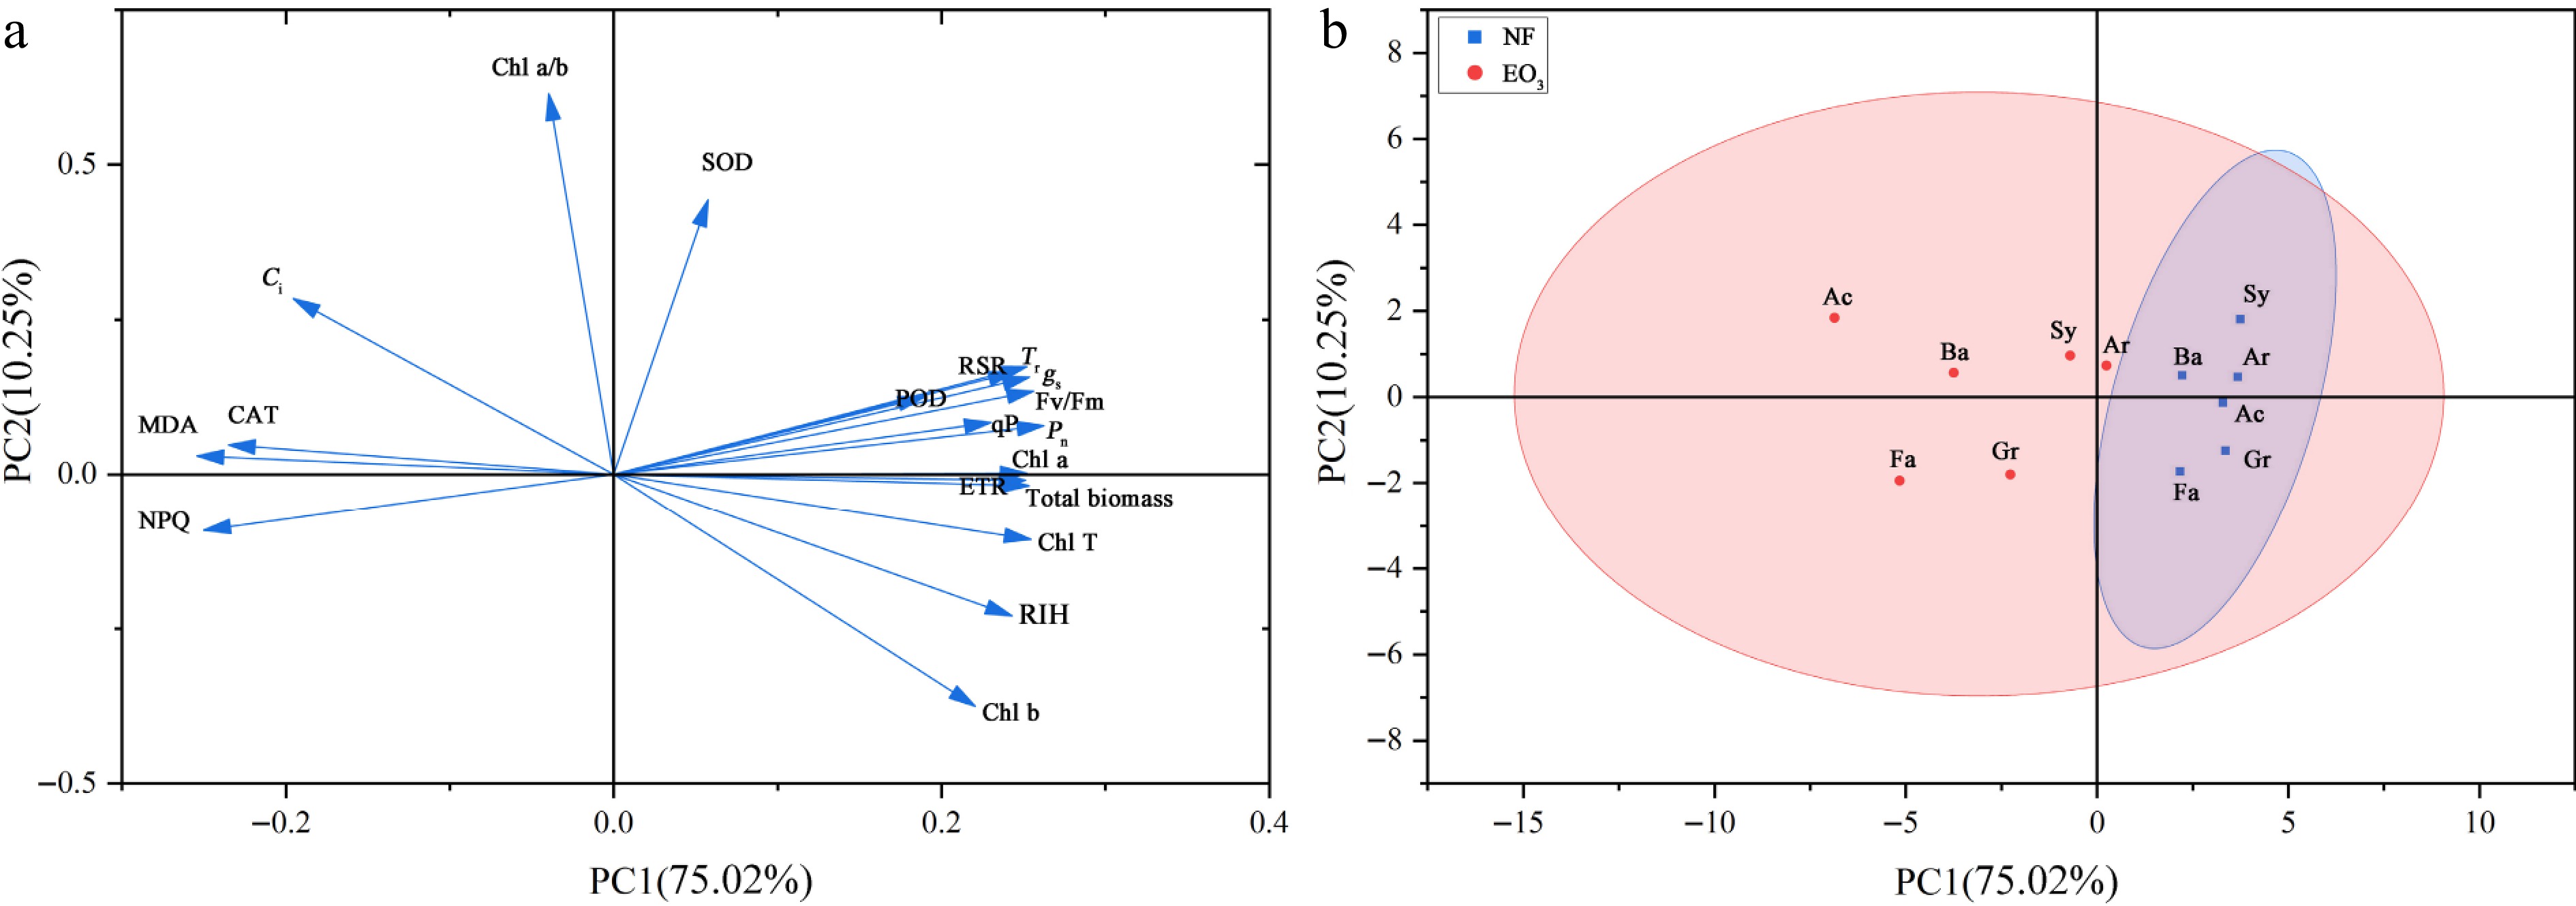
Figure 6.
Principal component analysis of the measured parameters. (a) Loading plot. (b) Score plot. Pn: net photosynthetic rate; Tr: transpiration rate; gs: stomatal conductance; Ci: intercellular CO2 concentration; NPQ: non-photochemical quenching; Fv/Fm: maximum photochemical efficiency; qP: photochemical quenching; ETR: electron transport rate; Chl b: chlorophyll b; Chl a: chlorophyll a; Chl T: total chlorophyll; Chl a/b: chlorophyll a/b; RSR: root/shoot ratio; RIH: relative increase of plant height; MDA: malondialdehyde; SOD: superoxide dismutase; POD: peroxidase; CAT: catalase. NF, non-filtered ambient air, as a control; EO3, non-filtered ambient air + 80 ppb O3. The name of cultivars are provided in Table 1.
-
Scientific name Abbreviation Origin Supplier Harvest year Poa pratensis L. 'Arcadia' Ar USA Beijing Zhengdao Seed Industry Co., Ltd. 2022 Poa pratensis L. 'Symphony' Sy USA Beijing Hemuqing Technology Co., Ltd. 2022 Poa pratensis L. 'Green wave' Gr USA Beijing Hemuqing Technology Co., Ltd. 2022 Poa pratensis L. 'Baron' Ba USA Beijing Zhengdao Seed Industry Co., Ltd. 2022 Poa pratensis L. 'Fargo' Fa USA Beijing Zhengdao Seed Industry Co., Ltd. 2022 Poa pratensis L. 'Action' Ac USA Beijing Zhengdao Seed Industry Co., Ltd. 2022 Table 1.
Kentucky bluegrass cultivars and their sources.
-
Cultivar Visible injury (%) Density Color Texture Uniformity Score Ar 23.09 ± 1.92 e 8 7 8 8 7.75 Sy 27.12 ± 1.59 de 7 7 7 8 7.25 Gr 31.30 ± 2.15 cd 6 6 7 8 6.75 Ba 33.45 ± 2.56 c 7 6 6 7 6.50 Fa 50.62 ± 2.72 b 5 5 4 5 4.75 Ac 57.08 ± 2.84 a 3 4 3 4 3.50 Different letters in the same column indicate significant differences (p < 0.05, Tukey test). Table 2.
Leaf visible injury and quality score of six Kentucky bluegrass cultivars.
-
Cultivar X (1) X (2) X (3) U (1) U (2) U (3) D Rank Ar 1.11 0.95 2.47 1.00 0.78 1.00 0.97 1 Sy 0.68 1.99 0.37 0.80 1.00 0.54 0.81 2 Gr 0.32 −2.39 1.75 0.64 0.05 0.84 0.59 3 Ba −0.33 0.76 −2.08 0.34 0.73 0.00 0.36 4 Fa −0.71 −2.64 −1.07 0.17 0.00 0.22 0.15 5 Ac −1.07 1.33 −1.44 0.00 0.86 0.14 0.11 6 Table 3.
Value of comprehensive indicator X (i), value of membership function U (i), comprehensive evaluation value D, and ranking of different cultivars of Kentucky bluegrass.
Figures
(6)
Tables
(3)