-
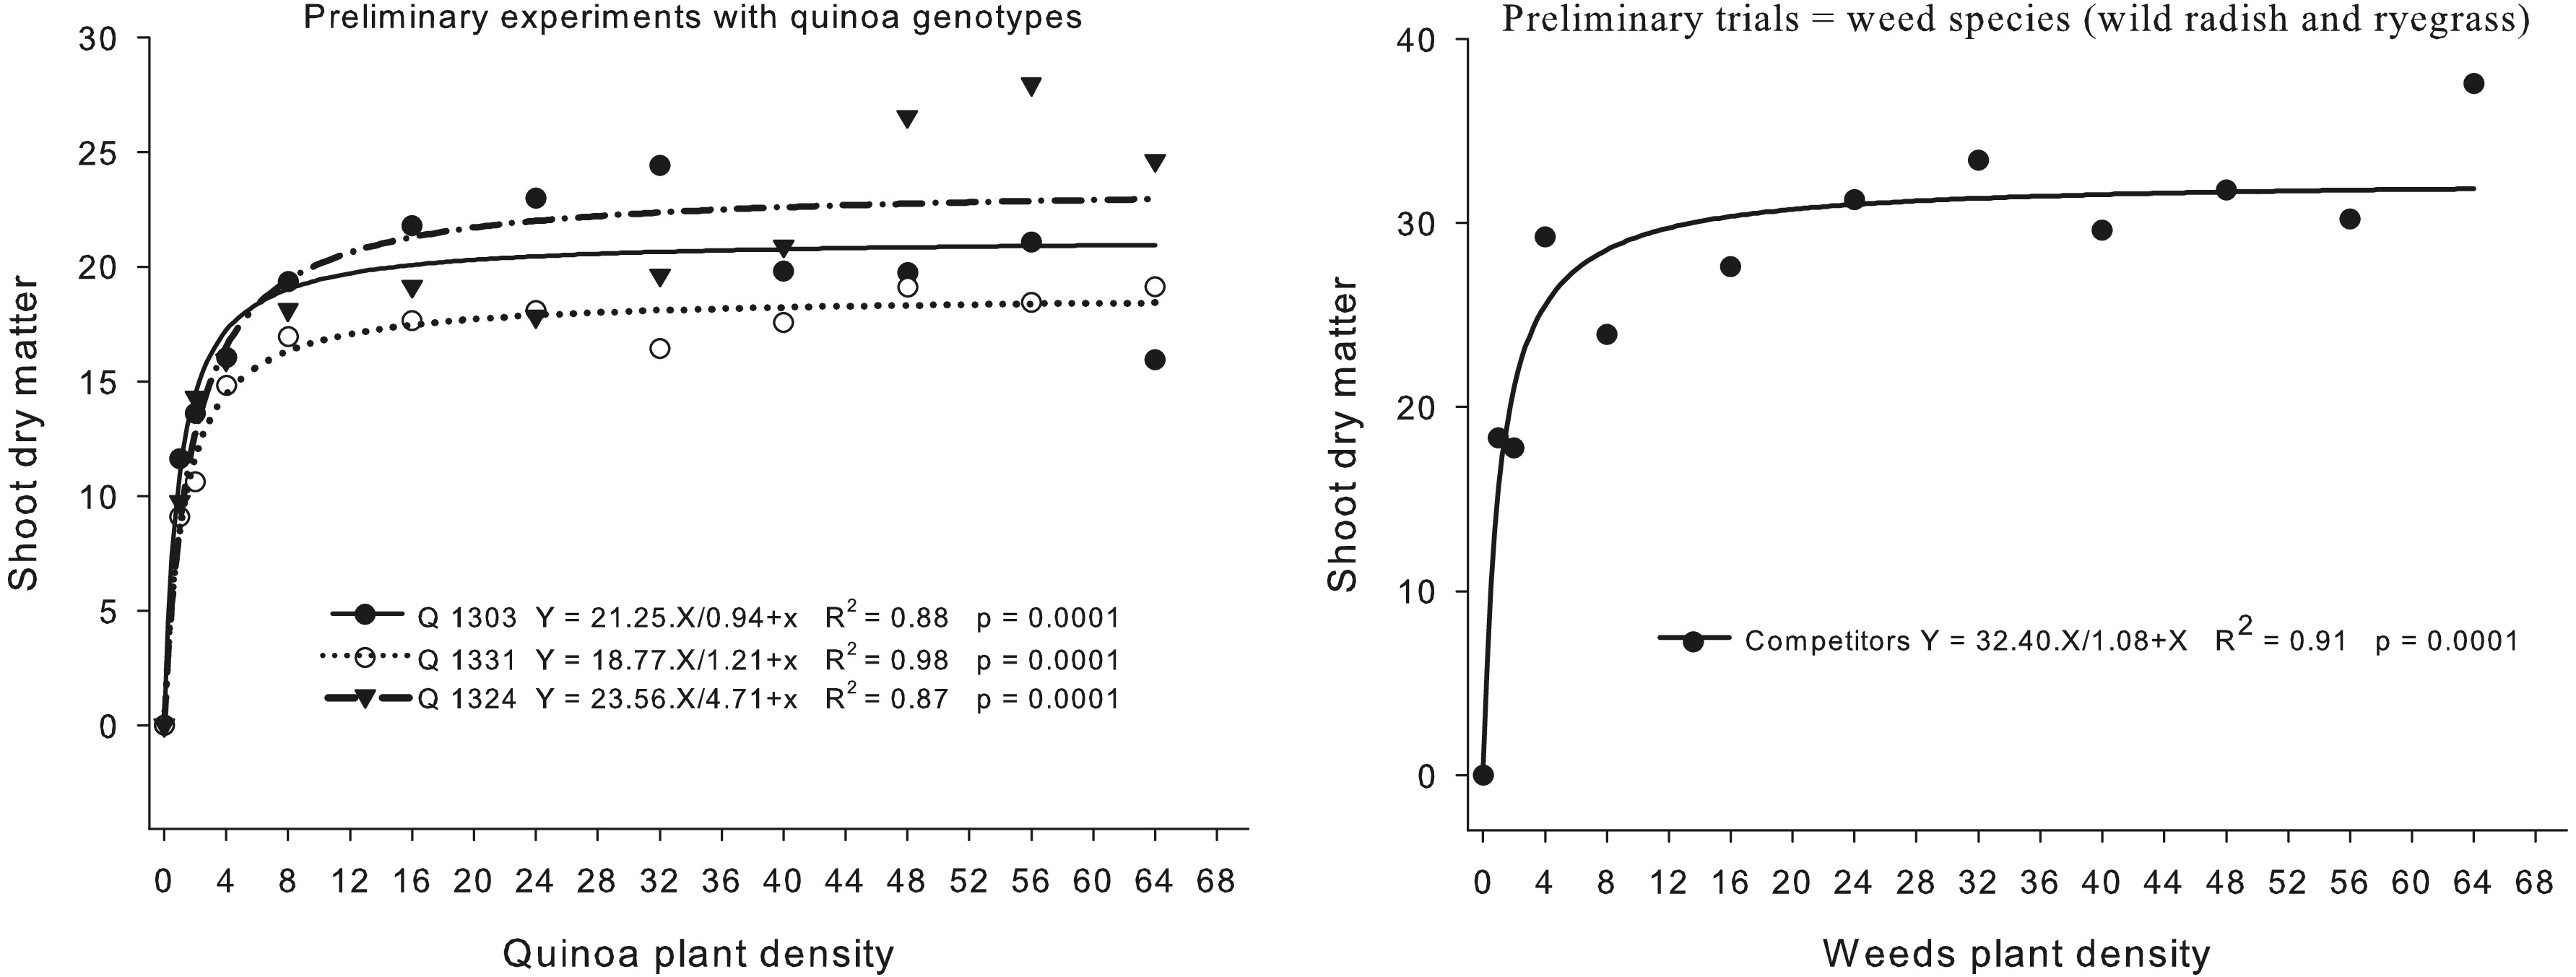
Figure 1.
Final shoot dry matter production of quinoa genotypes (Q 1303, Q 1331, and Q 1324) and weeds (wild radish and ryegrass) as a function of plant density per pot.
-
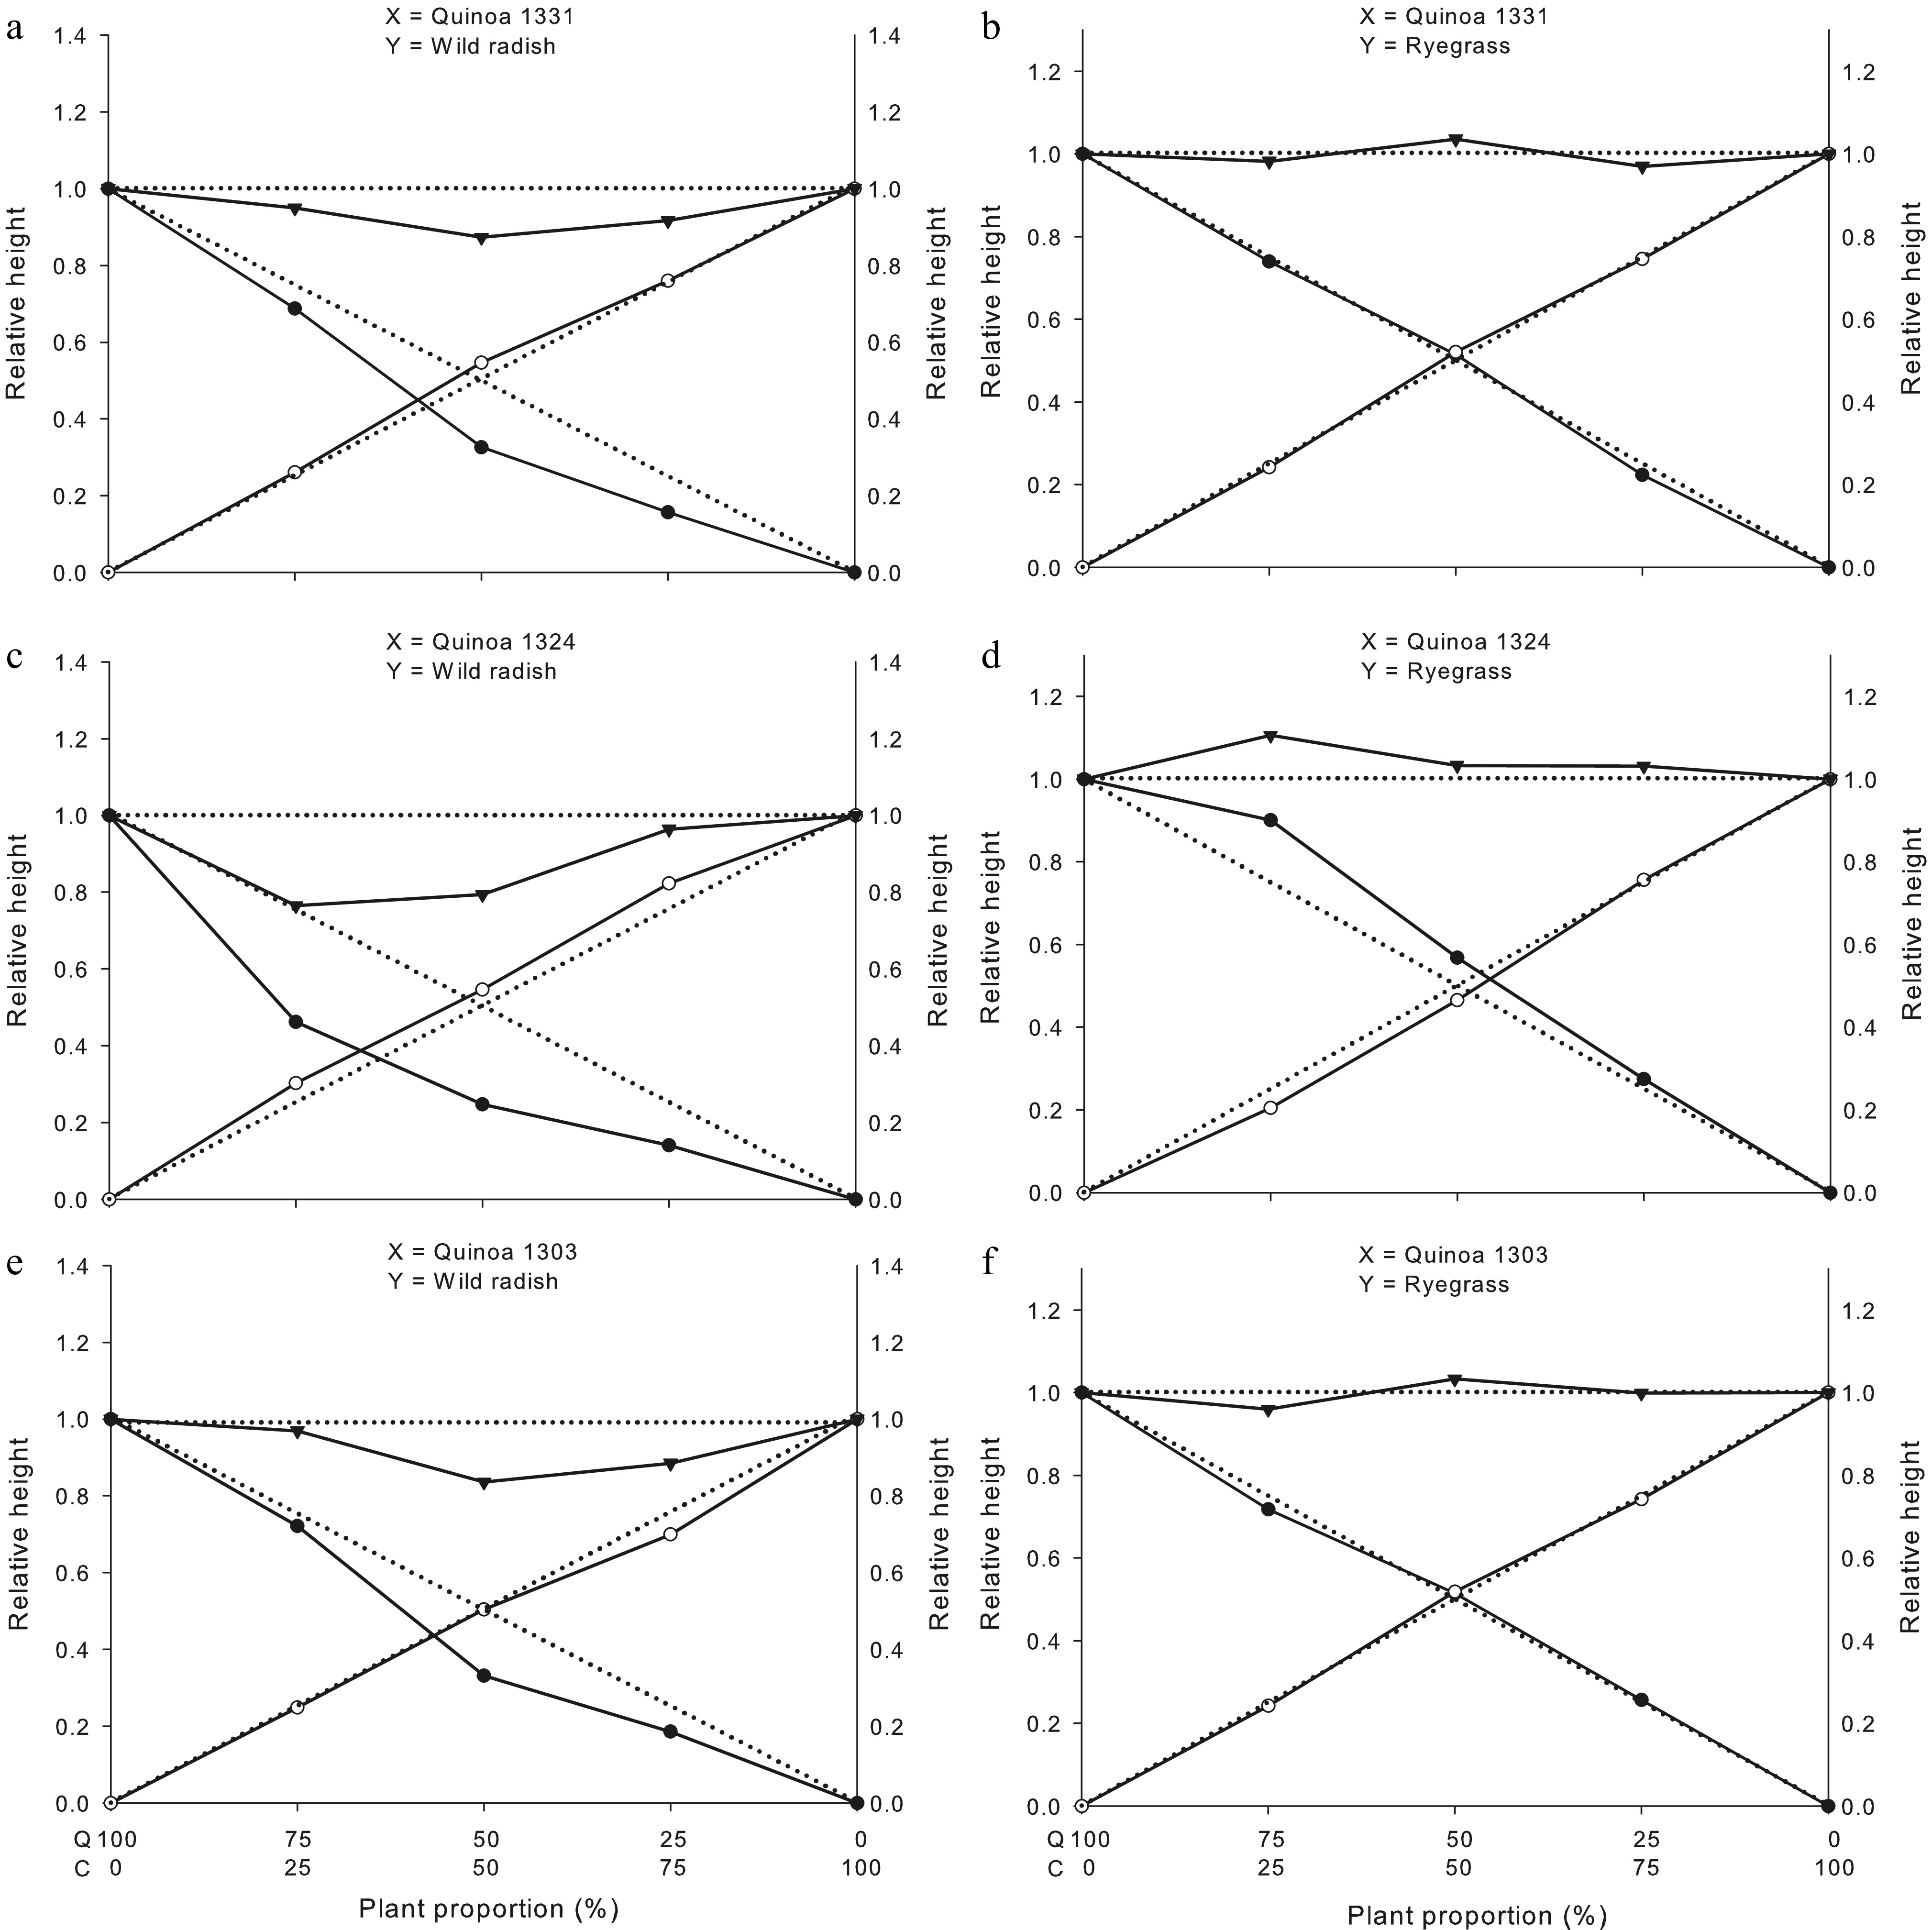
Figure 2.
Total relative productivity (TRP), and relative productivity (RP) for plant height of quinoa genotypes 1331, 1324, and 1303. Quinoa (●); wild radish (o: a, c and e) or ryegrass (o: b, d and f), and community (crop + weed) yields (▼). Dashed lines (- - -) represent the expected yields in the absence of interspecific competition, whereas solid lines (―) represent the observed values under interspecific competition. UFFS, Erechim, RS, Brazil. Q: quinoa and C: competitor.
-
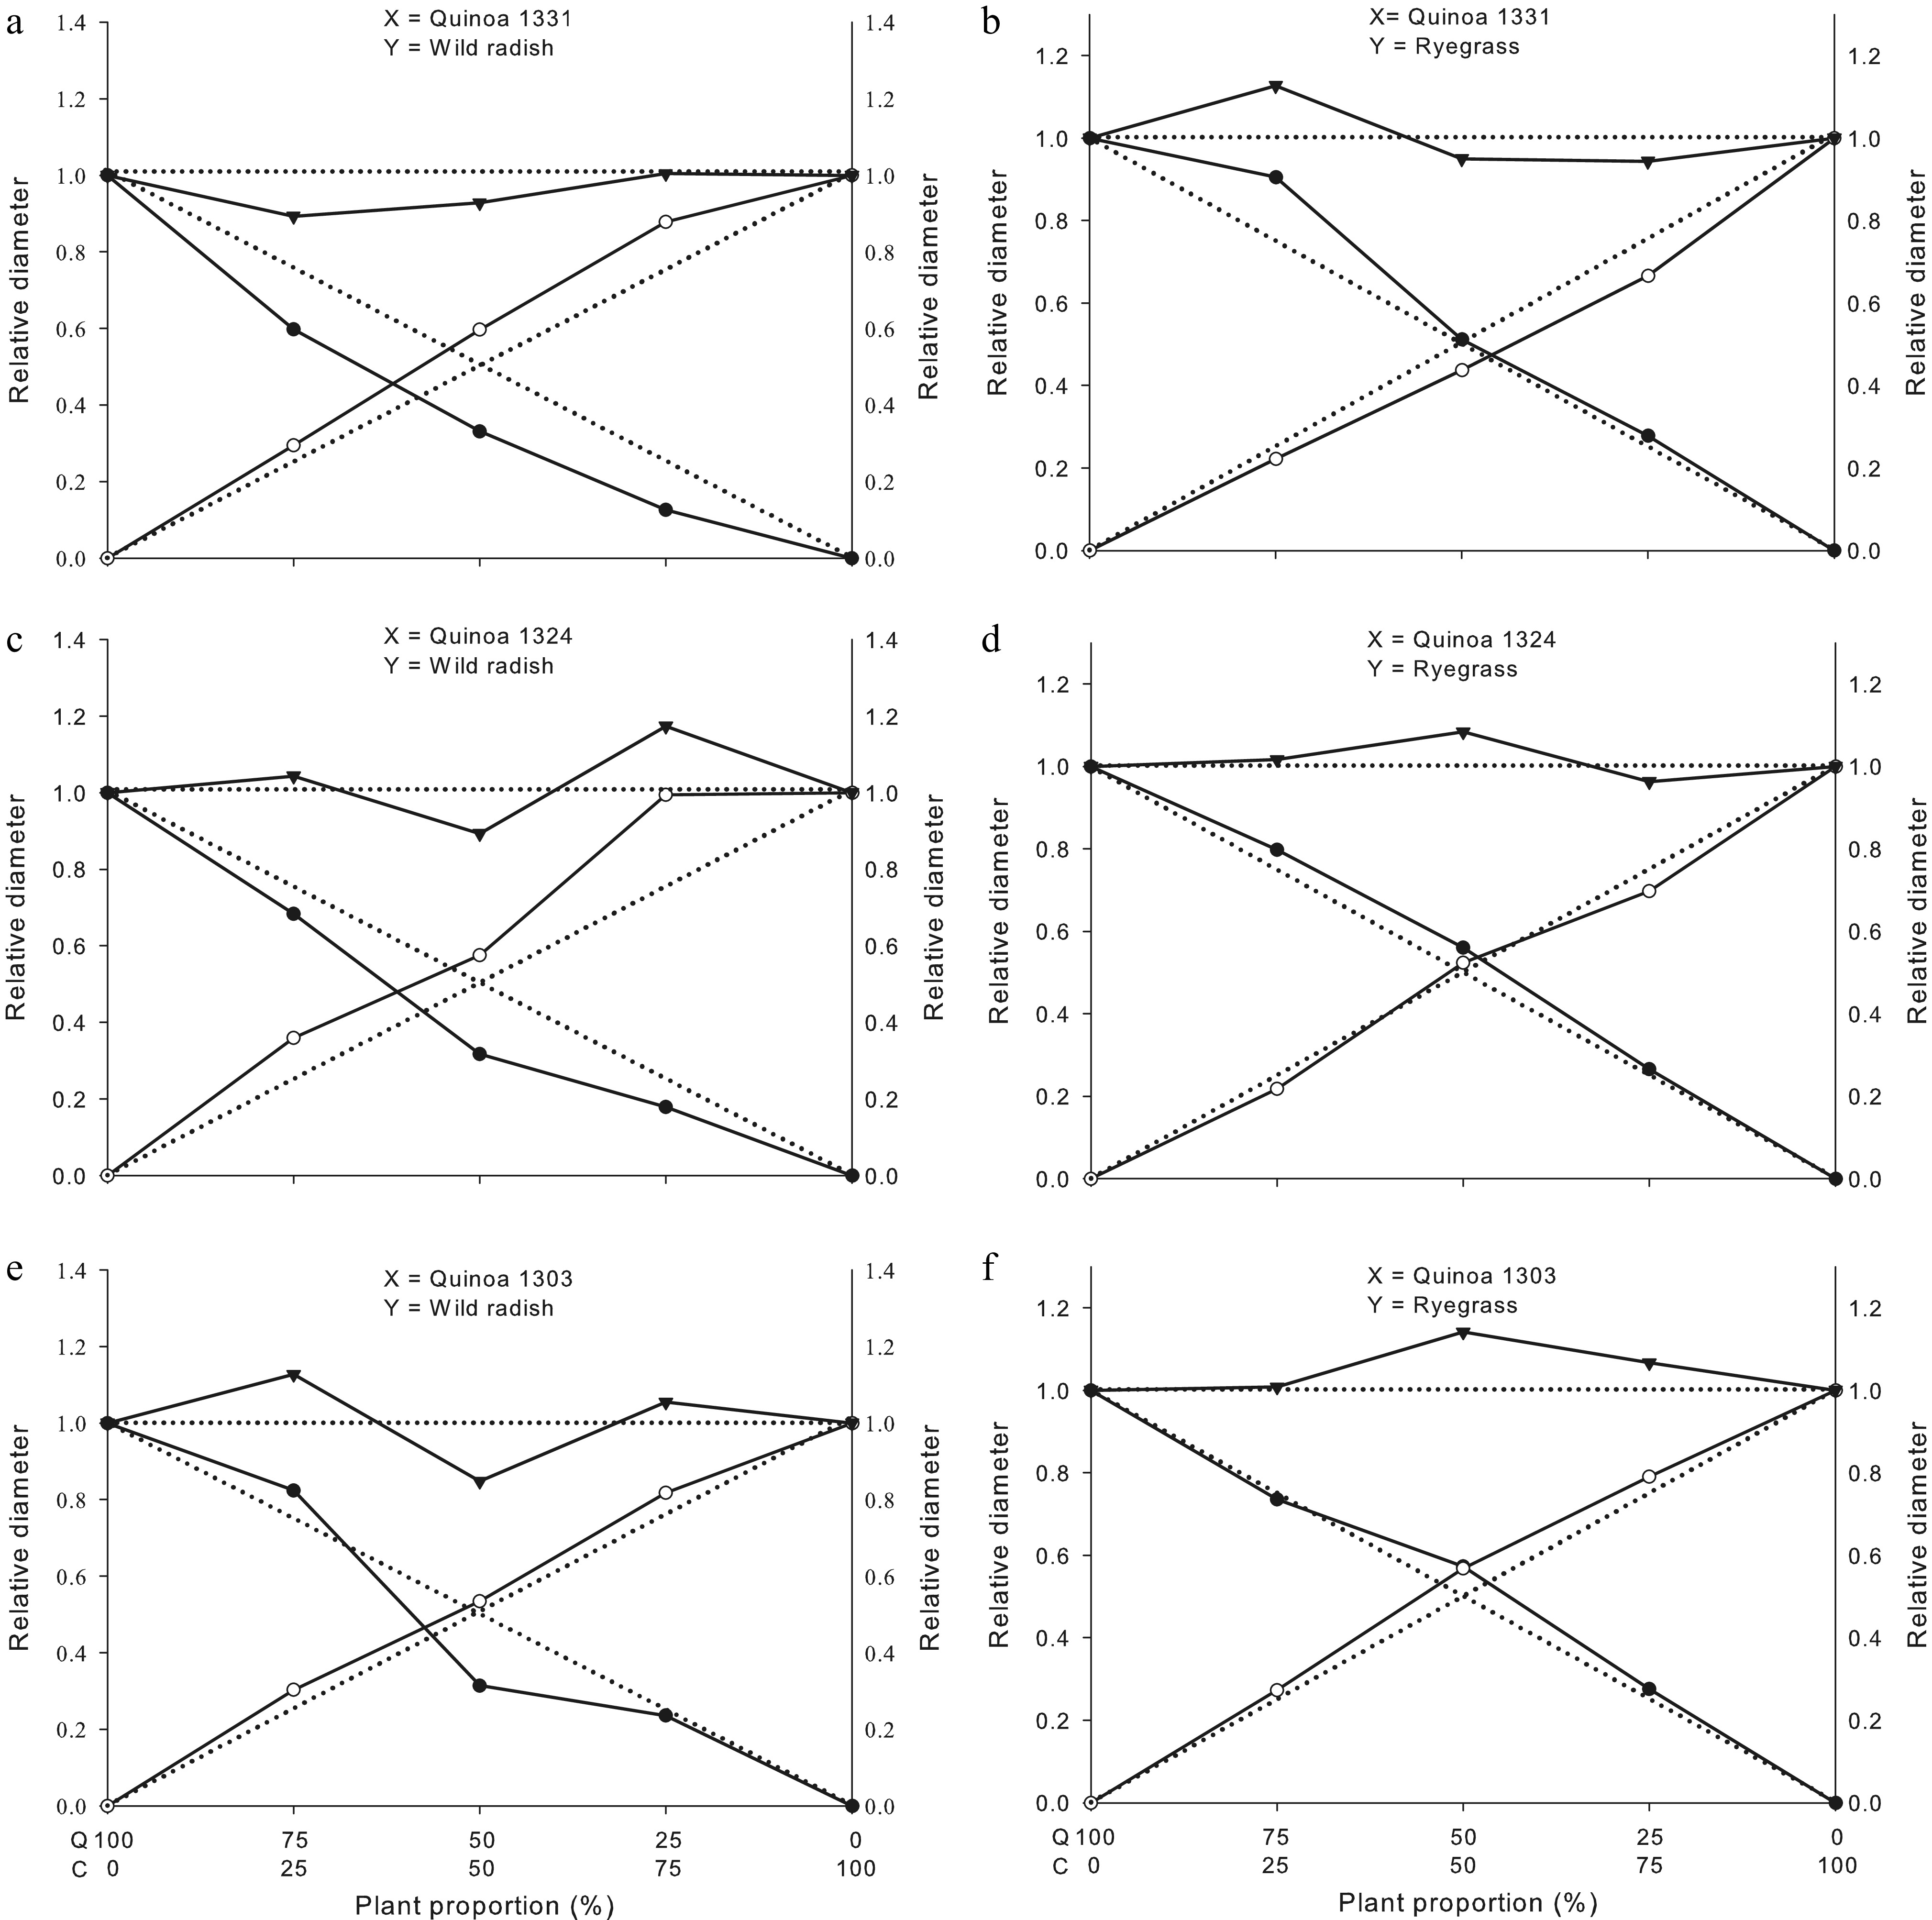
Figure 3.
Total relative productivity (TRP), and relative productivity (RP) for stem diameter of quinoa genotypes 1331, 1324, and 1303. Quinoa (●); wildradish (o: a, c and e) or ryegrass (o: b, d and f), and community (crop + weed) yields (▼). Dashed lines (- - -) represent the expected yields in the absence of interspecific competition, whereas solid lines (―) represent the observed values under interspecific competition. UFFS, Erechim, RS, Brazil. Q: quinoa and C: competitor.
-
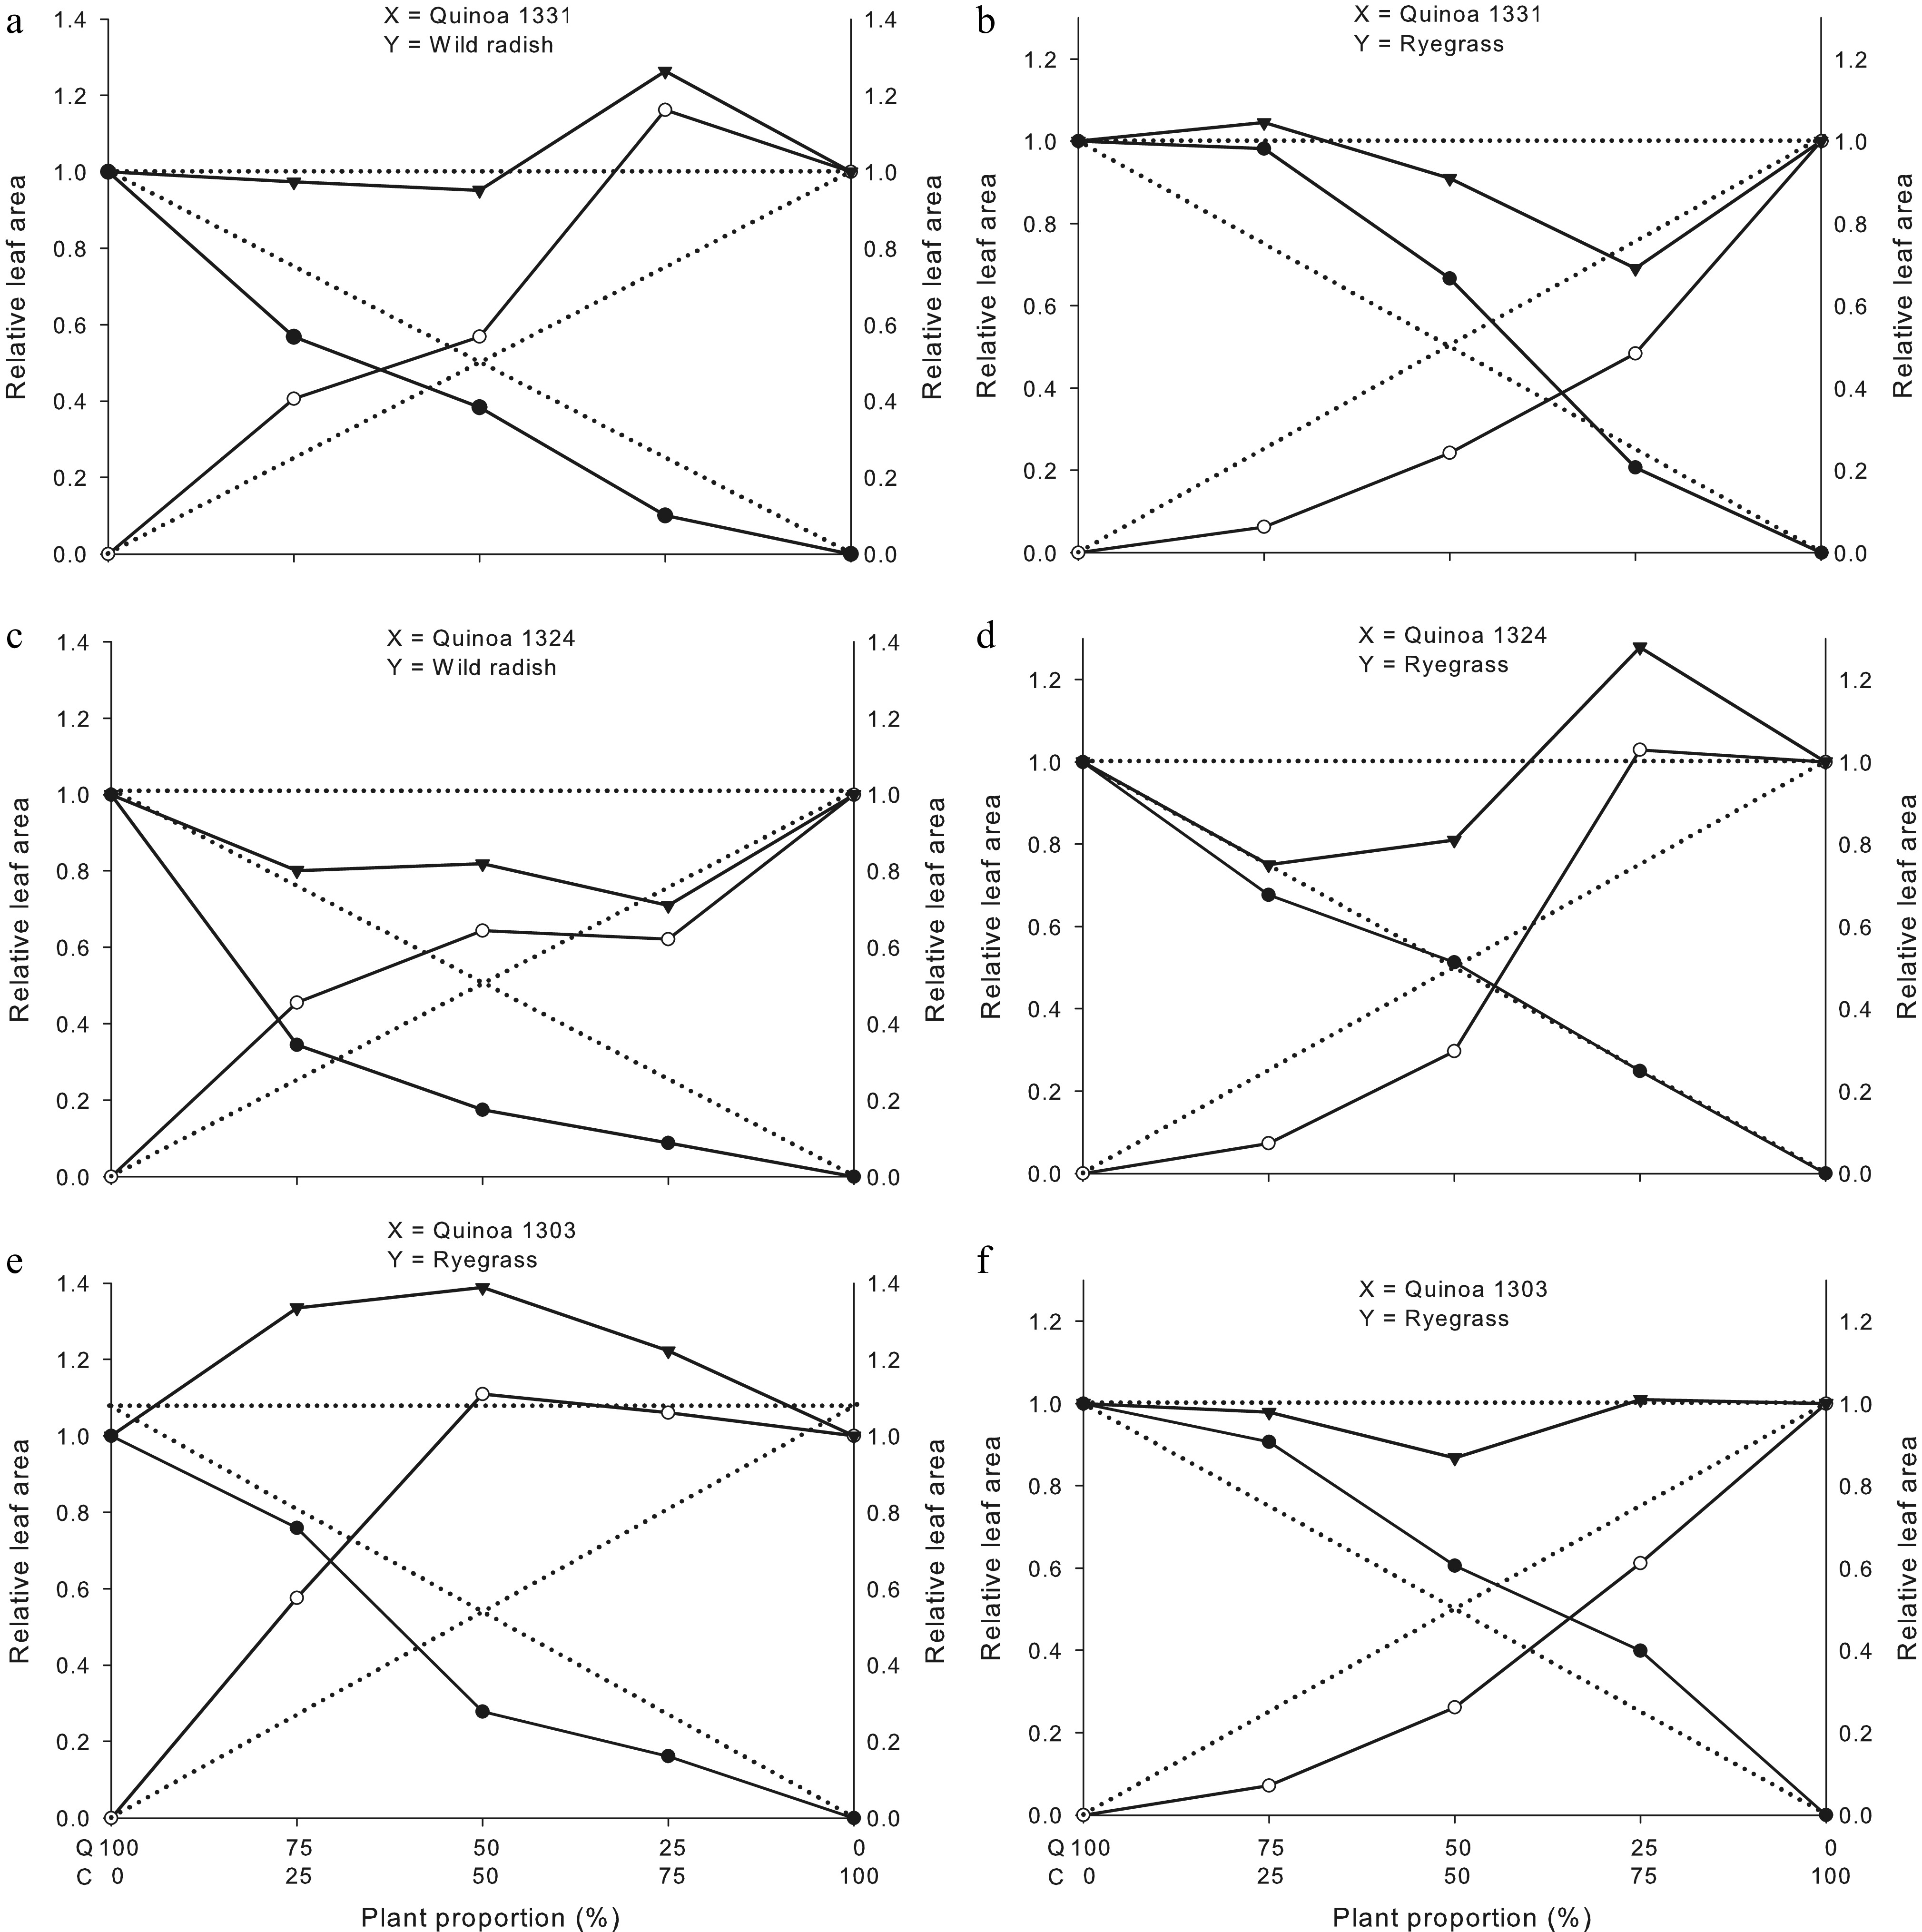
Figure 4.
Total relative productivity (TRP), and relative productivity (RP) for leaf area of quinoa genotypes 1331, 1324, and 1303. Quinoa (●); wild radish (o: a, c and e) or ryegrass (o: b, d and f), and community (crop + weed) yields (▼). Dashed lines (- - -) represent the expected yields in the absence of interspecific competition, whereas solid lines (―) represent the observed values under interspecific competition. UFFS, Erechim, RS, Brazil. Q: quinoa and C: competitor.
-
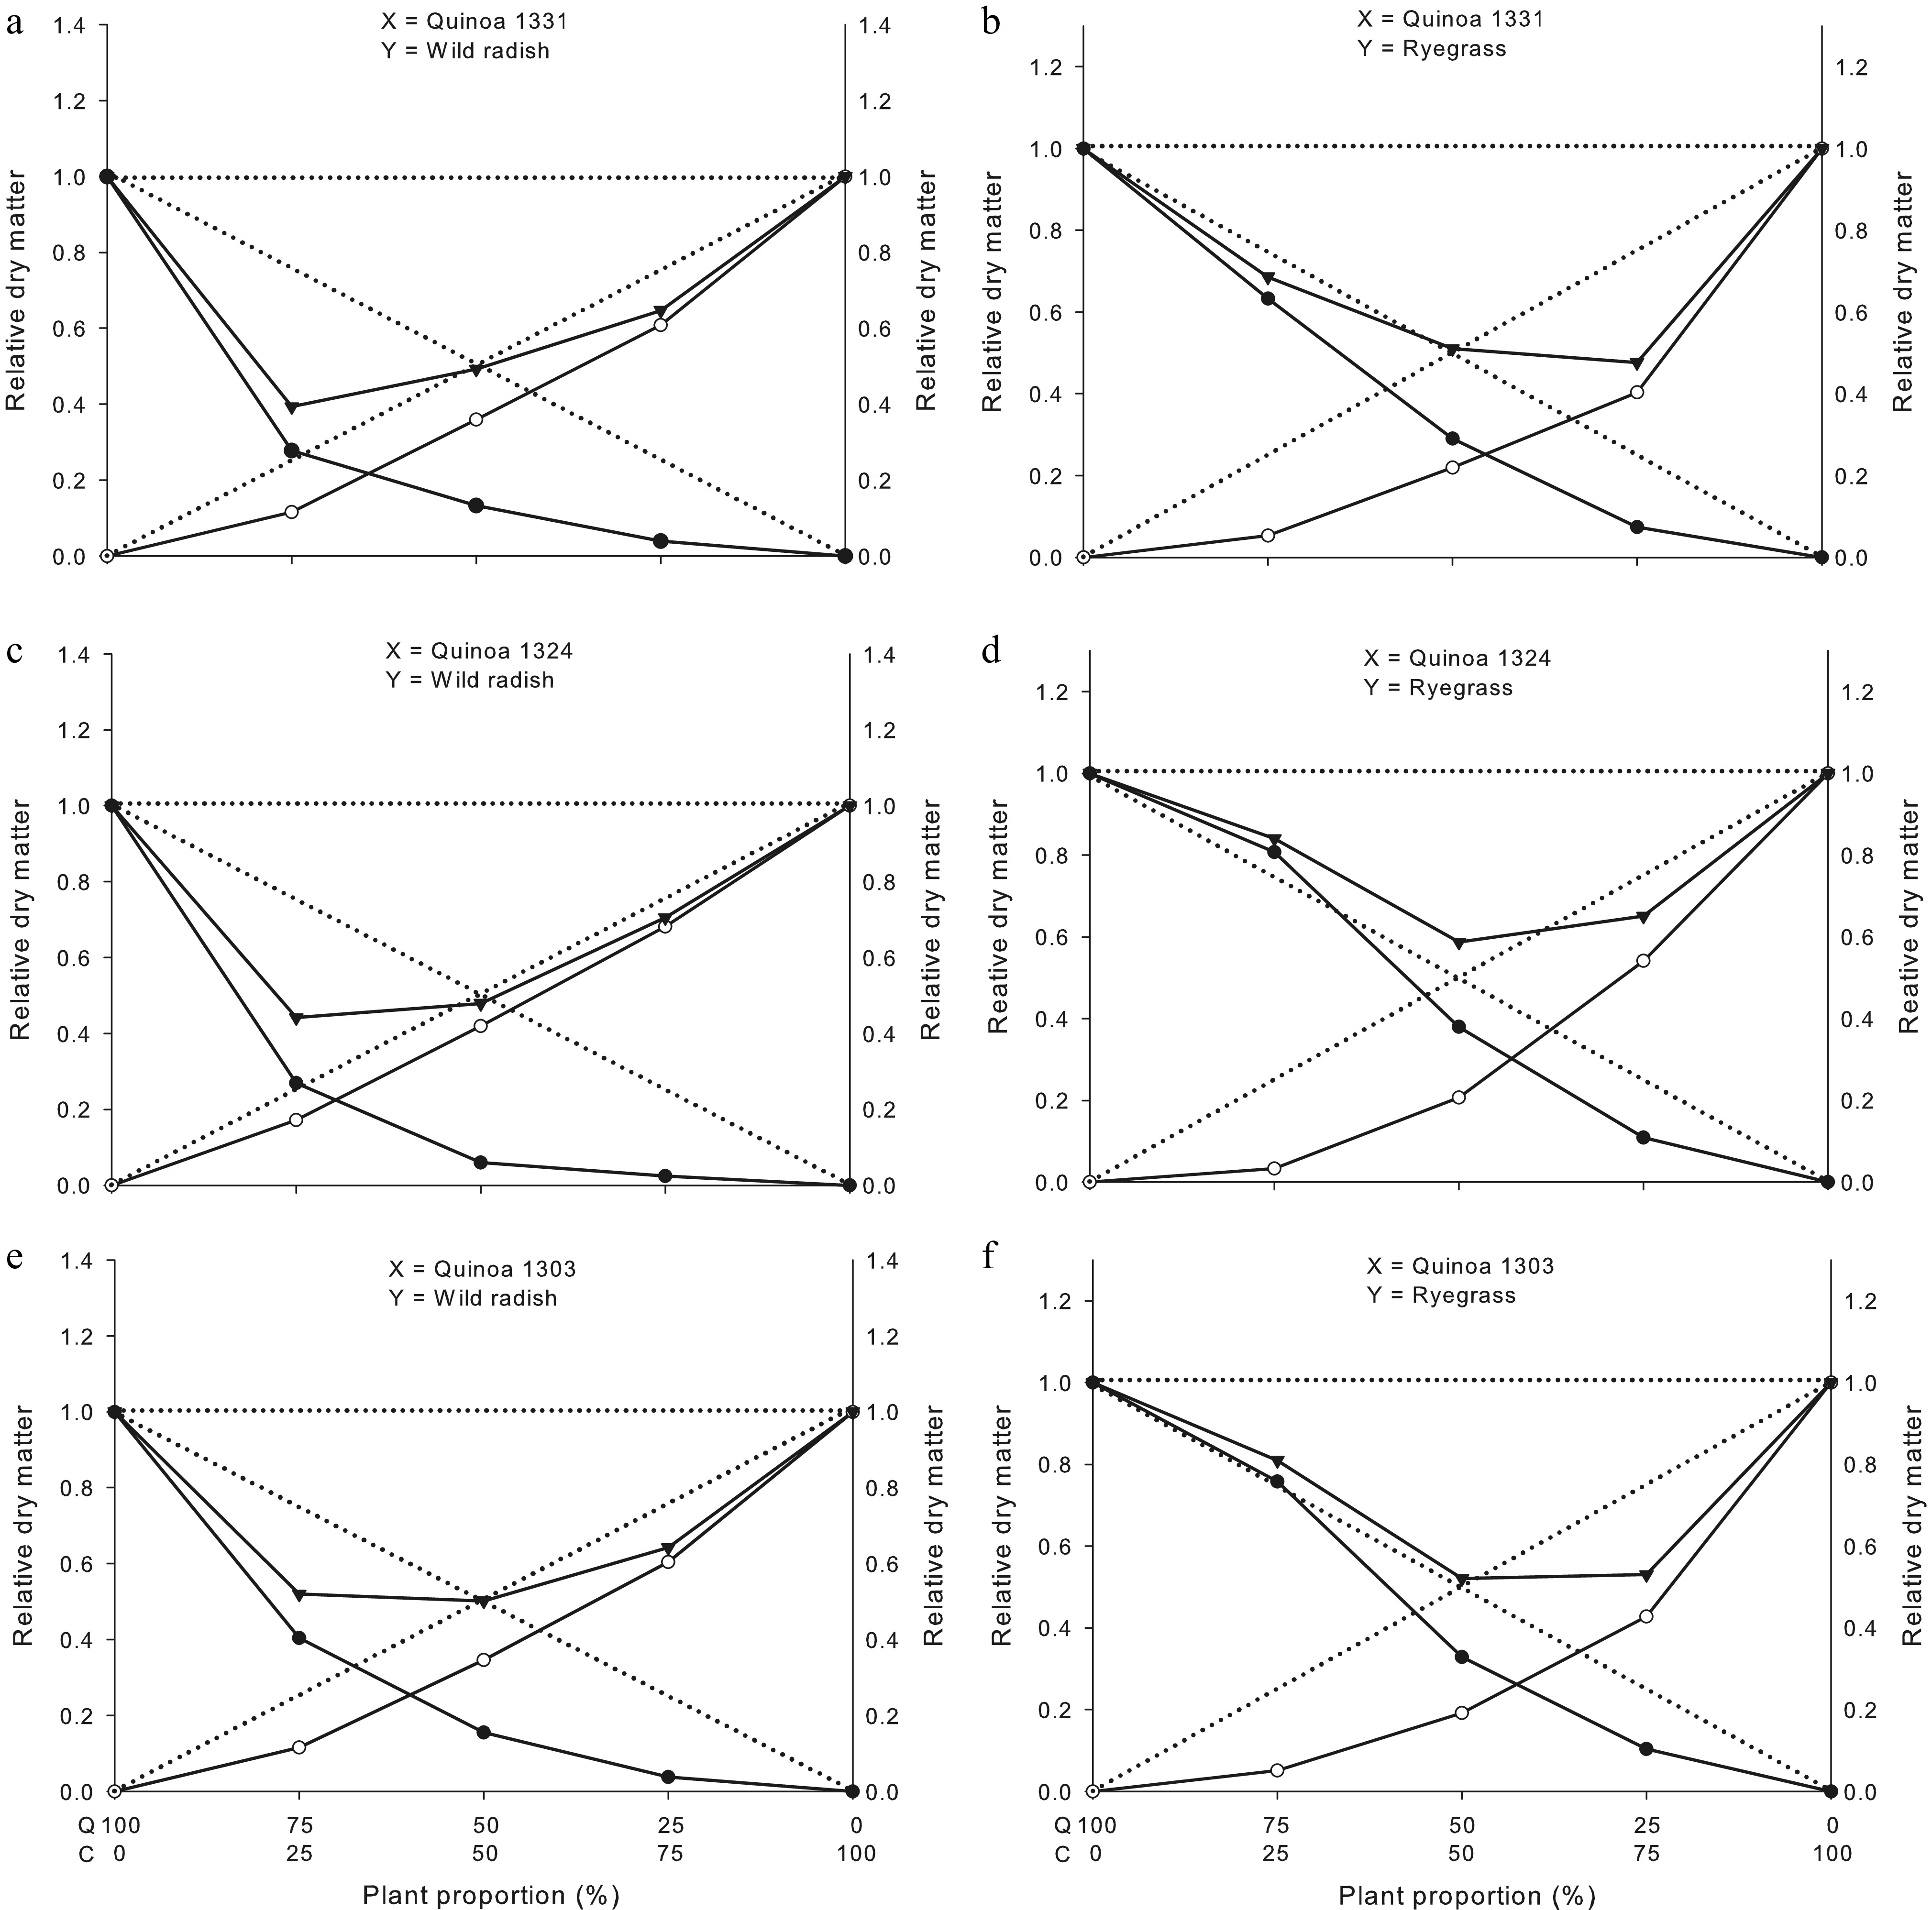
Figure 5.
Total relative productivity (TRP), and relative productivity (RP) for shoot dry matter of quinoa genotypes 1331, 1324, and 1303. Quinoa (●); wild radish (o: a, c and e) or ryegrass (o: b, d and f), and community (crop + weed) yields (▼). Dashed lines (- - -) represent the expected yields in the absence of interspecific competition, whereas solid lines (―) represent the observed values under interspecific competition. UFFS, Erechim, RS, Brazil. Q: quinoa and C: competitor.
-
Plant proportion (Quinoa : wild radish) PH (cm) SD (mm) NL CI (SPAD) LA (cm2·pot−1) SDM (g·pot−1) Genotype 1331 100:0 (C) 65.84 8.19 56.25 58.11 1008.45 77.41 75:25 60.42 6.52 47.25 56.44 763.05* 28.70* 50:50 42.97* 5.42* 38.00* 50.00* 773.11* 20.55* 25:75 41.15* 4.13* 36.75* 46.26* 407.86* 12.02* CV (%) 5.95 16.99 10.67 6.54 10.87 16.06 Wild radish 0:100 (C) 72.62 8.22 24.75 45.28 1,035.34 91.68 25:75 73.63 9.62 27.00 46.61 1,603.86* 74.37* 50:50 79.39 9.81* 25.50 42.94 1,178.12 65.95* 75:25 75.80 9.70 28.00 43.64 1,681.76* 42.36* CV (%) 5.20 6.64 8.52 5.03 10.96 6.03 Genotype 1324 100:0 (C) 67.16 6.84 62.00 60.98 1,241.30 73.18 75:25 41.35* 6.23 37.00* 59.15 570.71* 26.29* 50:50 33.18* 4.34* 36.25* 48.31* 435.48* 8.76* 25:75 37.85* 4.91* 32.50* 51.93* 437.80* 6.99* CV (%) 9.02 11.16 5.85 5.44 16.53 8.68 Wild radish 0:100 (T) 75.24 7.67 20.25 43.69 846.08 82.42 25:75 82.55* 10.17 23.50 39.54 700.88 74.83* 50:50 82.23* 8.82 26.00* 43.73 1,088.85 69.10* 75:25 91.20* 11.03* 36.51* 37.43* 1,542.49* 56.69* CV (%) 4.34 14.34 10.14 7.58 18.79 5.47 Genotype 1303 100:0 (C) 71.11 6.11 52.00 59.94 853.00 68.22 75:25 68.34 6.71 43.25* 58.25 863.07 36.75* 50:50 47.10* 3.84* 35.75* 49.25* 475.62* 21.23* 25:75 52.88* 5.77 41.50* 51.99* 552.26* 10.41* CV (%) 9.83 7.21 6.34 6.12 11.88 10.95 Wild radish 0:100 (C) 81.86 8.16 20.00 34.46 648.72 85.92 25:75 76.35* 8.90 22.00 45.95* 917.49* 69.20* 50:50 82.61 8.72 26.75 39.69* 1,438.82* 59.51* 75:25 81.29 9.89* 25.00 41.40* 1,495.88* 39.86* CV (%) 3.39 7.46 16.92 5.64 6.93 5.55 * Mean differs from the respective control (C) by Dunnett's (p ≤ 0.05). Table 1.
Differences in plant height (PH), stem diameter (SD), leaf area (LA), number of leaves (NL), chlorophyll index (CI), and shoot dry matter (SDM) of quinoa genotypes 1331, 1324, and 1303 under competition and in the absence of competition (C, control) with wild radish. UFFS, Erechim, RS, Brazil.
-
Plant proportion (Quinoa : ryegrass) Plant height (cm) Stem diameter (mm) Number of leaves/tillers Chlorophyll index (SPAD) Leaf area
(cm2·pot−1)Dry mass
(g·pot−1)Genotype 1331 100:0 (C) 30.11 4.52 54.19 49.74 371.64 18.18 75:25 29.70 5.46* 65.25* 56.11* 486.73 15.33* 50:50 31.04 4.63 56.44 54.51* 495.49 10.57* 25:75 26.95 5.02* 43.44* 57.27* 307.85 5.35* CV (%) 5.87 5.09 4.98 3.58 16.34 5.95 Ryegrass 0:100 (C) 44.95 2.13 14.88 43.63 2,125.67 17.99 25:75 44.73 1.89 13.19 41.30 1,371.26* 9.68* 50:50 46.85* 1.86 10.56* 43.14 1,031.97* 7.91* 75:25 43.58 1.89 13.13 45.28 535.78* 3.81* CV (%) 2.64 10.76 11.82 3.67 12.82 9.02 Genotype 1324 100:0 (C) 27.05 4.66 50.50 57.15 433.53 14.34 75:25 32.50* 4.96 42.25* 59.08* 391.13 15.44 50:50 30.72* 5.22* 52.19 56.10 444.70 10.89* 25:75 29.73 4.96 44.63* 54.92* 431.57 6.24* CV (%) 4.15 3.65 6.30 1.53 9.90 7.08 Ryegrass 0:100 (C) 47.77 1.89 17.38 43.89 1,361.84 17.27 25:75 48.21 1.76 17.00 44.99 1,870.01* 12.47* 50:50 44.44 1.98 15.06* 43.62 809.19* 7.16* 75:25 39.19* 1.65 9.25* 40.73 398.93* 2.27* CV (%) 5.36 7.60 7.96 4.05 3.67 3.71 Genotype 1303 100:0 (C) 29.78 4.66 52.25 56.27 283.56 15.30 75:25 28.49 4.57 54.13 54.75 342.82* 15.47 50:50 30.66 5.34* 54.25 53.53 343.93* 10.60* 25:75 30.53 5.15* 49.56 50.49* 452.08* 6.32* CV (%) 3.39 4.31 10.18 5.12 7.00 3.72 Ryegrass 0:100 (C) 43.53 1.79 14.34 43.68 2,190.73 19.12 25:75 46.49 1.88 15.00 42.23 1,785.58* 10.89* 50:50 44.41 2.03 12.18 35.74* 1,145.49* 7.34* 75:25 44.85 1.95 13.25 43.10 626.78* 3.94* CV (%) 3.30 6.66 9.92 4.31 8.07 8.45 * Mean differs from the respective control (C) by Dunnett's (p ≤ 0.05). Table 2.
Differences in plant height, stem diameter, leaf area, number of leaves, chlorophyll index, and shoot dry matter of quinoa genotypes 1331, 1324, and 1303 under competition and in the absence of competition (C, control) with ryegrass. UFFS, Erechim, RS, Brazil.
-
Genotype and species RC Kx (quinoa) Ky (wild radish) AG Plant height Quinoa 1331 × Wild radish 0.60 (± 0.02)* 0.49 (± 0.02)* 1.21 (± 0.04)* −0.22 (± 0.01)* Quinoa 1324 × Wild radish 0.45 (± 0.01)* 0.33 (± 0.01)* 1.20 (± 0.007)* −0.30 (± 0.01)* Quinoa 1303 × Wild radish 0.66 (± 0.03)* 0.50 (± 0.04)* 1.02 (± 0.02)* −0.17 (± 0.01)* Stem diameter Quinoa 1331 × Wild radish 0.56 (± 0.07)* 0.51 (± 0.09)* 1.51 (± 0.17)* −0.27 (± 0.04)* Quinoa 1324 × Wild radish 0.56 (± 0.03)* 0.47 (± 0.009)* 1.38 (± 0.13)* −0.26 (± 0.03)* Quinoa 1303 × Wild radish 0.59 (± 0.06)* 0.46 (± 0.05)* 1.15 (± 0.05)* −0.22 (± 0.06)* Number of leaves Quinoa 1331 × Wild radish 0.65 (± 0.06)* 0.53 (± 0.08)* 1.06 (± 0.02)* −0.18 (± 0.03)* Quinoa 1324 × Wild radish 0.46 (± 0.01)* 0.41 (± 0.01)* 1.80 (± 0.08)* −0.35 (± 0.01)* Quinoa 1303 × Wild radish 0.55 (± 0.09)* 0.52 (± 0.02) 2.94 (± 1.14)* −0.33 (± 0.01)* Chlorophyll index Quinoa 1331 × Wild radish 0.91 (± 0.06) 0.76 (± 0.07) 0.90 (± 0.03) −0.04 (± 0.03) Quinoa 1324 × Wild radish 0.80 (± 0.04)* 0.66 (± 0.03)* 1.01 (± 0.06)* −0.10 (± 0.02)* Quinoa 1303 × Wild radish 0.72 (± 0.03)* 0.70 (± 0.01)* 1.38 (± 0.12)* −0.17 (± 0.02)* Leaf area Quinoa 1331 × Wild radish 0.57 (± 0.04)* 0.20 (± 0.01)* 0.41 (± 0.01)* −0.13 (± 0.02)* Quinoa 1324 × Wild radish 0.44 (± 0.05)* 0.25 (± 0.01)* 0.87 (± 0.01)* −0.26 (± 0.04)* Quinoa 1303 × Wild radish 1.01 (± 0.11)* 0.26 (± 0.02) 0.26 (± 0.02) −0.002 (± 0.02)* Shoot dry matter Quinoa 1331 × Wild radish 0.37 (± 0.05)* 0.15 (± 0.02)* 0.56 (± 0.03)* −0.23 (± 0.03)* Quinoa 1324 × Wild radish 0.14 (± 0.01)* 0.06 (± 0.005)* 0.72 (± 0.03)* −0.36 (± 0.01)* Quinoa 1303 × Wild radish 0.45 (± 0.02)* 0.18 (± 0.01)* 0.53 (± 0.02)* −0.19 (± 0.01)* * Significant difference by the t-test (p ≤ 0.05). Values between brackets are the standard error mean. Table 3.
Competitiveness indices between quinoa genotypes and wild radish expressed by relative competitiveness (RC), relative crowding coefficient (K), and aggressiveness (AG) in replacement series experiments. UFFS, Erechim, RS, Brazil.
-
Genotype and species RC Kx (quinoa) Ky (ryegrass) AG Plant height Quinoa 1331 × Ryegrass 0.99 (± 0.02) 1.07 (± 0.05)* 1.09 (± 0.02) −0.01 (± 0.01) Quinoa 1324 × Ryegrass 1.22 (± 0.02)* 1.32 (± 0.05)* 0.87 (± 0.03)* 0.10 (± 0.01)* Quinoa 1303 × Ryegrass 0.99 (± 0.02) 1.06 (± 0.04) 1.08 (± 0.01) −0.001 (± 0.01) Stem diameter Quinoa 1331 × Ryegrass 1.19 (± 0.10) 1.05 (± 0.02)* 0.79 (± 0.1) 0.07 (± 0.03) Quinoa 1324 × Ryegrass 1.07 (± 0.02)* 1.28 (± 0.09) 1.11 (± 0.01) 0.04 (± 0.01)* Quinoa 1303 × Ryegrass 1.01 (± 0.03) 1.35 (± 0.06) 1.32 (± 0.05) 0.01 (± 0.02) Number of leaves/tillers Quinoa 1331 × Ryegrass 1.54 (± 0.22) 1.10 (± 0.09)* 0.57 (± 0.1)* 0.17 (± 0.06) Quinoa 1324 × Ryegrass 1.19 (± 0.04)* 1.08 (± 0.1)* 0.77 (± 0.06)* 0.08 (± 0.02)* Quinoa 1303 × Ryegrass 1.23 (± 0.06)* 1.08 (± 0.04)* 0.74 (± 0.04)* 0.10 (± 0.02)* Chlorophyll index Quinoa 1331 × Ryegrass 1.11 (± 0.01)* 1.21 (± 0.04)* 0.98 (± 0.03)* 0.05 (± 0.01)* Quinoa 1324 × Ryegrass 0.99 (± 0.01) 0.96 (± 0.001)* 0.99 (± 0.01) −0.01 (± 0.001) Quinoa 1303 × Ryegrass 1.16 (± 0.03)* 0.91 (± 0.02)* 0.69 (± 0.03)* 0.07 (± 0.01)* Leaf area Quinoa 1331 × Ryegrass 2.85 (± 0.38)* 2.12 (± 0.34)* 0.33 (± 0.05)* 0.42 (± 0.04)* Quinoa 1324 × Ryegrass 1.73 (± 0.06)* 1.06 (± 0.08)* 0.42 (± 0.002)* 0.22 (± 0.02)* Quinoa 1303 × Ryegrass 2.33 (± 0.10)* 1.58 (± 0.19)* 0.36 (± 0.03)* 0.34 (± 0.02)* Shoot dry matter Quinoa 1331 × Ryegrass 1.34 (± 0.12) 0.41 (± 0.03)* 0.28 (± 0.02)* 0.07 (± 0.02) Quinoa 1324 × Ryegrass 1.83 (± 0.06)* 0.62 (± 0.04)* 0.26 (± 0.004)* 0.17 (± 0.01)* Quinoa 1303 × Ryegrass 1.72 (± 0.09)* 0.49 (± 0.03)* 0.24 (± 0.03)* 0.14 (± 0.01)* * Significant difference by the t-test (p ≤ 0.05). Values into brackets are the standard error of the mean. Table 4.
Competitiveness indices between quinoa genotypes (1331, 1324, and 1303) and the competitor (ryegrass), expressed as relative competitiveness (RC), relative crowding coefficient (K), and aggressiveness (AG) in replacement series experiments. UFFS, Erechim, RS, Brazil.
-
Plant proportion (Quinoa : wild radish) Plant proportion (Quinoa : ryegrass) Q 1303 × Wild radish Q 1324 × Wild radish Q 1331 × Wild radish Q 1303 × Ryegrass Q 1324 × Ryegrass Q 1331 × Ryegrass N P N P N P N P N P N P 100:0 (C) 14.12 0.56 15.92 0.61 10.61 0.52 9.30 1.16 8.78 1.15 9.70 1.23 75:25 14.97* 0.54 15.44 0.51* 14.91* 0.55 9.05 1.17 8.60 1.22* 9.85 1.24 50:50 12.81* 0.52 16.43 0.50* 16.72* 0.52 8.90 1.12 8.31* 1.25* 9.23 1.13* 25:75 15.21* 0.60 15.56 0.60 12.26* 0.47 8.94 1.11 9.28* 1.19 8.34* 1.12* CV (%) 2.81 5.15 6.47 4.56 3.81 5.84 4.11 2.38 2.57 2.98 6.65 3.35 * Mean differ from the respective control (C) by Dunnett's (p ≤ 0.05). Table 5.
Responses of quinoa genotypes (Q) in competition with wild radish (Raphanus raphanistrum) and/or ryegrass (Lolium multiflorum), expressed by nitrogen (N) and phosphorus (P) contents (dag·kg−1) in replacement series experiments. UFFS, Erechim, RS, Brazil.
Figures
(5)
Tables
(5)