-
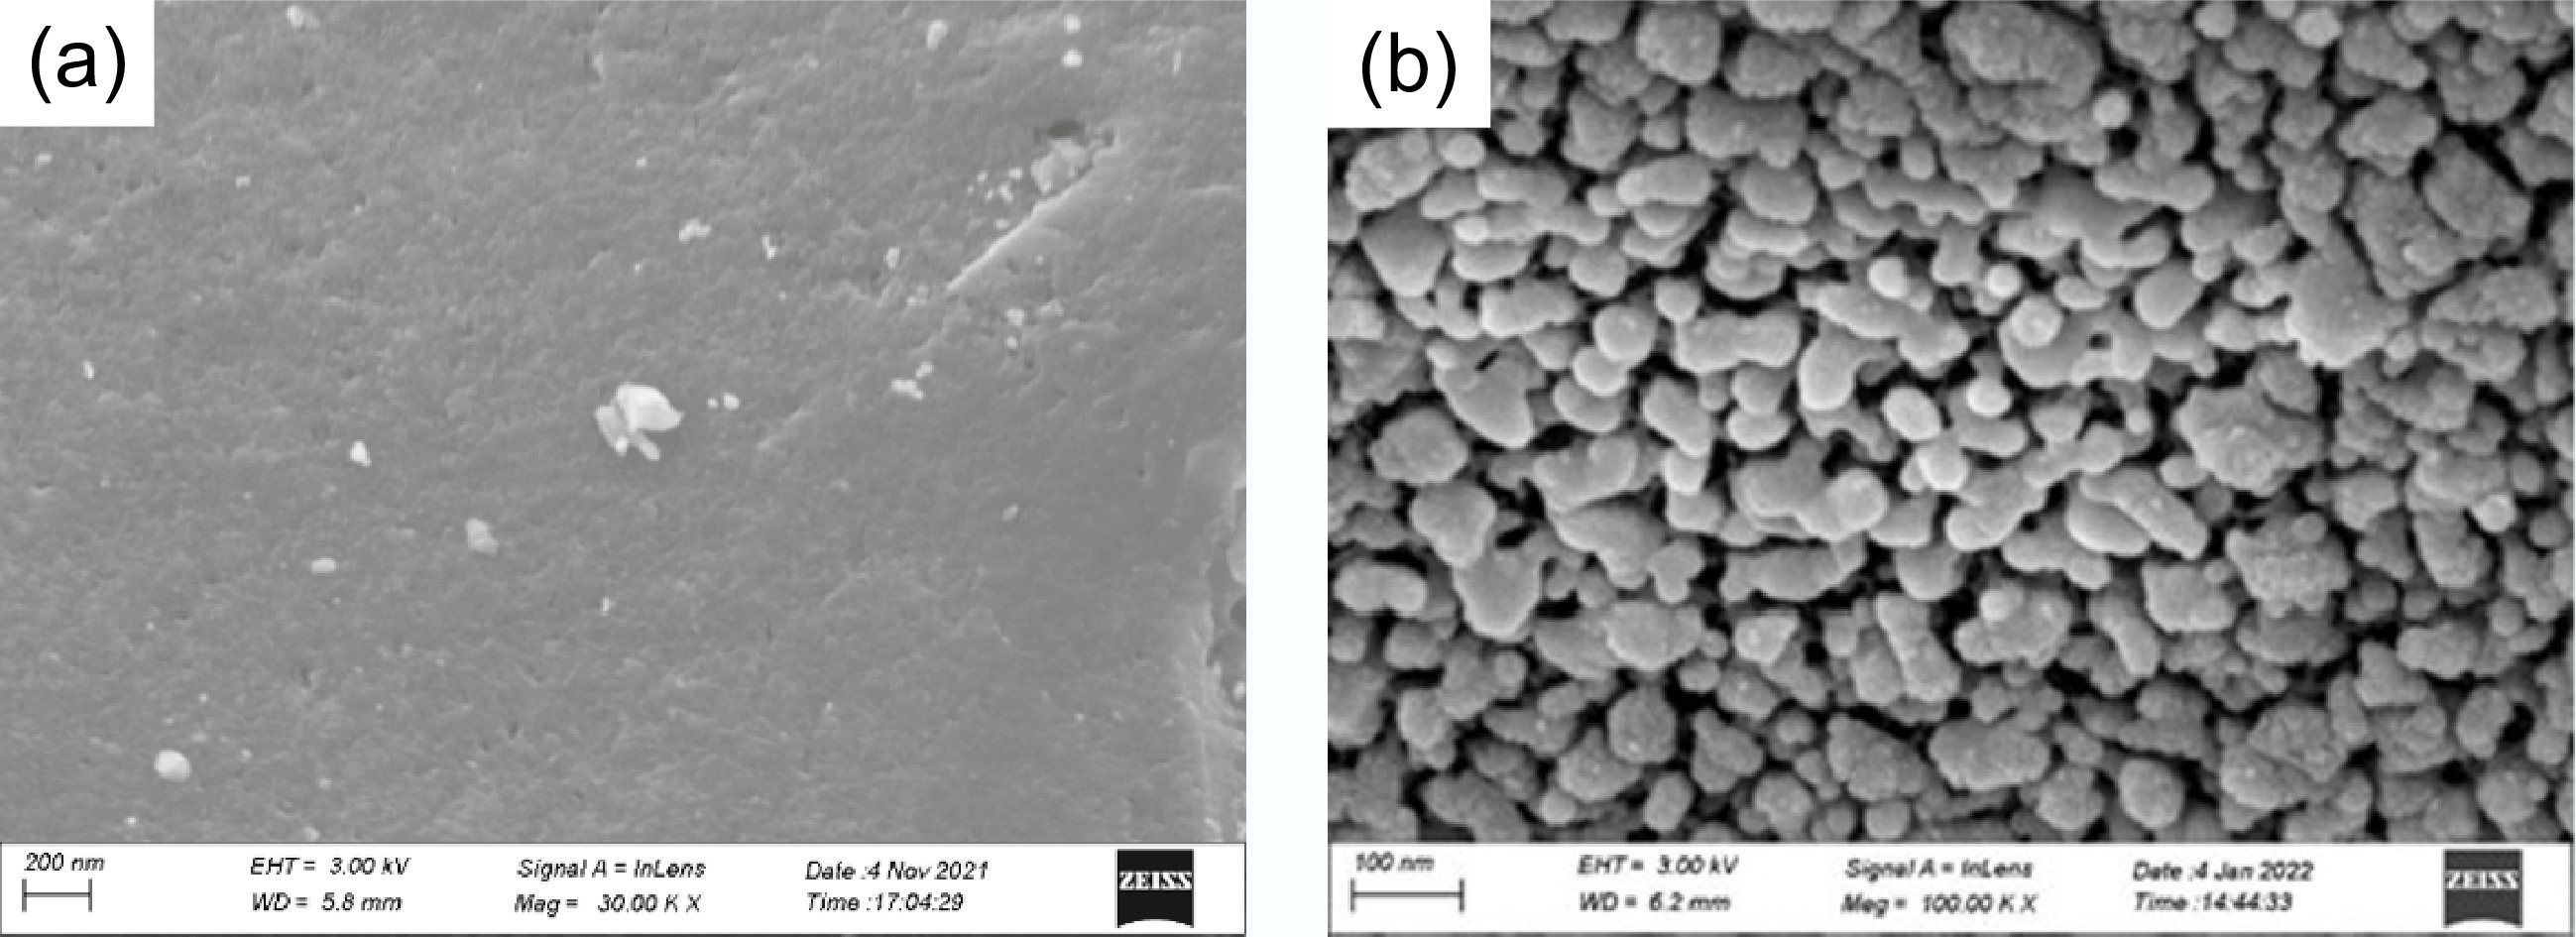
Figure 1.
FE-SEM images of (a) BC and (b) FMBC-600.
-
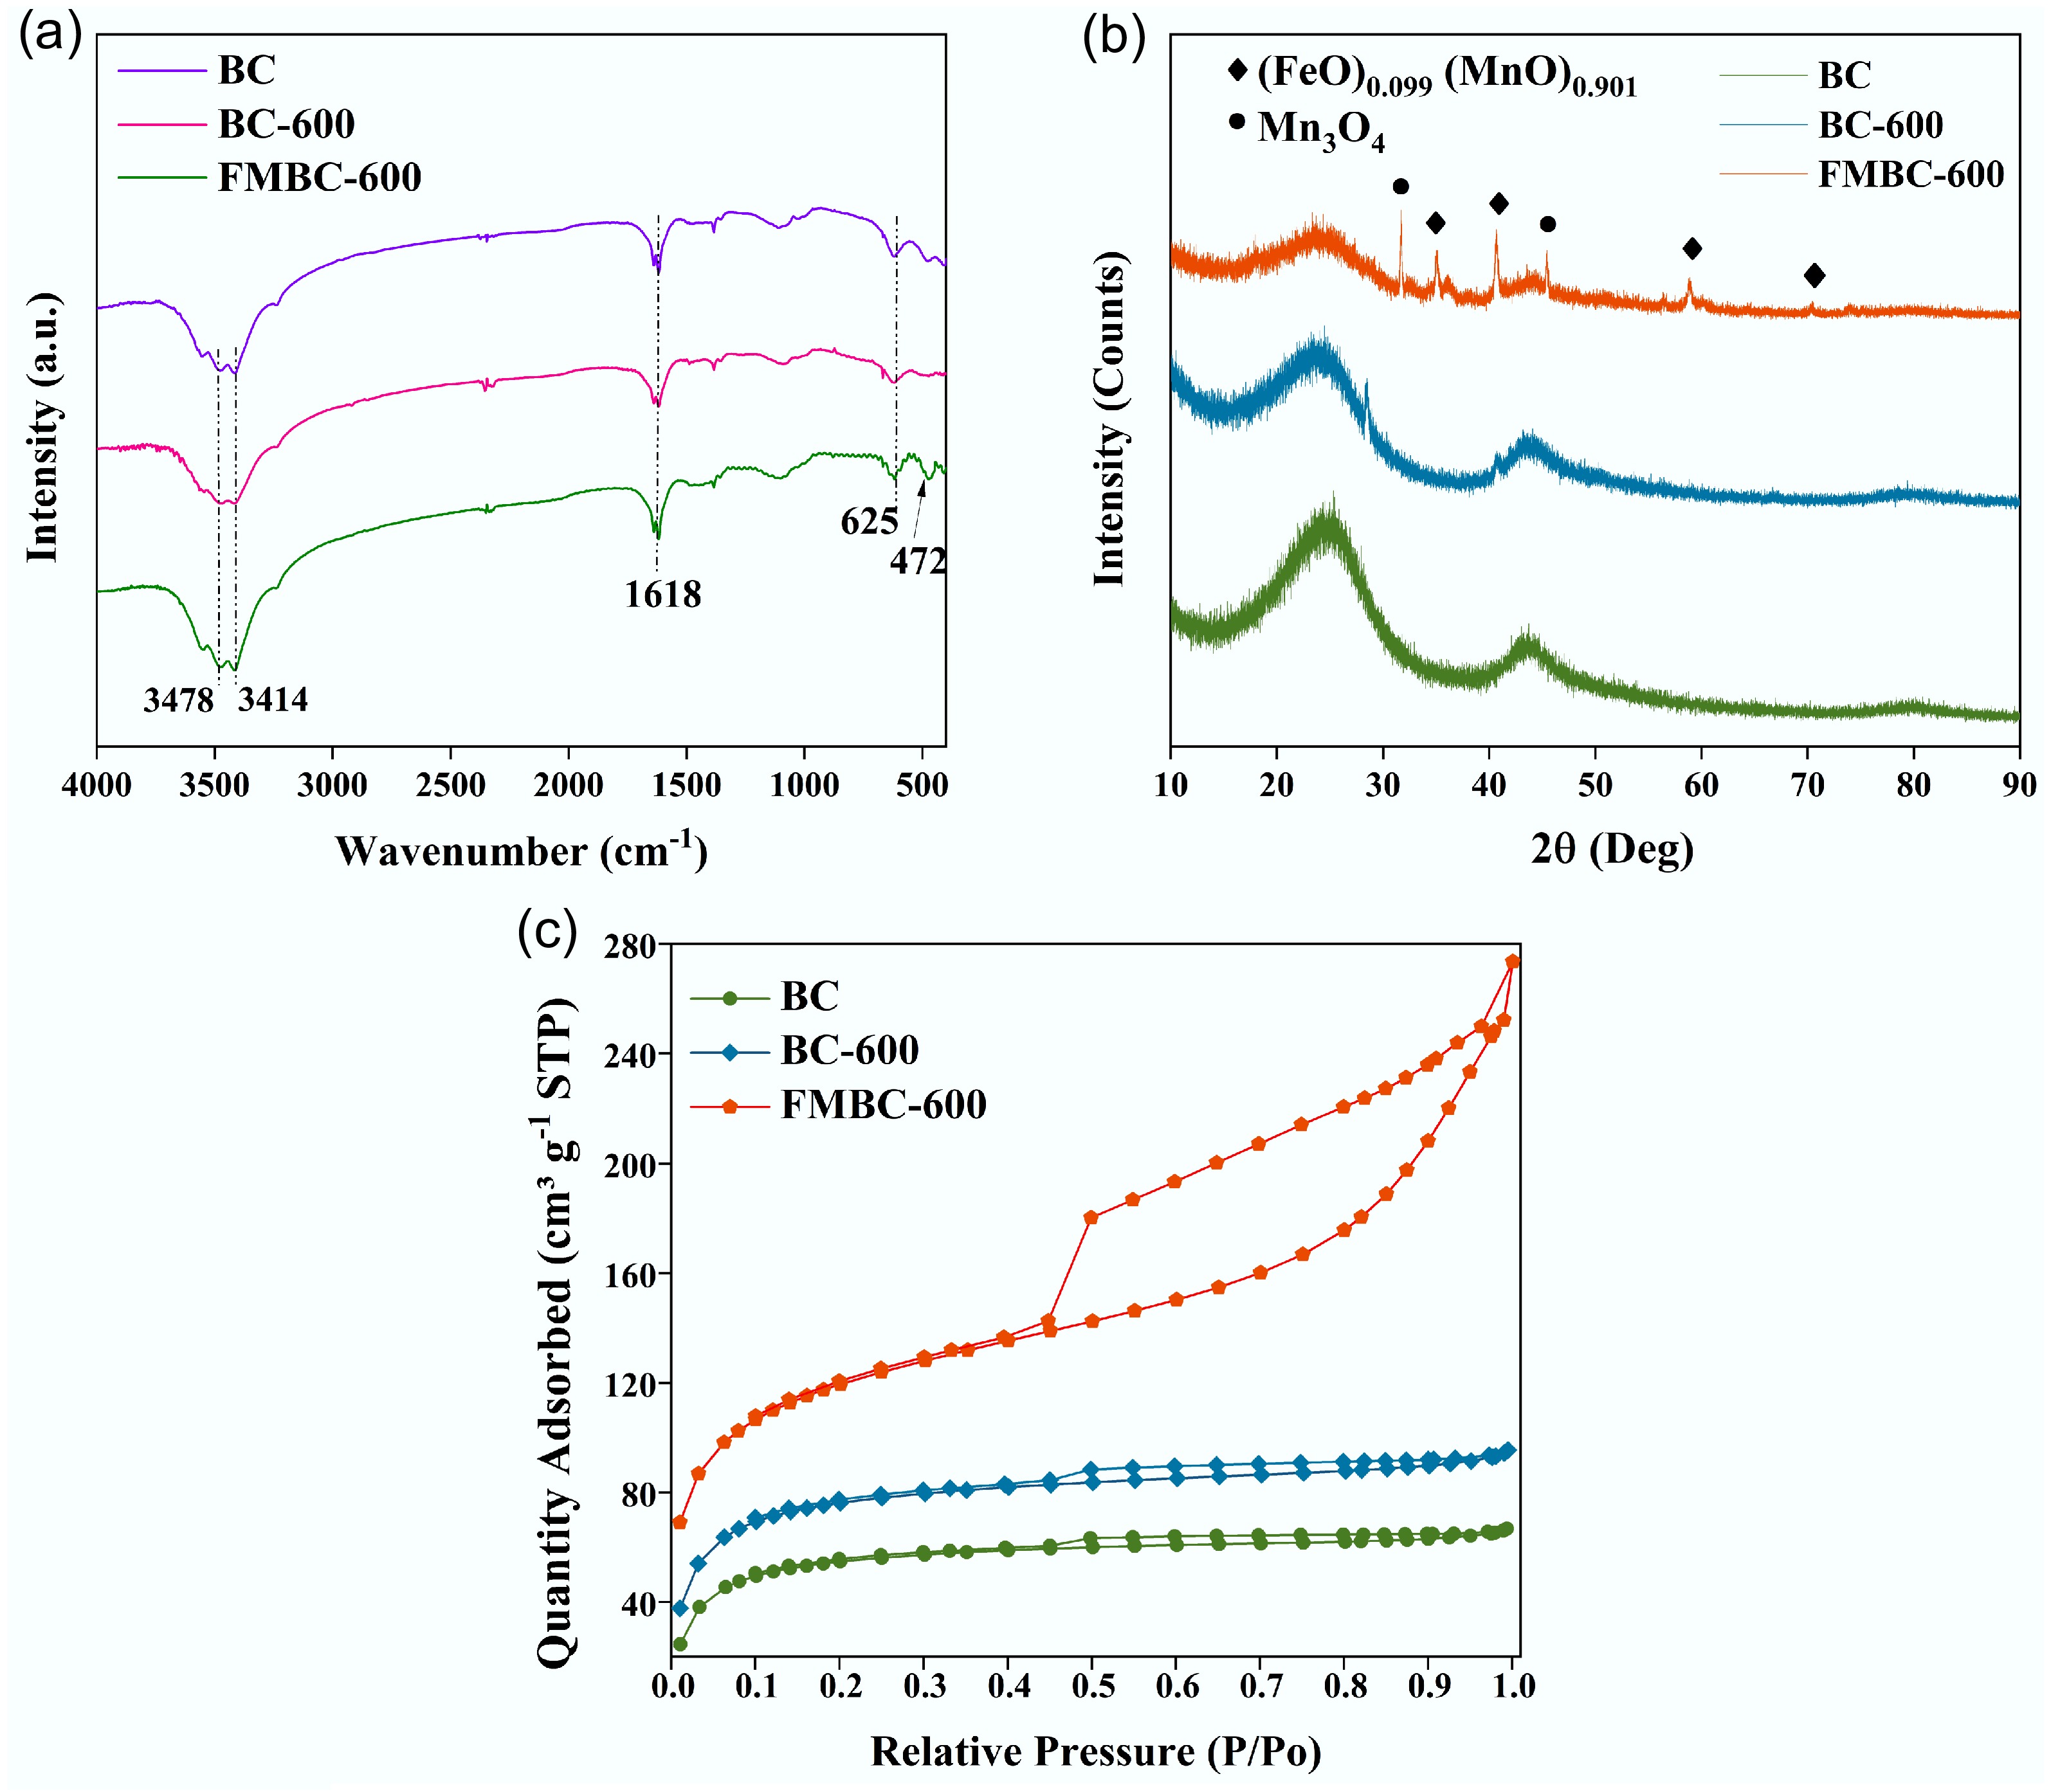
Figure 2.
(a) FTIR spectra, (b) XRD patterns, and (c) N2 adsorption–desorption isotherms of BC, BC-600, and FMBC-600.
-
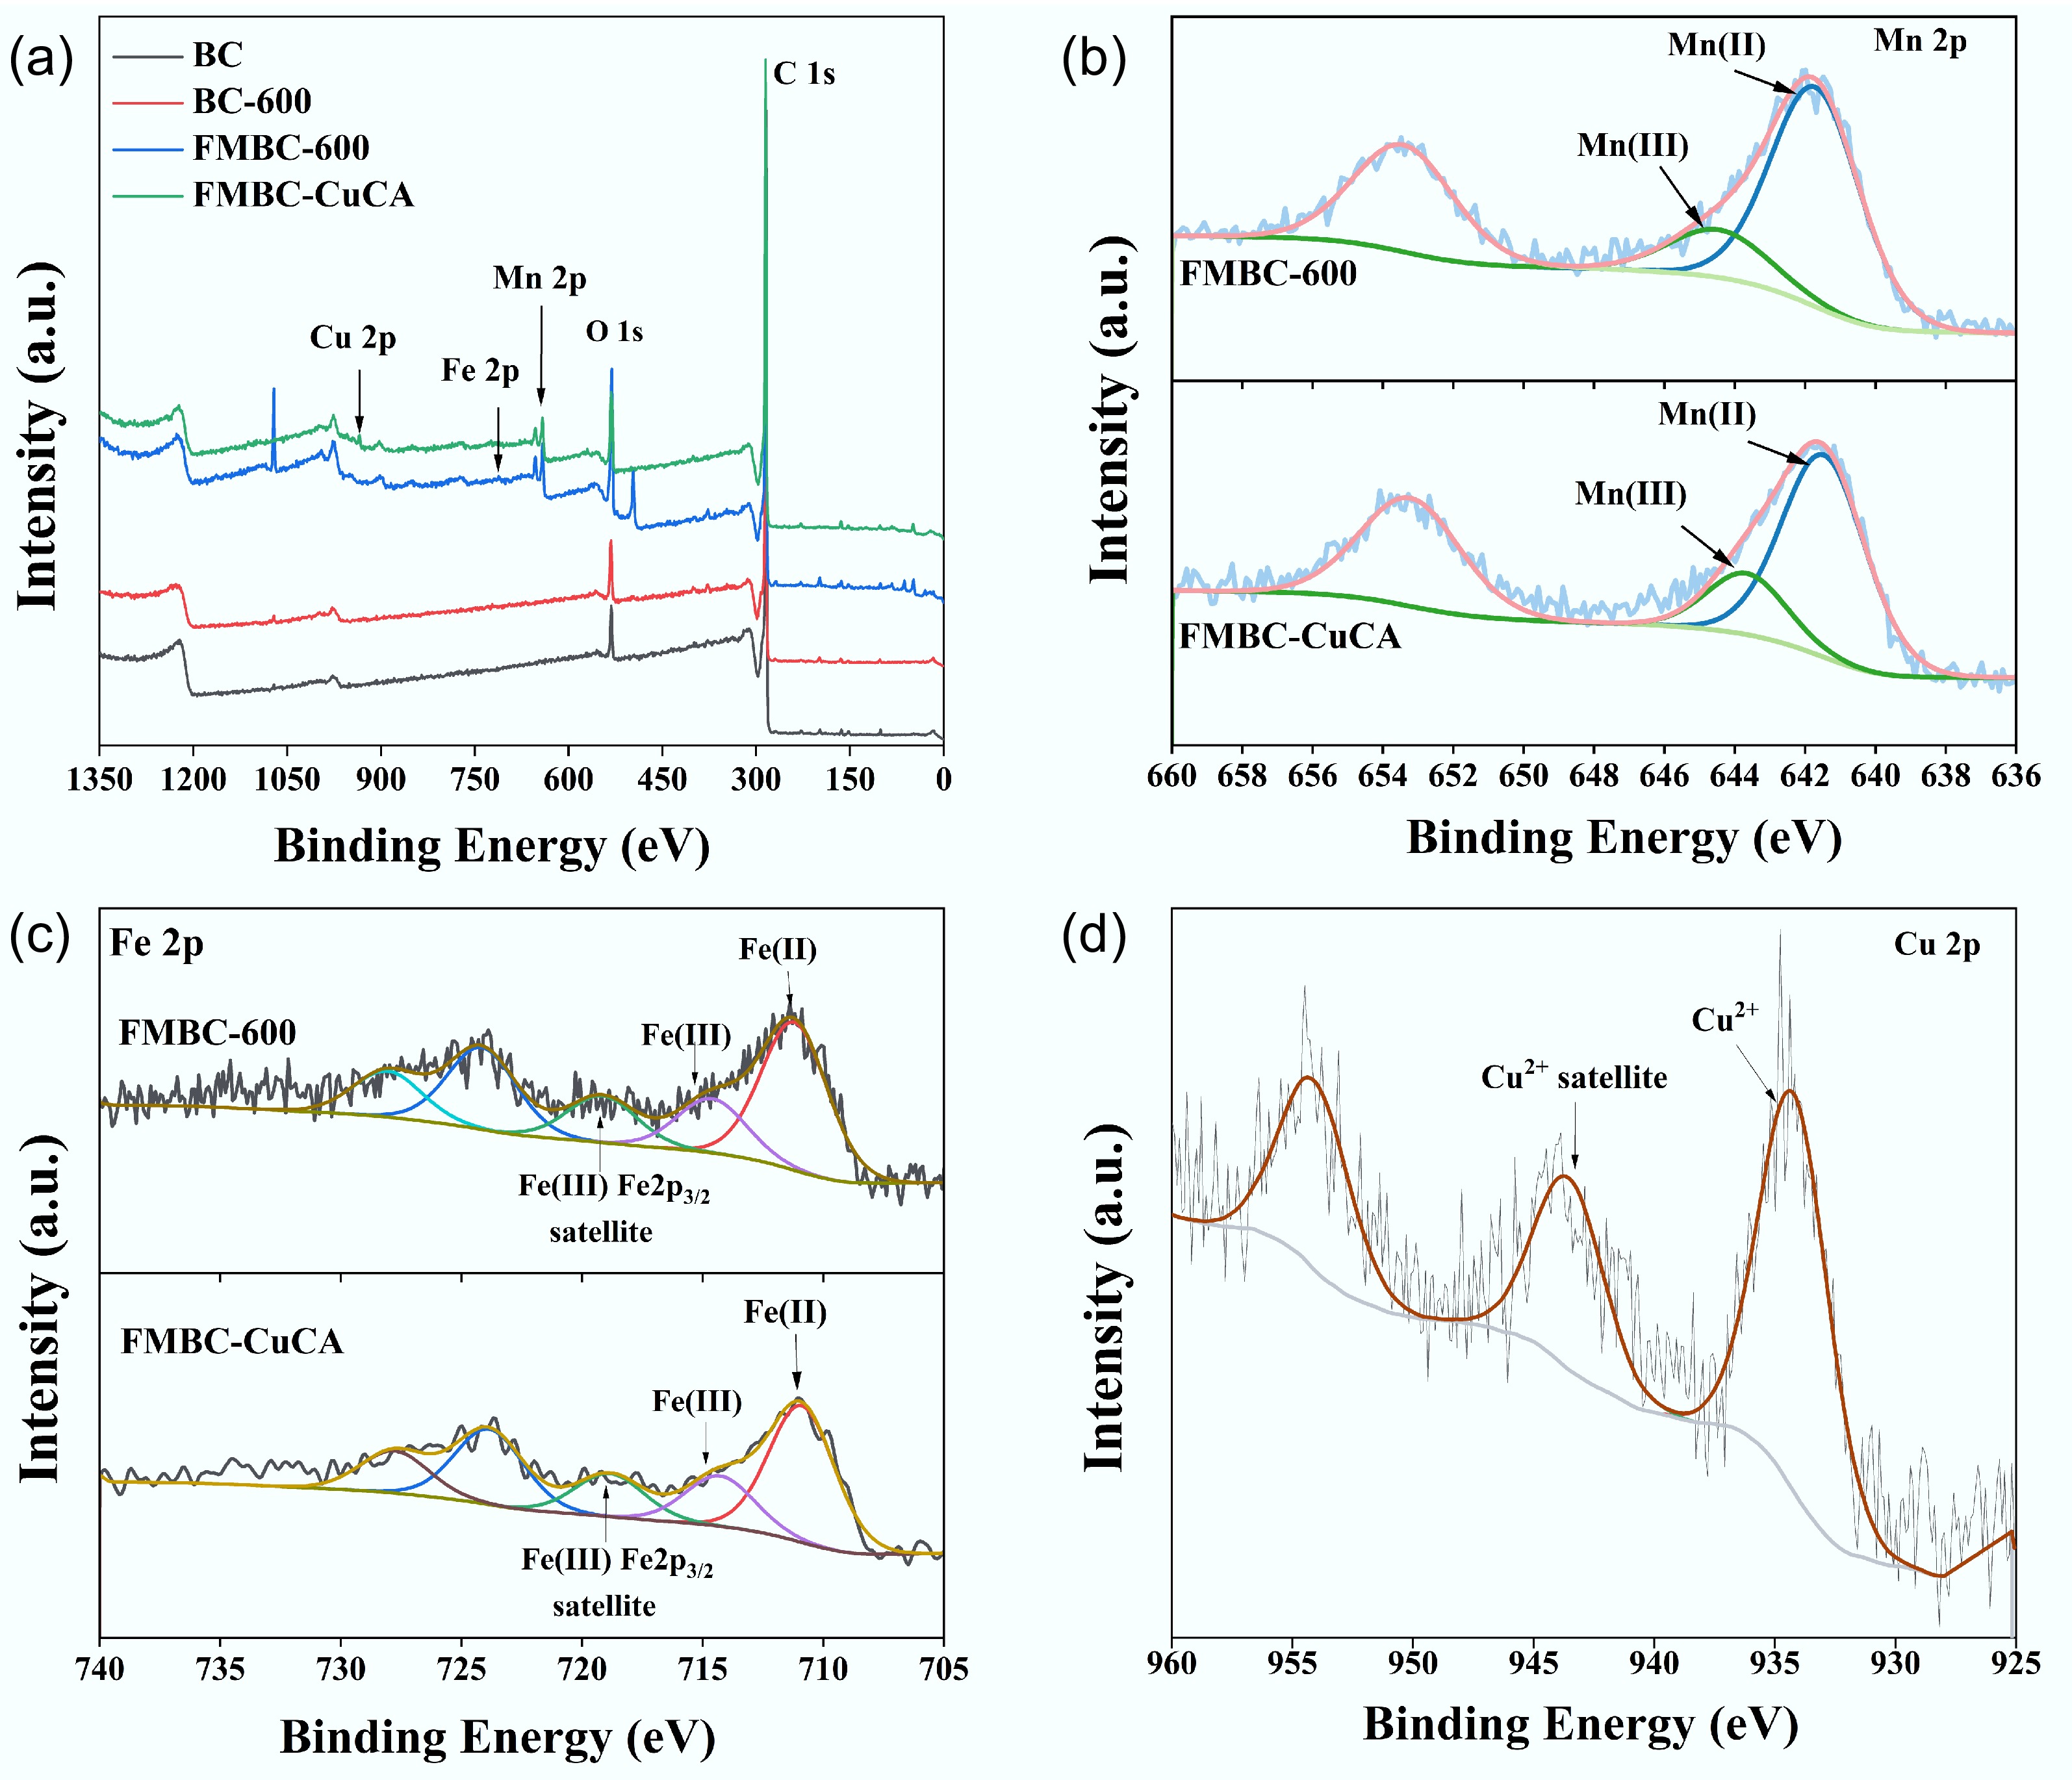
Figure 3.
(a) XPS spectra, including the full spectrum and the high-resolution spectra of (b) Mn 2p, (c) Fe 2p, and (d) Cu 2p.
-
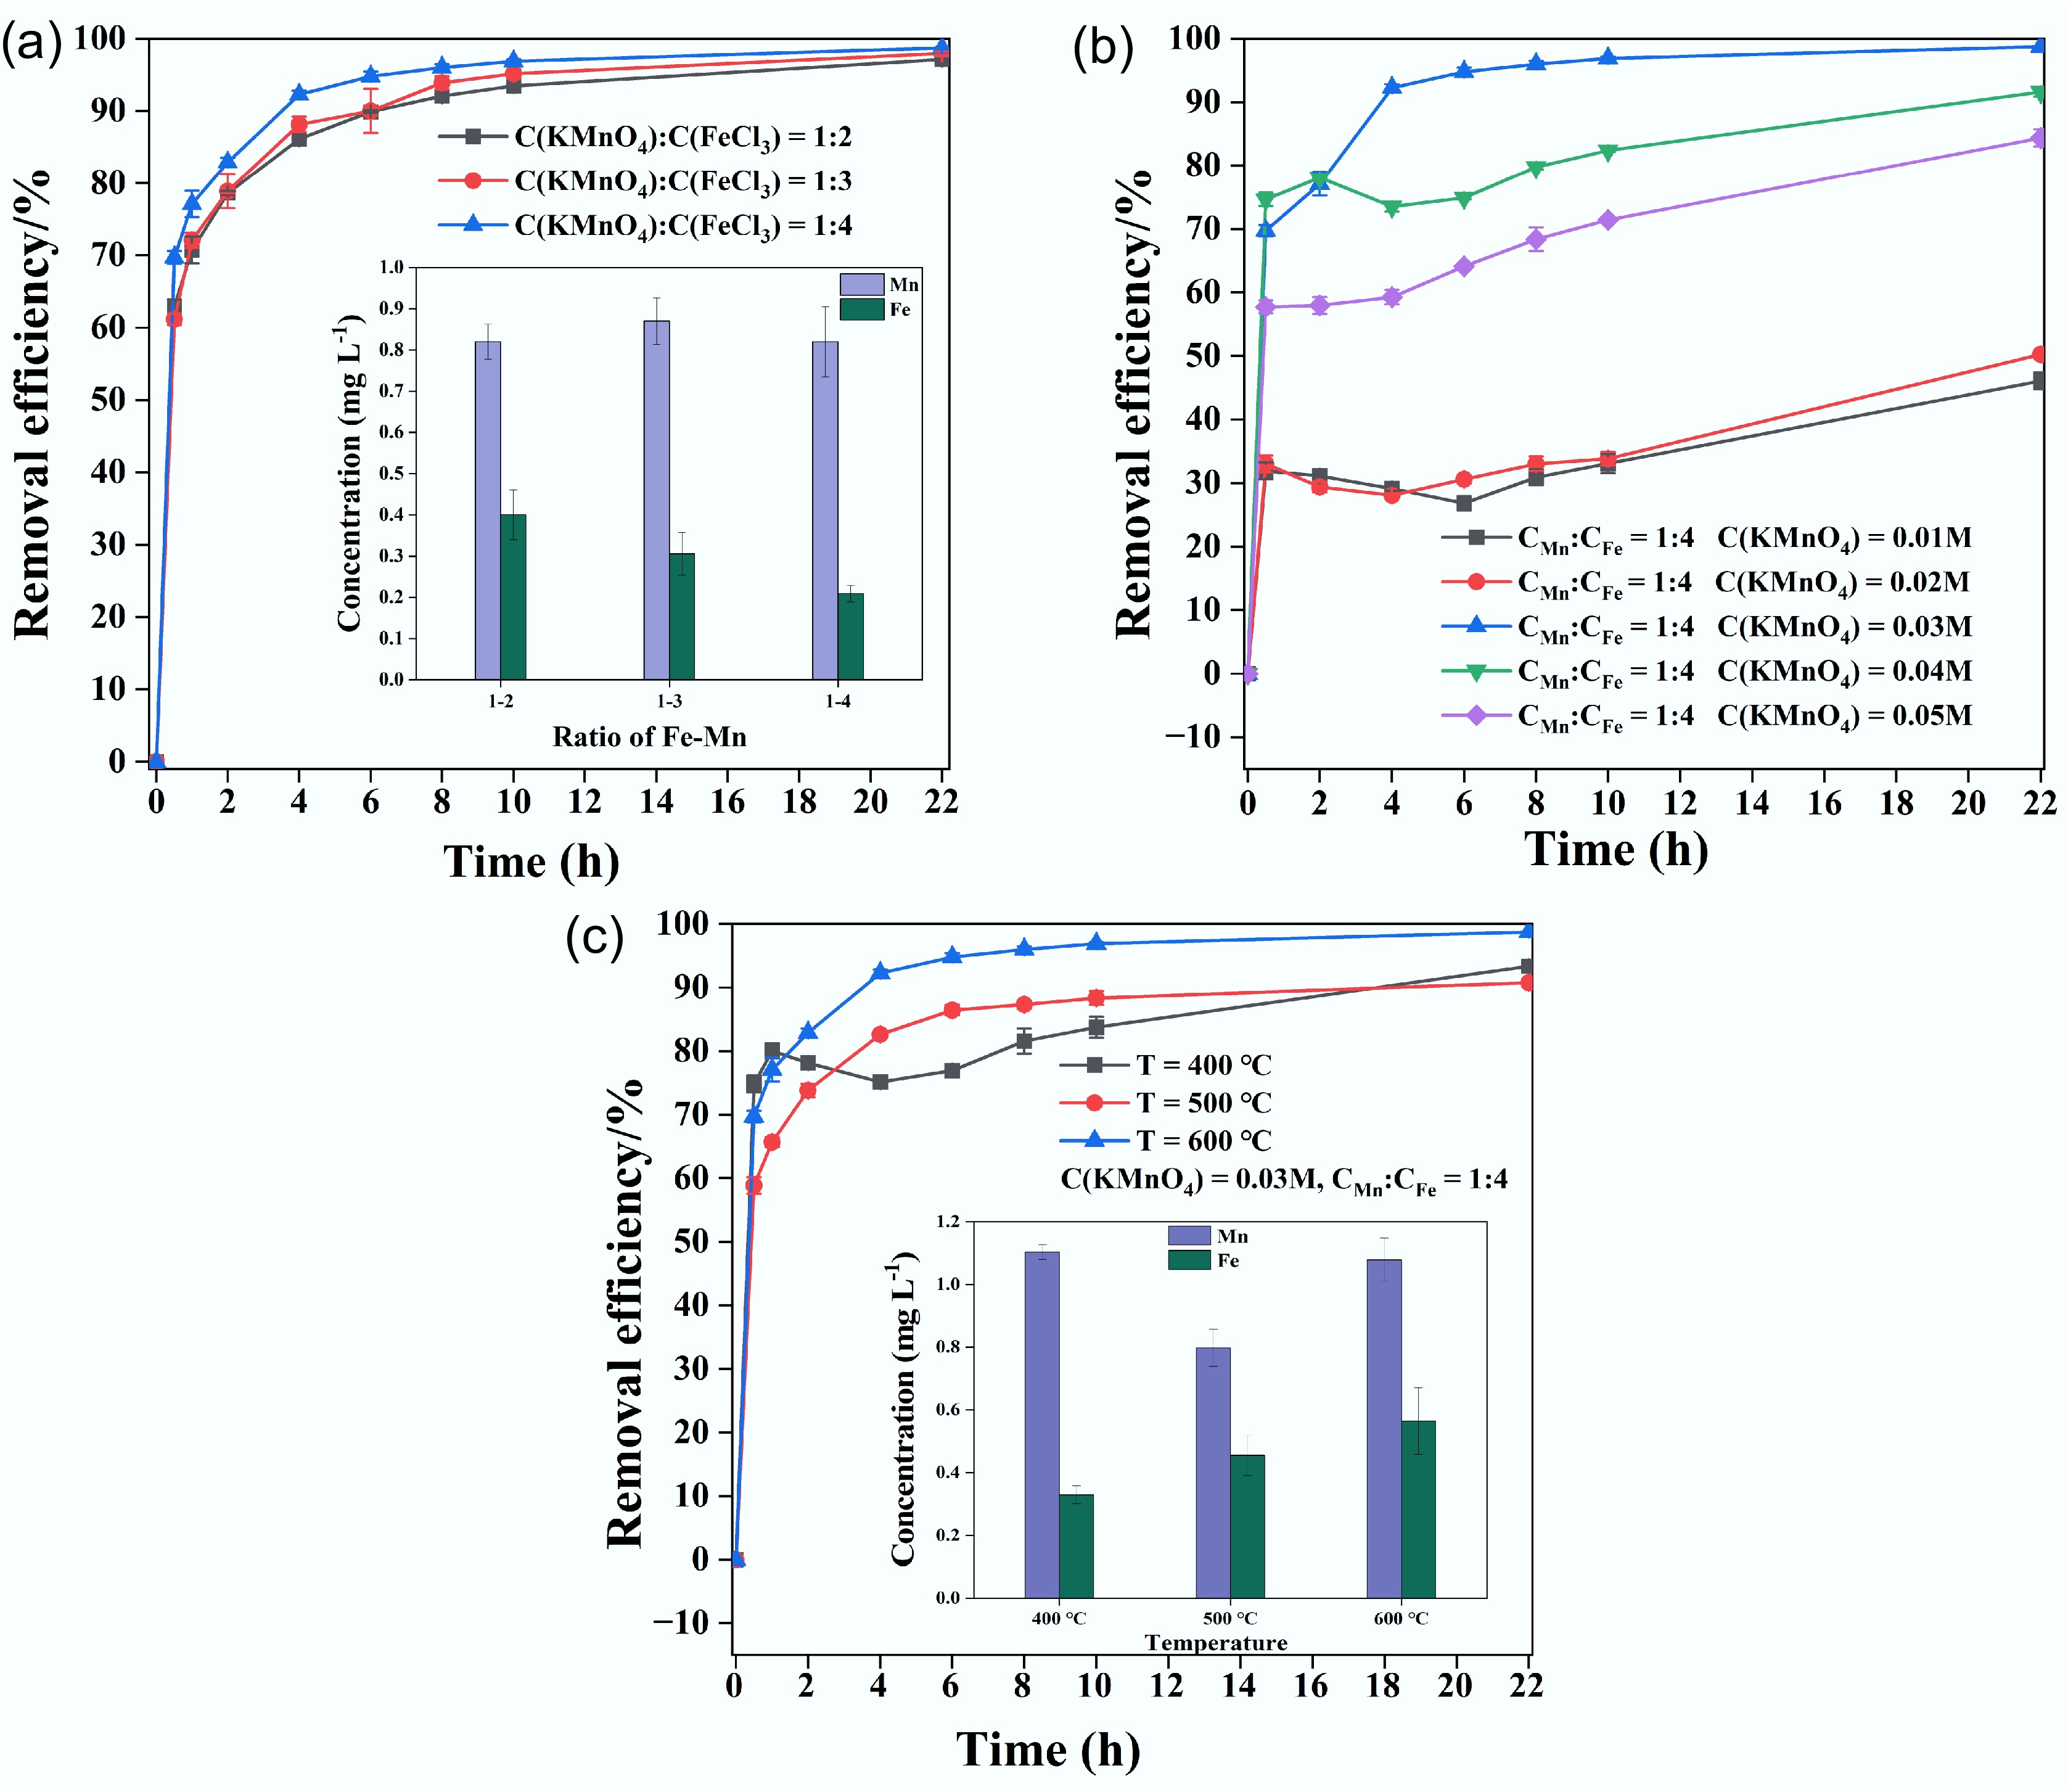
Figure 4.
Contrastive analysis of Cu removal efficiency based on the (a) Fe–Mn ratio, (b) initial KMnO4 concentration, and (c) pyrolysis temperature.
-
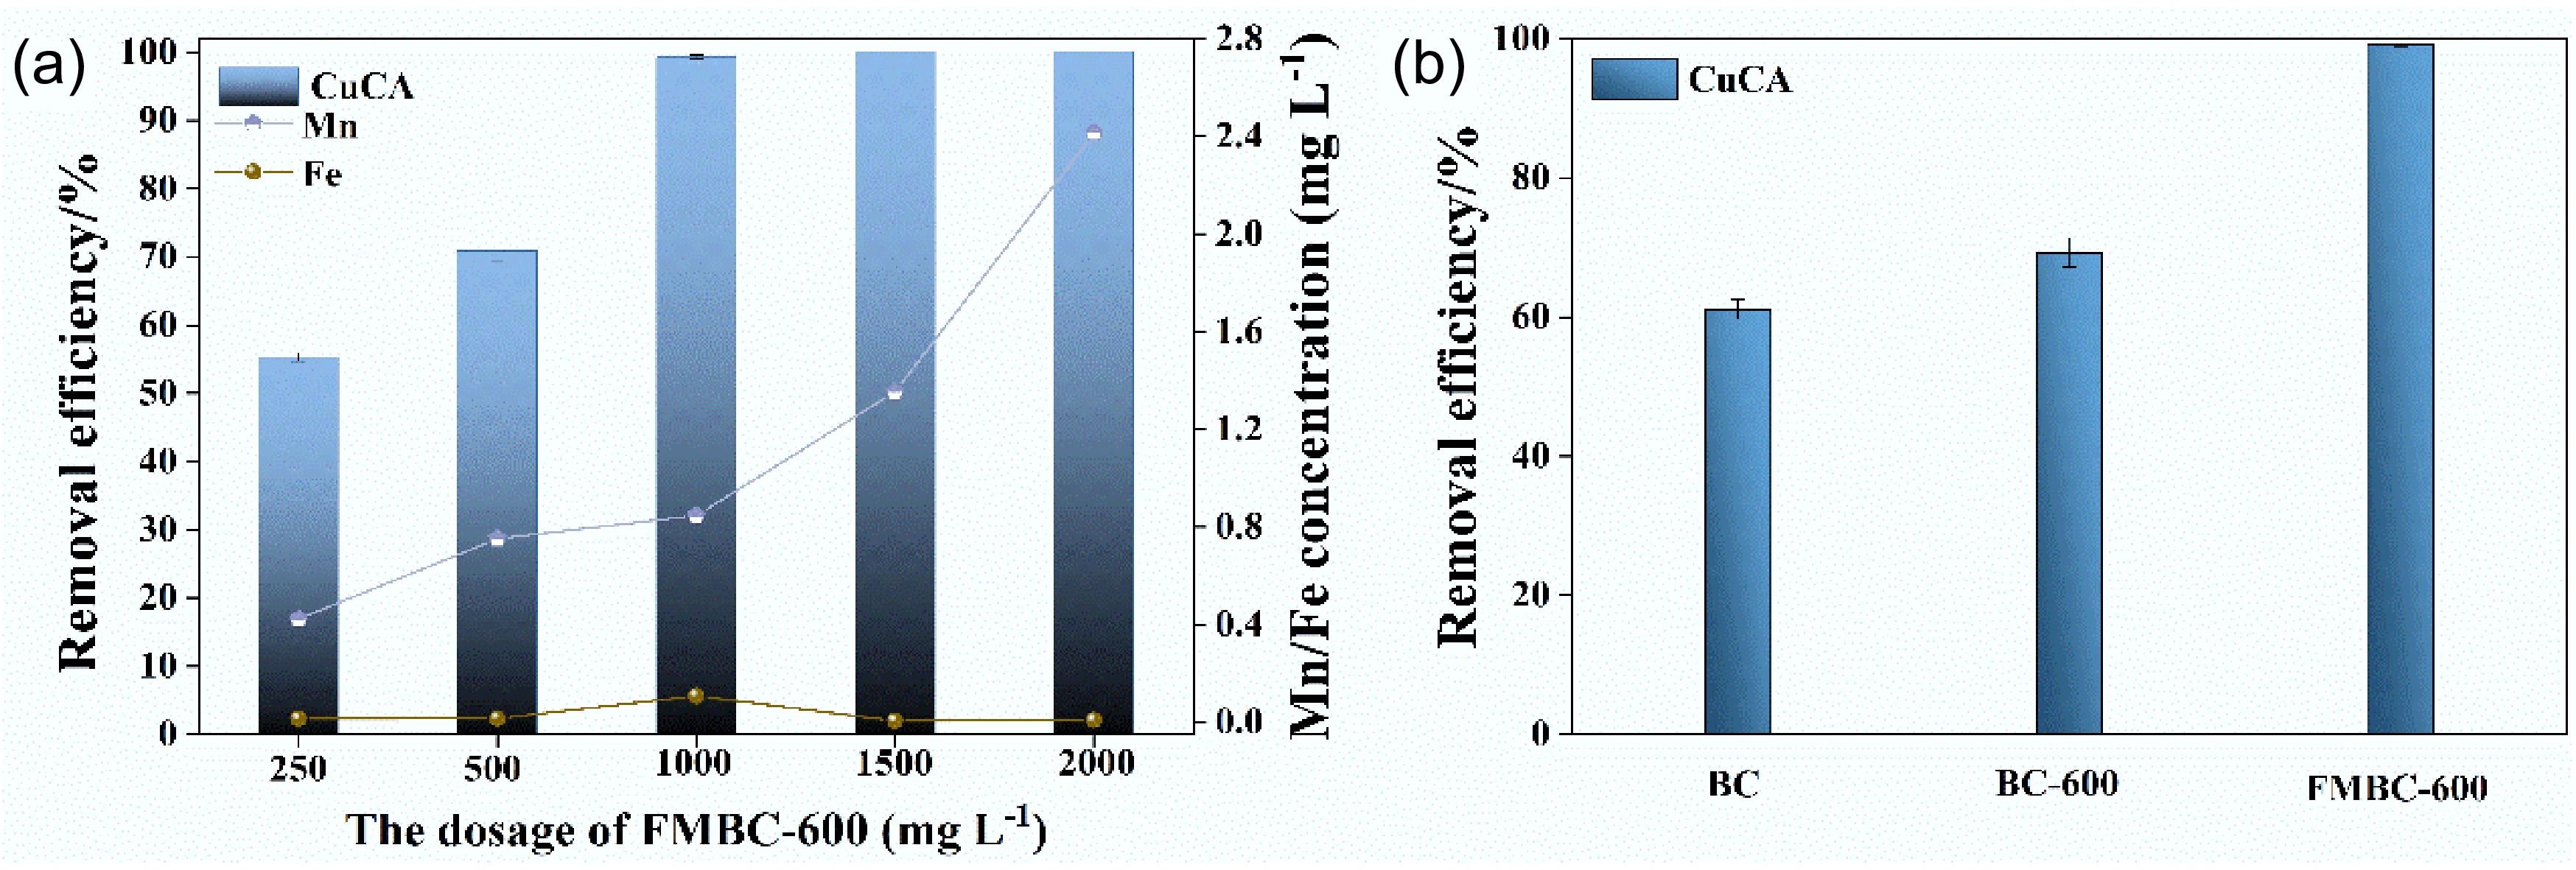
Figure 5.
Removal performance at different dosages of (a) FMBC-600 and (b) control experiments.
-
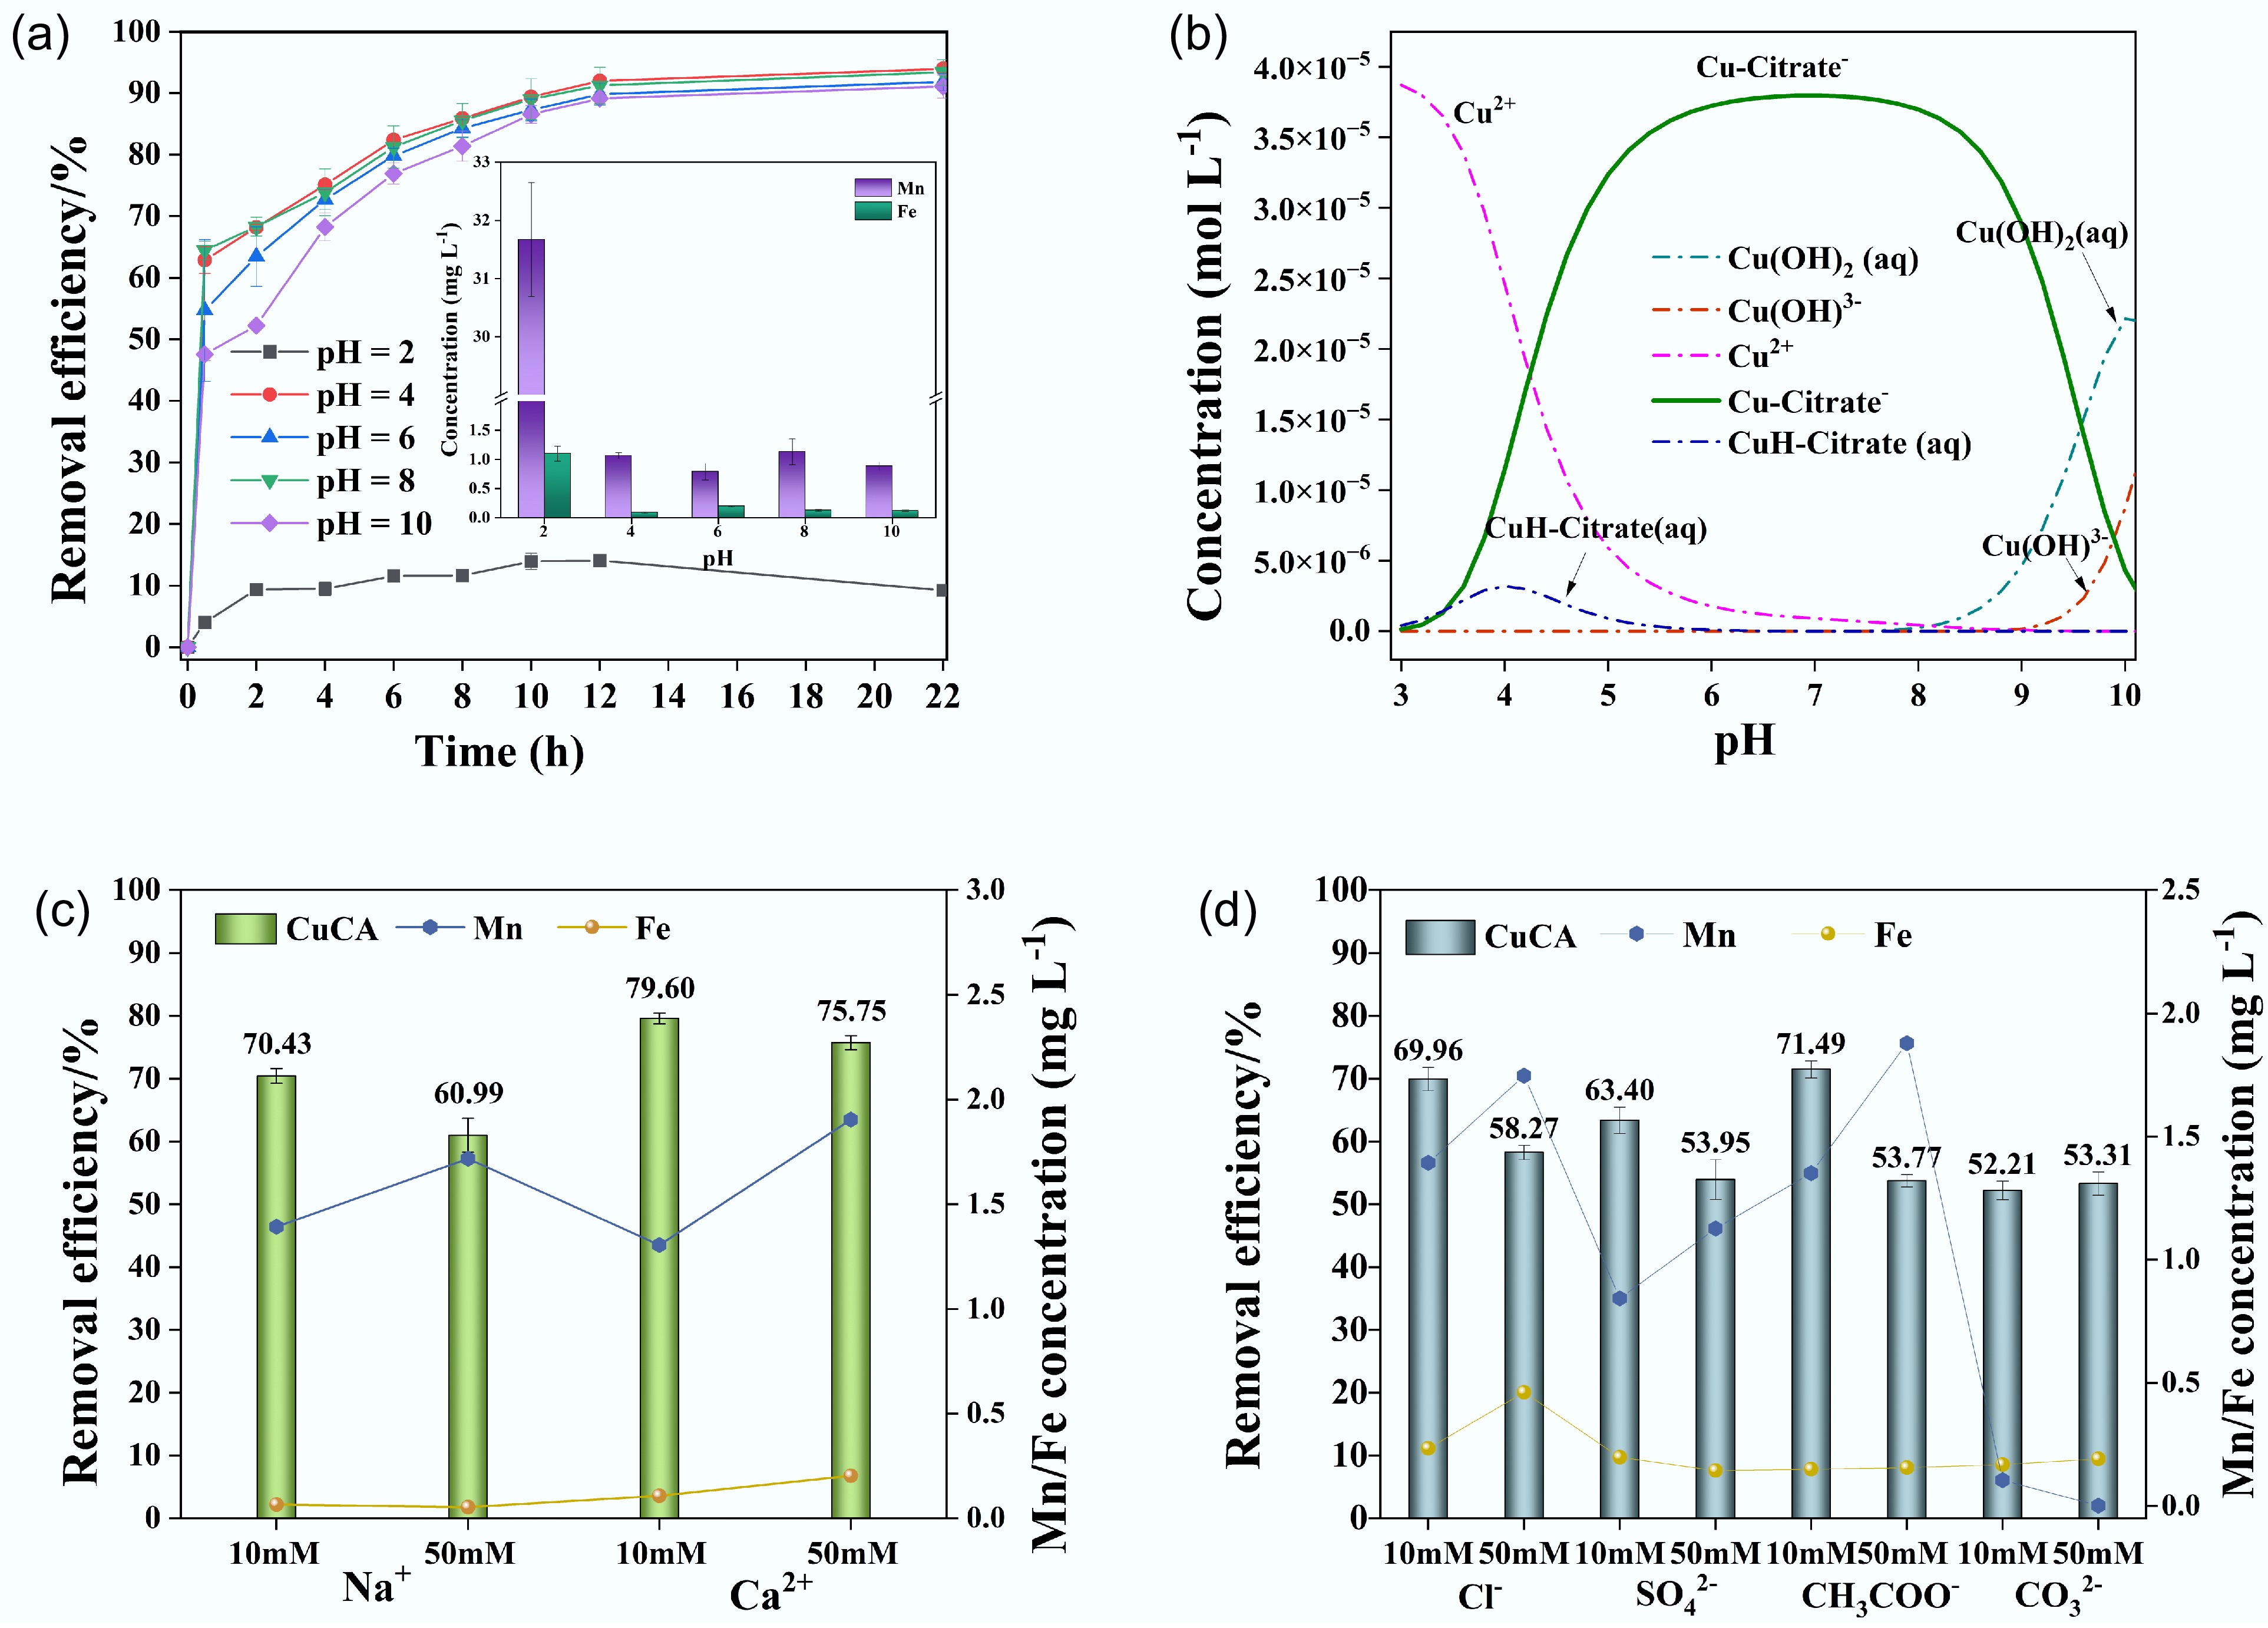
Figure 6.
(a) Removal performance under different pH values, (b) species of CuCA calculated by MINITEQ 3.1, (c) removal performance of coexisting cations, and (d) removal performance of coexisting anions.
-
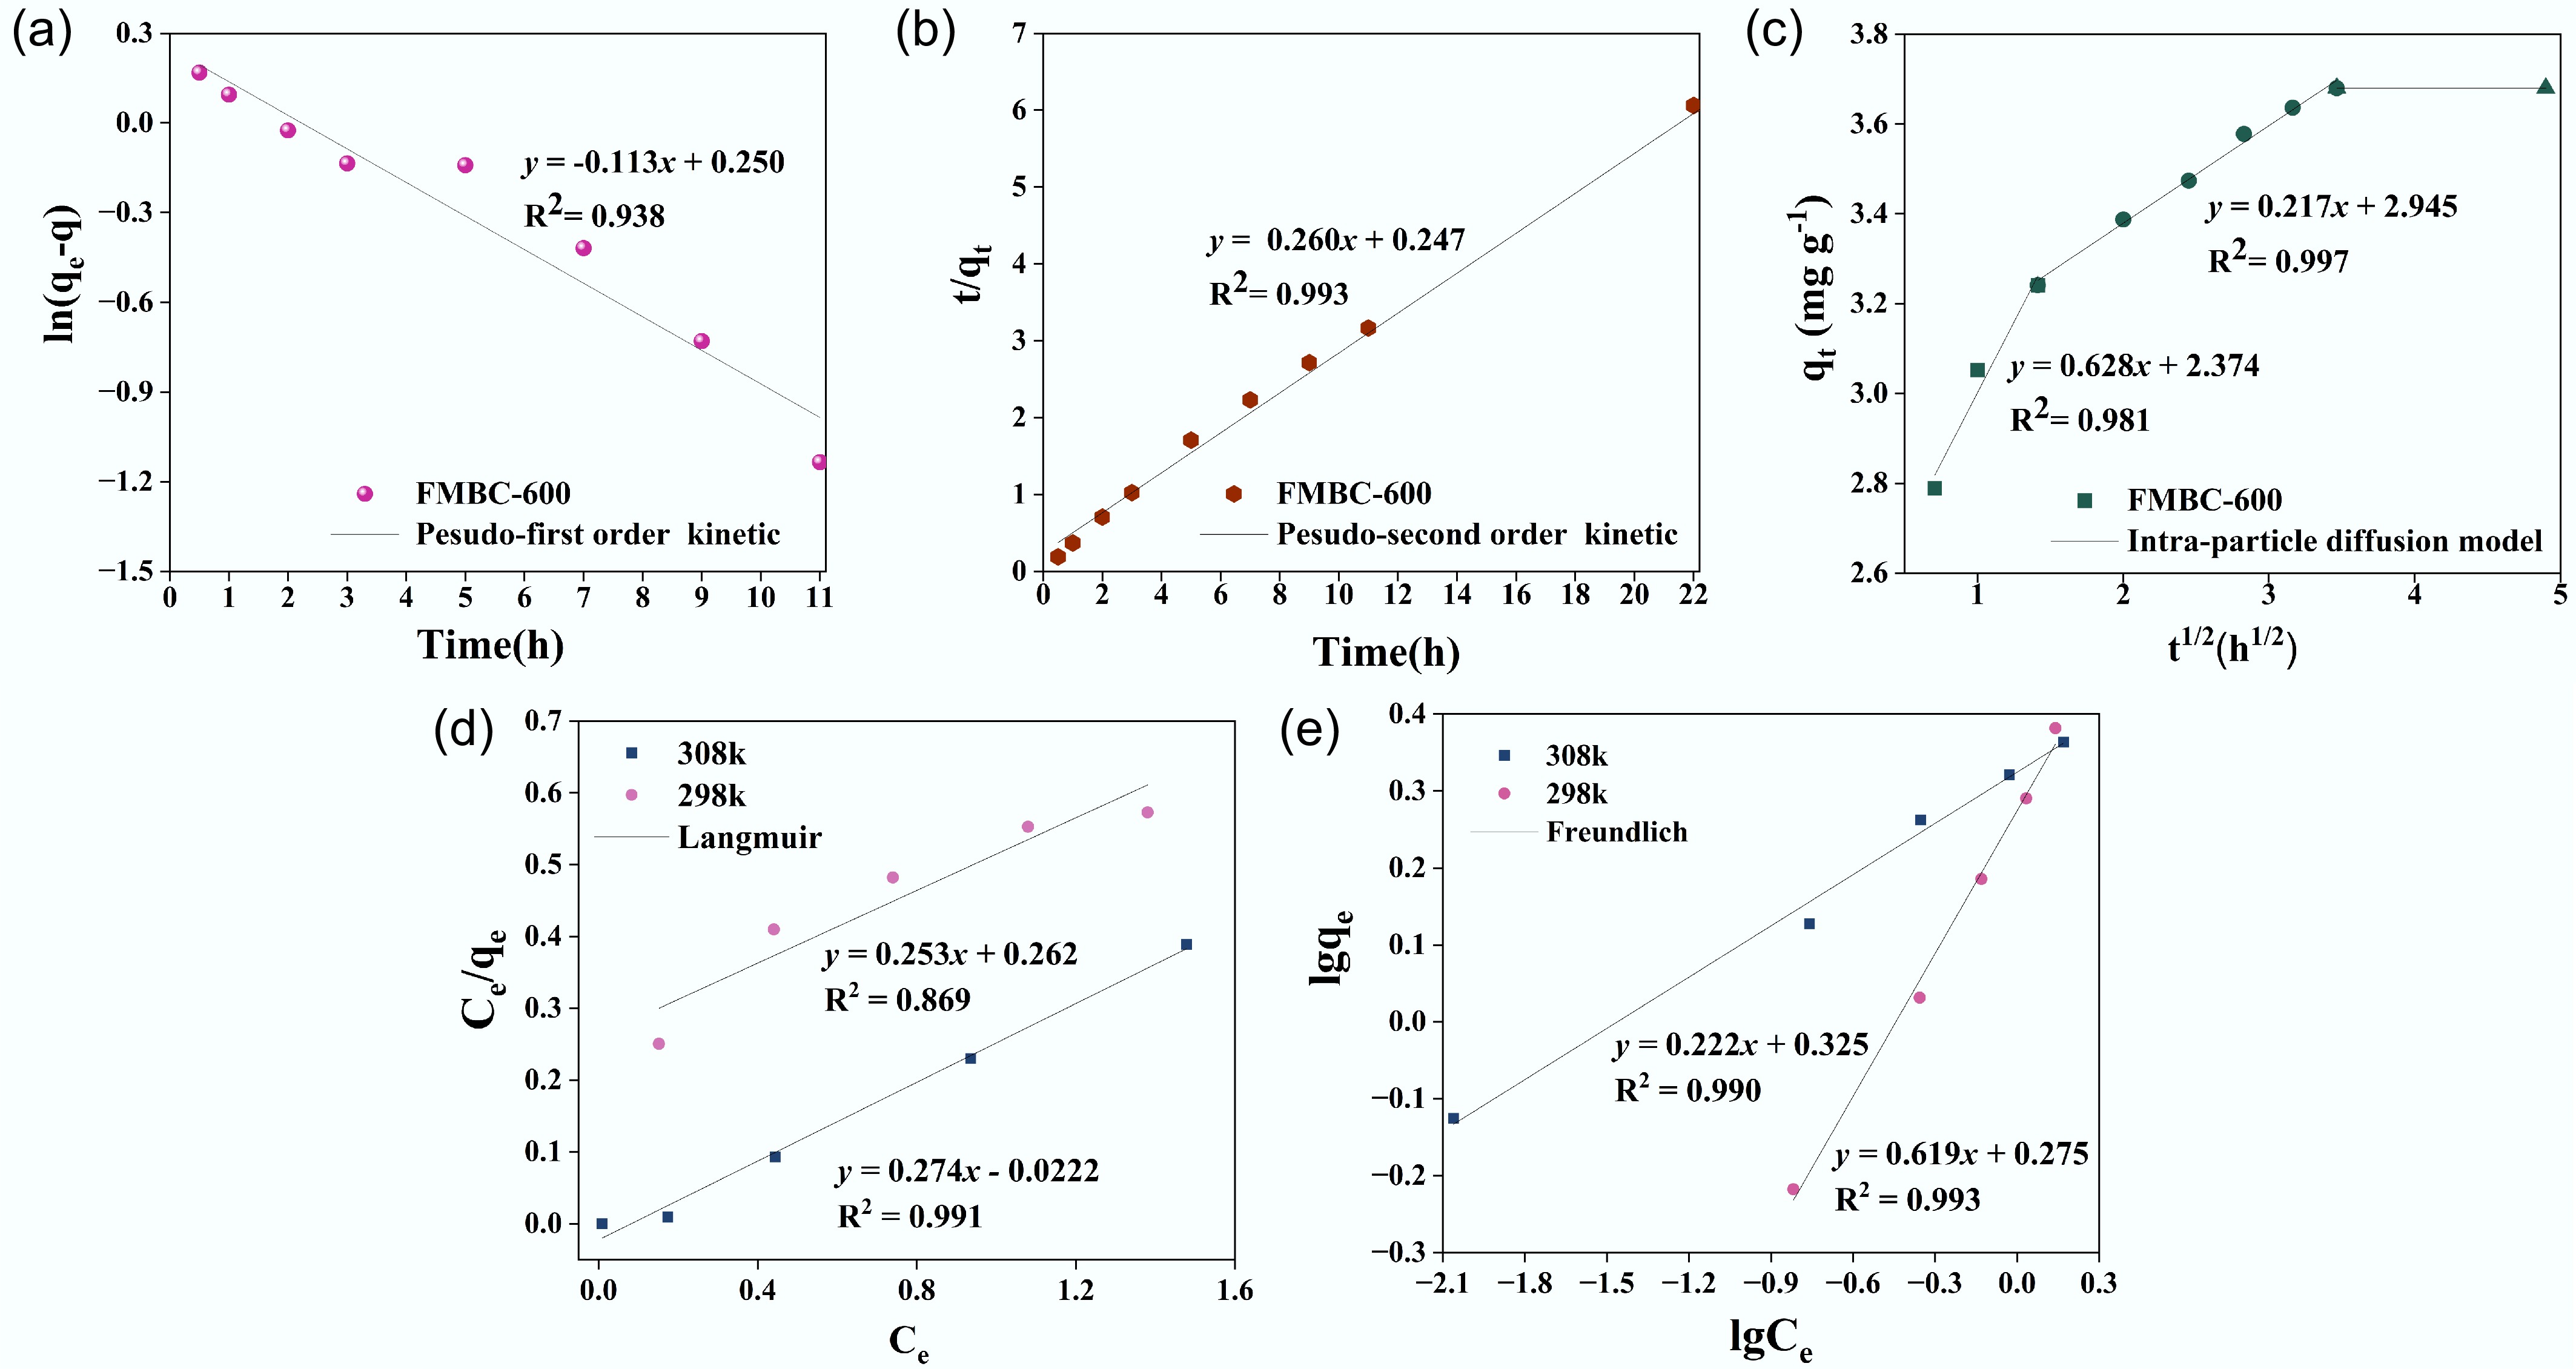
Figure 7.
(a) Pseudo-first-order kinetics, (b) pseudo-second-order kinetics, (c) internal diffusion kinetics, (d) Langmuir isotherm, and (e) Freundlich isotherm.
-
Sample BET surface area (m2 g−1) Pore volume (cm3 g−1) Pore diameter
(nm)BC 577.37 0.33 2.30 BC-600 634.65 0.37 2.35 FMBC-600 599.40 0.50 3.32 Table 1.
Brunauer–Emmett–Teller (BET) results of BC, BC-600, and FMBC-600
-
Adsorbent Contact time (h) Dosage qe Ref. Magnetic anion exchange resin and magnetic cation exchange resin 24 1.0 and 0.25 g L−1 / [42] Manganese oxide-modified biochar 24 1.0 g L−1 3.54 mg g−1; pH = 7.8 [44] Chitosan 72 4.96 mmol g−1; pH = 6 [45] Manganese oxide-modified gasification of ash-derived activated carbon 24 2.0 g L−1 4.237 mg g−1; pH = 3 [57] Polymer-supported, nanosized, and hydrated Fe(III) oxides 3 2.0 g L−1 with 40 mM H2O2 / [58] FMBC-600 22 1.0 g L−1 3.79 mg g−1; pH = 7.8 This study Table 2.
Comparison of present adsorbents with reported work
Figures
(7)
Tables
(2)