-
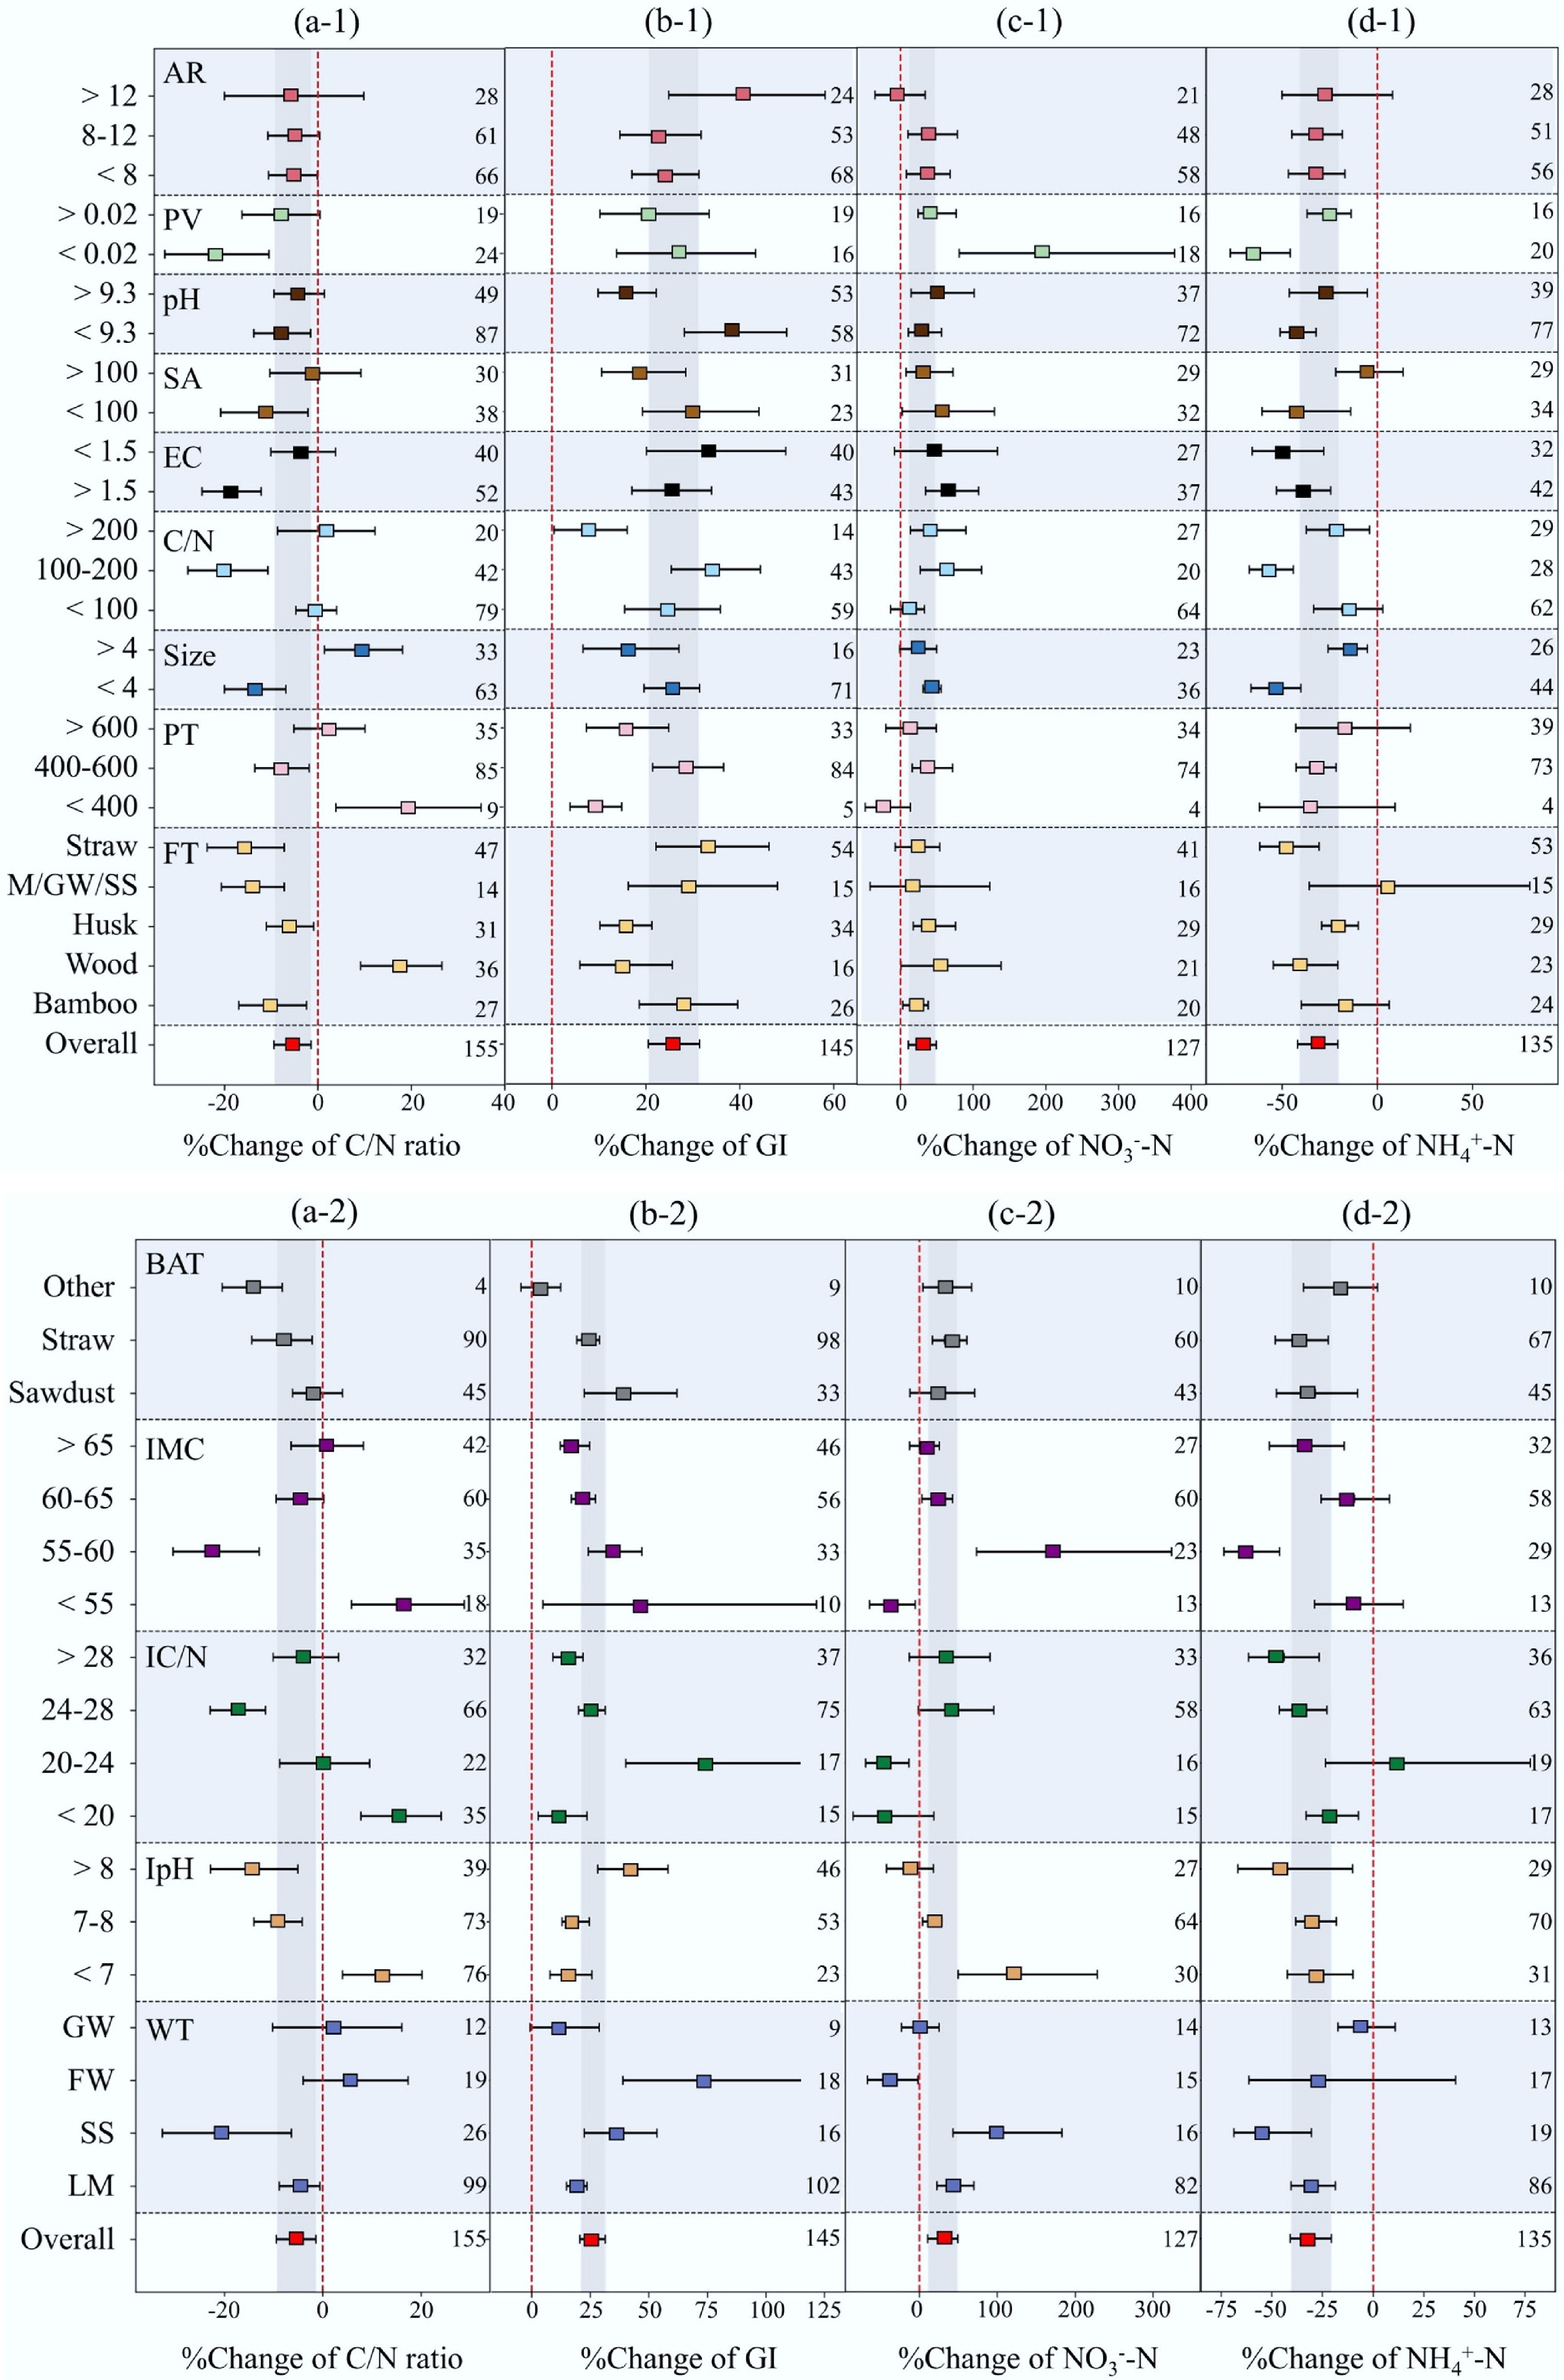
Figure 1.
Impact of (1) biochar and (2) initial compost parameters on the internal maturity indicators of compost. (a) C/N ratio; (b) GI; (c) NO3−−N; (d) NH4+−N. Note: the overall impact is shown at the bottom of each panel. The square represents the subgroup response value; the error bars represent the 95% confidence interval; and the vertical gray area represents the 95% confidence interval for the overall impact. The responses are displayed vertically according to the various categories of biochar properties. The numbers on the right side of the graph represent the amount of data observed for subgroups or overall dataset. (FT, feedstock type; PT, pyrolysis temperature; C/N, carbon to nitrogen; EC, electrical conductivity; SA, surface area; PV, pore volume; AR, amendment rate; WT, waste type; IpH, initial pH; IC/N, initial carbon to nitrogen; IMC, initial moisture content; BAT, bulking agent type).
-
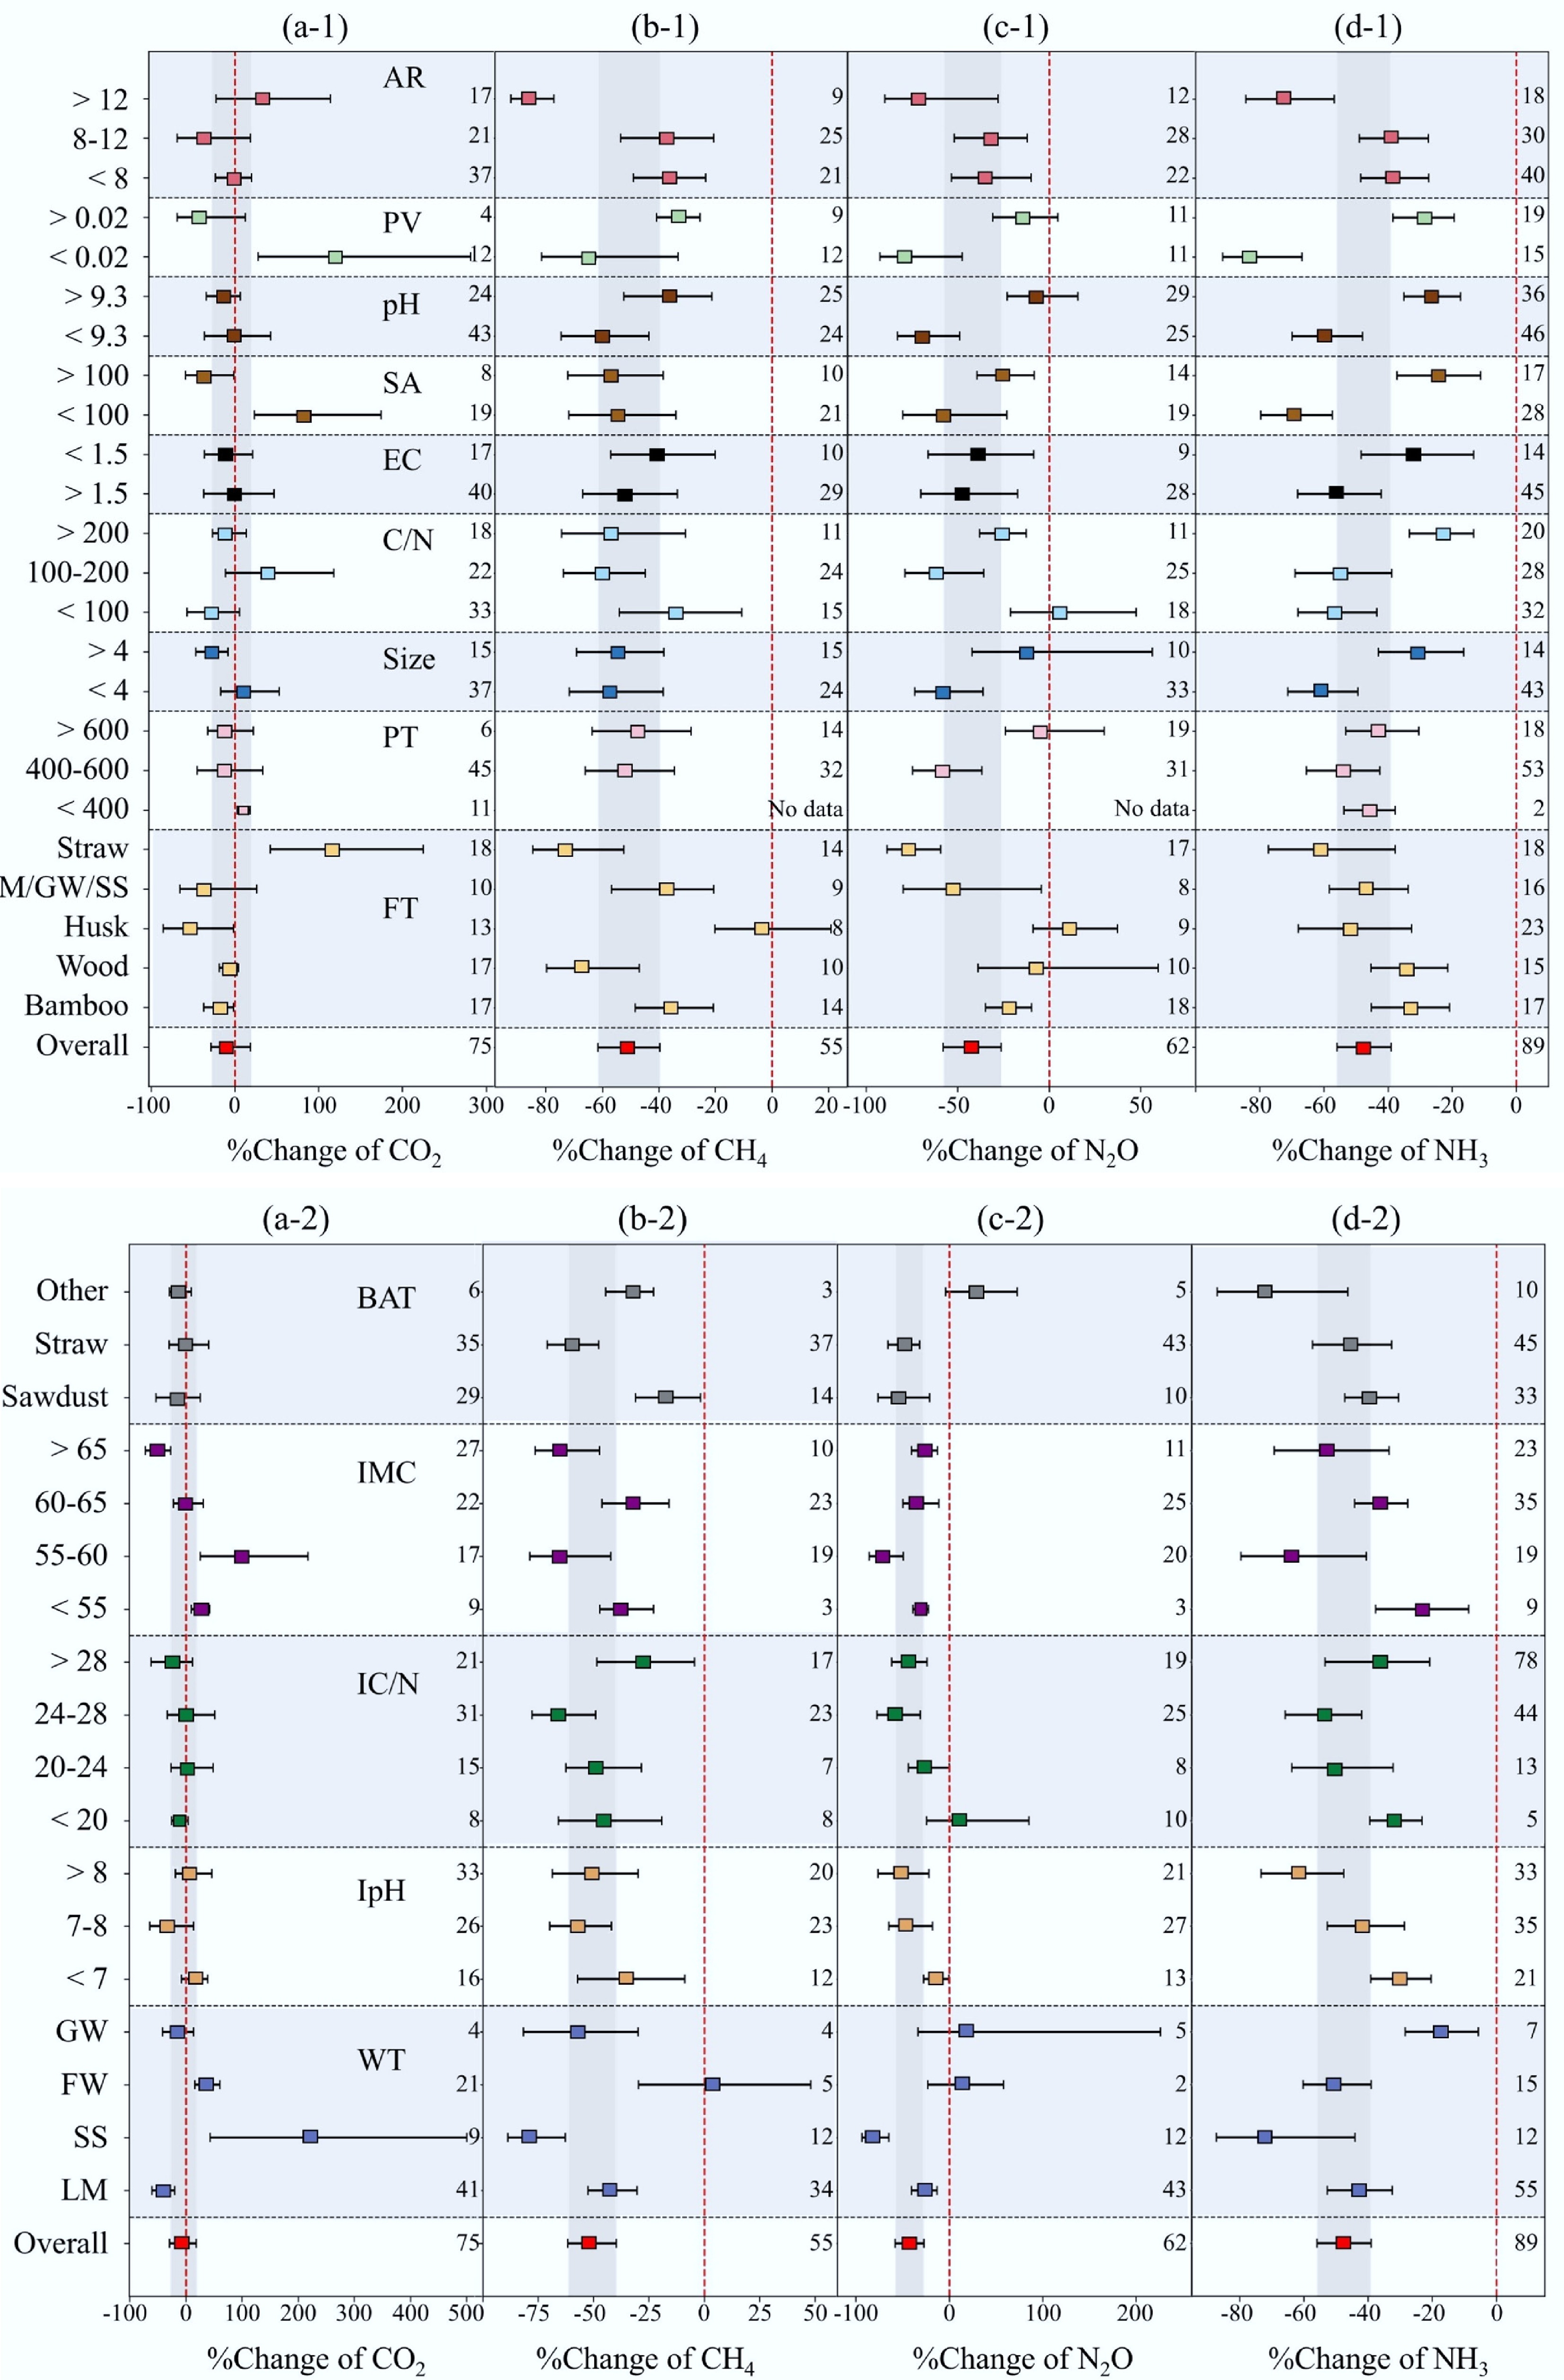
Figure 2.
Impact of (1) biochar, and (2) initial compost parameters on the external maturity indicators of compost. (a) CO2; (b) CH4; (c) N2O; (d) NH3. Note: the overall impact is shown at the bottom of each panel. The square represents the subgroup response value; the error bars represent the 95% confidence interval; and the vertical gray area represents the 95% confidence interval for the overall impact. The responses are displayed vertically according to the various categories of biochar properties. The numbers on the right side of the graph represent the amount of data observed for subgroups or overall dataset. (FT, feedstock type; PT, pyrolysis temperature; C/N, carbon to nitrogen; EC, electrical conductivity; SA, surface area; PV, pore volume; AR, amendment rate; WT, waste type; IpH, initial pH; IC/N, initial carbon to nitrogen; IMC, initial moisture content; BAT, bulking agent type).
-
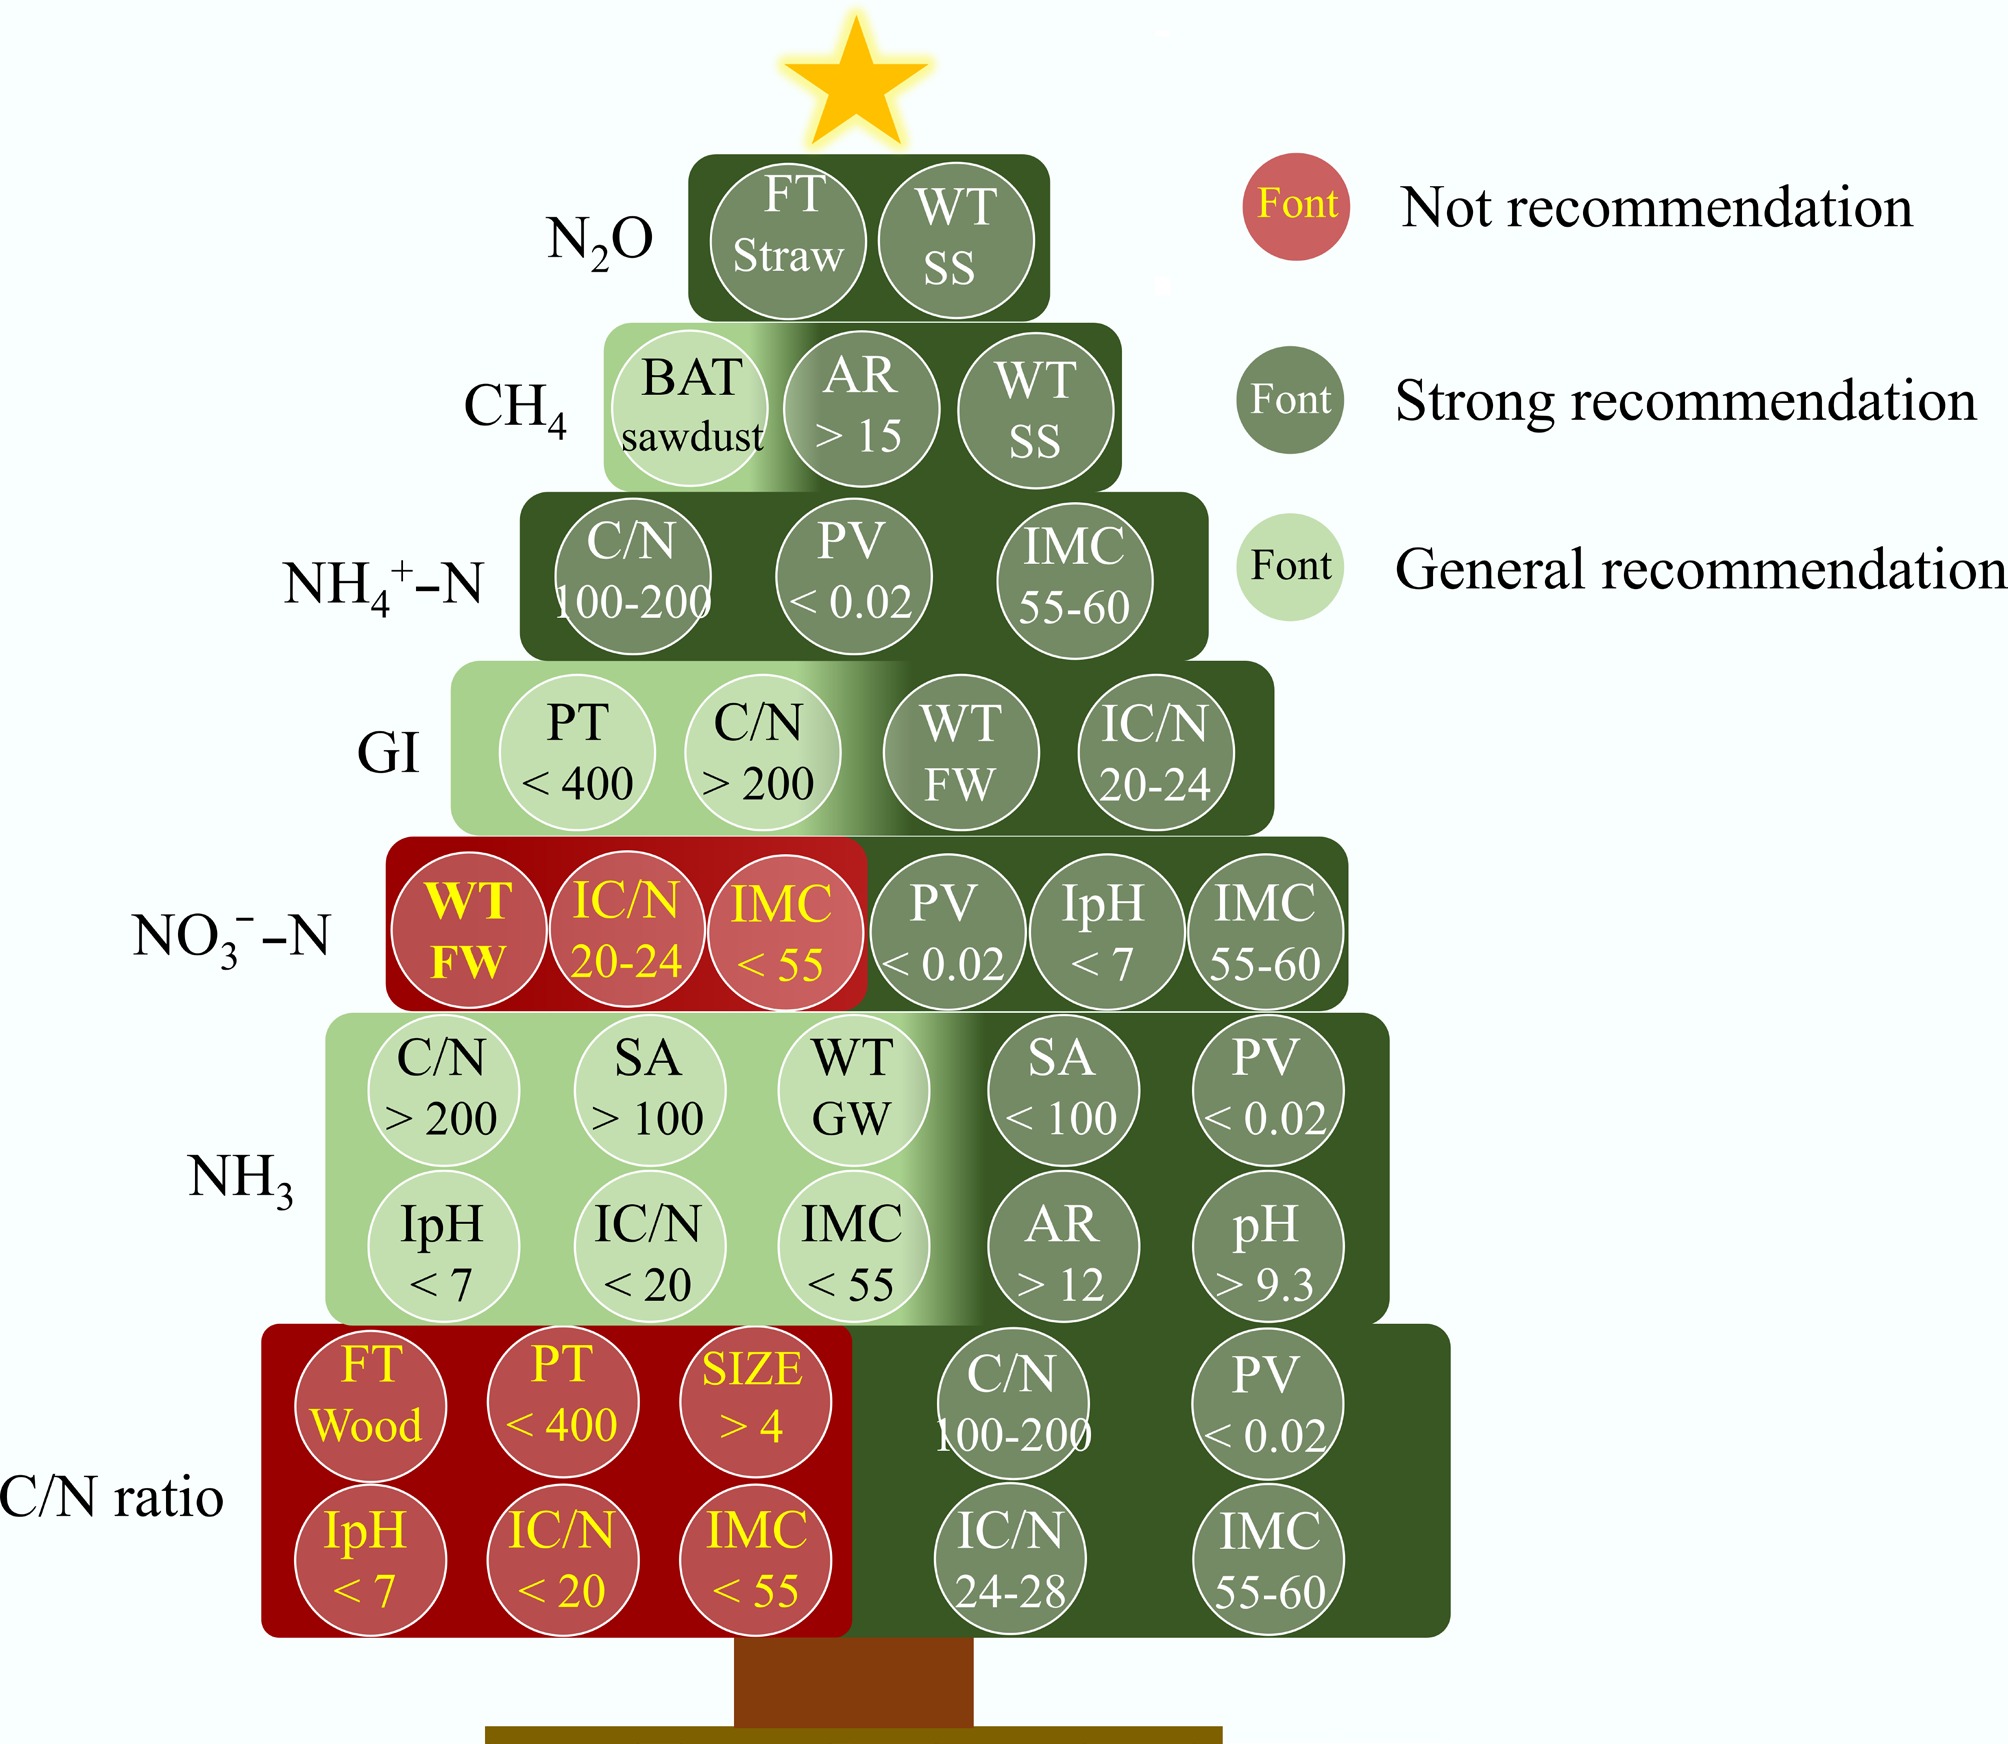
Figure 3.
Recommended properties of biochar and initial compost by considering the impact of seven compost maturity indicators based on forest map analysis. Note: CO2 is not included in this figure because it did not show statistical significance in the meta-analysis forest plots. FT, feedstock type; PT, pyrolysis temperature; C/N, carbon to nitrogen ratio; EC, electrical conductivity; SA, surface area; PV, pore volume; AR, amendment rate; WT, waste type; IpH, initial pH; IC/N, initial carbon to nitrogen ratio; IMC, initial moisture content; BAT, bulking agent type.
-
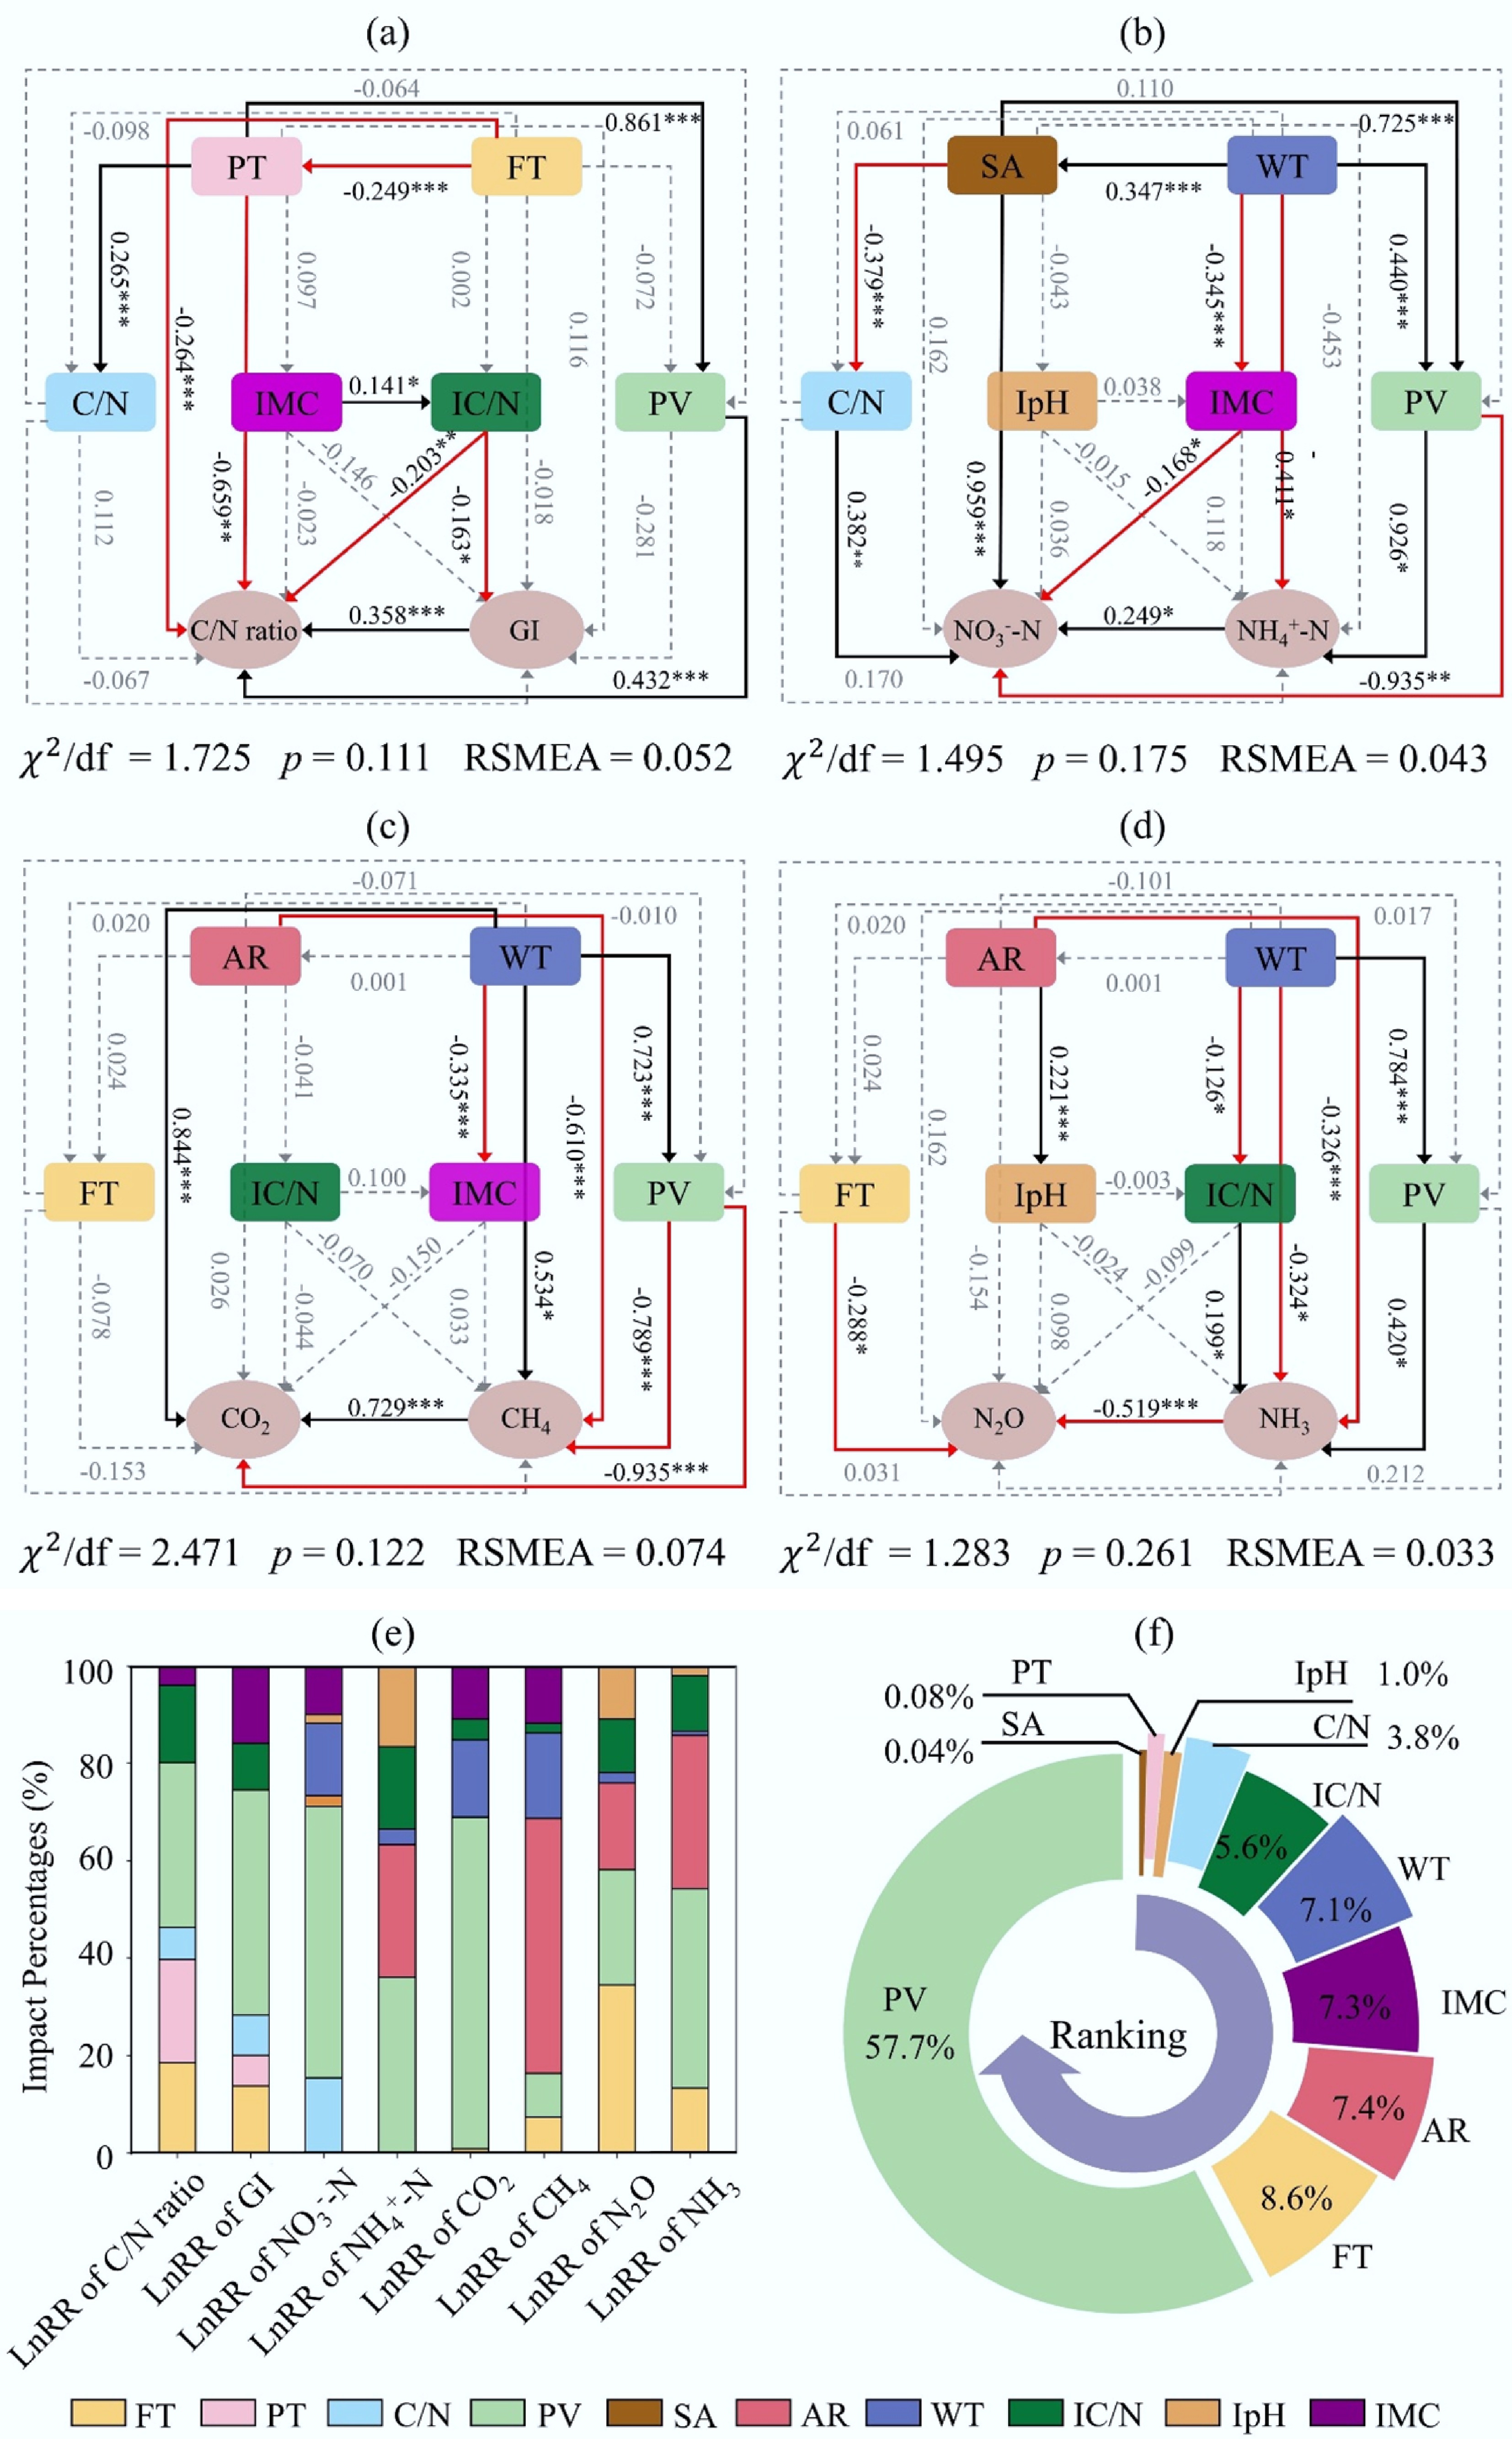
Figure 4.
Ranking of the key properties based on SEMs. (a)–(d) Establishment of SEMs integrating two maturity indicators. Note: the black and red solid arrows indicate significant positive and negative correlations, respectively; the dotted arrow indicates non-significant correlations; and the number next to the arrow is the normalized path coefficient (λ). Significance levels are: * p < 0.05, ** p < 0.01, *** p < 0.001. (e) Relative contribution of key impact properties to the eight individual indicators of compost maturity based on total standardized effects. (f) Ranking of key properties based on their percentage contributions to all eight compost maturity indicators, considering both direct and indirect effects.
-
Items Full name Abbreviation Value range Biochar properties Pyrolysis temperature PT 300−900 °C Size Size 0.074−50 mm Carbon to nitrogen C/N 4.521−856.38 Electrical conductivity EC 0.09−131 ms/cm Surface area SA 0.35−1,150 m2/g pH pH 3.05−11.39 Amendment rate AR 0%−70% Pore volume PV 0.0035−0.9 cm3/g Feedstock type FT Wood Straw Husk Bamboo Manure/green waste/sewage sludge Initial
compost parametersInitial carbon to nitrogen IC/N 6−50.15 Initial moisture content IMC 36.8%−78.73% Initial pH IpH 4.09−9.31 Waste type WT Livestock manure Sewage sludge Green waste Food waste Bulking agent type BAT Sawdust Straw Other bulking agents Compost maturity indicators Carbon to nitrogen ratio C/N ratio 5.78−48.1 Germination index GI 0.88%−186.44% Ammonium nitrogen NH4+−N 0.024−4910a Nitrate nitrogen NO3−−N 0.004−4230a Methane CH4 0.001−16968b Carbon dioxide CO2 0.001−34277b Nitrous oxide N2O 0.003−22664b Ammonia NH3 0.004−9881b a Unit g/Kg, mg/Kg, g, mg;b unit g/Kg, mg/Kg, g, mg, %, ppm. Value ranges are reported directly from the original studies and may include multiple units (e.g., g/kg, mg/kg, %, ppm). These data were not standardized, as the meta-analysis is based on relative changes rather than absolute values. Table 1.
Complete nomenclature and abbreviations for biochar properties, initial compost parameters, and indicators of compost maturity
Figures
(4)
Tables
(1)