-
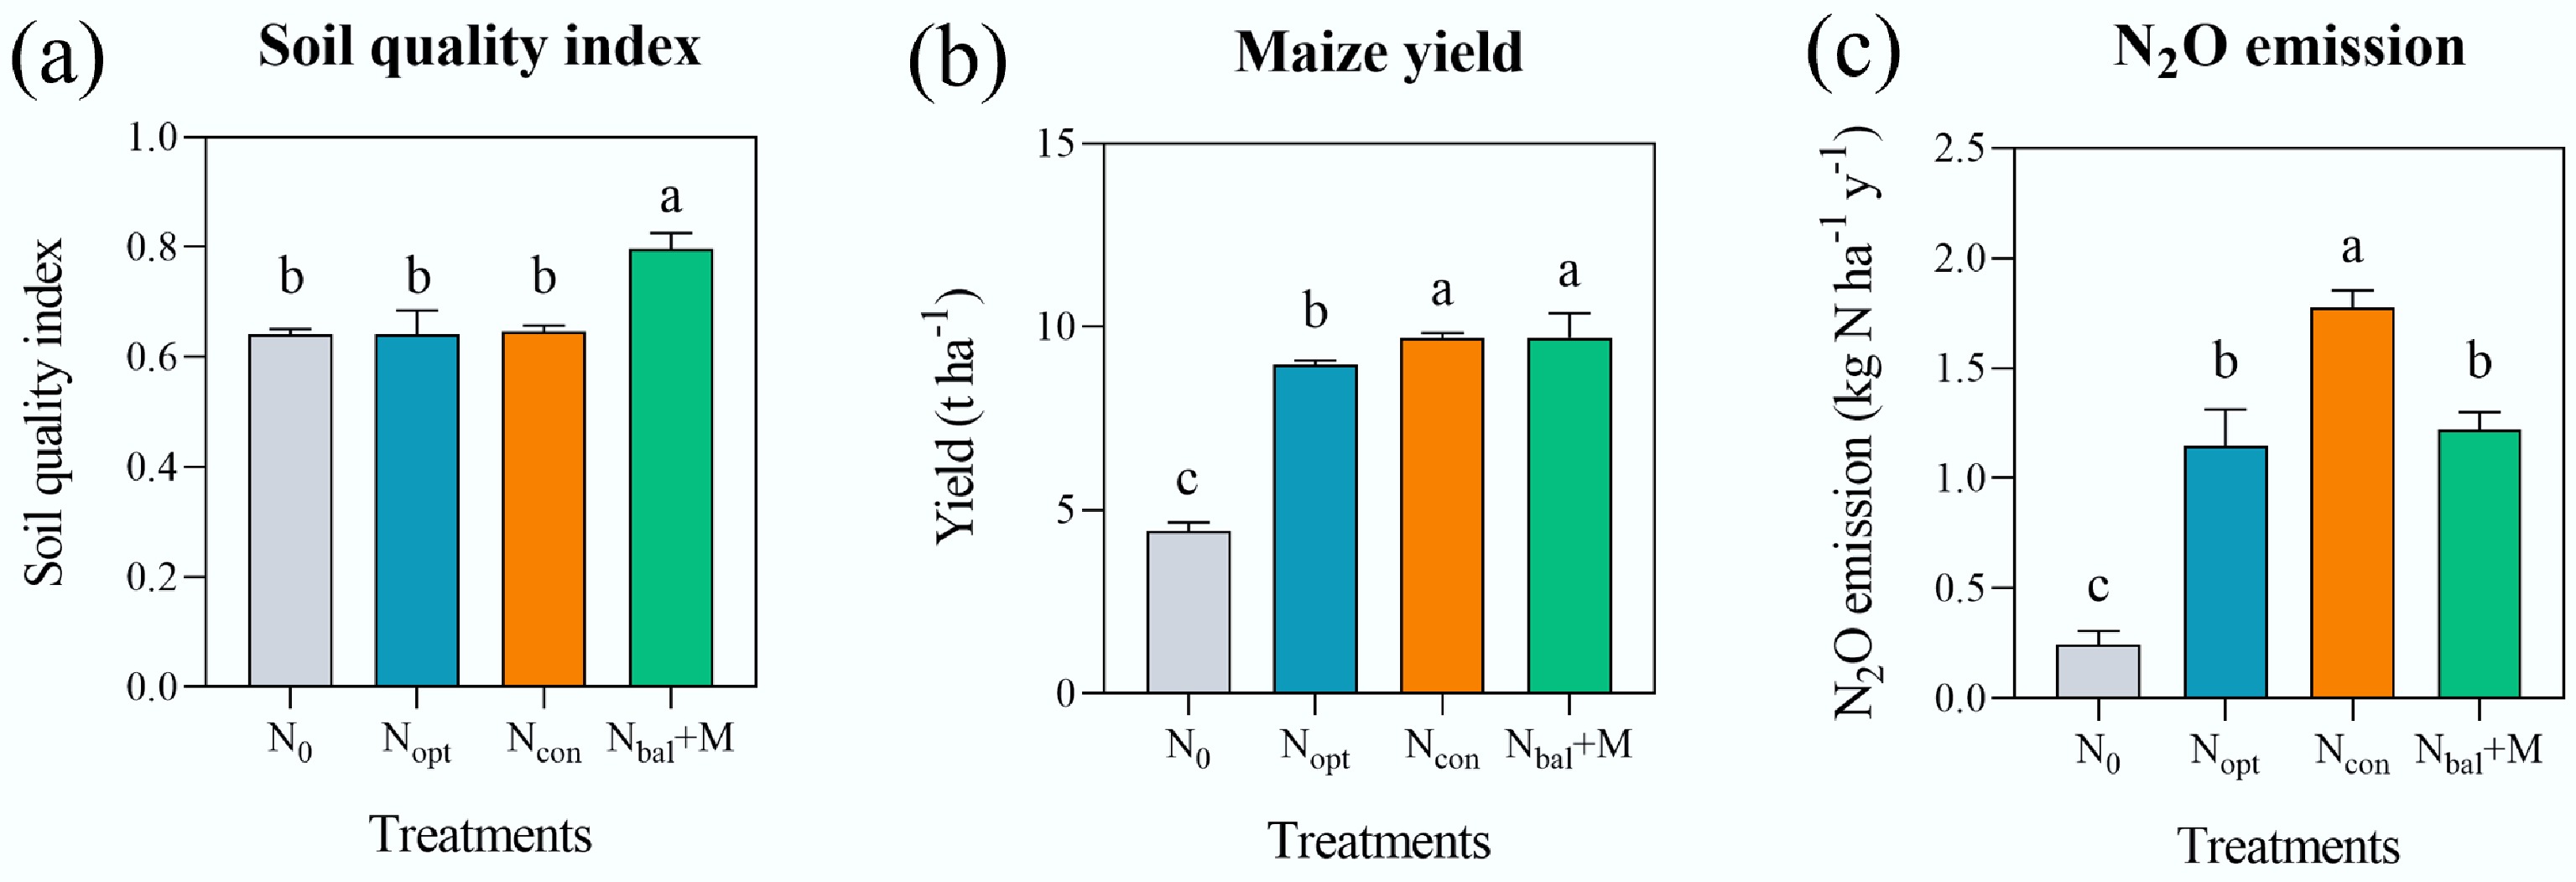
Figure 1.
(a) Soil quality index, (b) annual maize yield in 2022, and (c) average annual N2O emission from 2018 to 2019 under different fertilizer treatments. N0: no N, Ncon: conventional N, Nopt: optimal N, Nbal + M: balanced manure with synthetic N. Different letters indicate the significance among treatments at p < 0.05 level by one-way ANOVA. Error bars represent standard deviation (n = 3).
-
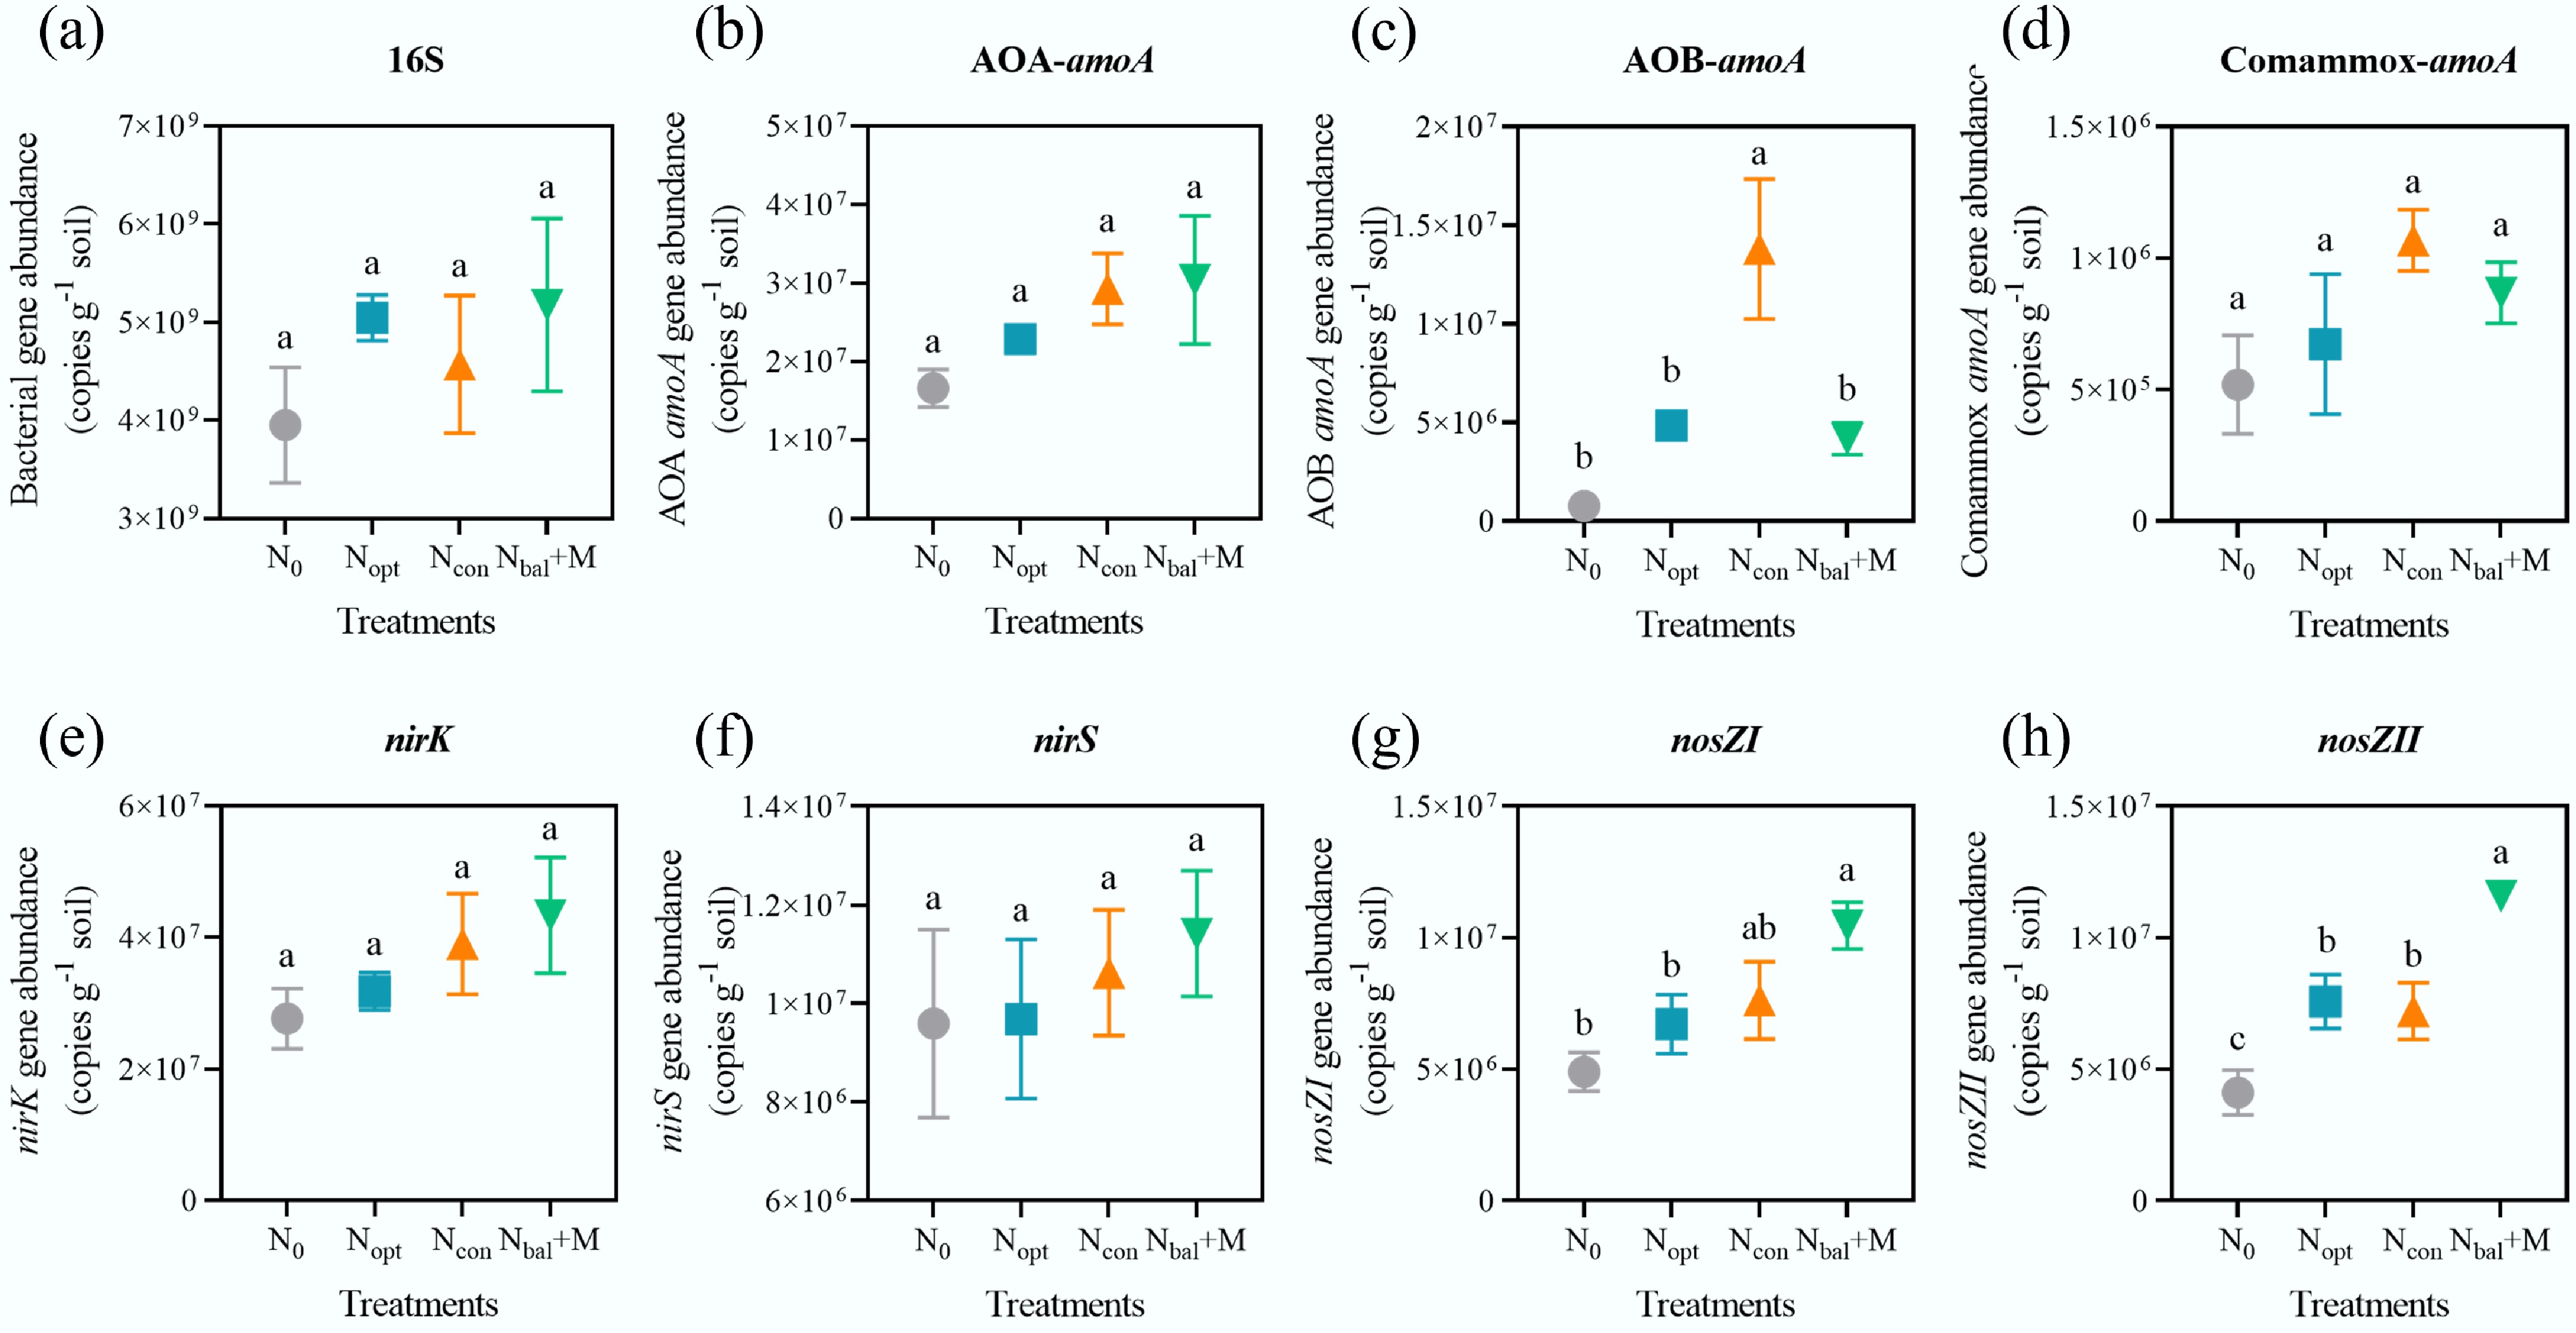
Figure 2.
Nitrogen cycling gene abundances under different fertilizer treatments. (a) 16S rDNA. (b) Archaeal amoA gene. (c) Bacterial amoA gene. (d) Comammox amoA gene. (e) nirK gene. (f) nirS gene. (g) nosZI gene. (h) nosZII gene. Different letters indicate the significance among treatments at p < 0.05 level by one-way ANOVA. Error bars represent standard deviation (n = 3).
-
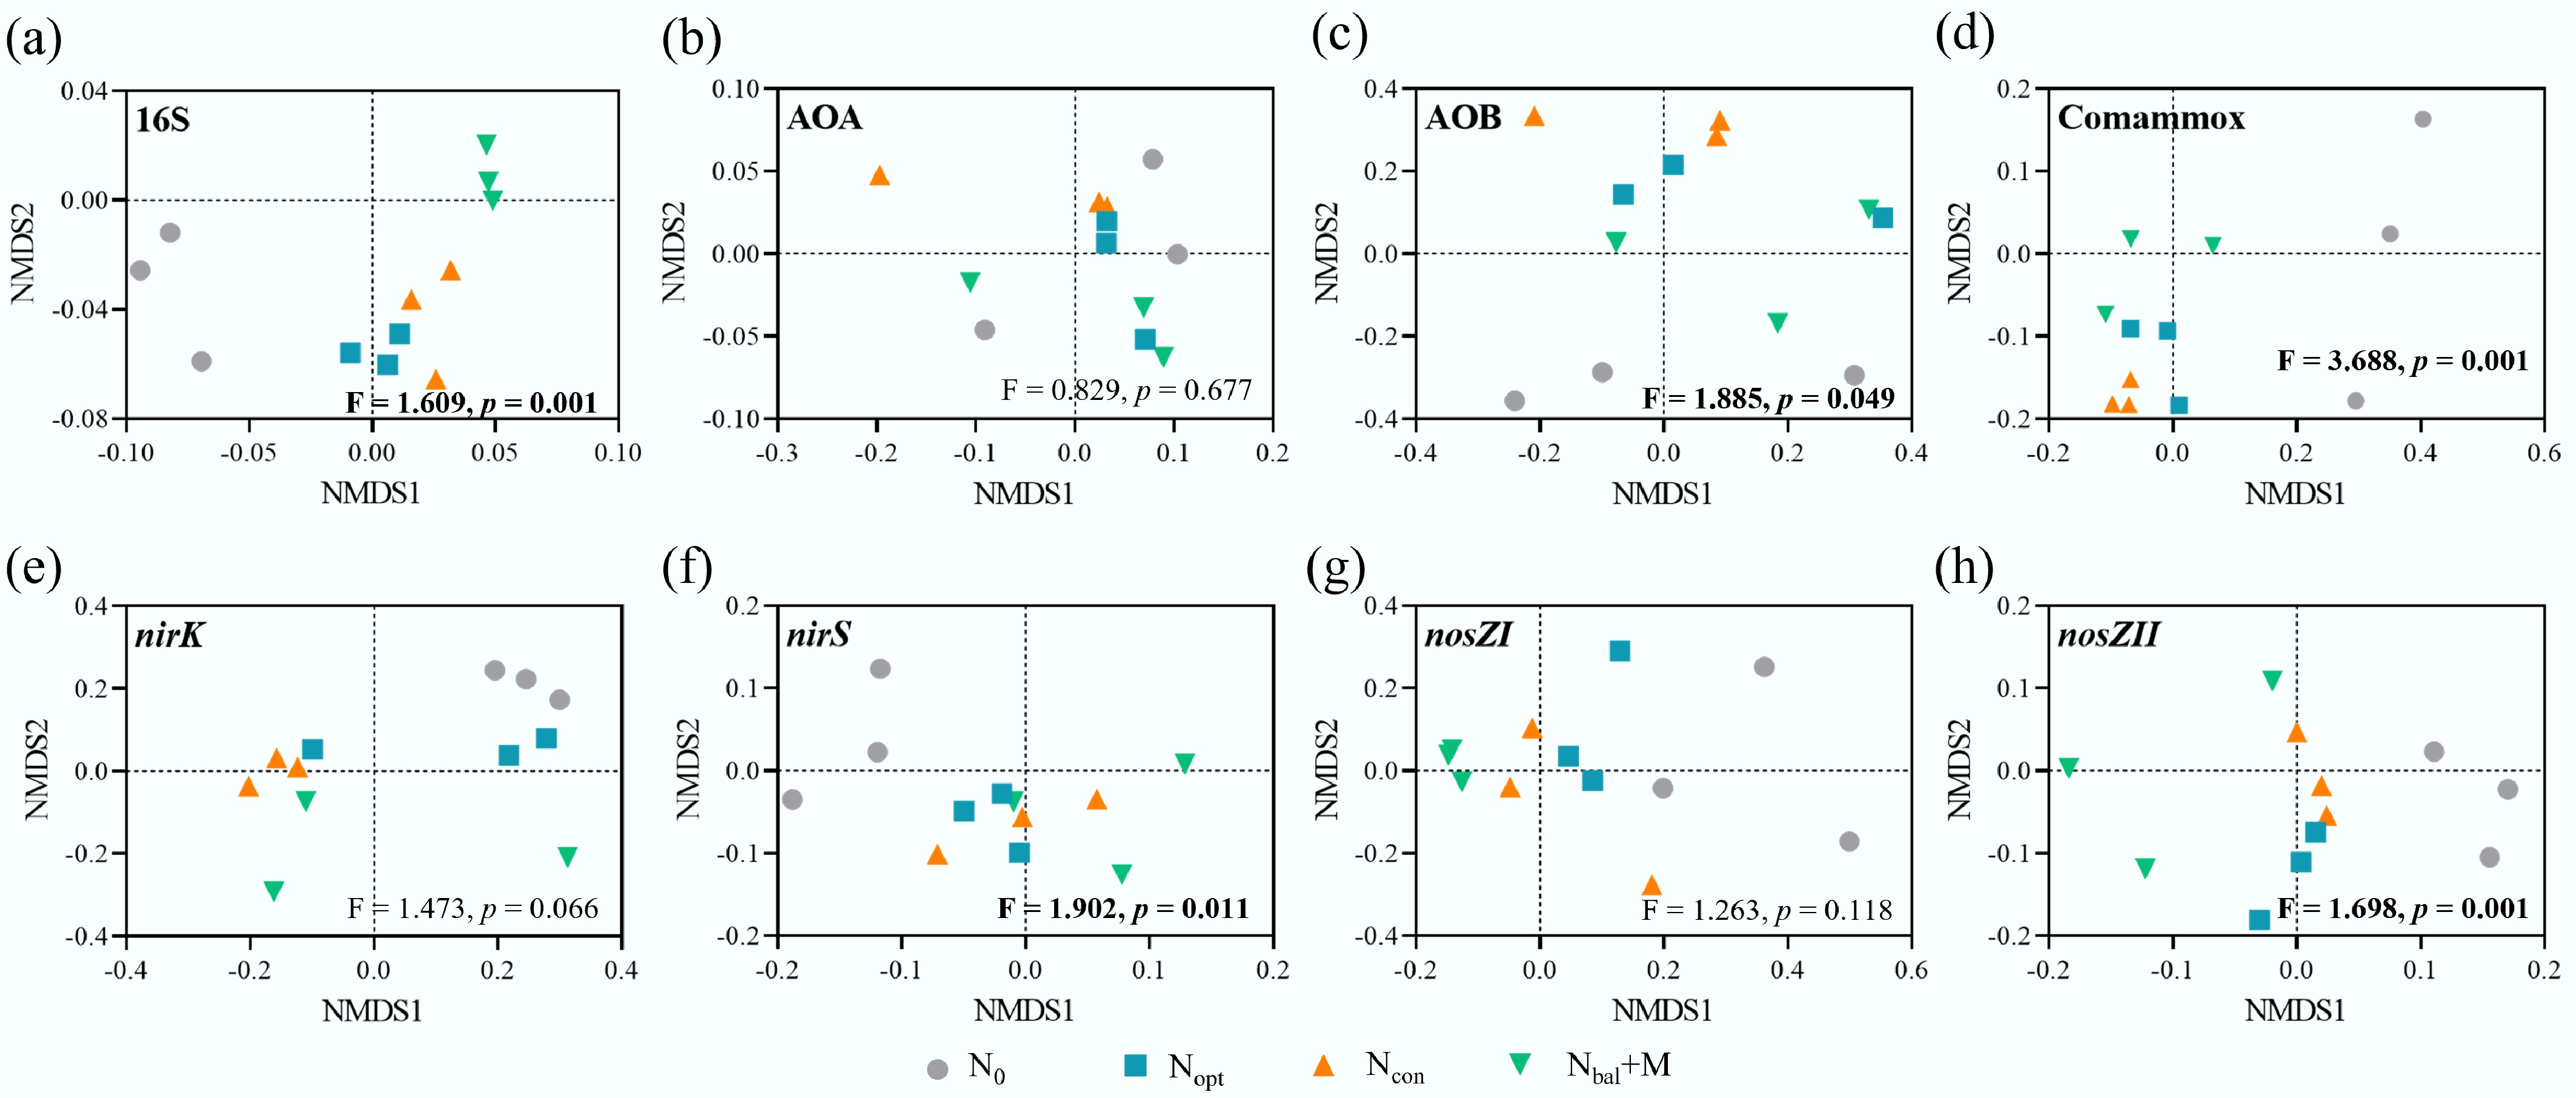
Figure 3.
Effects of different fertilizer treatments on nitrogen functional microbial communities based on NMDS. (a) 16S rDNA. (b) Archaeal amoA gene. (c) Bacterial amoA gene. (d) Comammox amoA gene. (e) nirK gene. (f) nirS gene. (g) nosZI gene. (h) nosZII gene. F- and p-values are based on dissimilarity test.
-
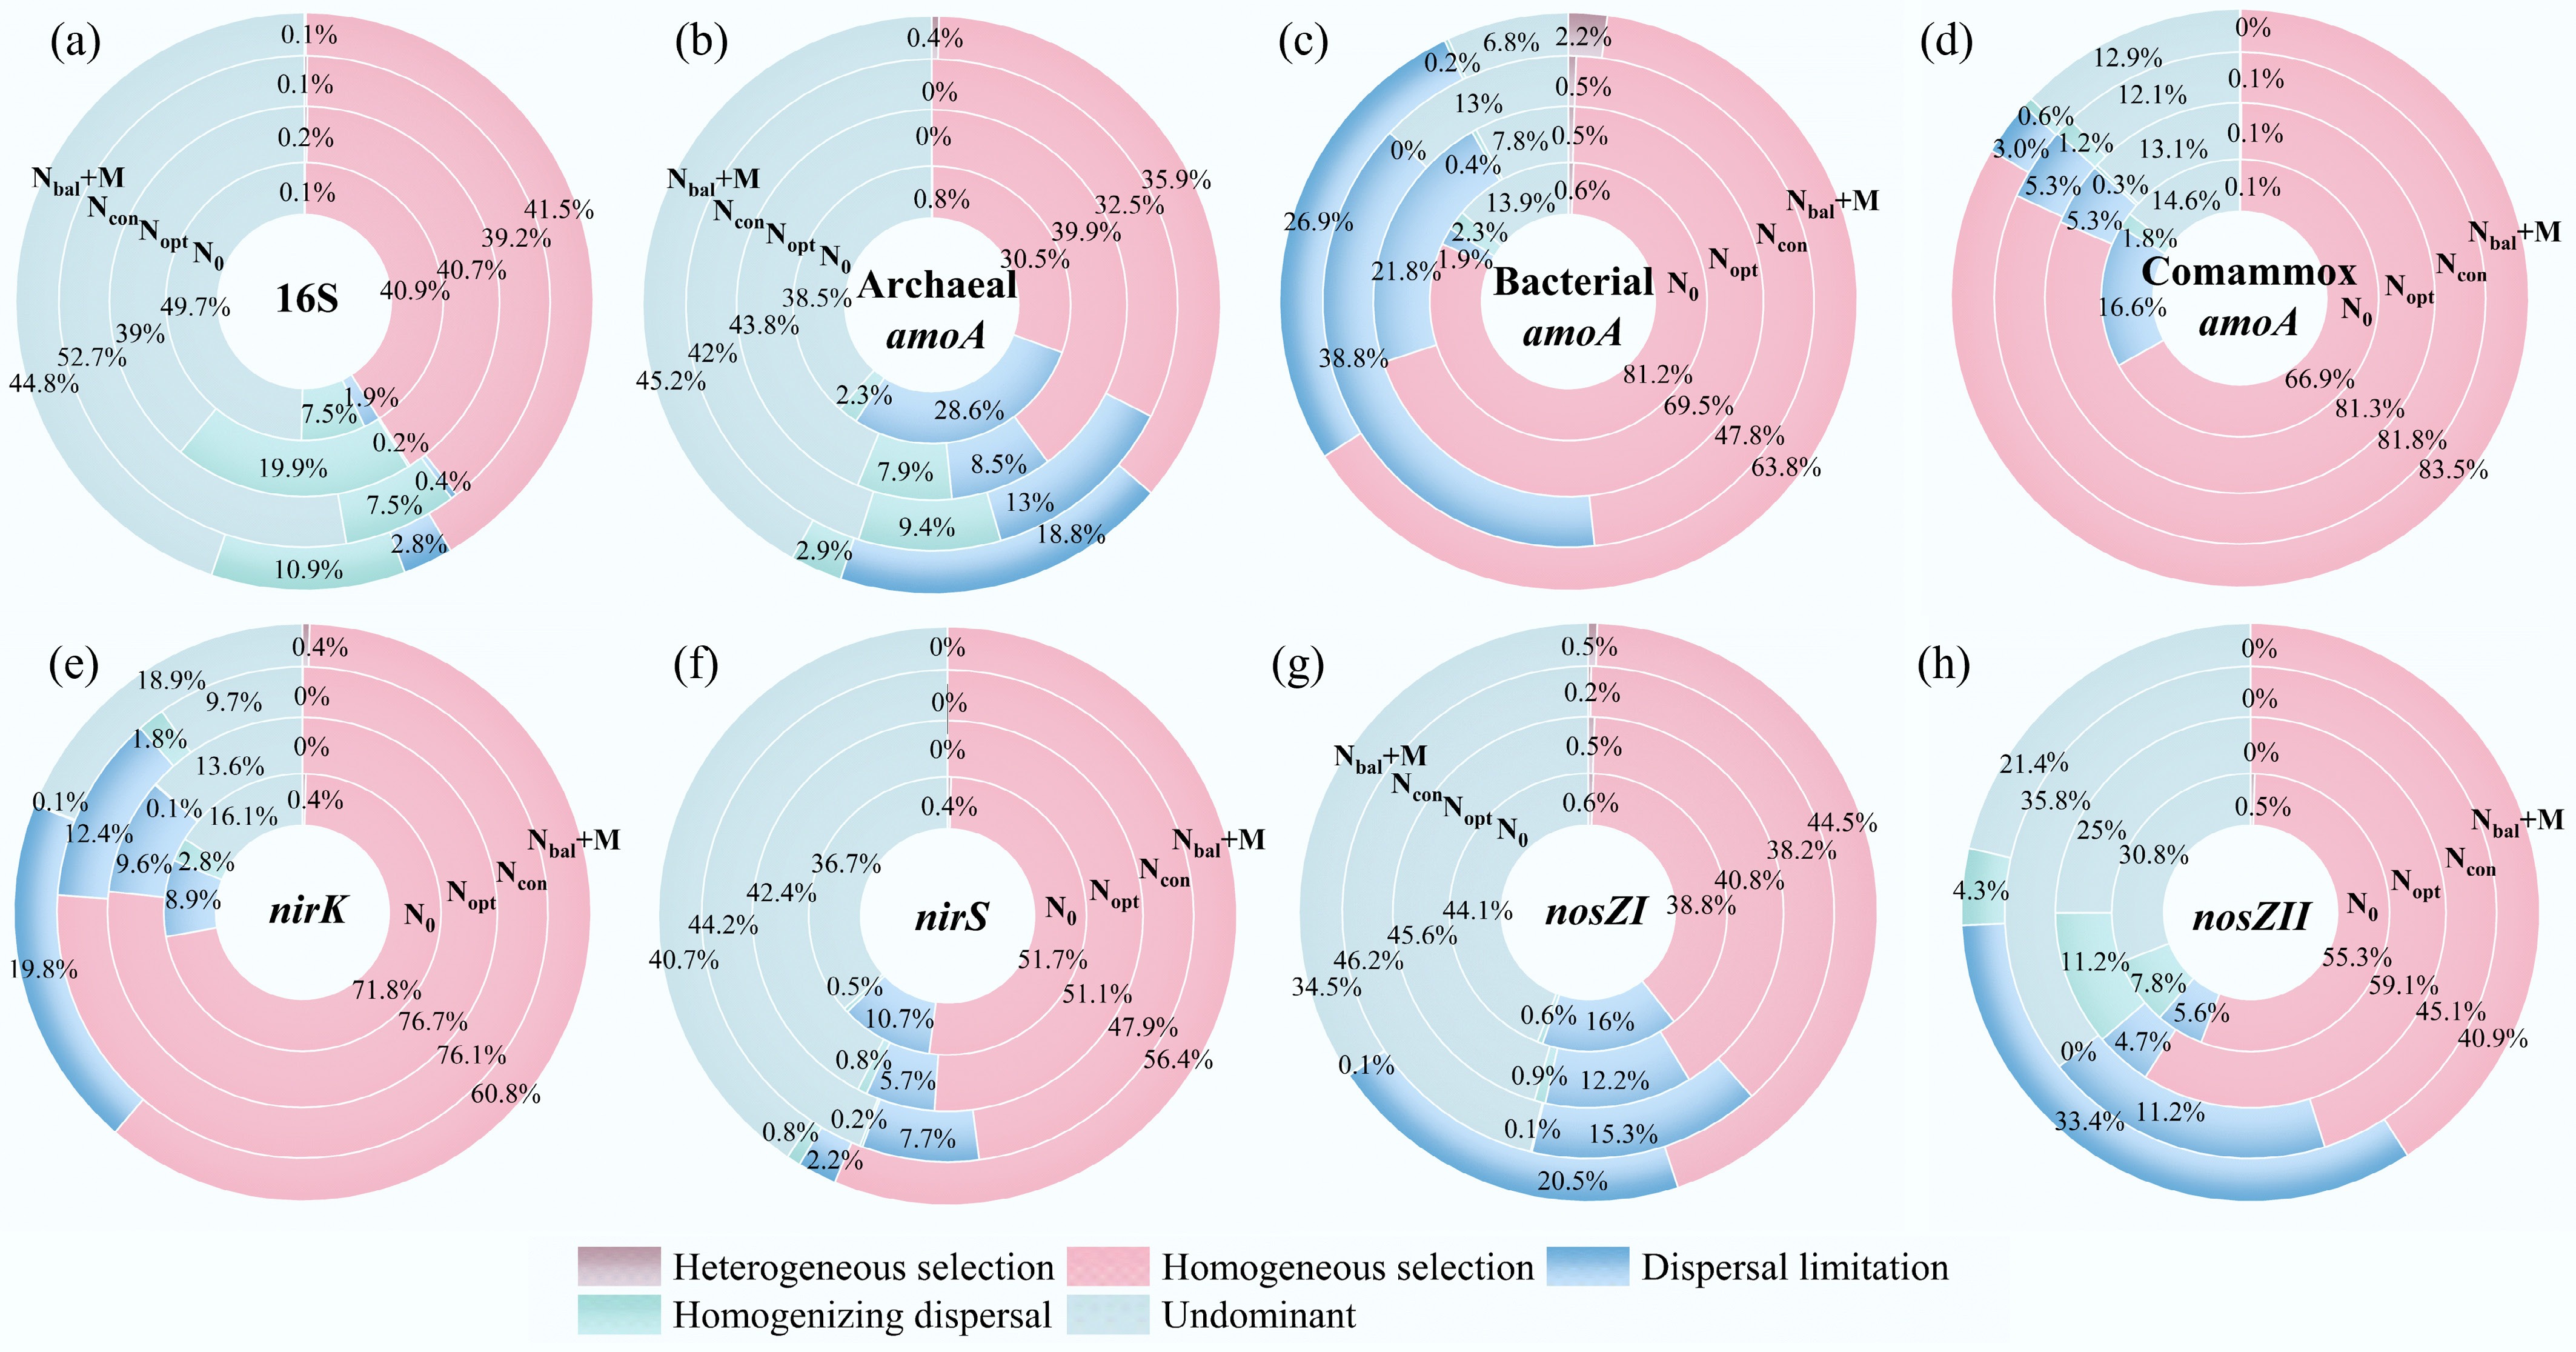
Figure 4.
Proportion of ecological processes for nitrogen functional microbial communities based on bootstrapping results (n = 1,000) from iCAMP. (a) 16S rDNA. (b) Archaeal amoA gene. (c) Bacterial amoA gene. (d) Comammox amoA gene. (e) nirK gene. (f) nirS gene. (g) nosZI gene. (h) nosZII gene. Undominant: drift and others.
-
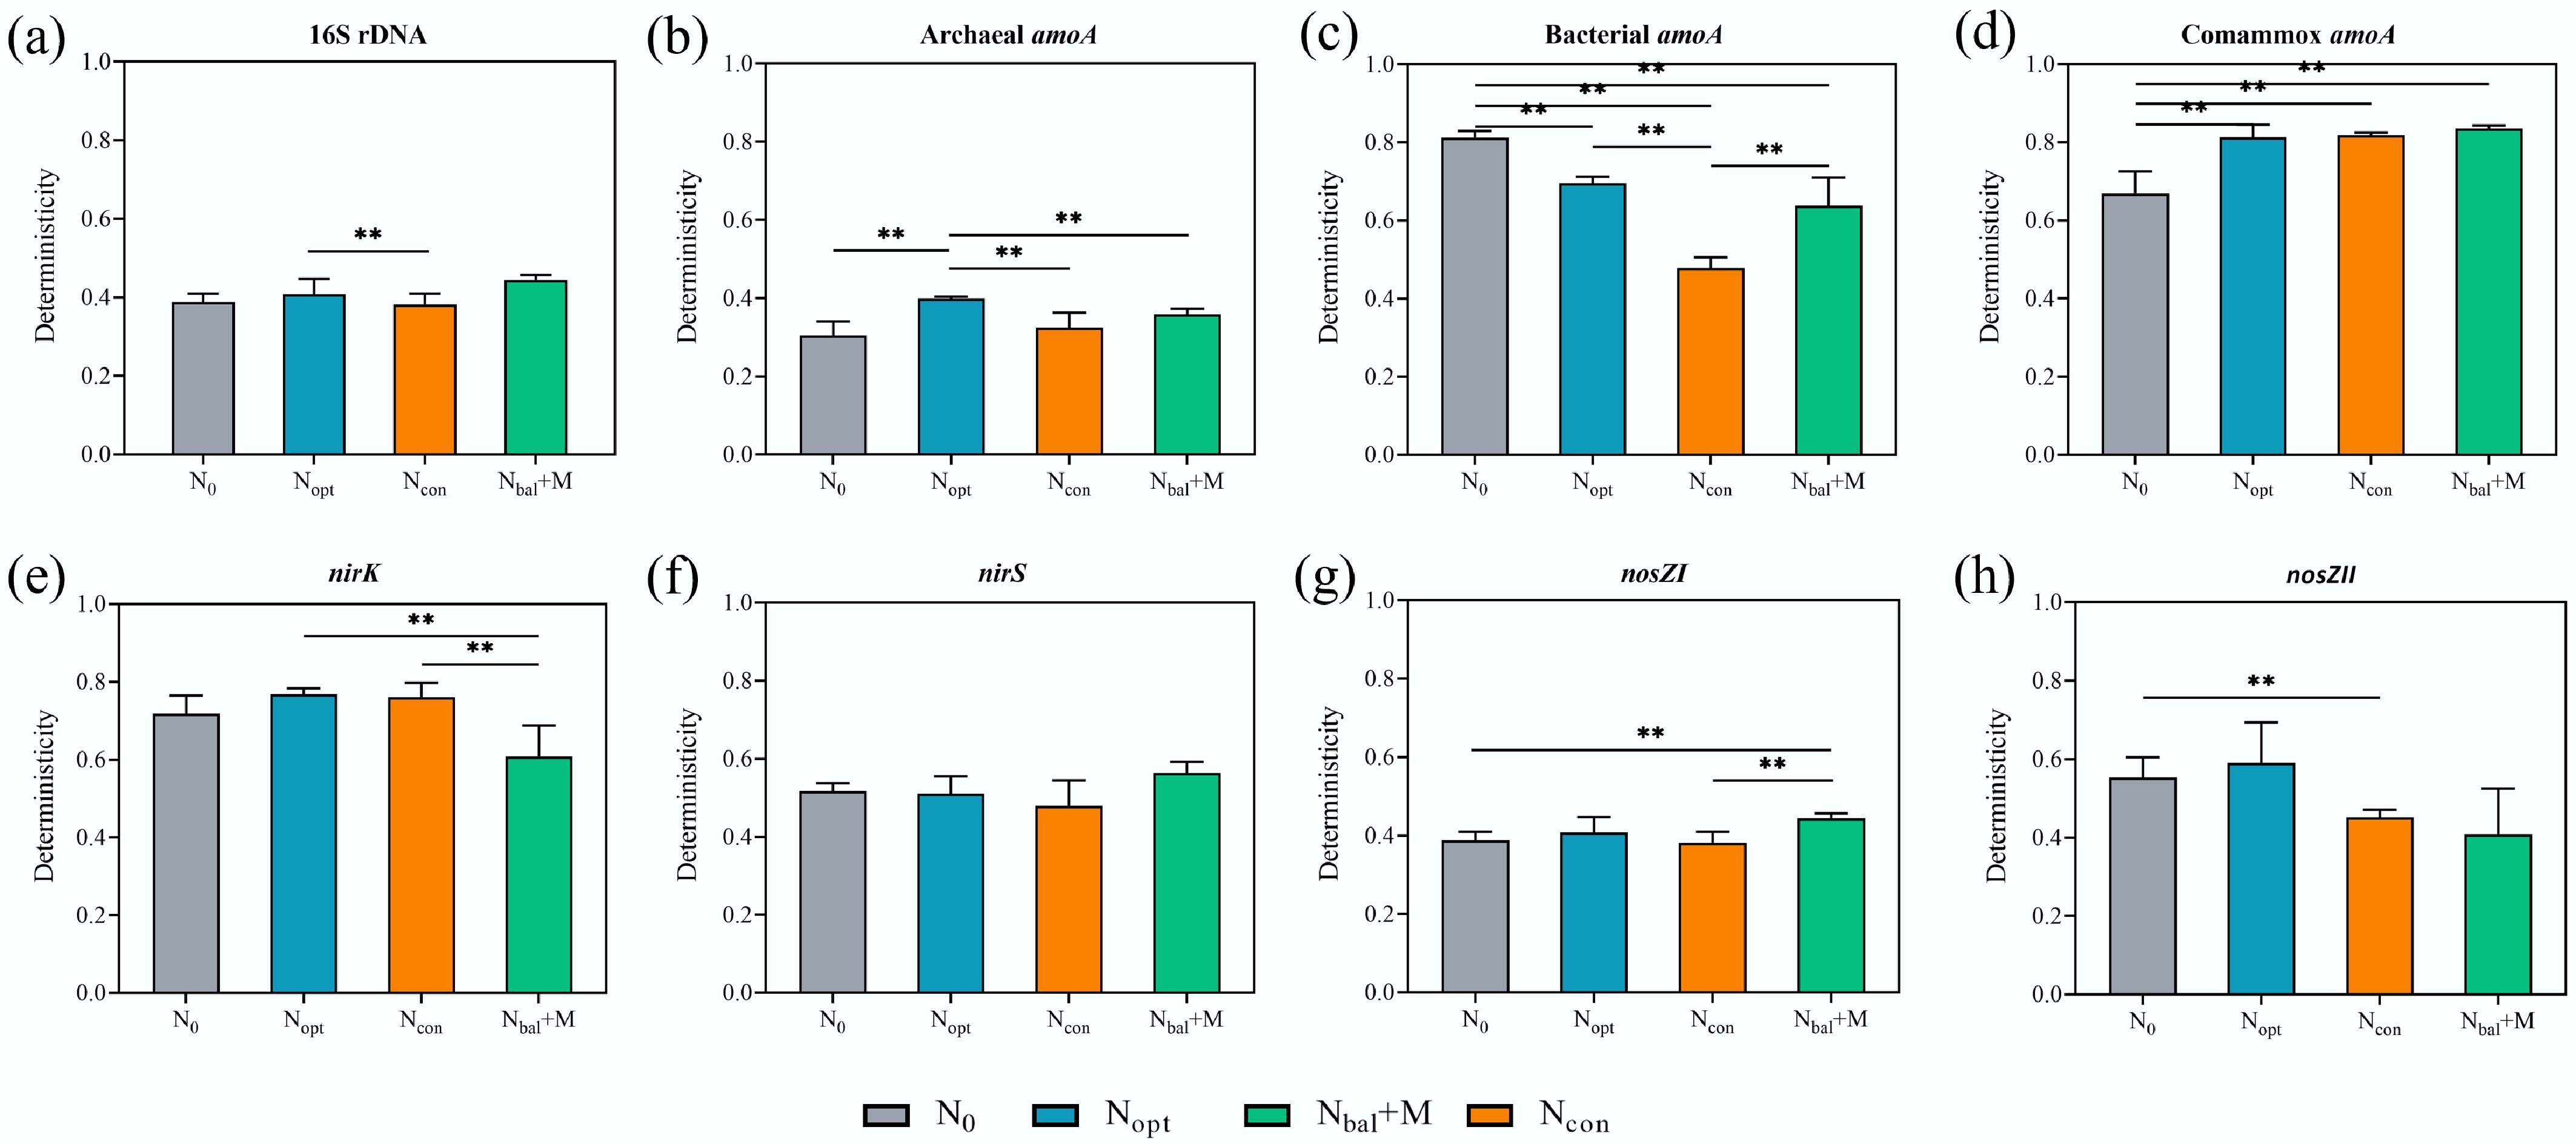
Figure 5.
Deterministicity (presented by homogeneous selection) portion comparison among different fertilizer treatments for nitrogen functional microbial communities based on iCAMP. (a) 16S rDNA. (b) Archaeal amoA gene. (c) Bacterial amoA gene. (d) Comammox amoA gene. (e) nirK gene. (f) nirS gene. (g) nosZI gene. (h) nosZII gene. ** p < 0.01, * p < 0.05. All comparisons show significant differences based on bootstrapping test (n = 1,000).
-
Treatment pH SOC
(g kg–1)TN
(g kg–1)C/N Olsen P
(mg kg–1)AK
(mg kg–1)NH4+-N
(mg kg–1)NO3–-N
(mg kg–1)PNR
(mg N kg–1 h–1)PDR
(mg N kg–1 h–1)N0 7.96 ± 0.05 a 6.68 ± 0.19 c 0.72 ± 0.02 c 9.28 ± 0.08 a 28.26 ± 1.36 bc 93.94 ± 4.42 b 0.6 ± 0.06 b 3.03 ± 0.39 b 11.91 ± 1.58 b 0.55 ± 0.07 c Nopt 7.98 ± 0.03 a 7.6 ± 0.6 bc 0.88 ± 0.11 bc 8.74 ± 0.36 a 17.09 ± 1.23 c 116.04 ± 26.8 a 0.91 ± 0.19 a 8.81 ± 1.43 ab 39.58 ± 2.17 ab 0.70 ± 0.03 bc Ncon 7.94 ± 0.02 a 7.65 ± 0.47 bc 0.88 ± 0.02 bc 8.66 ± 0.52 a 19.72 ± 2.3 c 92.83 ± 3.32 b 0.94 ± 0.11 a 9.47 ± 1.99 a 41.44 ± 2.12 ab 0.86 ± 0.04 b Nbal + M 7.97 ± 0.01 a 10.33 ± 0.28 a 1.2 ± 0.05 a 8.62 ± 0.34 a 47.9 ± 1.74 a 113.83 ± 5.85 ab 0.85 ± 0.05 ab 8.75 ± 3.57 ab 47.25 ± 1.92 a 1.15 ± 0.06 a SOC, soil organic carbon; TN, total nitrogen content; AK, available K; NH4+–N, ammonium content; NO3––N, nitrate content; PNR, potential nitrification rate; PDR, potential denitrification rate. Different letters indicate the significance among treatments at p < 0.05 level by one-way ANOVA. Error bars represent standard deviation (n = 3). Table 1.
Soil properties under different fertilizer treatments while sampling in 2022
-
16S AOA AOB Comammox nirK nirS nosZI nosZII r P r P r P r P r P r P r P r P N2O (kg N ha−1 y−1) 0.456 0.007 −0.004 0.439 0.343 0.017 0.733 0.001 0.134 0.194 0.438 0.004 0.293 0.044 0.199 0.118 pH 0.053 0.409 −0.122 0.743 −0.078 0.659 0.200 0.126 −0.080 0.606 0.007 0.461 0.462 0.008 −0.099 0.658 SOC (g kg−1) 0.434 0.008 0.089 0.273 −0.125 0.781 0.201 0.077 0.280 0.045 0.076 0.313 0.199 0.113 0.427 0.010 TN (g kg−1 0.477 0.001 0.014 0.374 −0.135 0.813 0.266 0.053 0.379 0.012 0.009 0.462 0.154 0.161 0.411 0.006 C/ N ratio −0.046 0.570 −0.248 0.992 −0.188 0.908 −0.003 0.457 −0.035 0.529 −0.193 0.880 −0.050 0.561 −0.107 0.710 Olsen P (mg kg−1) 0.336 0.036 0.109 0.223 −0.011 0.407 0.098 0.202 0.288 0.049 −0.023 0.565 −0.002 0.503 0.480 0.007 AK (mg kg−1) 0.017 0.530 −0.236 0.905 -0.314 0.999 −0.292 0.963 -0.187 0.787 -0.317 0.933 −0.321 0.975 −0.294 0.841 NH4+−N (mg kg−1) 0.100 0.253 −0.239 0.972 −0.067 0.636 0.113 0.216 −0.094 0.698 0.044 0.365 −0.054 0.582 −0.260 0.945 NO3−−N (mg kg−1) 0.183 0.141 −0.031 0.516 0.000 0.433 0.312 0.047 −0.008 0.506 0.223 0.101 0.021 0.408 −0.008 0.486 PNR (mg N kg−1 h−1) 0.602 0.004 0.060 0.303 0.129 0.228 0.795 0.003 0.318 0.042 0.459 0.005 0.471 0.008 0.320 0.045 PDR (mg N kg−1 h−1) 0.626 0.001 0.053 0.339 0.093 0.253 0.492 0.006 0.465 0.008 0.252 0.061 0.191 0.147 0.564 0.002 SOC, soil organic carbon; TN, total nitrogen content; AK, available K; NH4+−N, ammonium content; NO−−N, nitrate content; PNR, potential nitrification rate; PDR, potential denitrification rate. p-values shown in bold are significant at the 0.05 level. Table 2.
Mantel test of N2O, soil properties with nitrogen functional microbial communities
Figures
(5)
Tables
(2)