-
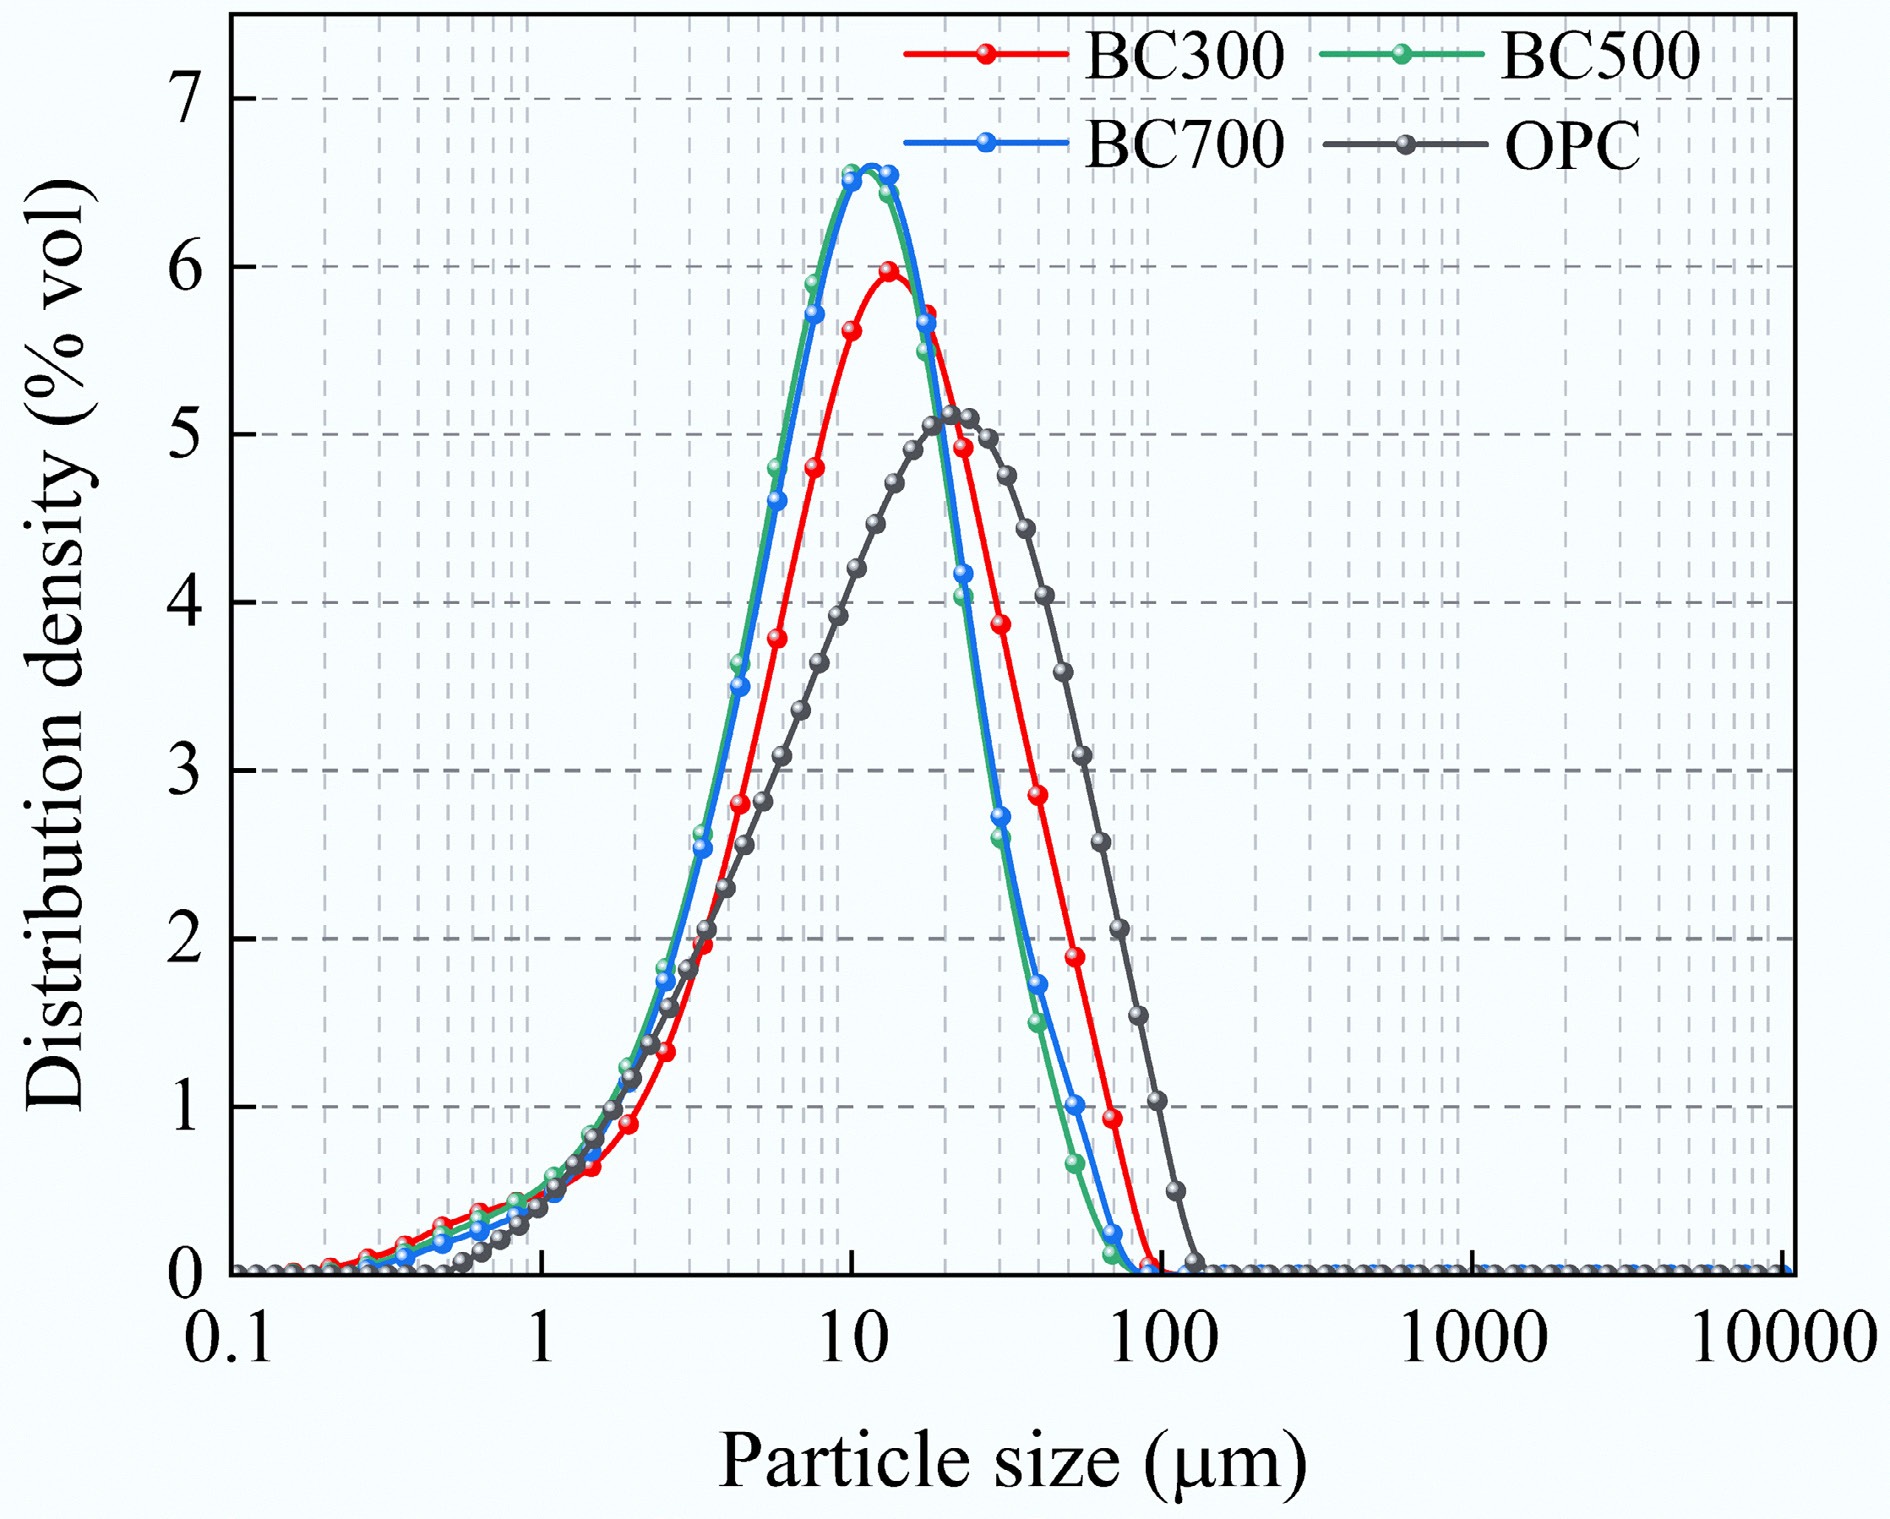
Figure 1.
Particle size distribution of BC300, BC500, BC700, and OPC.
-
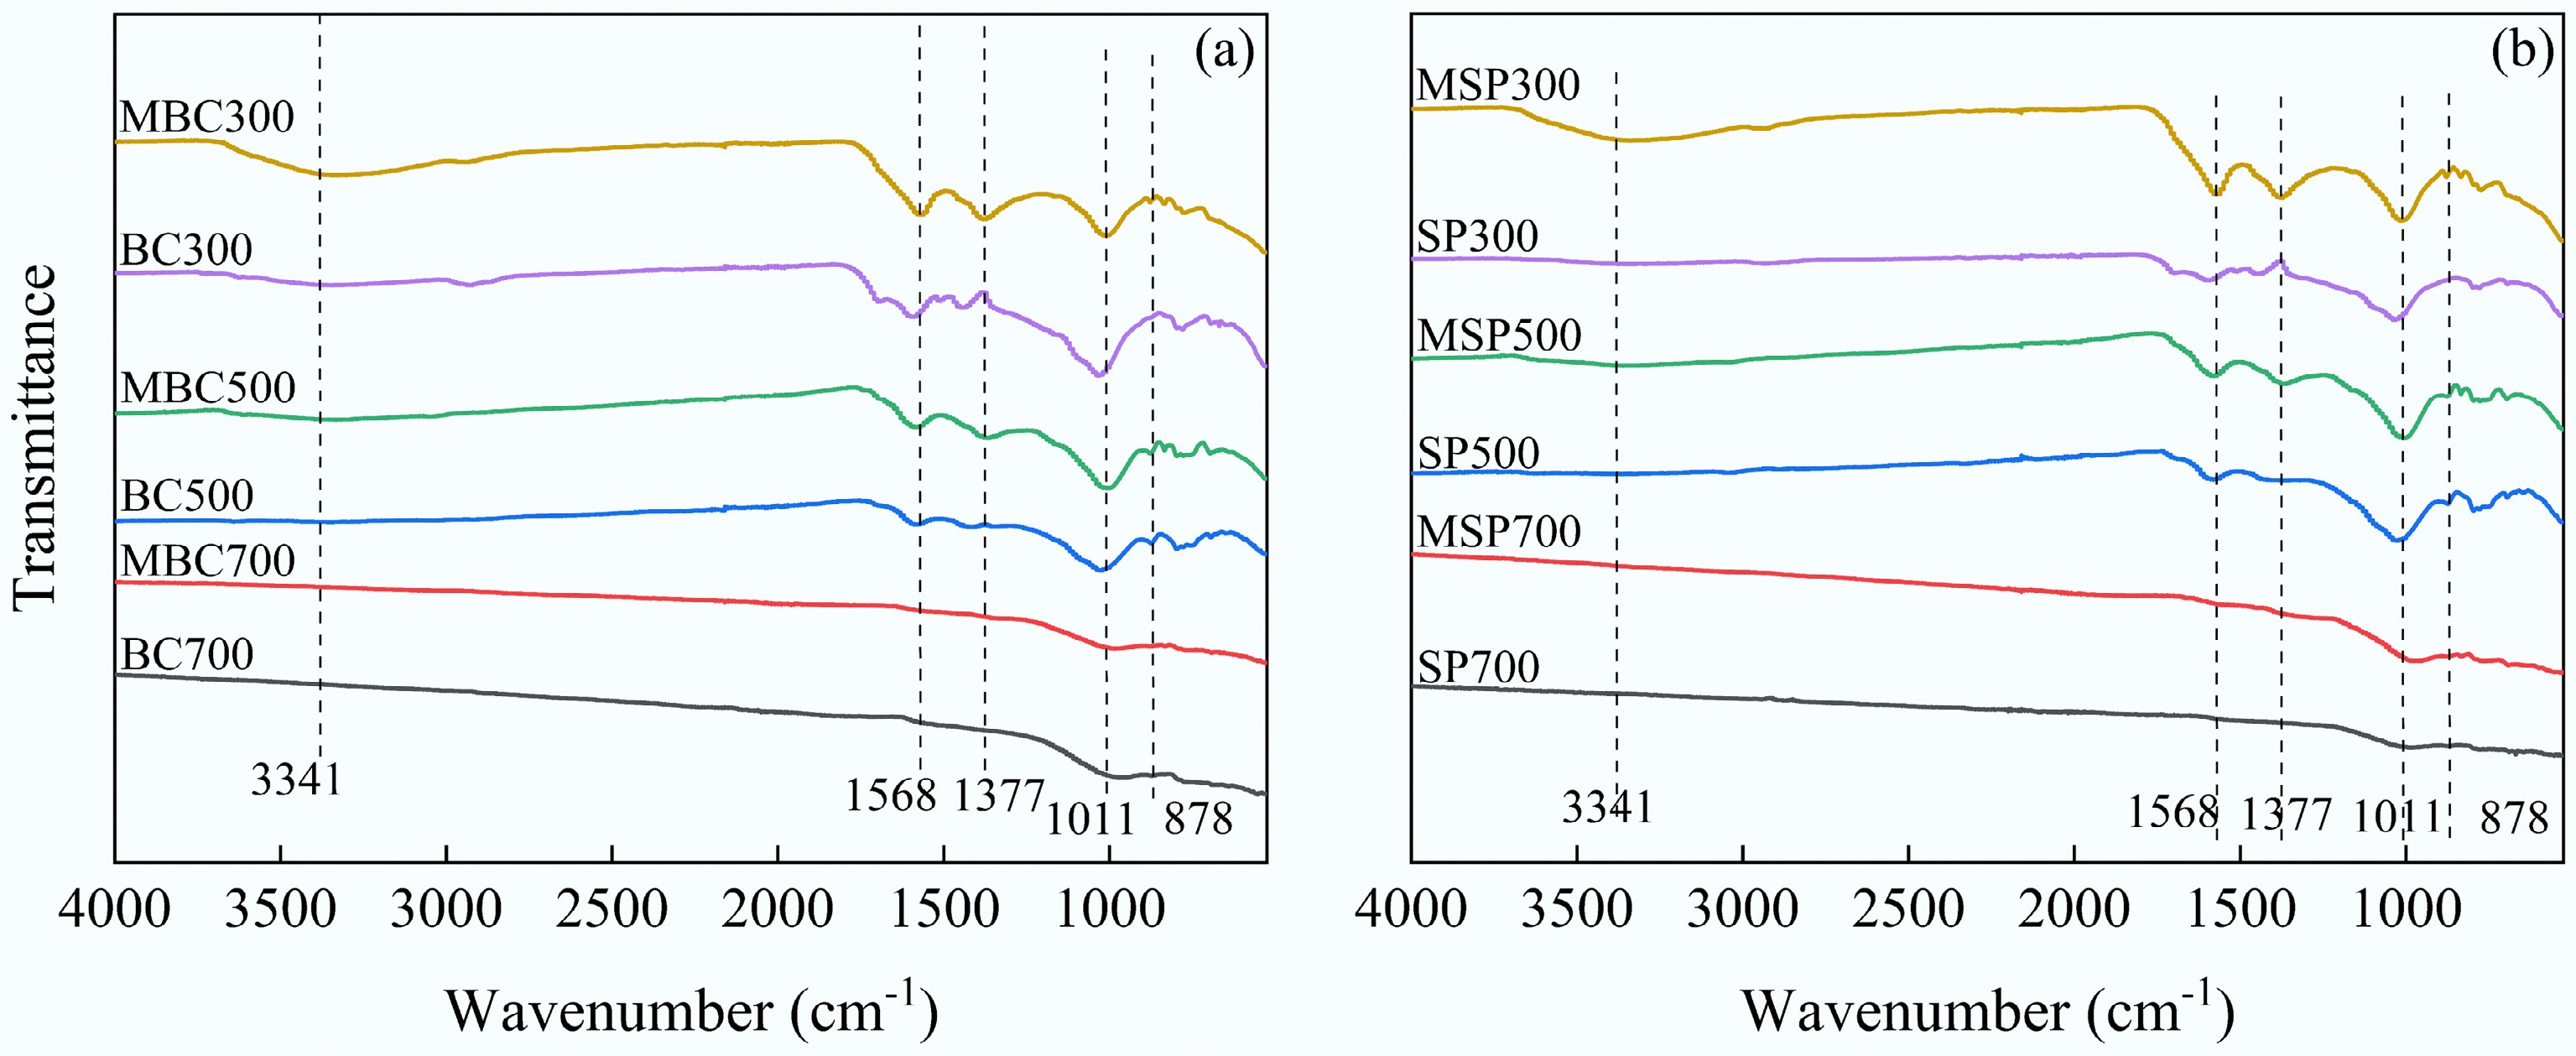
Figure 2.
Results of FTIR of (a) modified original biochar, and (b) modified SP.
-
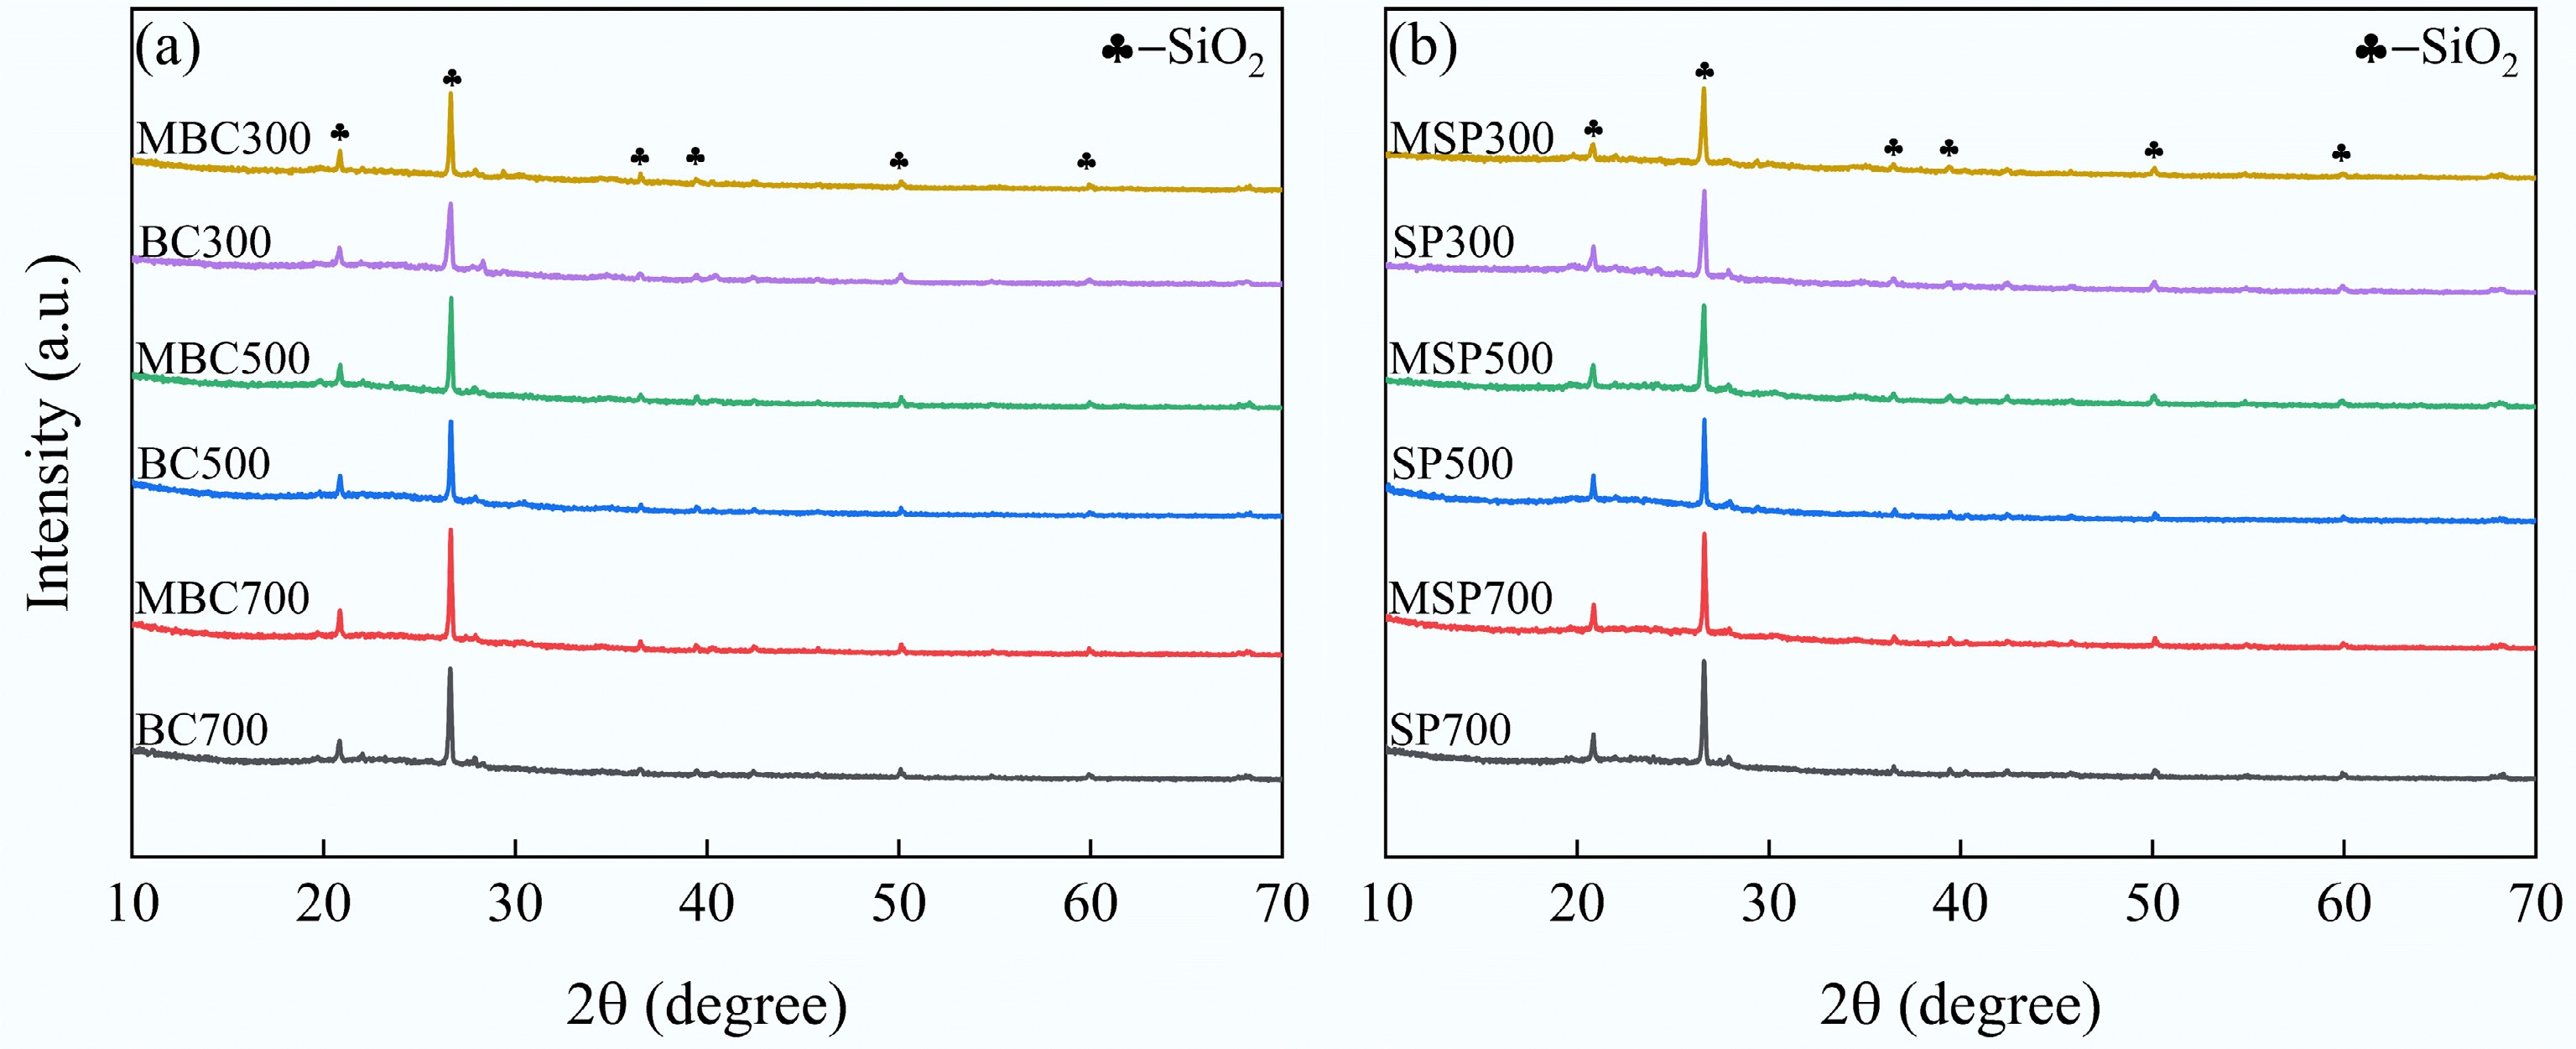
Figure 3.
Results of XRD of (a) modified original biochar, and (b) modified SP.
-
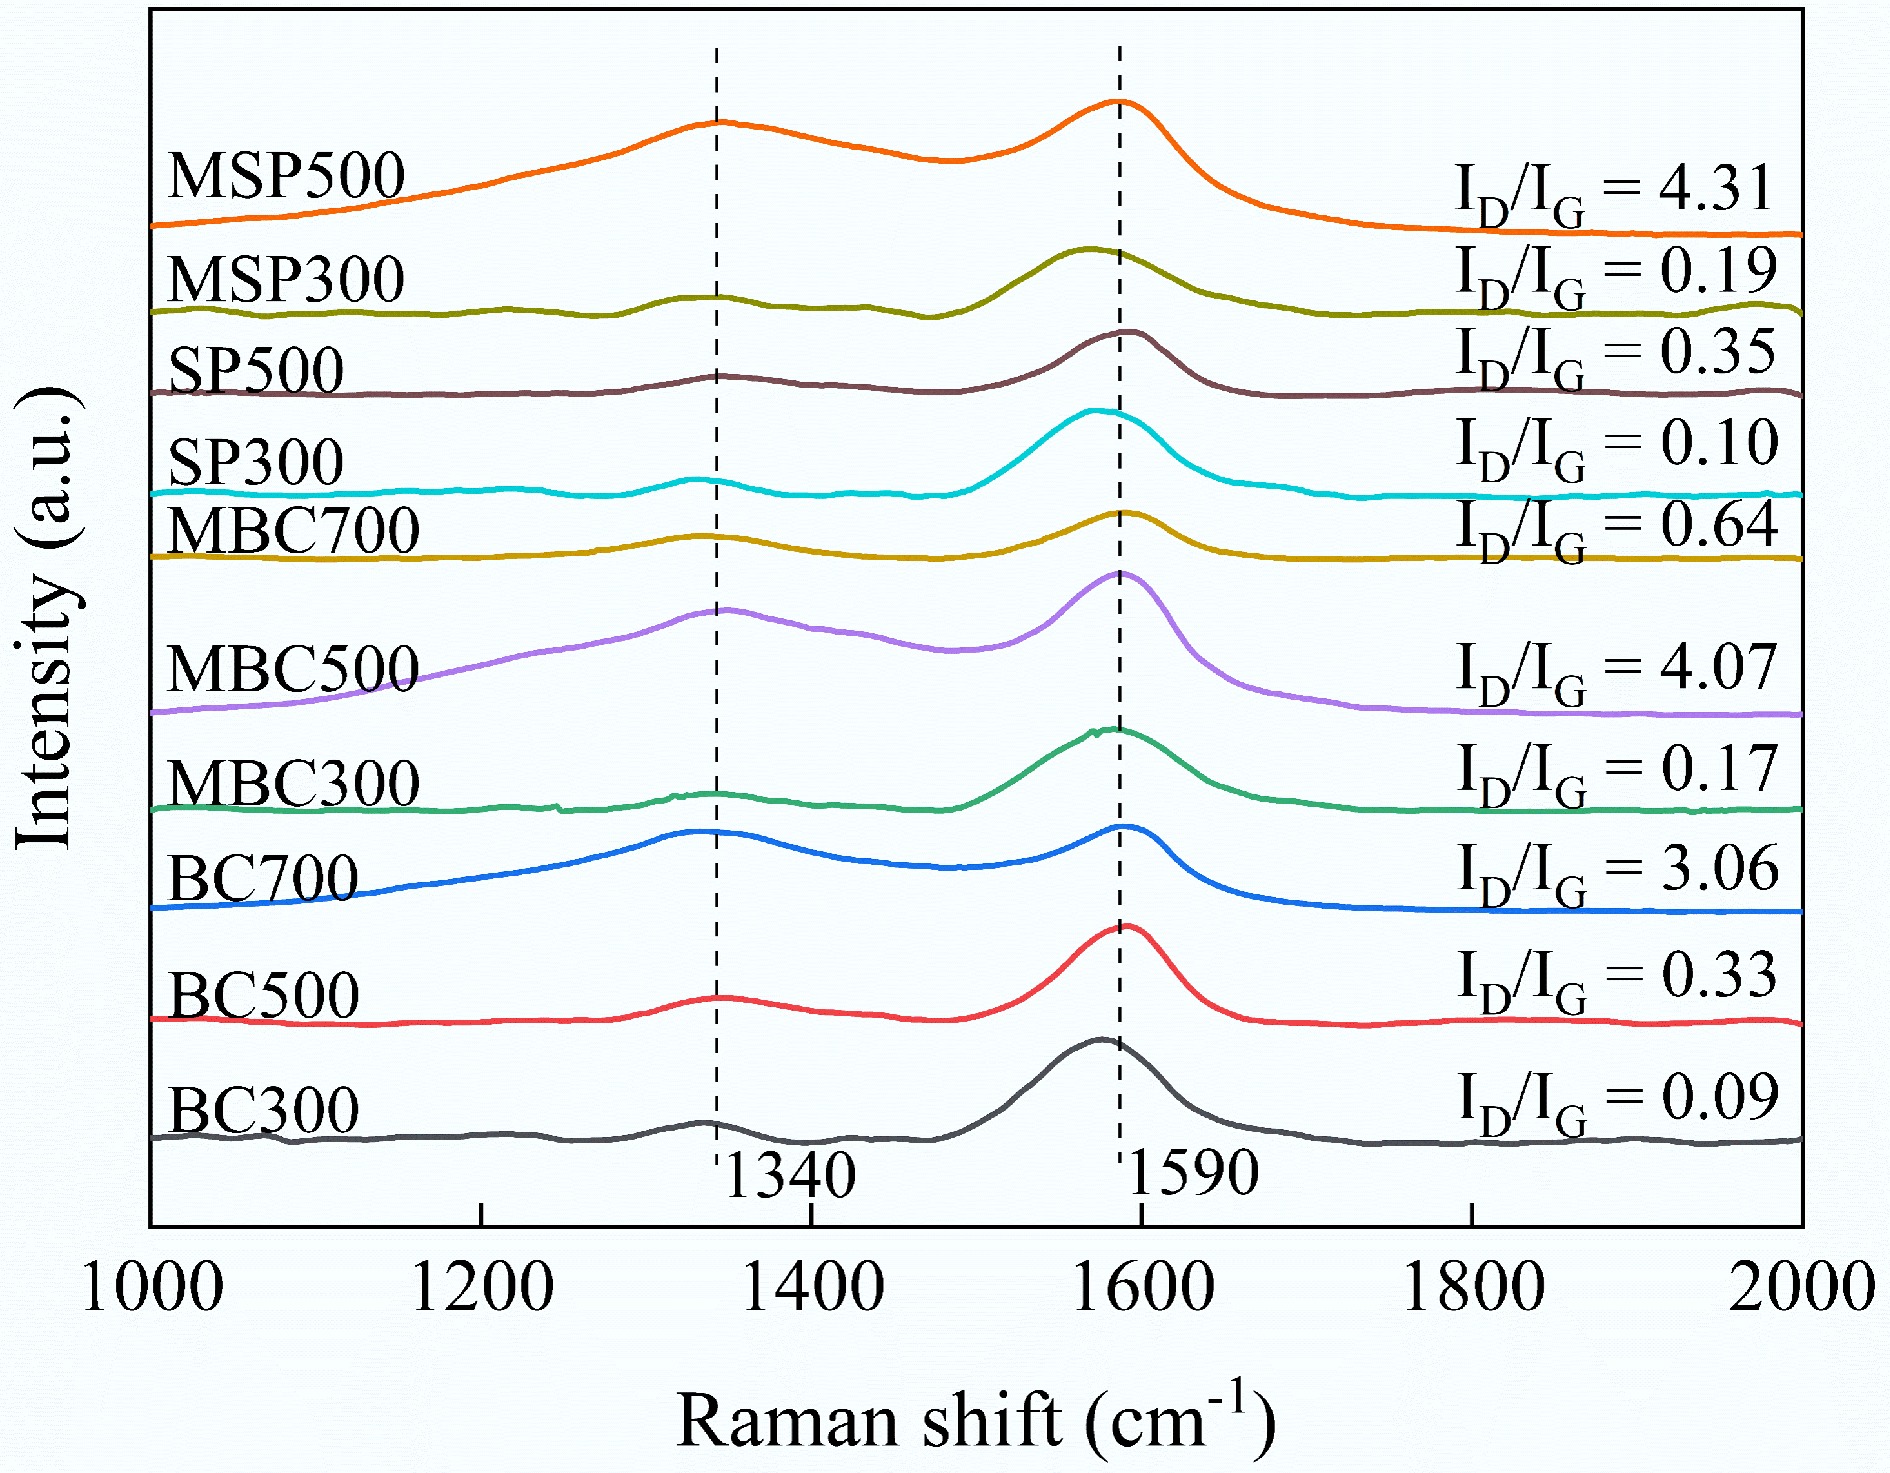
Figure 4.
Raman spectra characterization of different biochar samples.
-
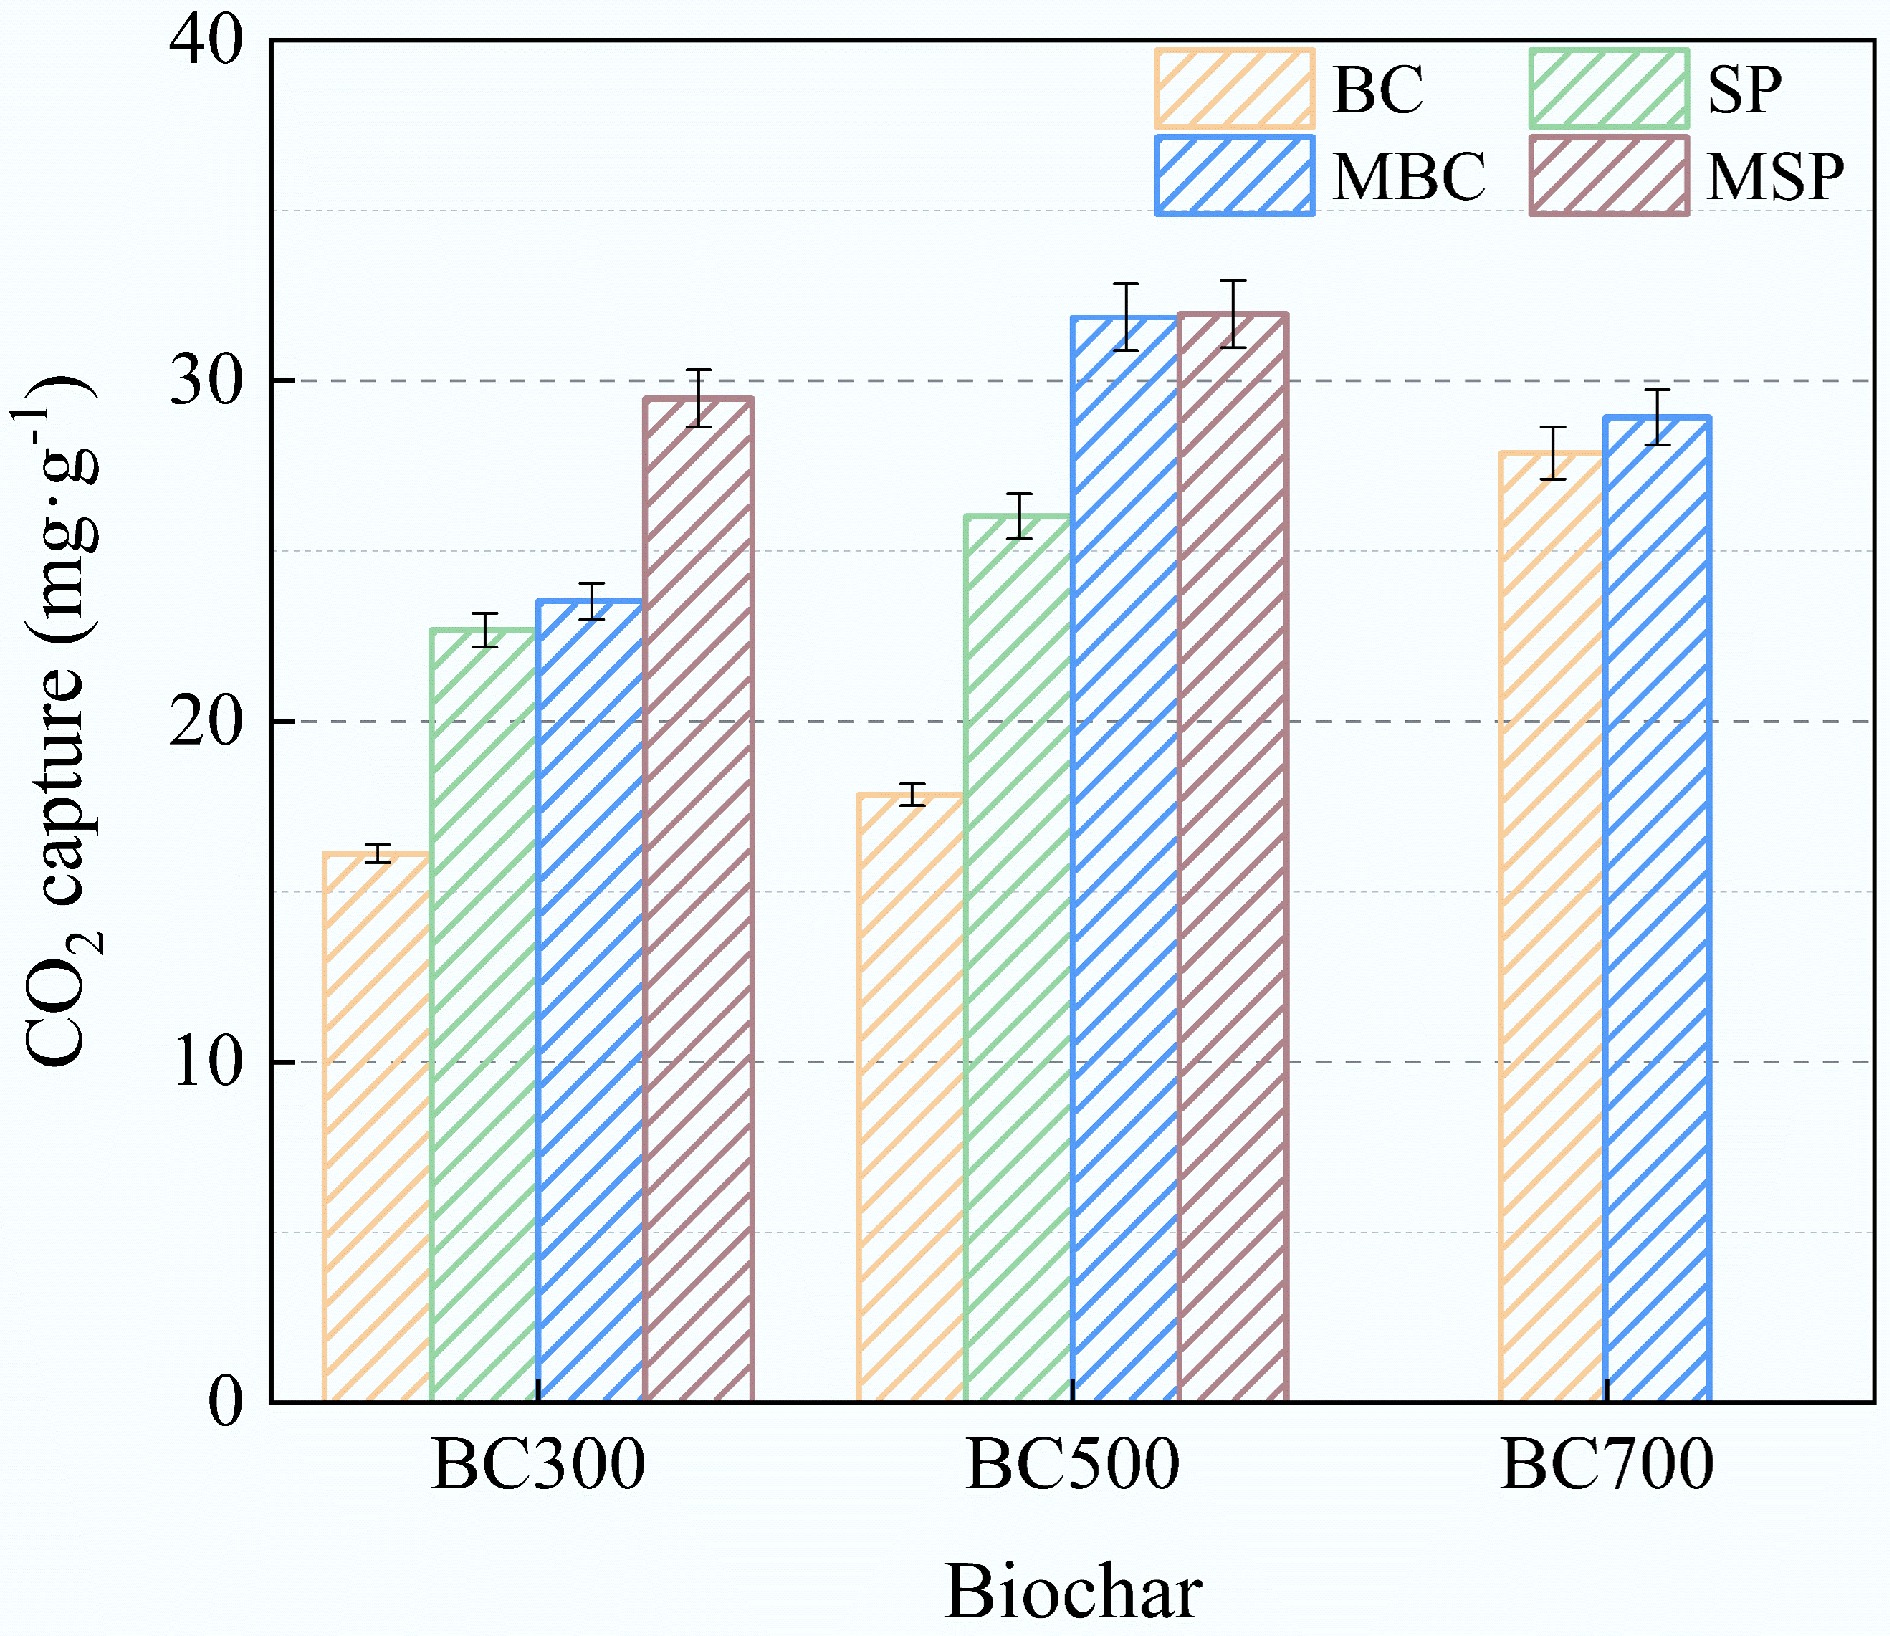
Figure 5.
CO2 uptake by different biochar at room temperature.
-
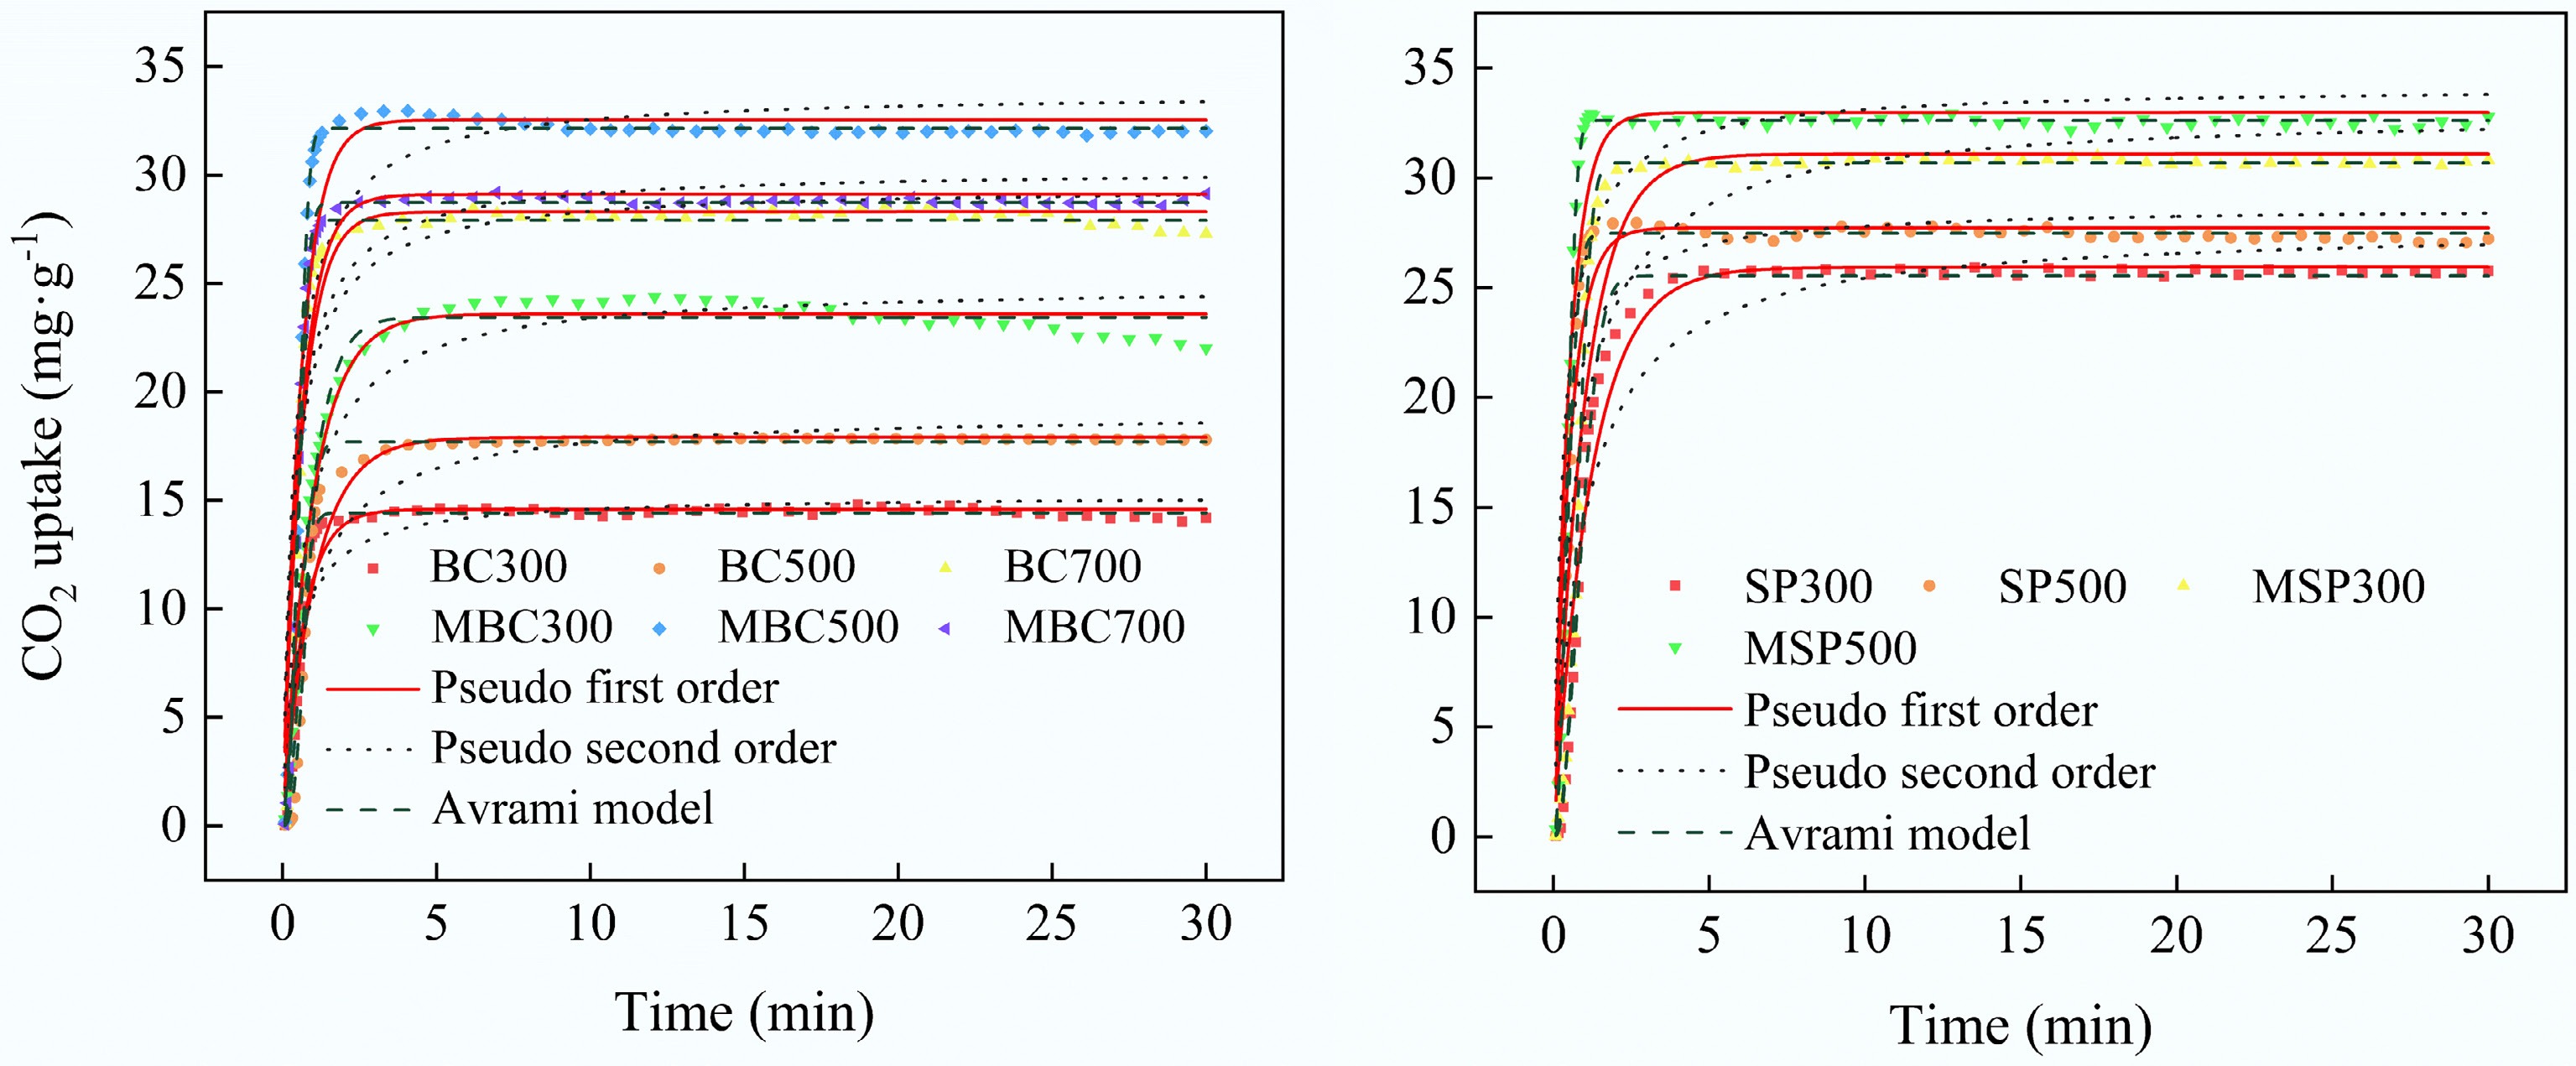
Figure 6.
Adsorption kinetic curves of different biochar samples at room temperature.
-
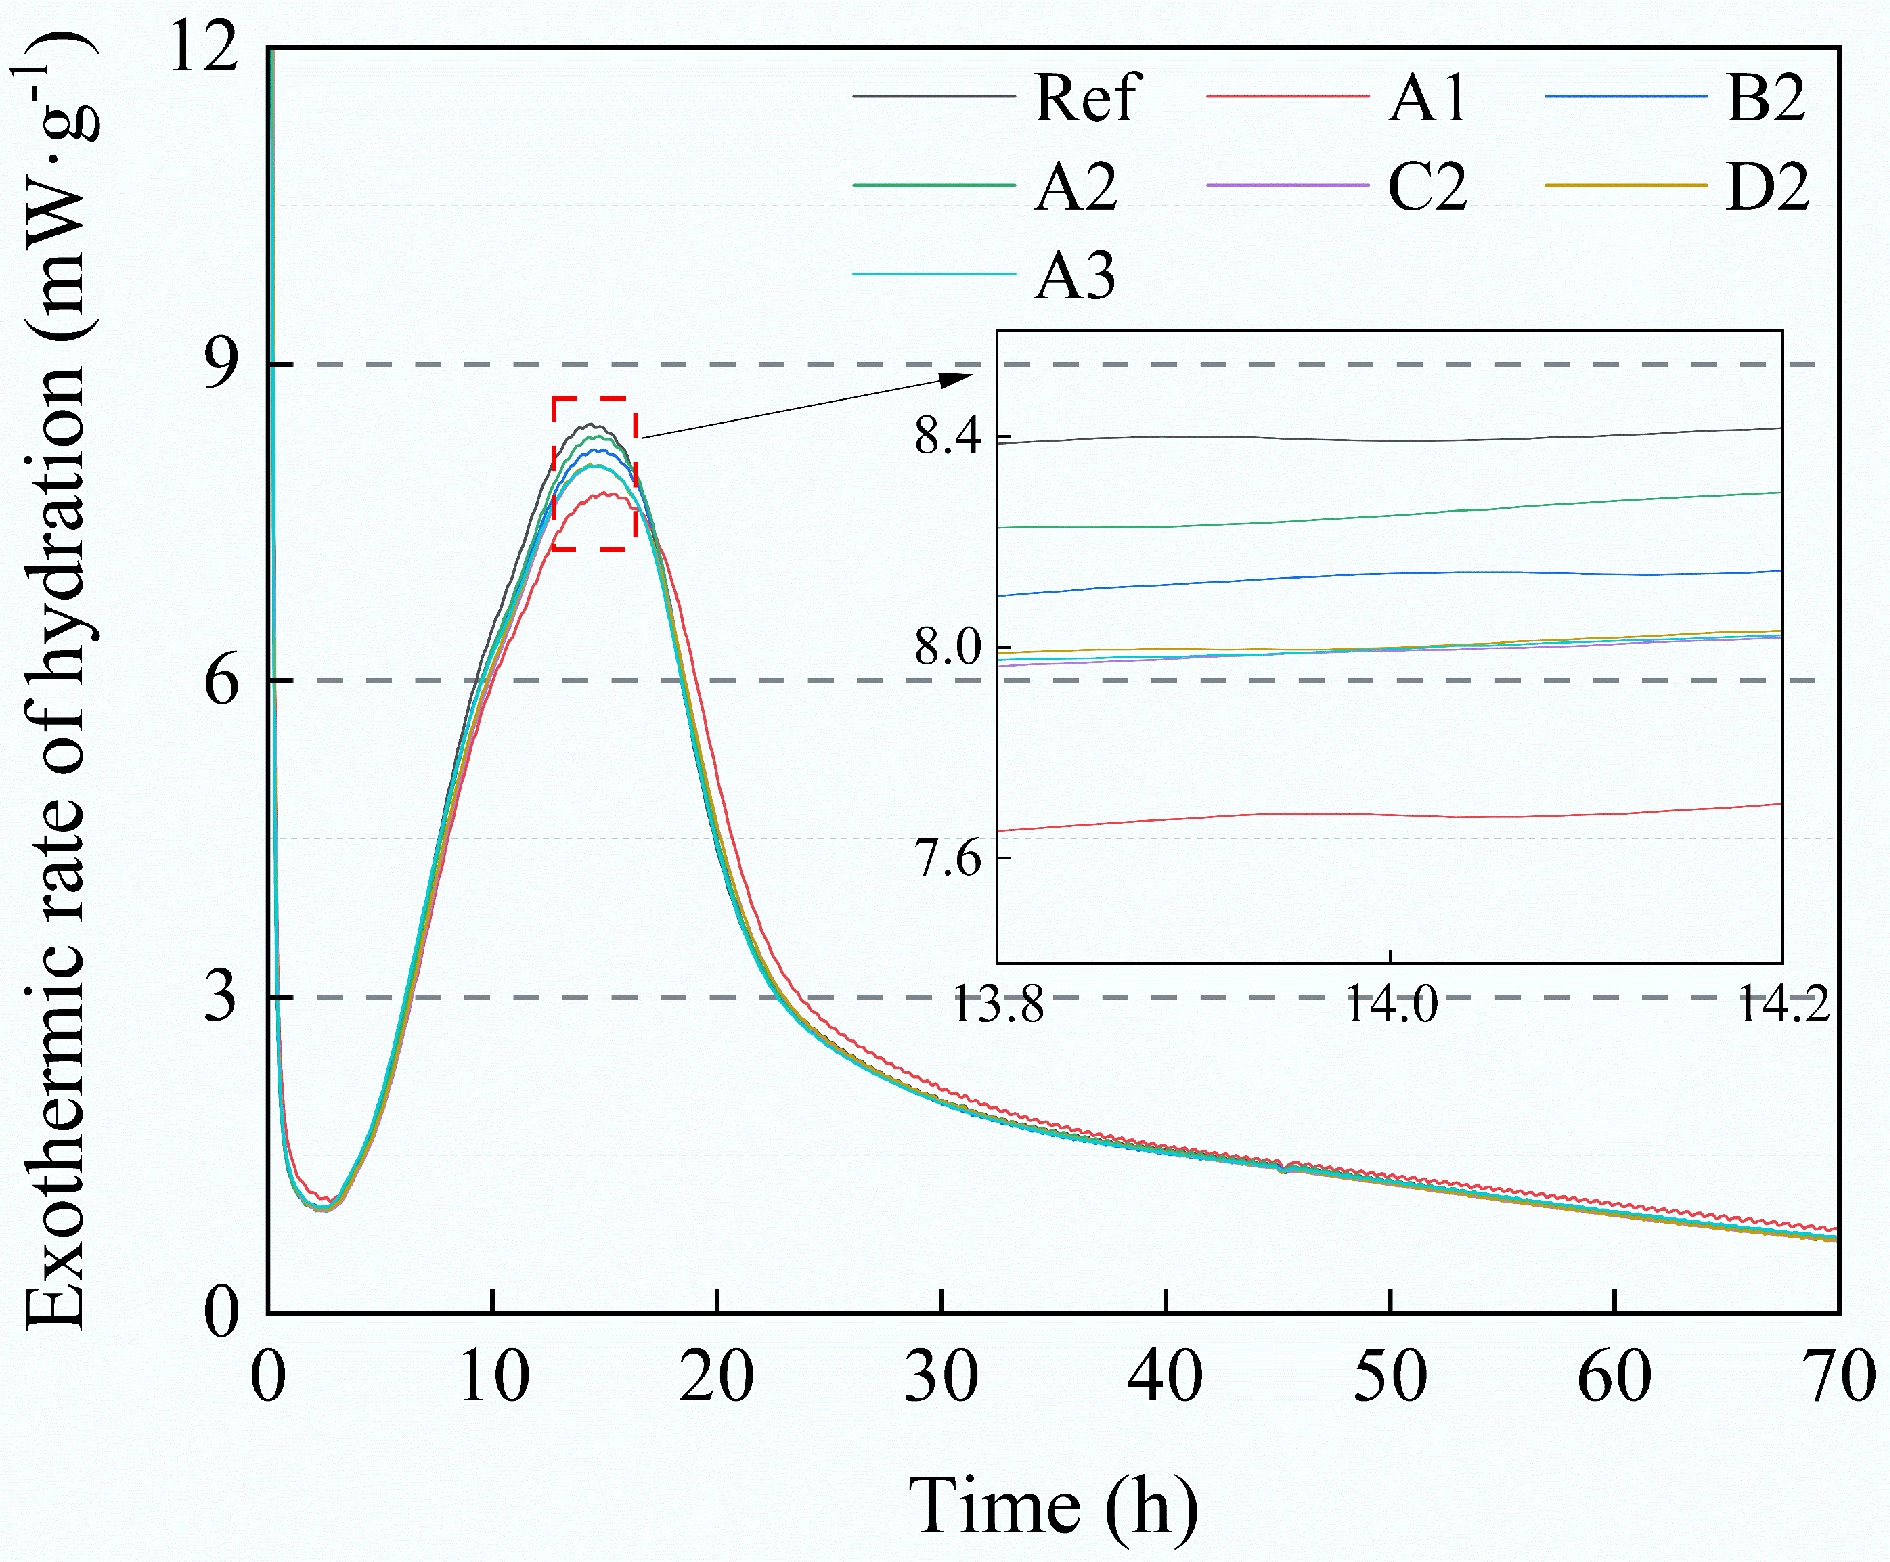
Figure 7.
Effect of different biochar additions on the exothermic rate of hydration of cement composites.
-
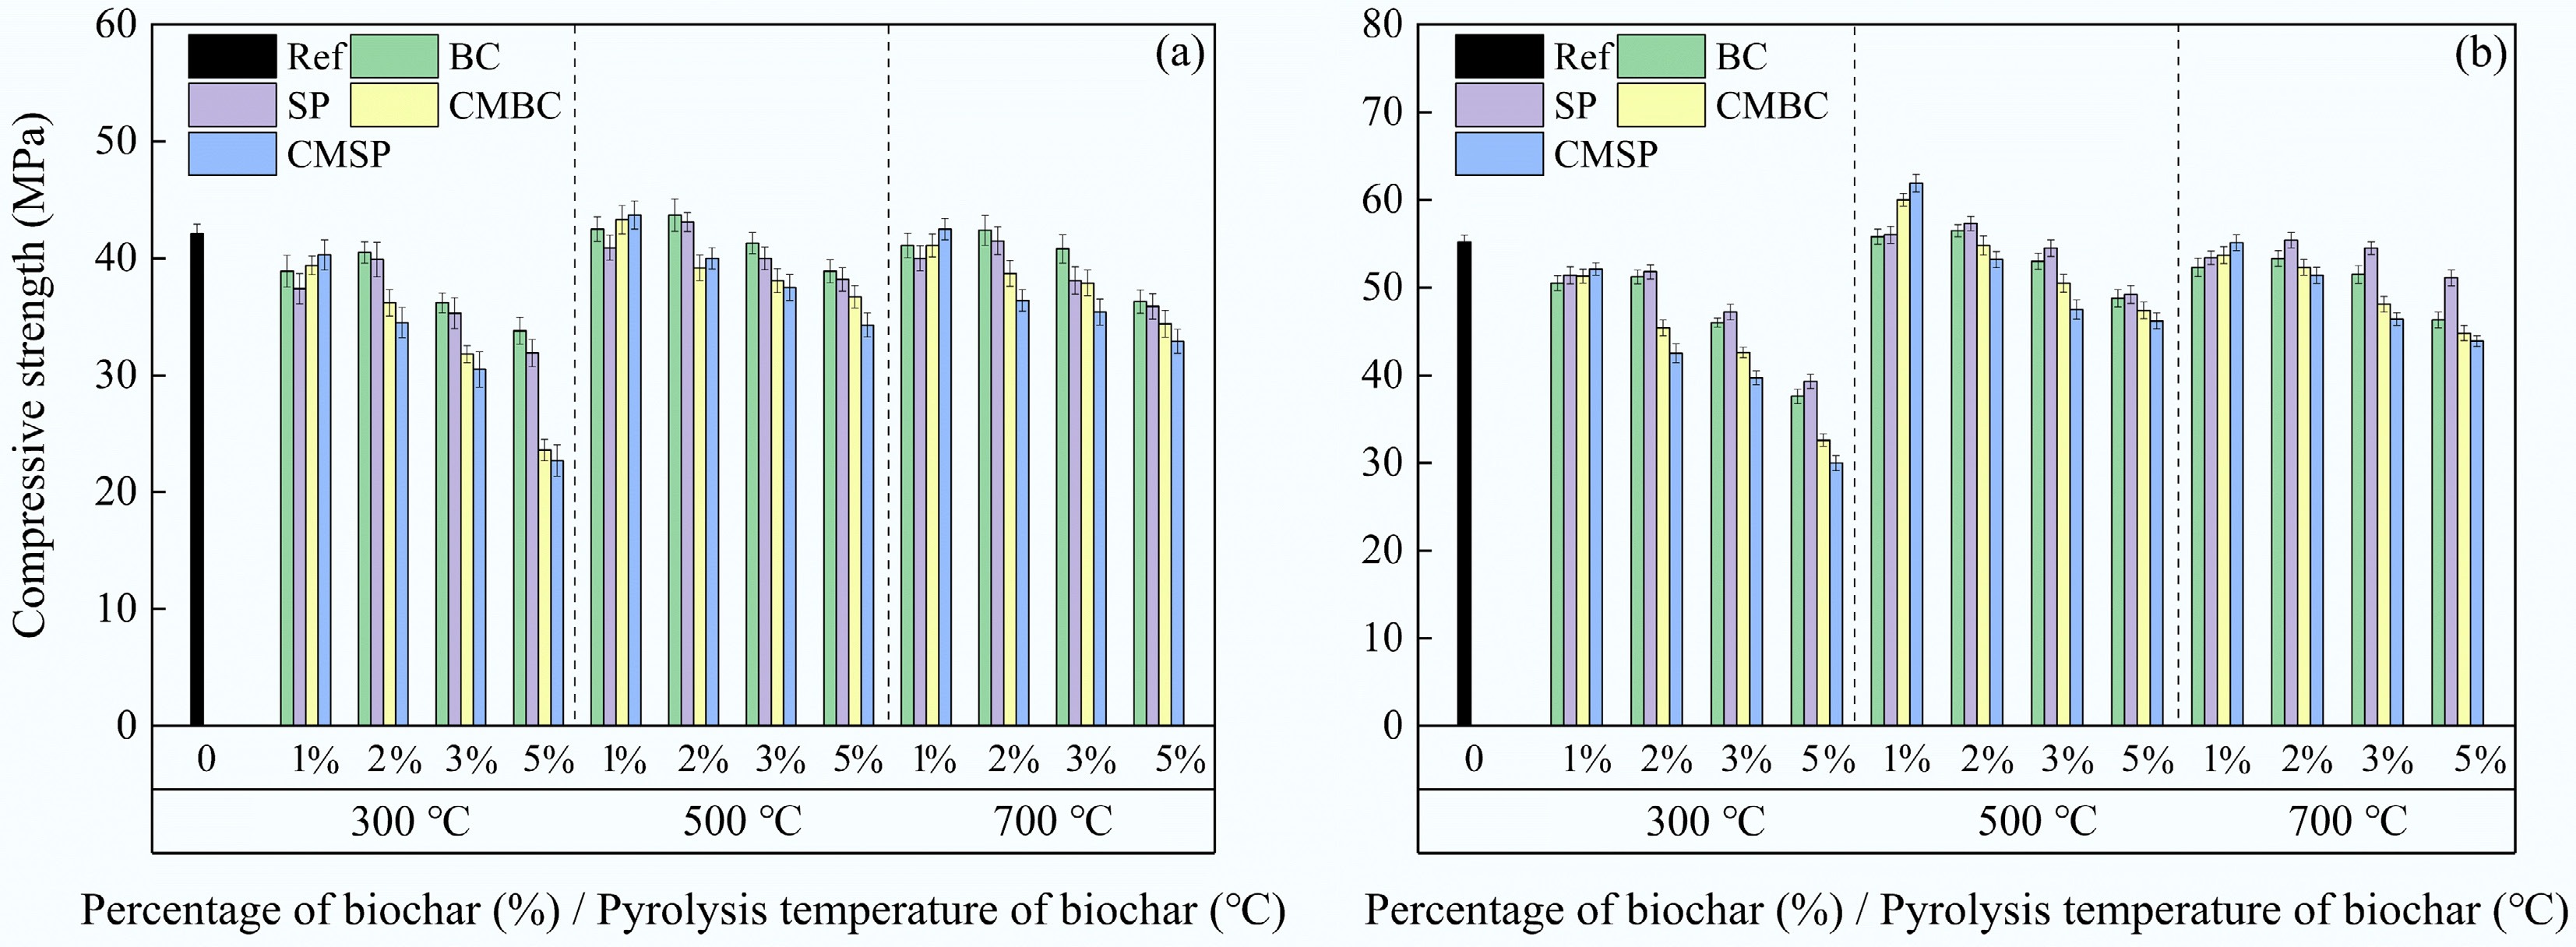
Figure 8.
Compressive strength results of different biochar cement composites tested at (a) 7, and (b) 28 d.
-
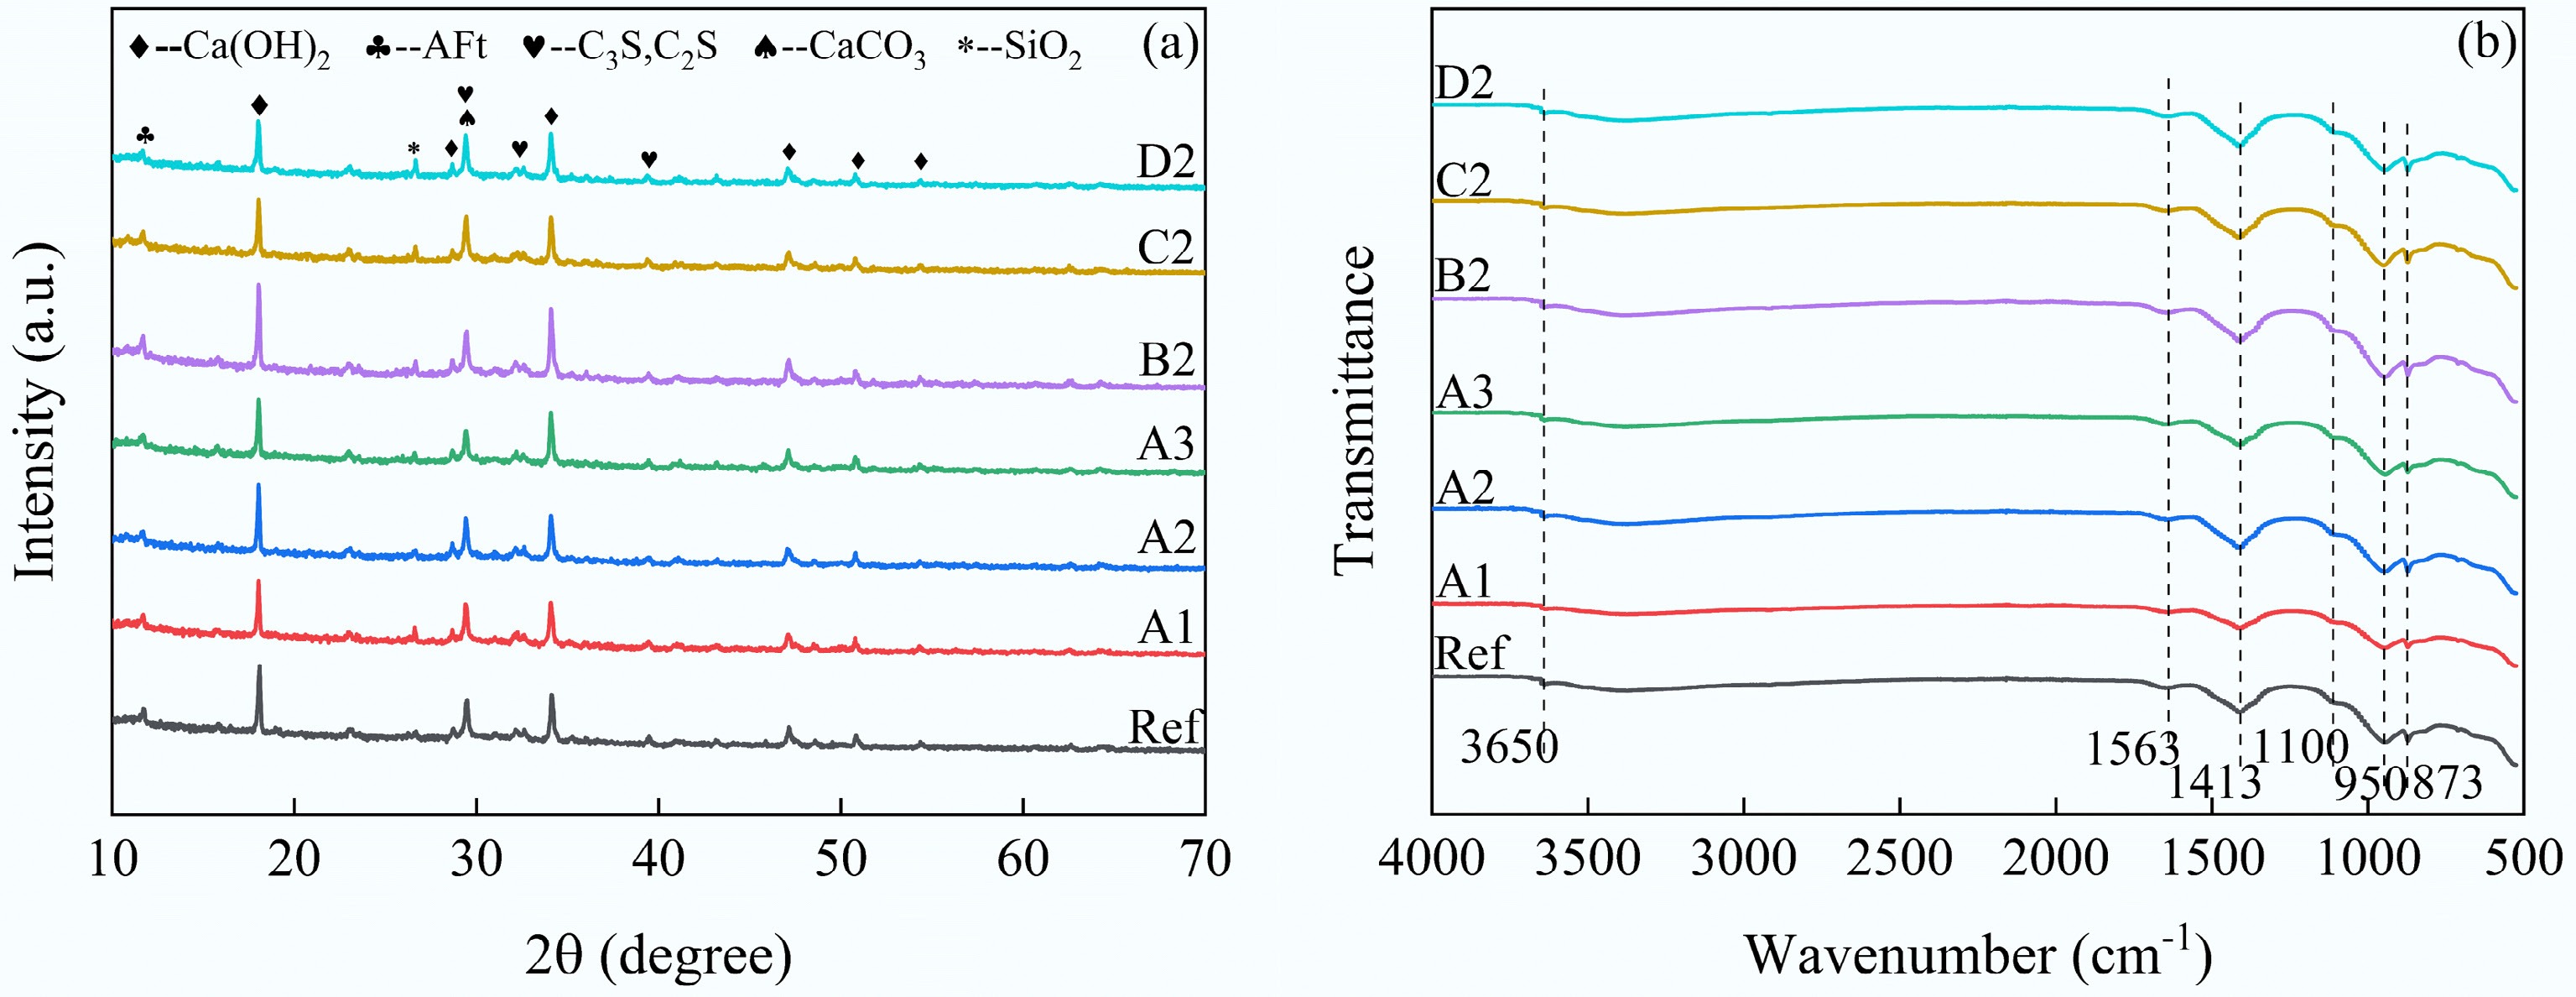
Figure 9.
Results of biochar-cement composites of (a) XRD, and (b) FTIR.
-
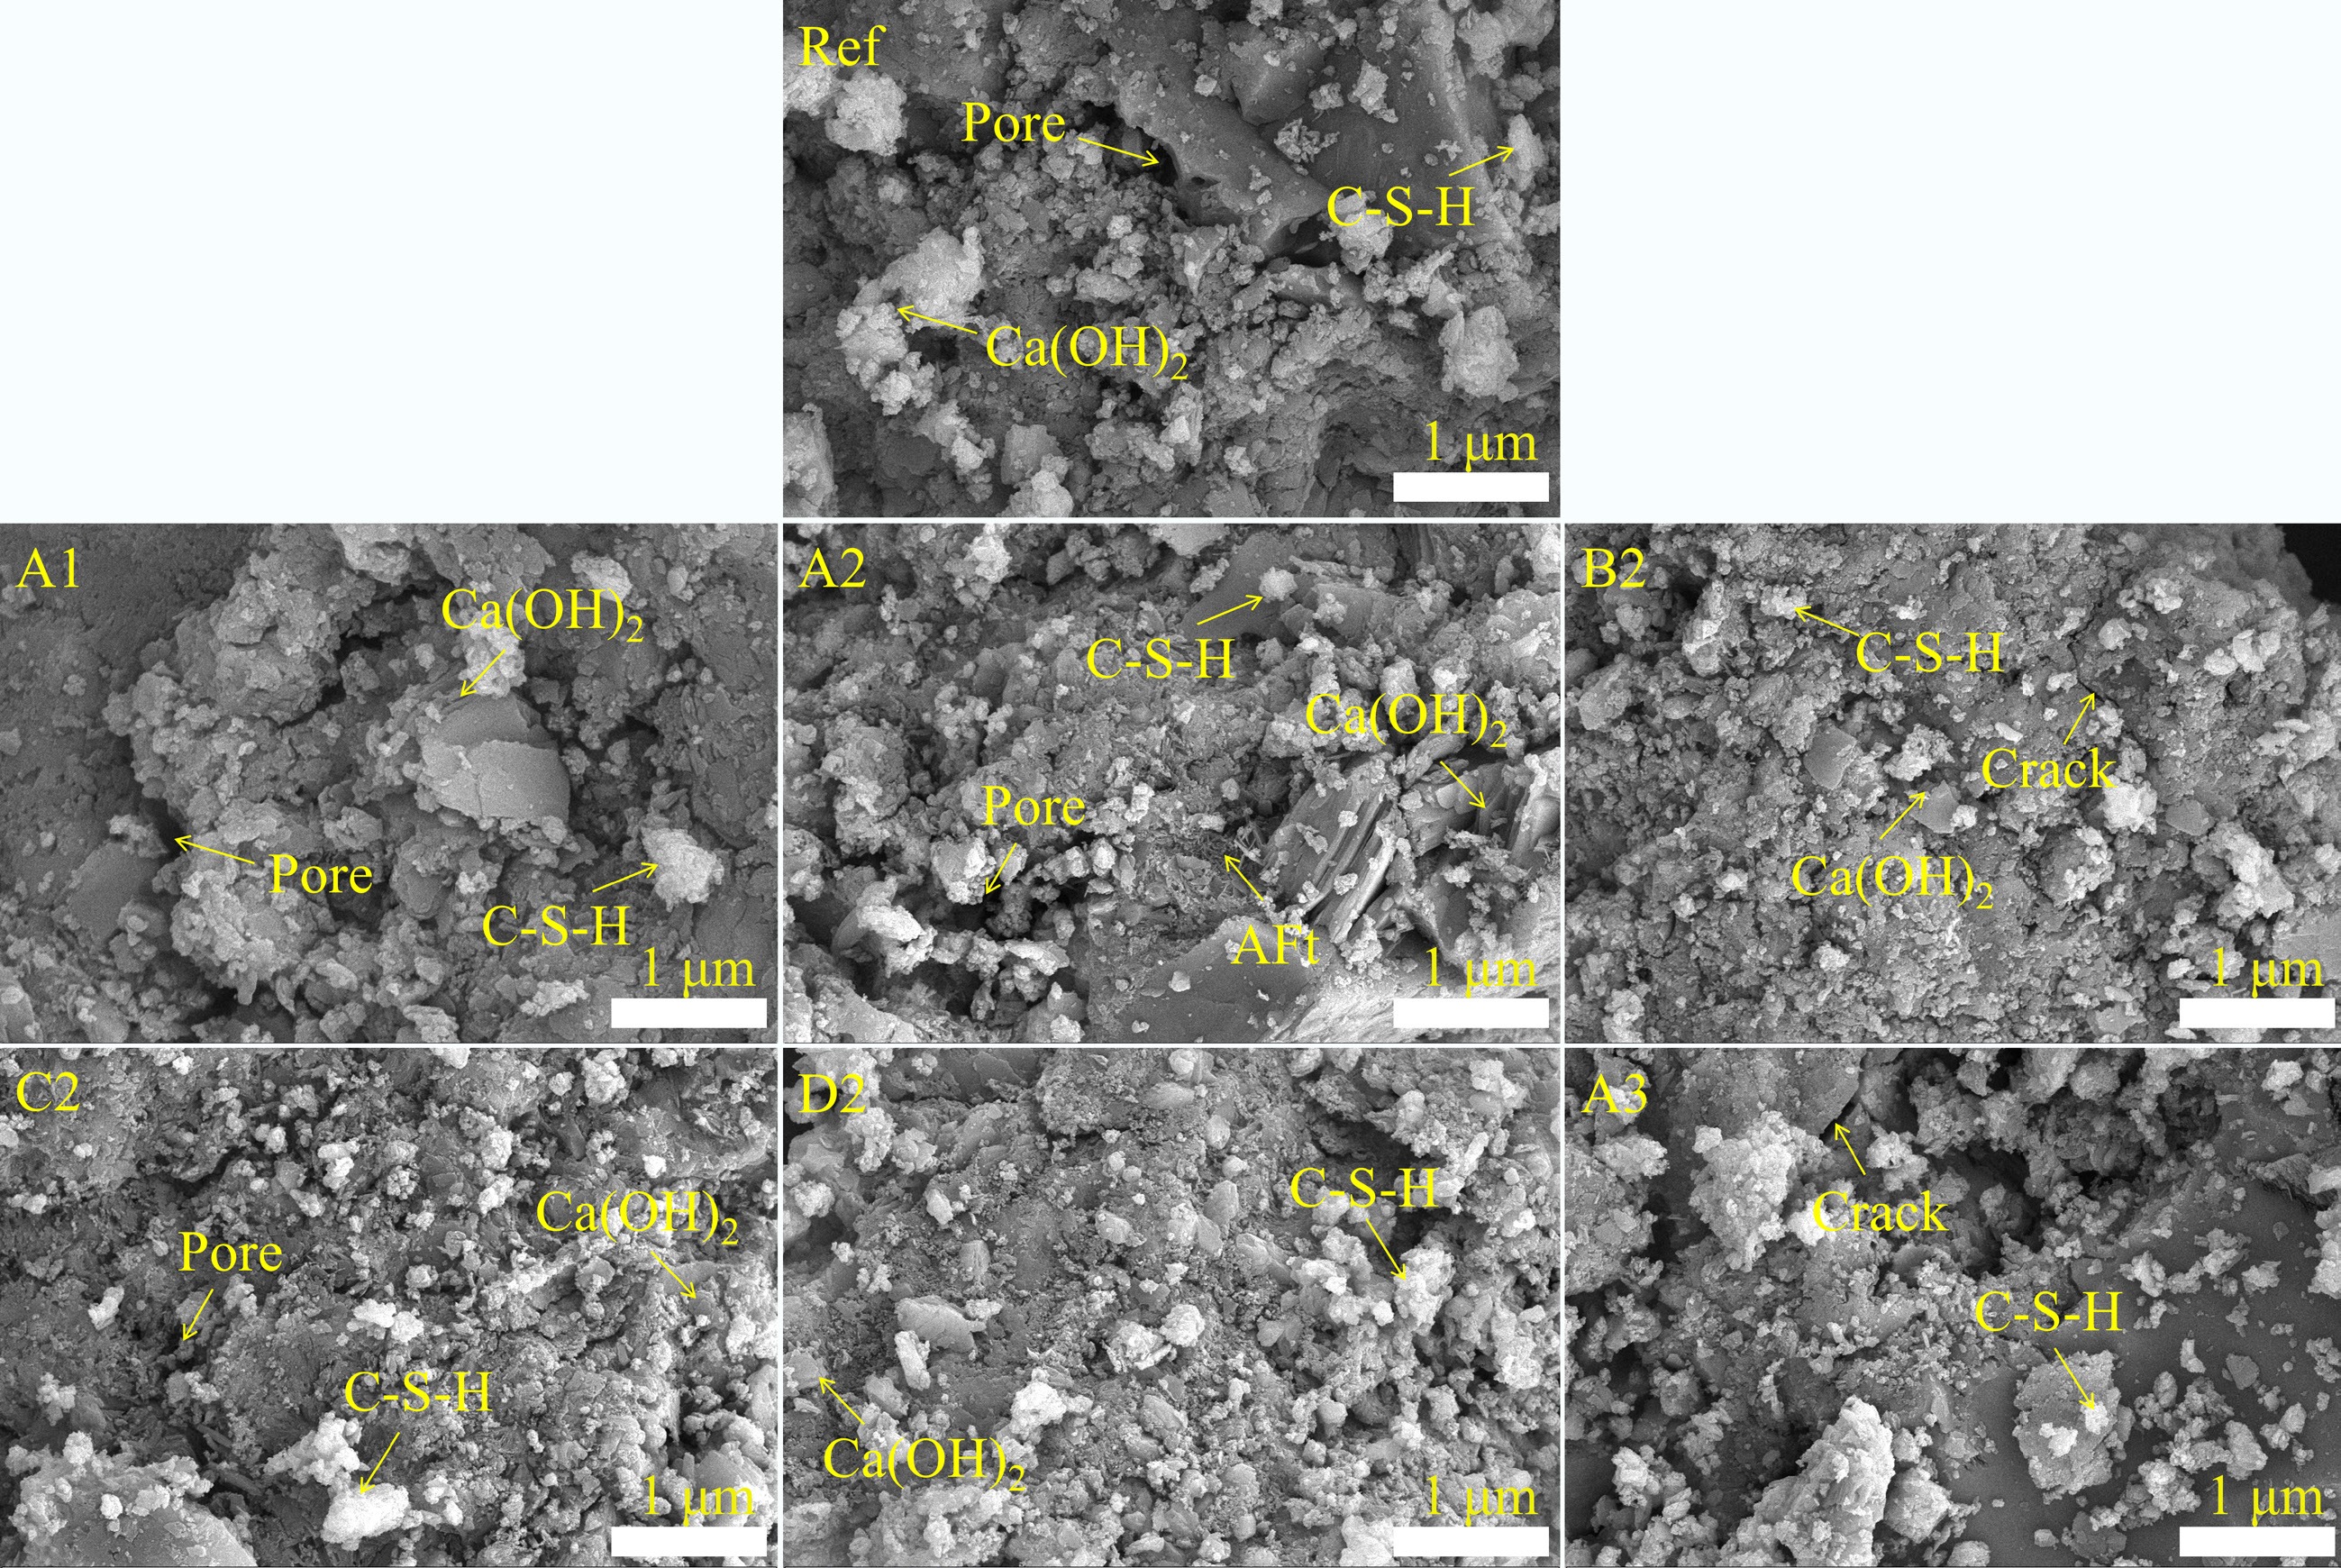
Figure 10.
SEM results for Ref, A1, A2, B2, C2, D2, A3.
-

Figure 11.
Results of TG and DTG.
-
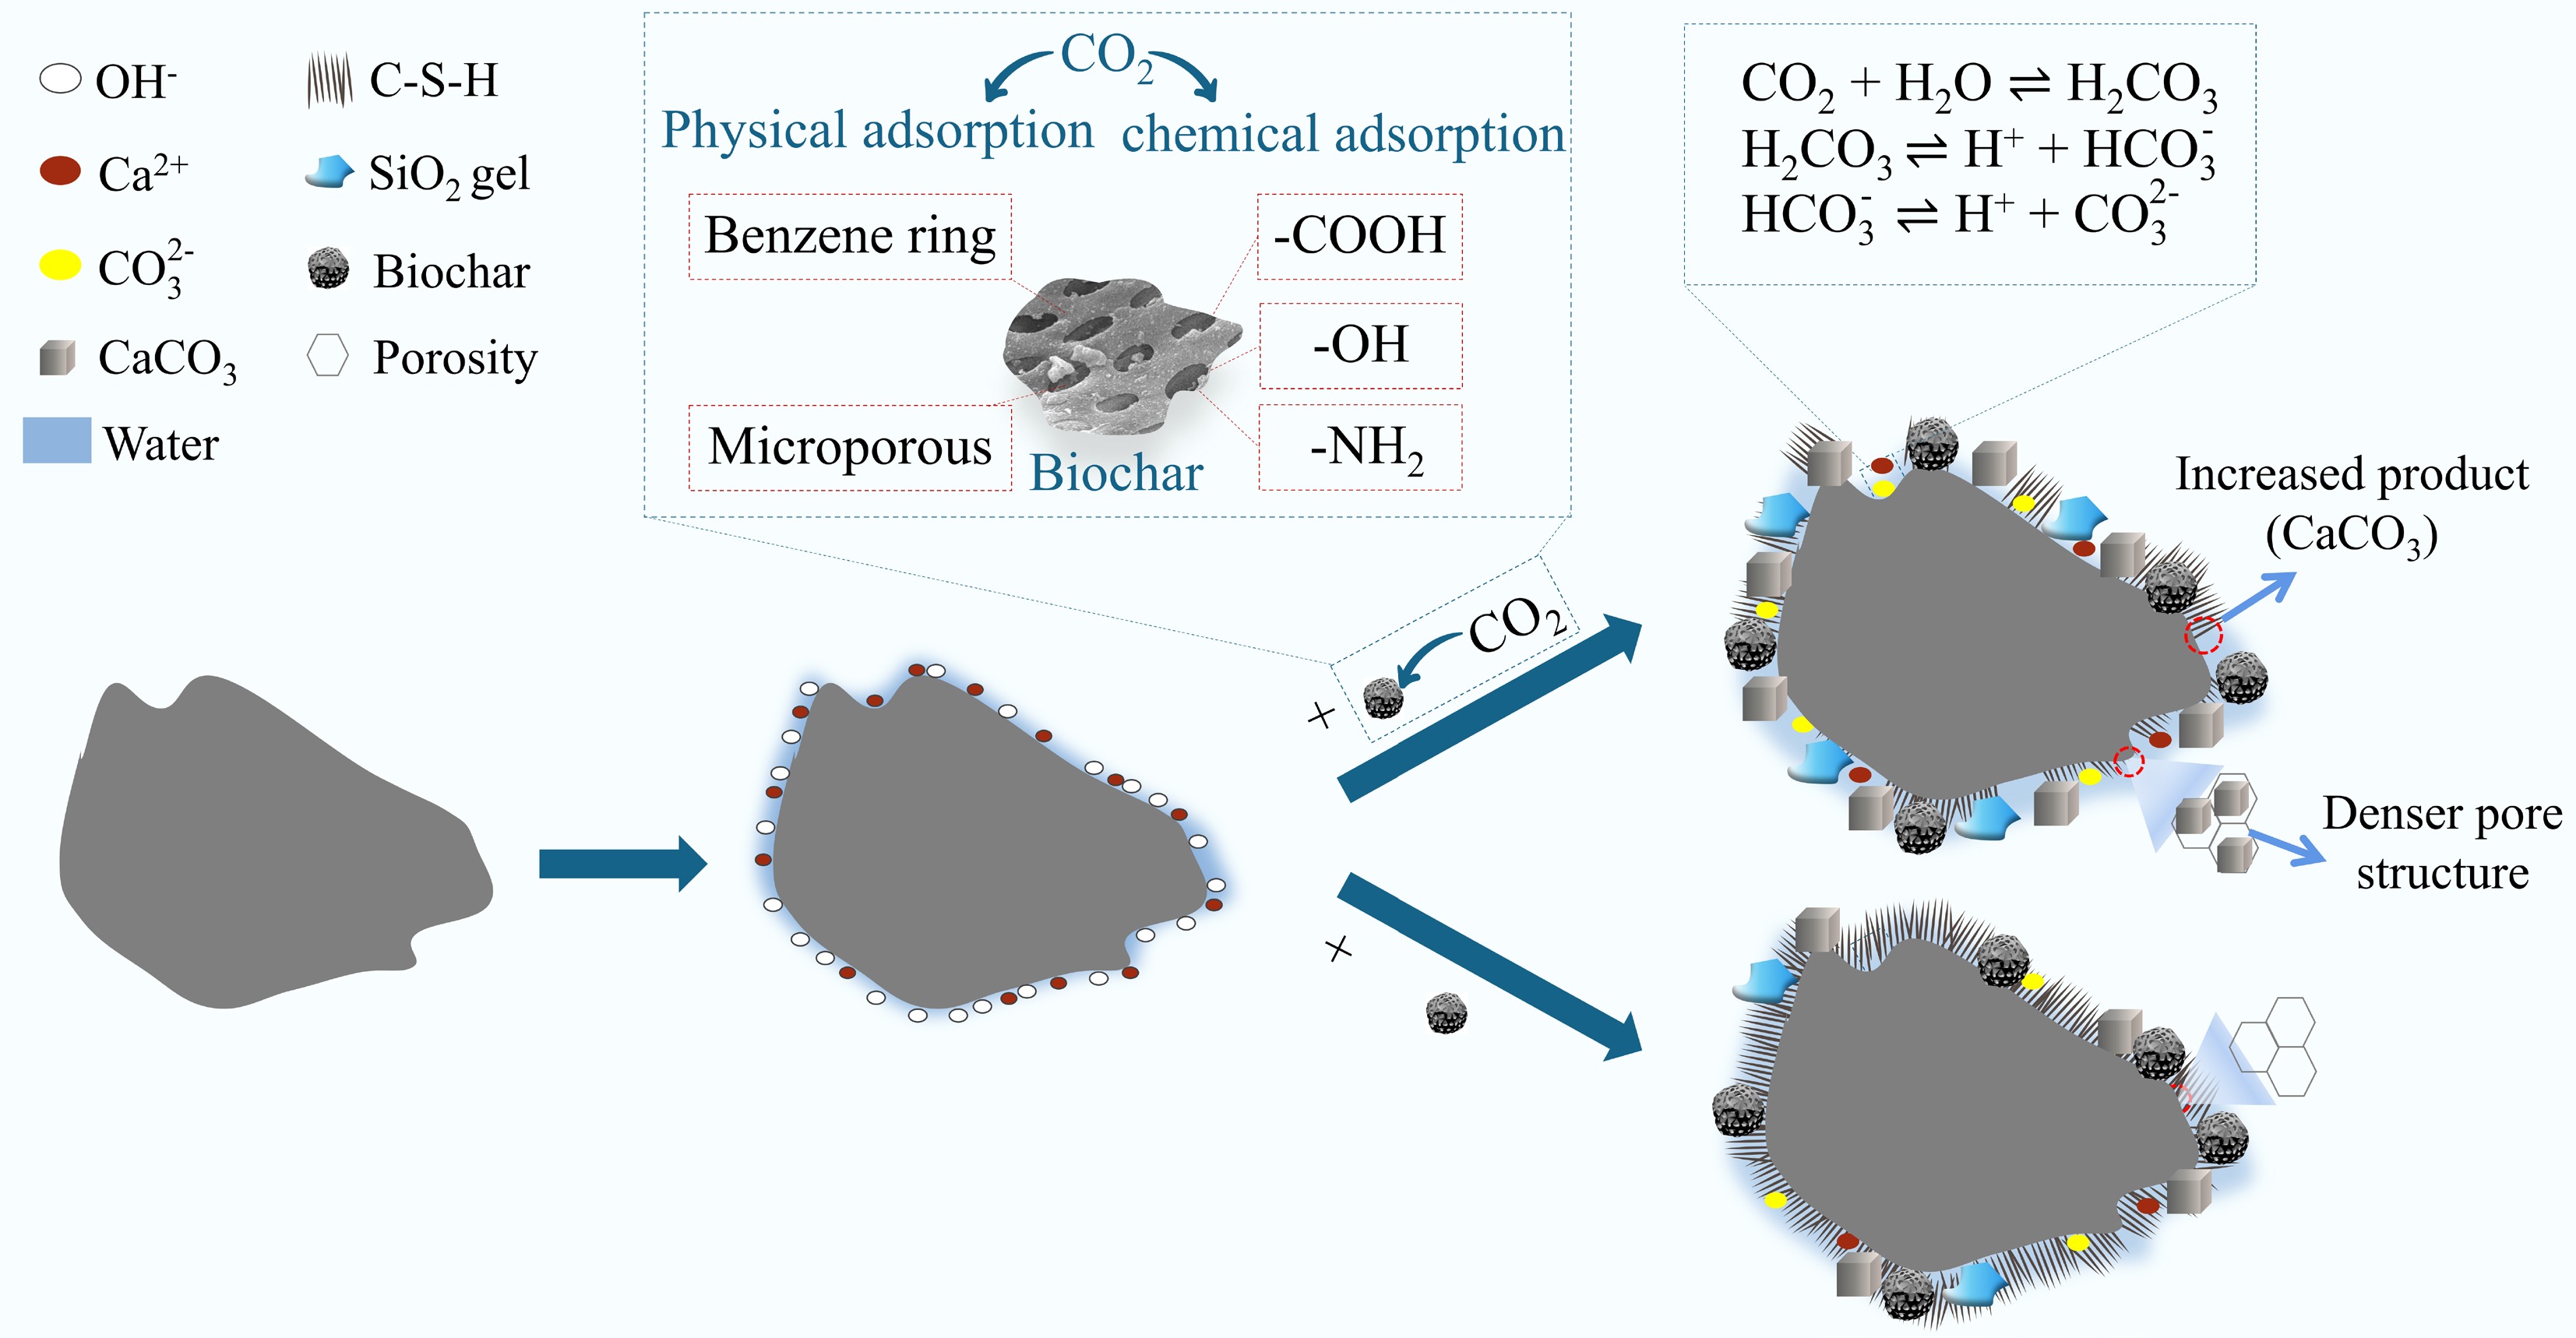
Figure 12.
Influence of different biochar on the cement hydration mechanism.
-
Sample C (%) O (%) Si (%) Cl (%) K (%) Else (%) BC300 35.70 25.14 13.19 1.26 5.73 18.98 SP300 38.50 19.39 11.67 − 1.67 28.77 BC500 40.63 33.35 17.71 0.94 3.55 3.82 SP500 44.59 20.06 18.19 − 4.13 13.03 BC700 43.05 6.58 21.17 0.87 8.83 19.50 SP700 45.58 19.10 21.88 − 2.78 10.66 Table 1.
Elemental distribution in biochar (wt.%)
-
Sample CaO SiO2 Al2O3 CO2 SO3 Fe2O3 K2O Other Content 44.64 25.13 11.57 8.36 3.45 3.35 1.11 2.39 Table 2.
Chemical composition of OPC (wt.%)
-
Samples OPC (g) Biochar (g) W/C Control (Ref) 400 0 0.4 A1, A2, A3 396 4 0.4 A1, A2, A3 392 8 0.4 A1, A2, A3 388 12 0.4 A1, A2, A3 380 20 0.4 A1, A2, and A3 are BC300-cement composites, BC500-cement composites, BC700-cement composites, respectively. Table 3.
Ratio of different biochar incorporated into cement composites
-
Sample BET surface area
(m2·g−1)Adsorption average pore size (nm) Cumulative adsorption pore volume (cm3·g−1) BC300 9.804 7.158 0.019 SP300 18.528 6.425 0.022 BC500 36.913 5.974 0.024 SP500 54.658 6.362 0.040 BC700 140.013 4.676 0.044 SP700 150.064 4.487 0.047 MBC300 2.894 6.924 0.012 MSP300 17.194 4.688 0.017 MBC500 29.691 4.613 0.033 MSP500 36.060 4.683 0.026 MBC700 124.607 4.676 0.044 MSP700 134.141 4.057 0.034 Table 4.
The surface area, cumulative adsorption pore volume, and adsorption average pore size of the different biochars
-
Model Pfo Model Pso Model Avrami Parameters qe k1 R2 qe k2 R2 qe kA n R2 BC300 14.59 1.5087 0.9270 15.23 0.1489 0.8501 14.43 2.5684 2.2174 0.9974 BC500 17.99 0.9815 0.9265 19.03 0.0676 0.8825 17.69 1.6072 2.7757 0.9959 BC700 28.30 1.6080 0.9243 29.48 0.0829 0.8468 27.91 3.1152 2.2713 0.9951 MBC300 23.59 1.0378 0.9808 24.92 0.0613 0.9360 23.43 1.0987 1.2791 0.9886 MBC500 32.53 1.6775 0.9072 33.80 0.0770 0.8138 32.14 3.6354 2.5360 0.9982 MBC700 29.10 1.6533 0.9217 30.27 0.0838 0.8380 28.72 3.2764 2.3077 0.9981 SP300 25.93 0.8307 0.9509 27.70 0.0393 0.9057 25.53 0.9339 2.0888 0.9936 SP500 27.72 1.9289 0.9283 28.69 0.1096 0.8283 27.47 3.4575 2.0176 0.9960 MSP300 31.08 1.0106 0.9168 32.98 0.0416 0.8571 30.68 1.3309 2.7293 0.9978 MSP500 32.97 1.9945 0.9096 34.13 0.0949 0.8037 32.61 4.6009 2.3394 0.9989 Table 5.
Adsorption kinetics parameters of biochar to CO2
-
Item Ca(OH)2 CaCO3 Ref 2.822 5.474 A1 2.685 5.989 A2 2.883 5.273 A3 2.806 6.164 B2 2.967 5.782 C2 2.759 6.451 D2 2.693 6.511 Table 6.
Mass loss of Ca(OH)2 and CaCO3 in various biochar cement composites (wt.%)
-
Materials/processes
(10−5 kg)Without BC A2/B2/C2/D2 (1%) A2/B2/C2/D2 (2%) A2/B2/C2/D2 (3%) A2/B2/C2/D2 (5%) Ecoinvent inputs OPC 29400 29100 28800 28500 27900 Cement production, Portland Water 2.69 2.69/4.93/4.37/6.61 2.69/7.17/6.05/10.53 2.69/9.41/7.73/14.45 2.69/13.89/11.09/22.29 Tap water production, conventional treatment BC500 production (−) − 138.33/173.94/
138.33/173.94276.66/347.88/
276.66/347.88414.99/521.82/
414.99/521.82691.65/869.70/
691.65/869.70Biochar preparation NaOH − 0/0/636/636 0/0/1272/1272 0/0/1908/1908 0/0/3180/3180 China carbon emissions database Transportation 164.4 168.48/168.62/
168.48/168.62172.55/172.84/
172.55/172.84176.63/177.07/
176.63/177.07184.77/185.52/
184.77/185.52Transportation distance: 30 km Avoided emission (−) − 0.59/0.60/0.59/0.60 1.17/1.20/1.17/1.20 1.76/1.81/1.76/1.81 2.93/3.01/2.93/3.01 − Net emission 29567.088 29132.25/29099.01/
29769.93/29736.6928697.41/28630.93/
29972.77/29906.2928262.57/28162.85/
30175.61/30075.8927392.88/27226.70/
30581.28/30415.10− Table 7.
Carbon emissions of biochar cement composites
Figures
(12)
Tables
(7)