-
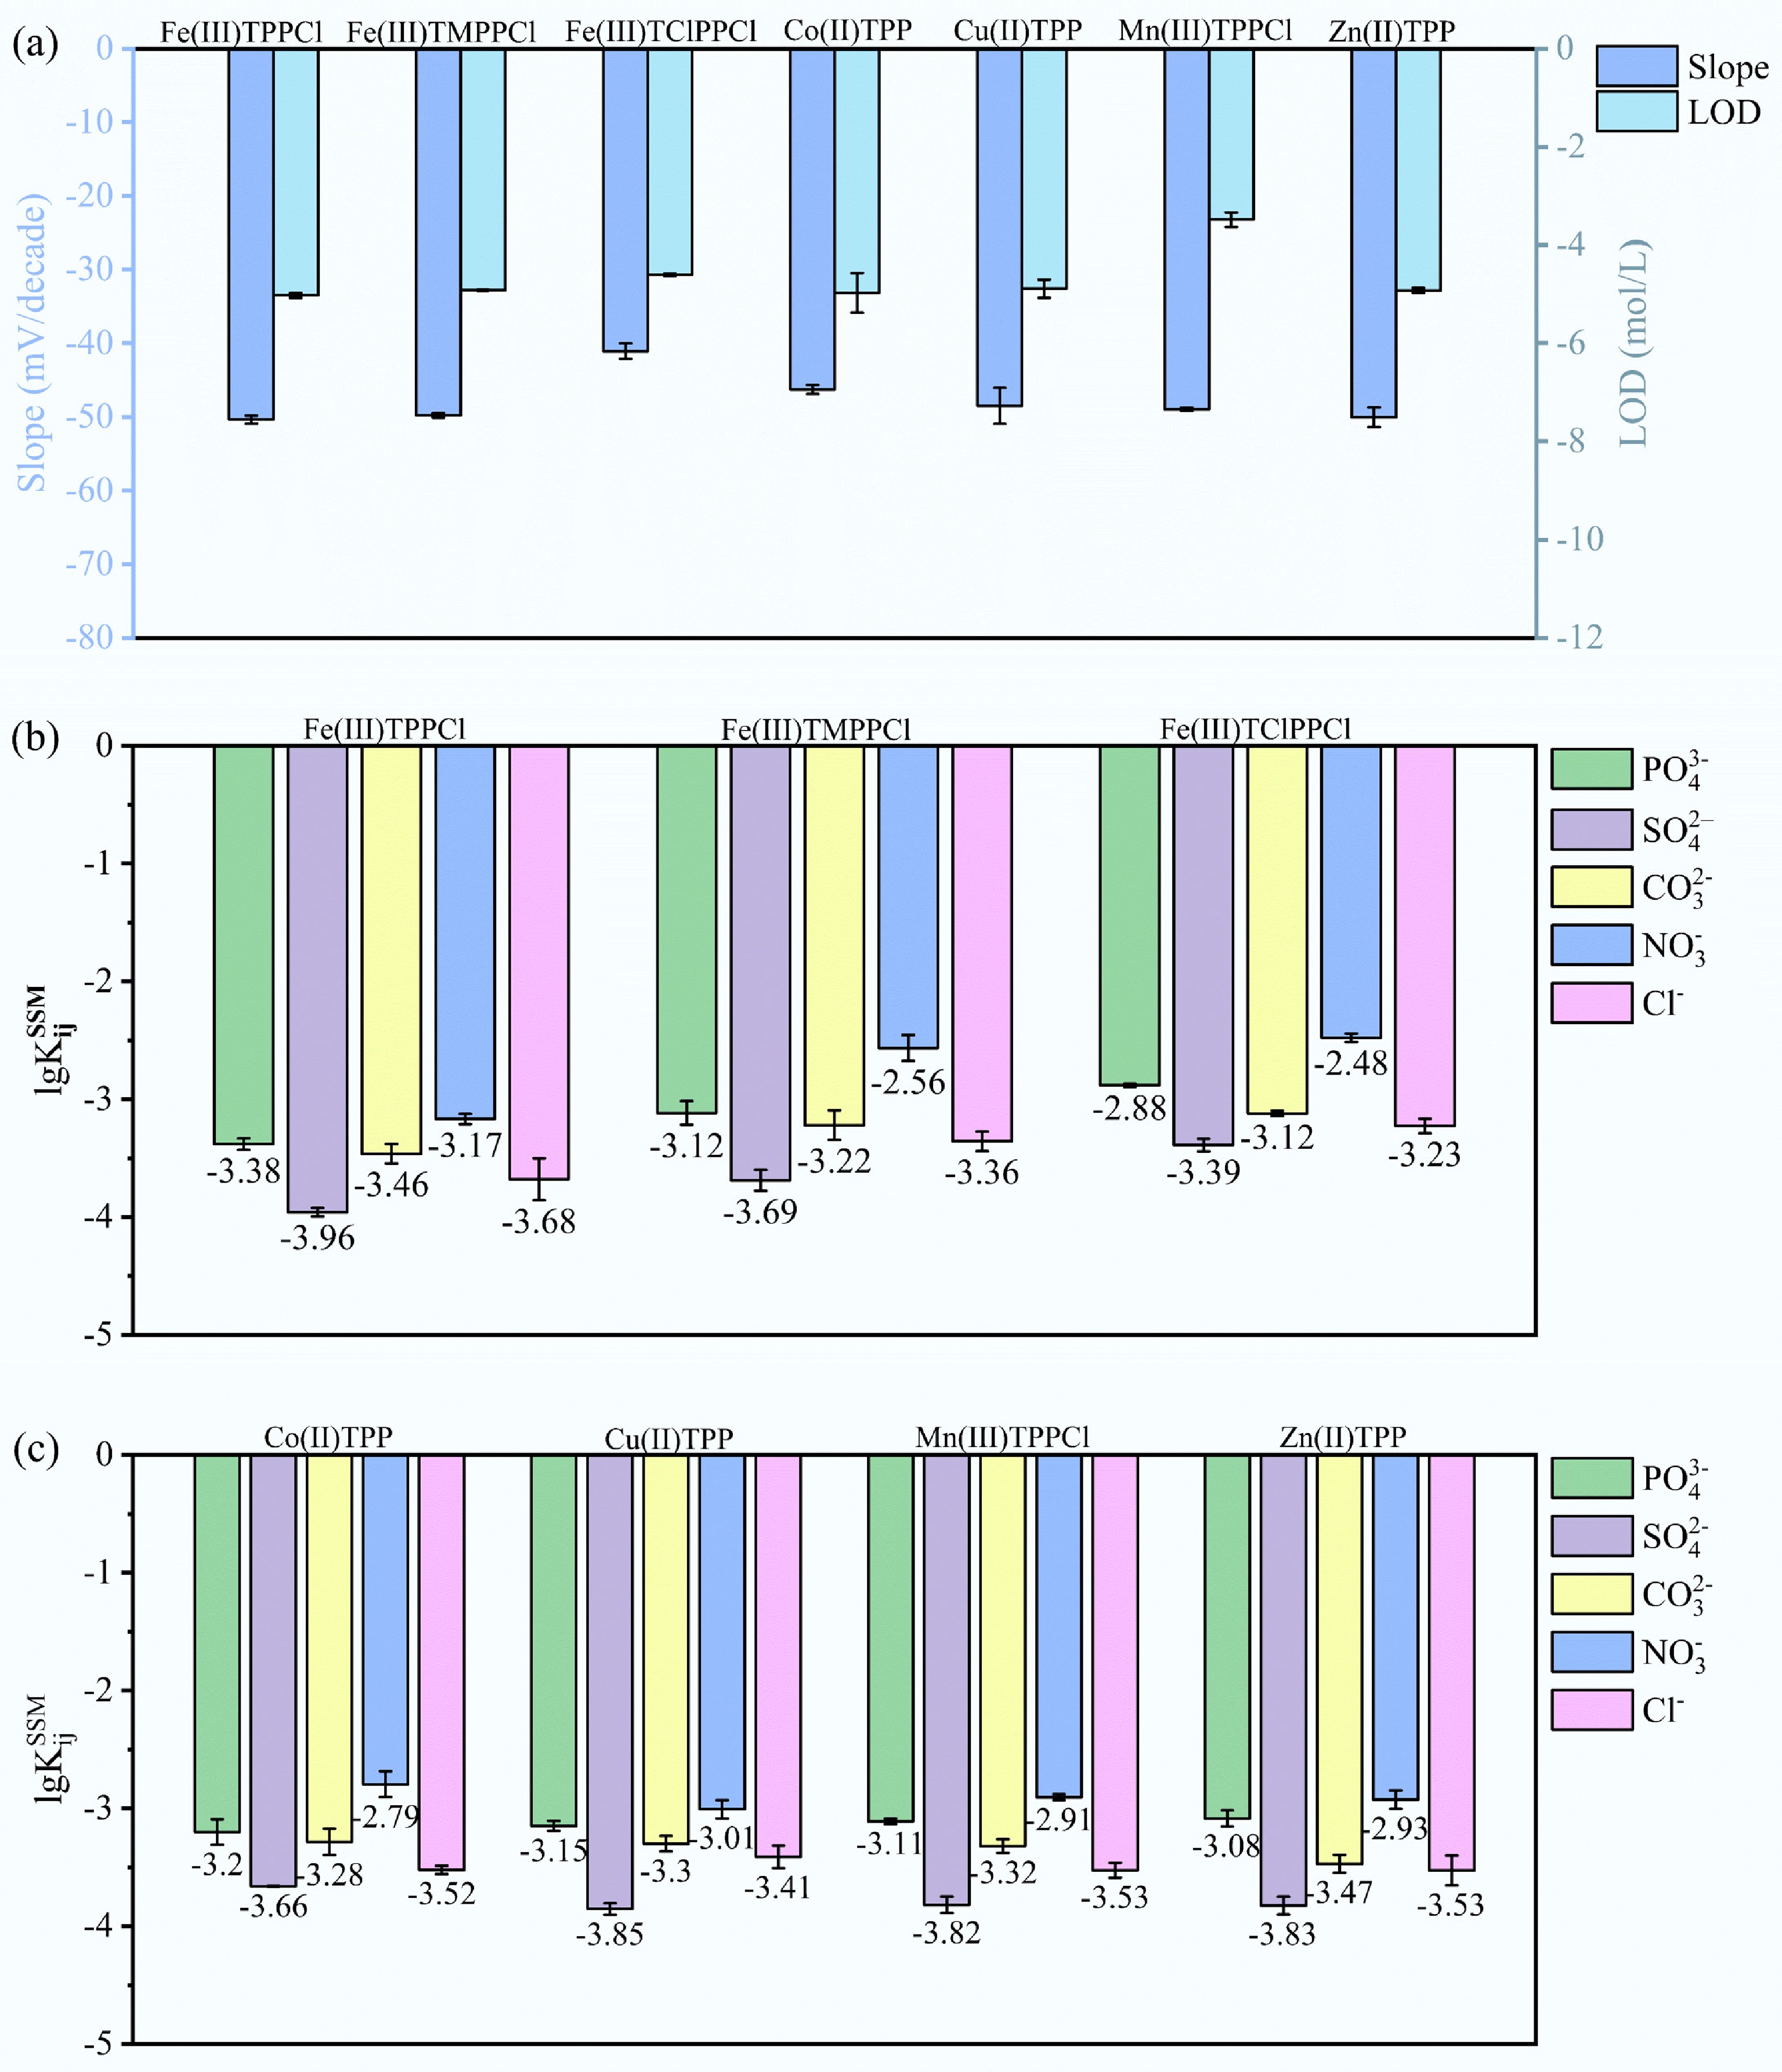
Figure 1.
Response slopes, detection limits, and selectivity coefficients for porphyrin-based ionophores. (a) Response slopes (left axis) and detection limits (right axis). (b) Selectivity coefficients logKijSSM of porphyrin-based ionophores with different substituents. (c) Selectivity coefficients logKijSSM of porphyrin-based ionophores with different coordinated metal ions.
-
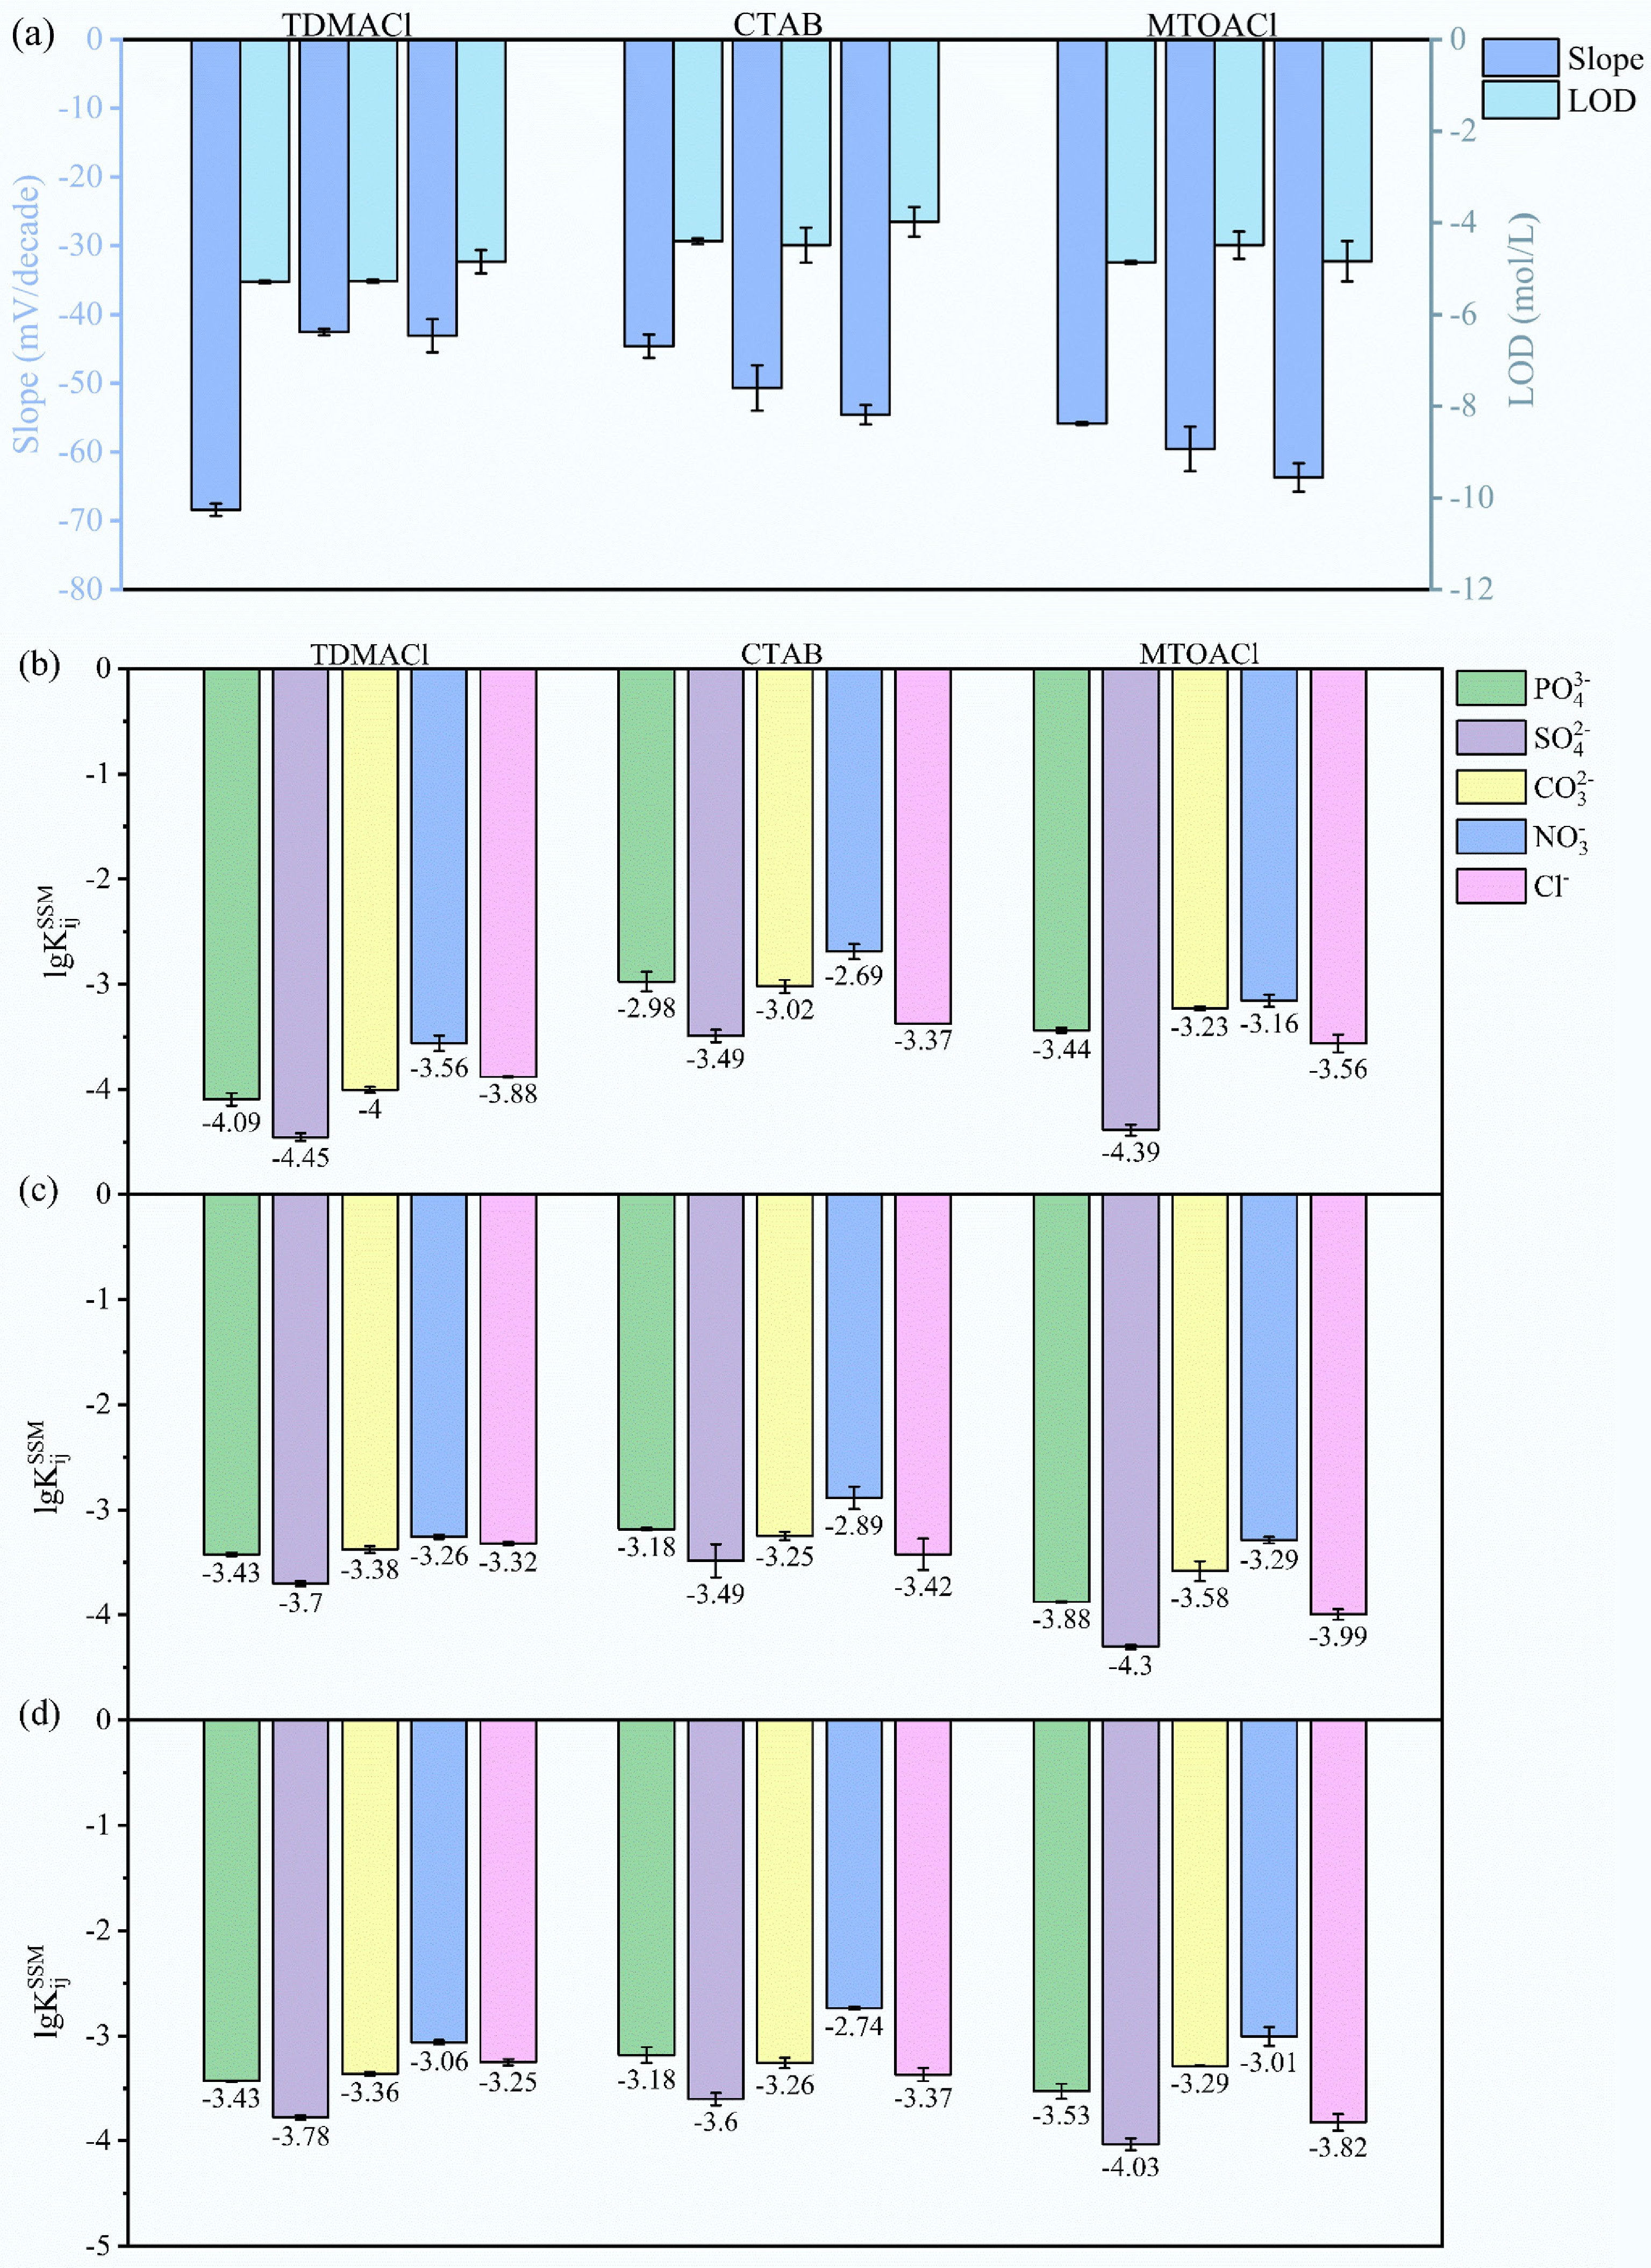
Figure 2.
Response slopes, detection limits, and selectivity coefficients for ionic additives at varying additive-to-ionophore ratios. (a) Response slopes (left axis) and detection limits (right axis) of various ionic additives at 1:2, 1:1, 2:1 additive-to-ionophore ratios. (b) Selectivity coefficients logKijSSM of ionic additives at a 1:2 additive-to-ionophore ratio against various interfering ions. (c) Selectivity coefficients logKijSSM of ionic additives at a 1:1 additive-to-ionophore ratio against various interfering ions. (d) Selectivity coefficients logKijSSM of ionic additives at a 2:1 additive-to-ionophore ratio against various interfering ions.
-
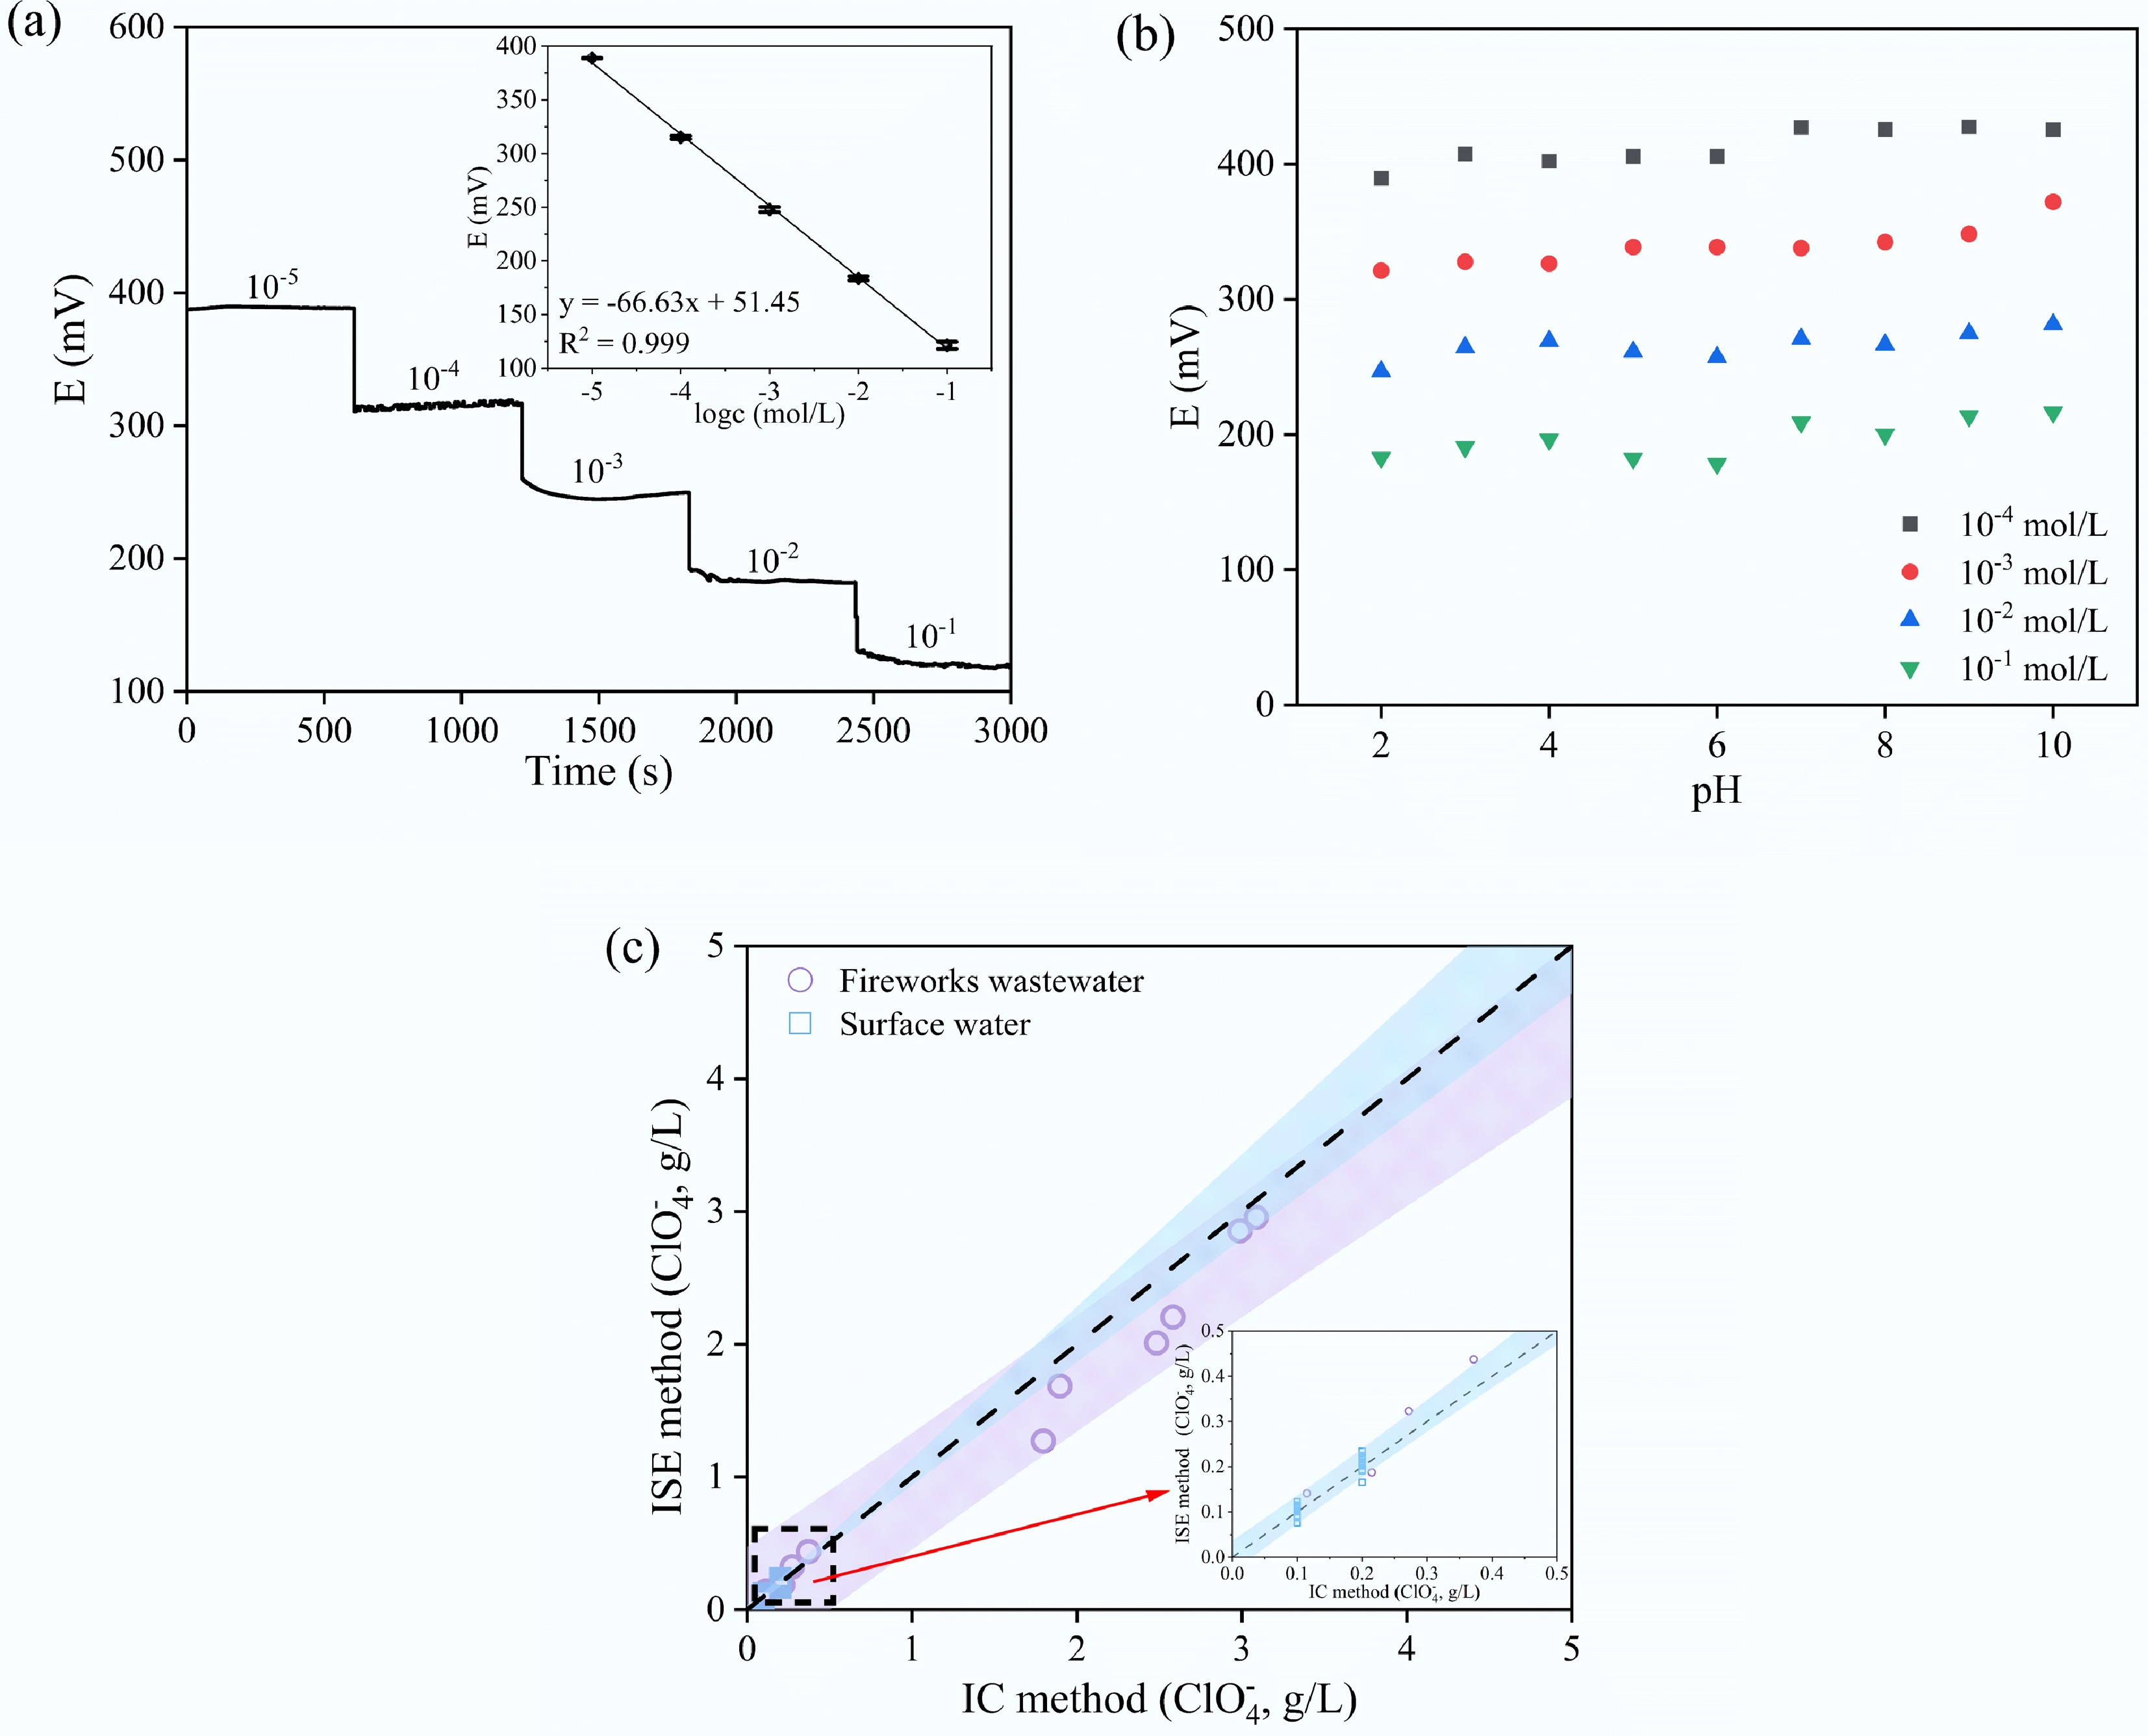
Figure 3.
Evaluation performance of the proposed ISE. (a) Dynamic response time of optimal electrode for step changes in concentration of ClO4− (low to high), inset graph represents the linear region of the average values obtained over the 2- to 10-min interval. (b) Effect of pH of test solutions on the response of the proposed optimized electrode: 10−4–10−1 M NaClO4·H2O. (c) Evaluation of ion-selective electrode accuracy in real wastewater samples.
-
Category Ionophores Plasticizers Ionic additives PVC / plasticizers / ionophores / ionic additives (mg)a Evaluation test I Fe(III)TPPCl NPOE CTAB 600 :1200 : 20 : 60 Linearity, Sensitivity and Selectivity Coefficient Fe(III)TMPPCl 600 : 1200 : 20 : 60 Fe(III)TClPPCl 600 : 1200 : 20 : 60 Co(II)TPP 600 : 1200 : 20 : 60 Cu(II)TPP 600 : 1200 : 20 : 60 Mn(III)TPPCl 600 : 1200 : 20 : 60 Zn(II)TPP 600 : 1200 : 20 : 60 II Fe(III)TPPCl DOS CTAB 600 : 600 : 20 : 60 Linearity and Sensitivity 600 : 900 : 20 : 60 600 : 1200 : 20 : 60 600 : 1500 : 20 : 60 DOP 600 : 600 : 20 : 60 600 : 900 : 20 : 60 600 : 1200 : 20 : 60 600 : 1500 : 20 : 60 DBP 600 : 600 : 20 : 60 600 : 900 : 20 : 60 600 : 1200 : 20 : 60 600 : 1500 : 20 : 60 NPOE 600 : 600 : 20 : 60 600 : 900 : 20 : 60 600 : 1200 : 20 : 60 600 : 1500 : 20 : 60 III Fe(III)TPPCl NPOE TDMACl 600 : 1200 : 20 : 10 Linearity, Sensitivity and Selectivity Coefficient 600 : 1200 : 20 : 20 600 : 1200 : 20 : 40 CTAB 600 : 1200 : 20 : 10 600 : 1200 : 20 : 20 600 : 1200 : 20 : 40 MTOACl 600 : 1200 : 20 : 10 600 : 1200 : 20 : 20 600 : 1200 : 20 : 40 a Add the components to 5 mL of THF in the listed proportions. Table 1.
Optimization of PVC-based membrane sensors with varied plasticizers and ionophores: comparative evaluation of sensitivity, linearity, and selectivity for metal-based porphyrin derivatives detection
-
No. Composition (mg) Slope (mV·decade−1) Linear range (M) LOD (M) PVC Plasticizers Ionophores Ionic additives 1 600 DOS, 600 Fe(III)TPPCl, 20 CTAB, 60 −46.33 10−4 ~ 10−1 10−4.07 DOS, 900 −39.89 10−5 ~ 10−1 10−5.17 DOS, 1200 −47.78 10−5 ~ 10−1 10−5.07 DOS, 1500 −40.48 10−5 ~ 10−1 10−4.95 2 600 DOP, 600 Fe(III)TPPCl, 20 CTAB, 60 −31.65 10−4 ~ 10−1 10−3.99 DOP, 900 −35.48 10−4 ~ 10−1 10−3.9 DOP, 1200 −39.05 10−5 ~ 10−1 10−5.04 DOP, 1500 −35.15 10−5 ~ 10−1 10−4.95 3 600 DBP, 600 Fe(III)TPPCl, 20 CTAB, 60 −40.66 10−4 ~ 10−1 10−4.01 DBP, 900 −43.09 10−5 ~ 10−1 10−5.21 DBP, 1200 −50.83 10−5 ~ 10−1 10−4.99 DBP, 1500 −55.09 10−5 ~ 10−1 10−5.1 4 600 NPOE, 600 Fe(III)TPPCl, 20 CTAB, 60 −50.92 10−3 ~ 10−1 10−3.17 NPOE, 900 −57.08 10−3 ~ 10−1 10−3.47 NPOE, 1200 −44.03 10−7/10−6 ~ 10−1 10−6.53 NPOE, 1500 −59.19 10−4 ~ 10−1 10−4.3 Table 2.
Composition of membranes and potentiometric response characteristics of perchlorate-selective electrodes based on Fe(III)TPPCl
Figures
(3)
Tables
(2)