-
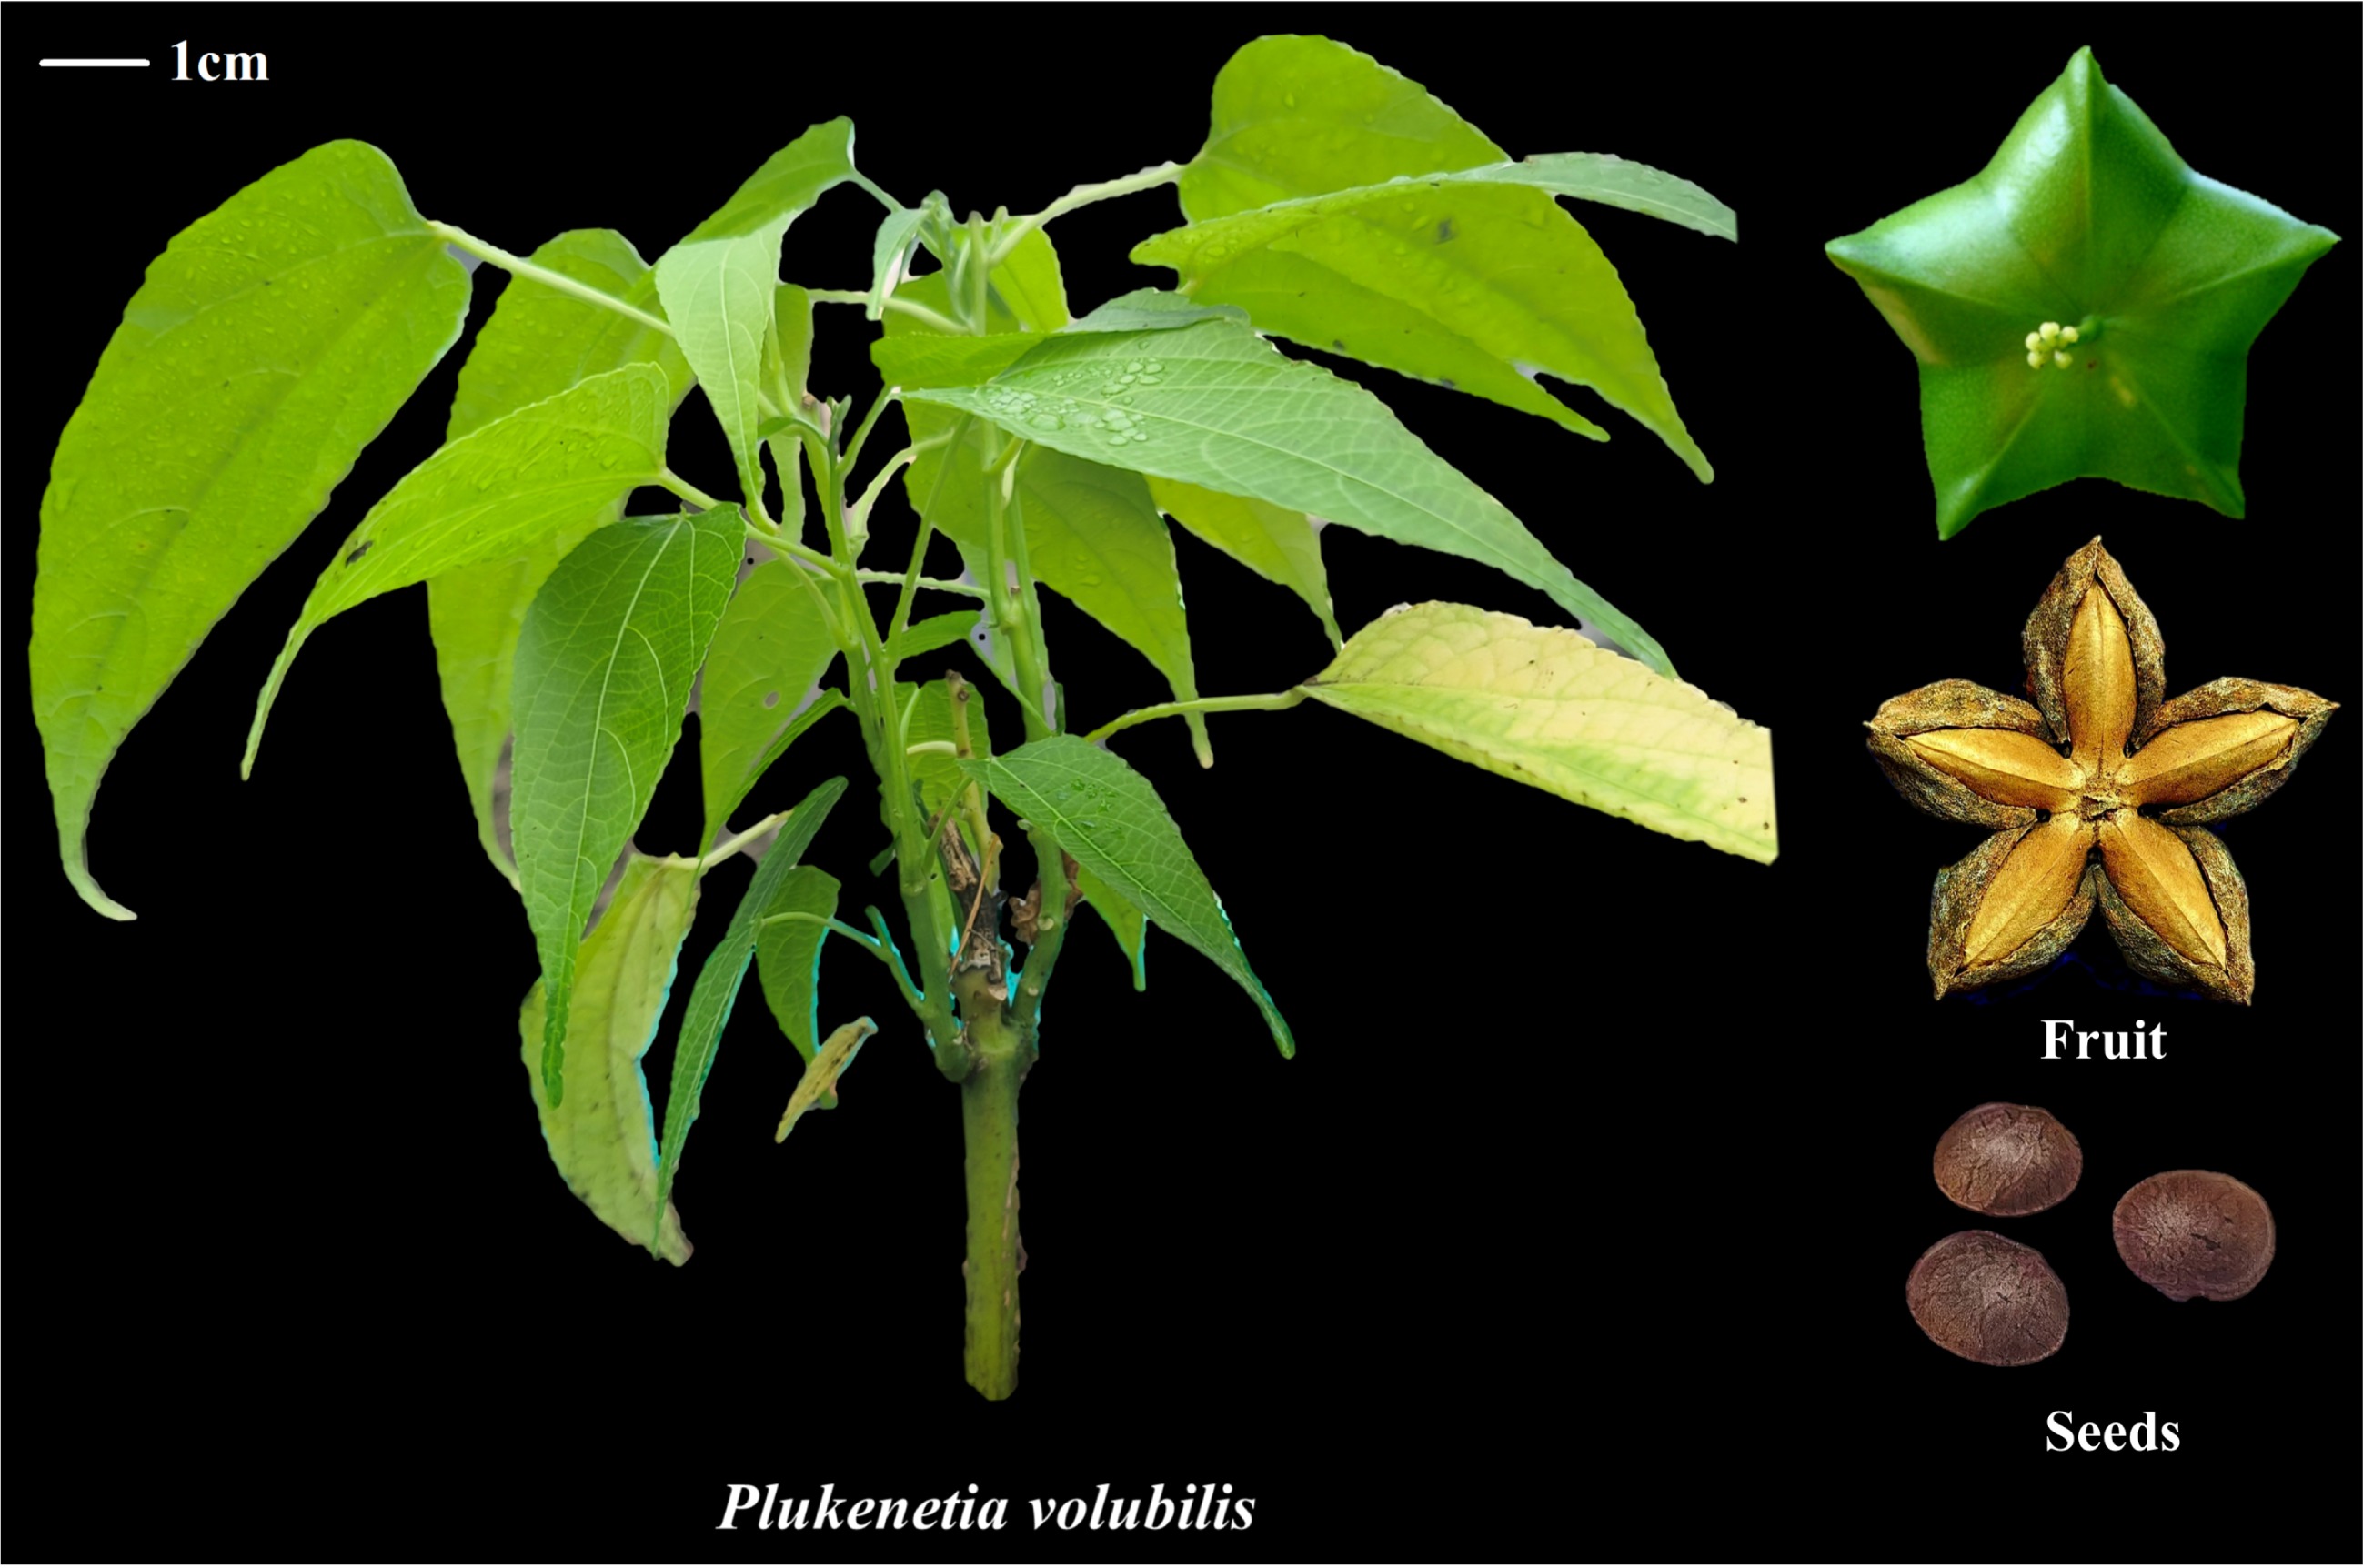
Figure 1.
Phenotypes of Plukenetia volubilis and its fruits.
-
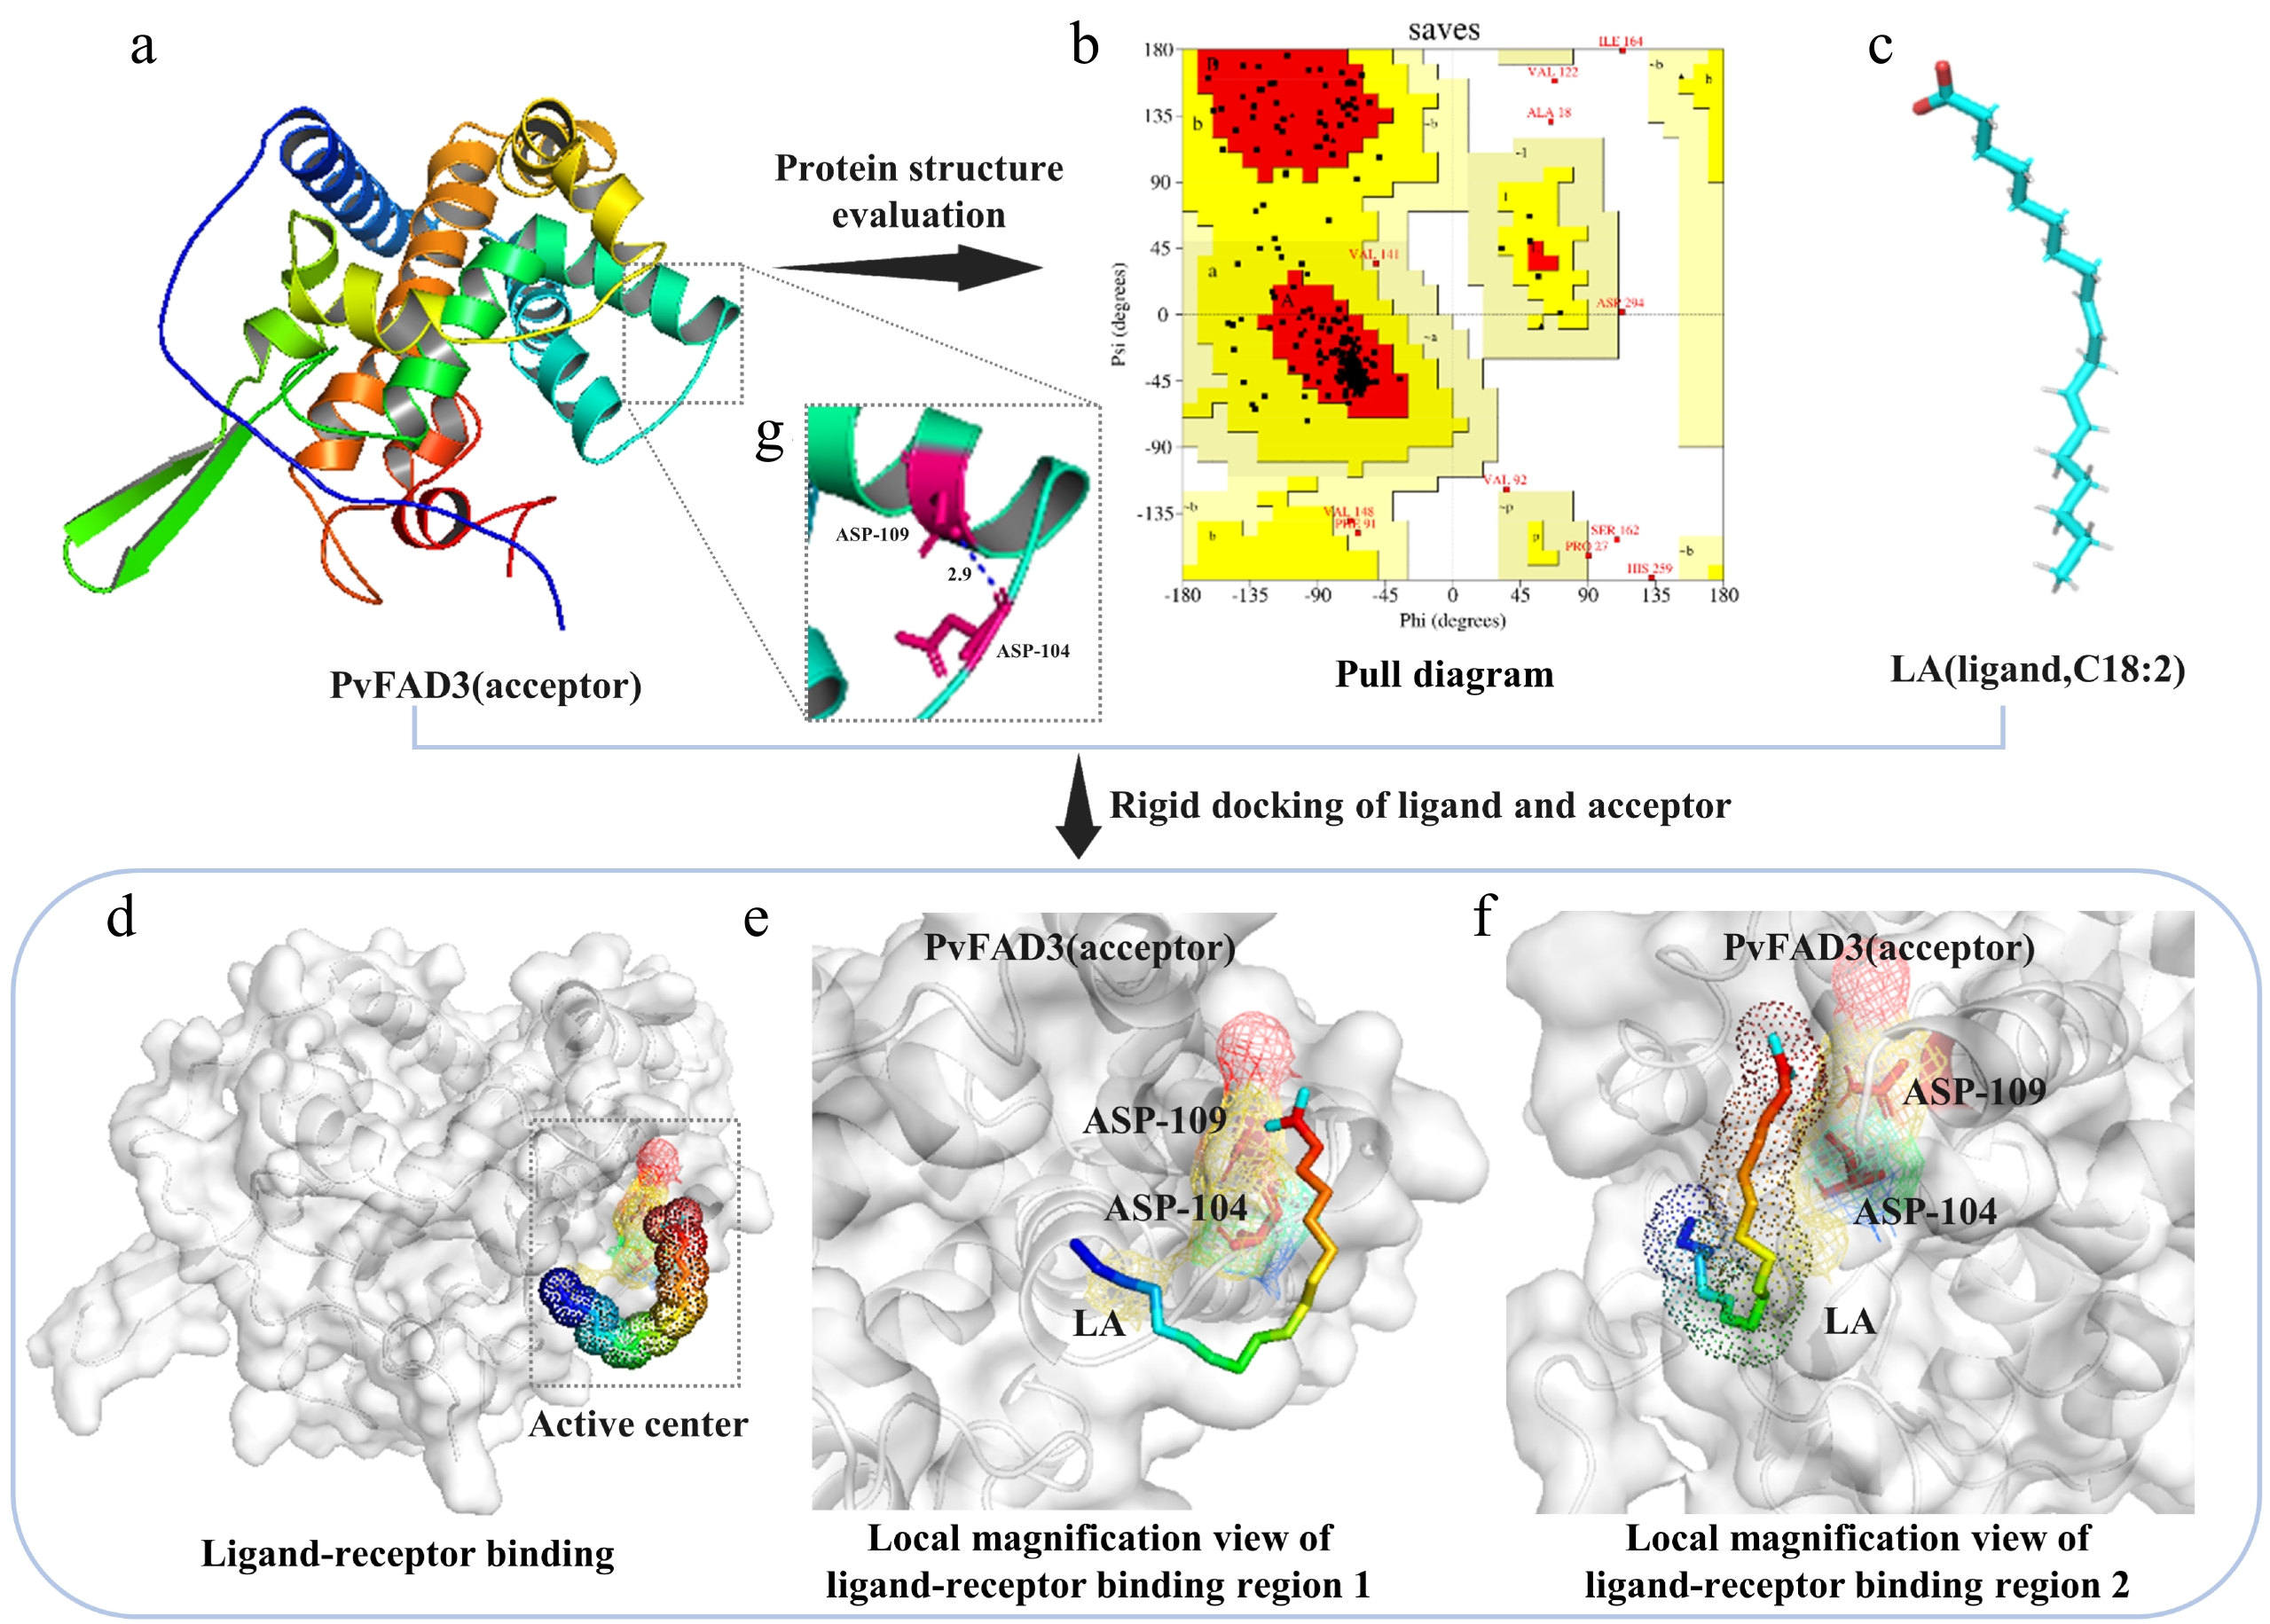
Figure 2.
Model prediction and molecular docking. (a) PvFAD3 tertiary structure prediction. (b) The reliability of the predicted model was evaluated. The Ramachandran plot results showed that 84.1% of the amino acids in the PvFAD3 protein model were located in the most favored region (red region), 11.6% in other allowed regions (yellow region), 1.3% in generally allowed regions (light brown region), and 3% in disallowed regions (white region). If the proportion of amino acid residues falling within the allowed region of the protein model is higher than 90%, the conformation of the model can be considered to conform to the principles of stereochemistry. (c) The tertiary structure of ligand LA. (d) Substrate protein docking prediction. The dashed rectangular region represents the rigid docking active site. (e) Top view of ligand LA small molecule binding to PvFAD3 mimicking protein. (f) Side-view magnification of ligand LA small molecule binding to PvFAD3 mimicking protein. The LA ligand molecule forms hydrogen bonds with the side chain R group of ASP-104 in the simulated PvFAD3 protein. (g) The intramolecular structure of the PvFAD3 protein model was analyzed. The amino acid residues at positions 104 (ASP-104) and 109 (ASN-109) were connected by hydrogen bonds.
-
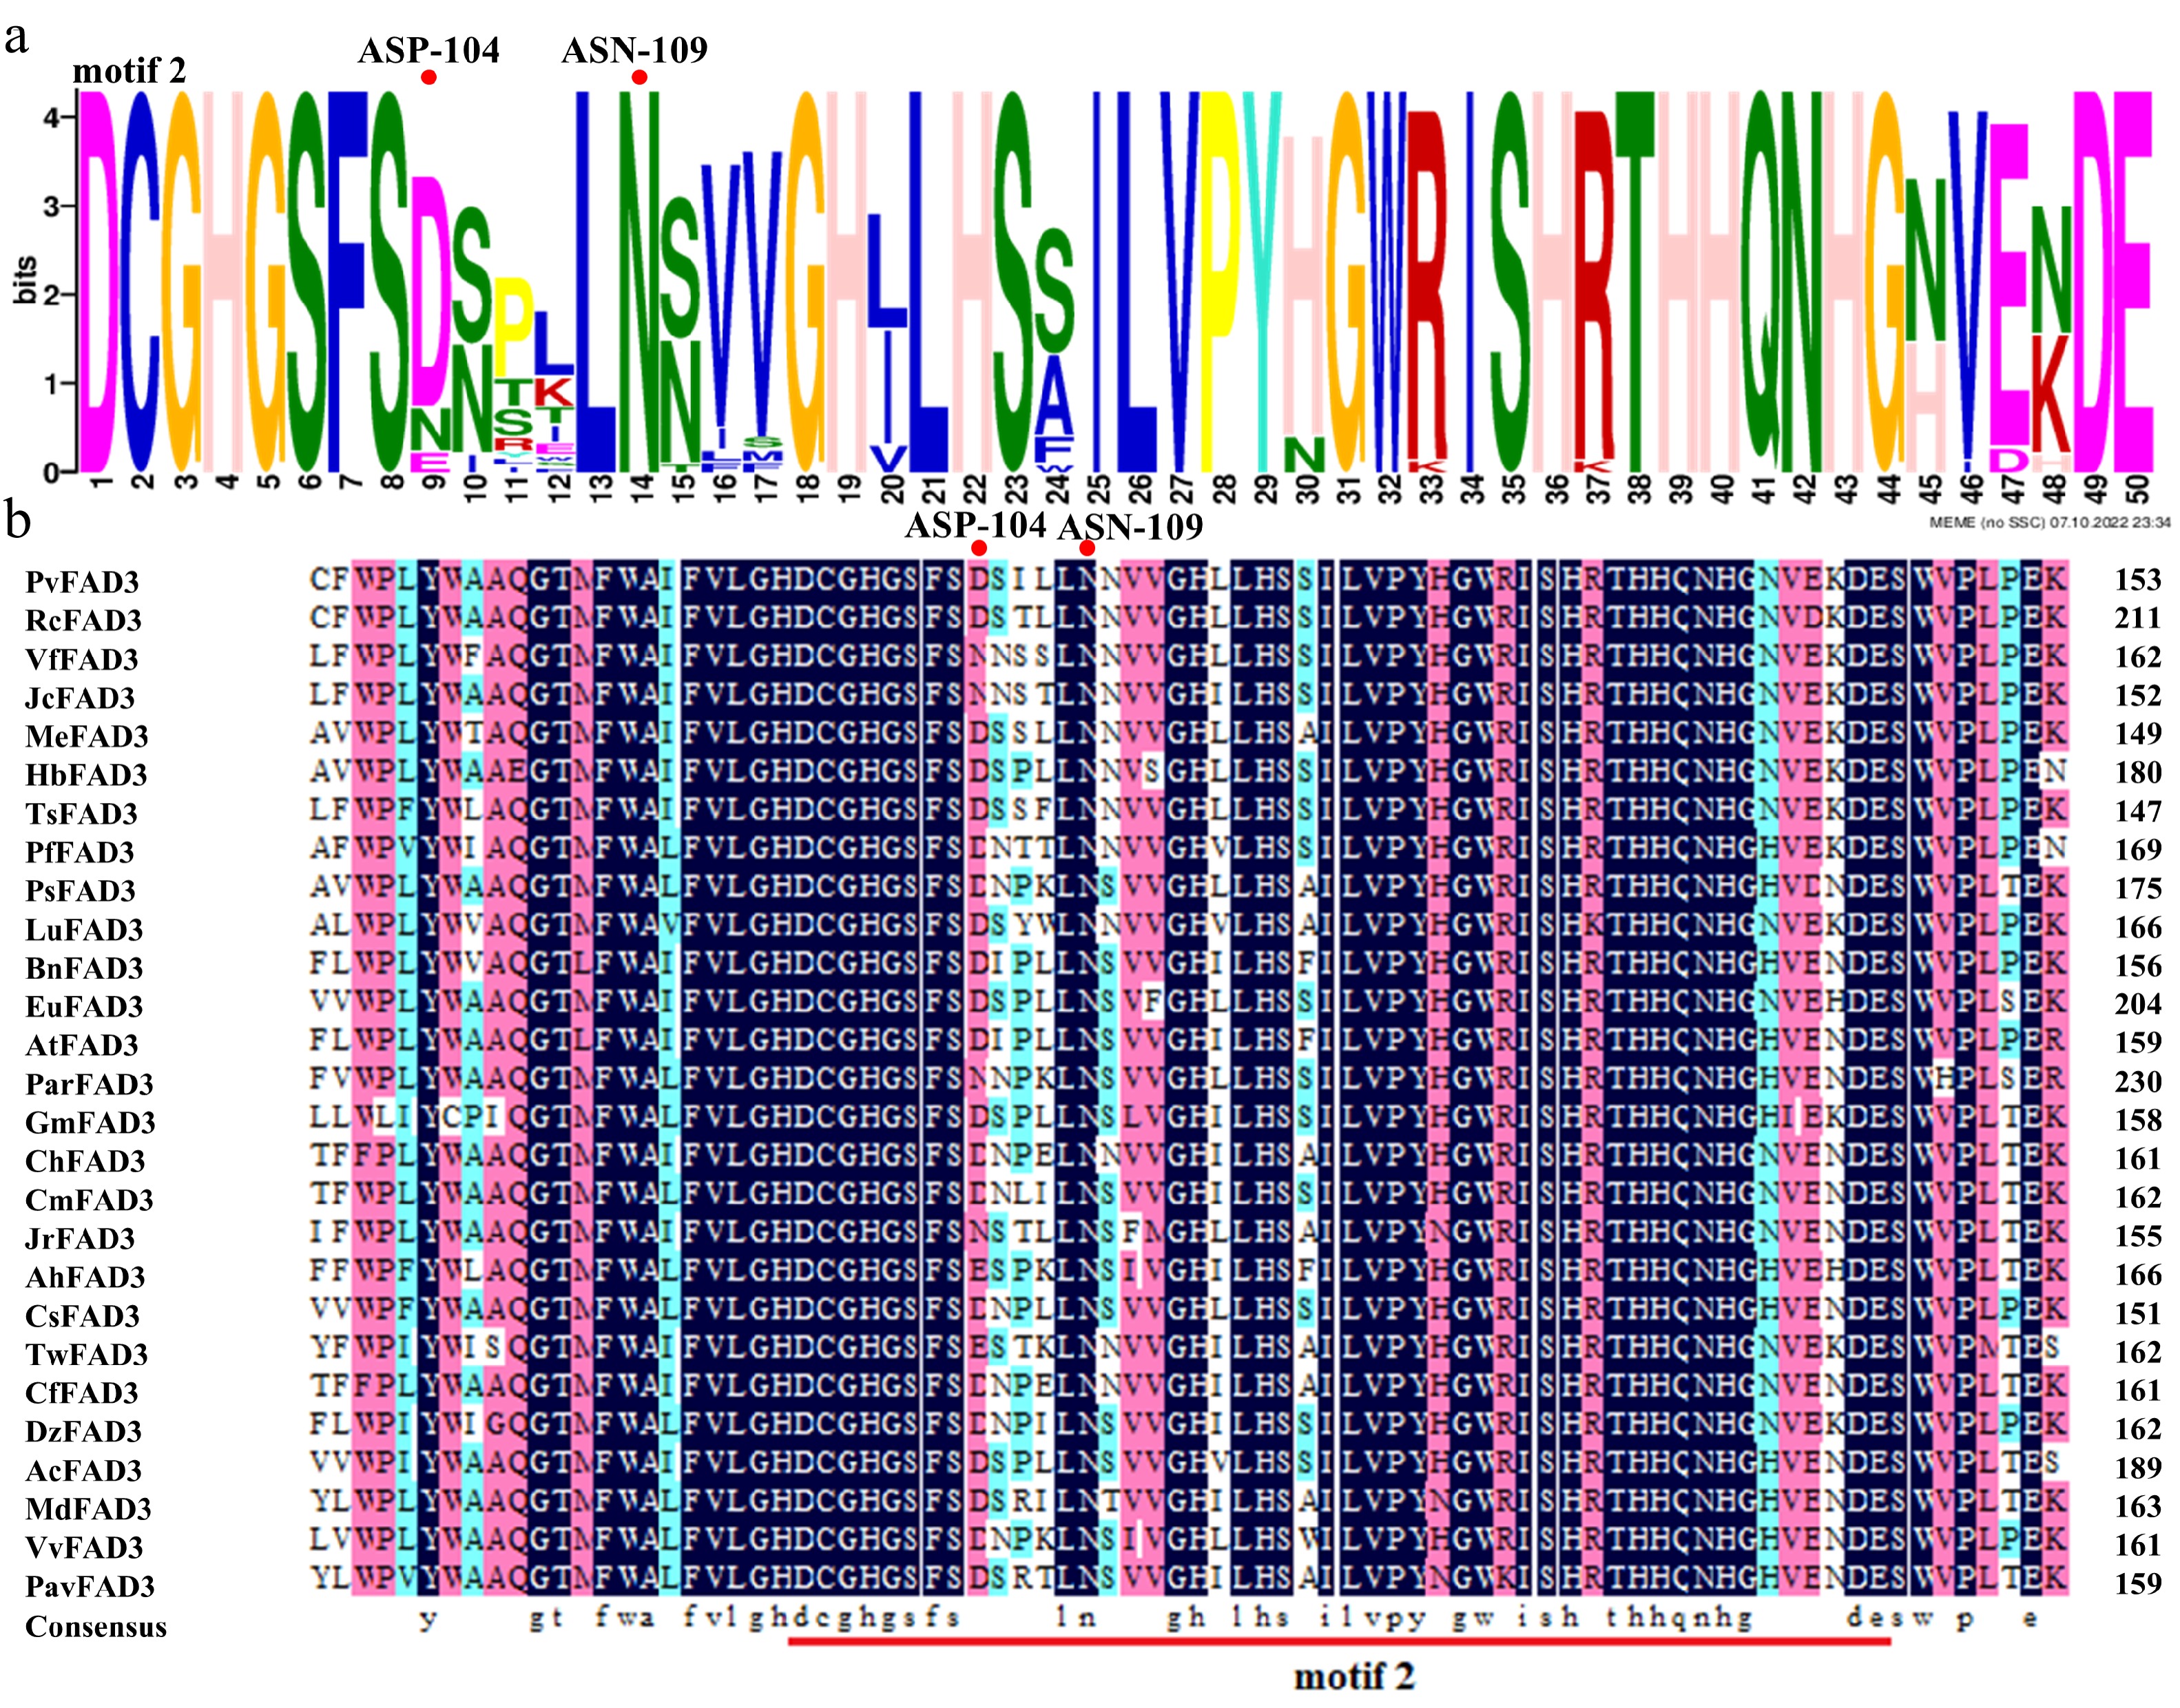
Figure 3.
Conserved domains are predicted by homologous sequence alignment. (a) ASP-104 and ASN-109 are located in the PvFAD3 protein conserved domain motif 2. The larger the letter font, the more conserved the site. (b) The comparison of FAD3 proteins in 27 different species. There were significant differences in ASP-104 among different species, while ASN-109 was absolutely conserved. Dark blue: amino acid homology = 100%, Pink: amino acid homology ≥ 75%, Light blue: amino acid homology ≥ 50%. RcFAD3, EEF36775.1; VfFAD3, AAC98967.2; JcFAD3, NP_001292929.1; MeFAD3, XP_021610352.1; MeFAD3, XP_021610352.1; HbFAD3, XP_021666224.1; TsFAD3, ABM68629.1; PfFAD3, AQZ42316.1; PsFAD3, AVZ47050.1; LuFAD3, BAG70950.1; BnFAD3, AAT09135.1; EuFAD3, ARQ20744.1; AtFAD3, NP_180559.1; ParFAD3, CAB4284757.1; GmFAD3, NP_001236114.1; ChFAD3, AEF80000.1; CmFAD3, KAF3952997.1; JrFAD3, XP_018835457.1; AhFAD3, QBI71562.1; CsFAD3, XP_028086292.1; TwFAD3, XP_038705526.1; CfFAD3, KAE8039281.1; DzFAD3, XP_022756628.1; AcFAD3, PSS09495.1; MdFAD3, XP_008384790.2; VvFAD3, XP_002277573.1; PavFAD3, XP_021816263.1.
-
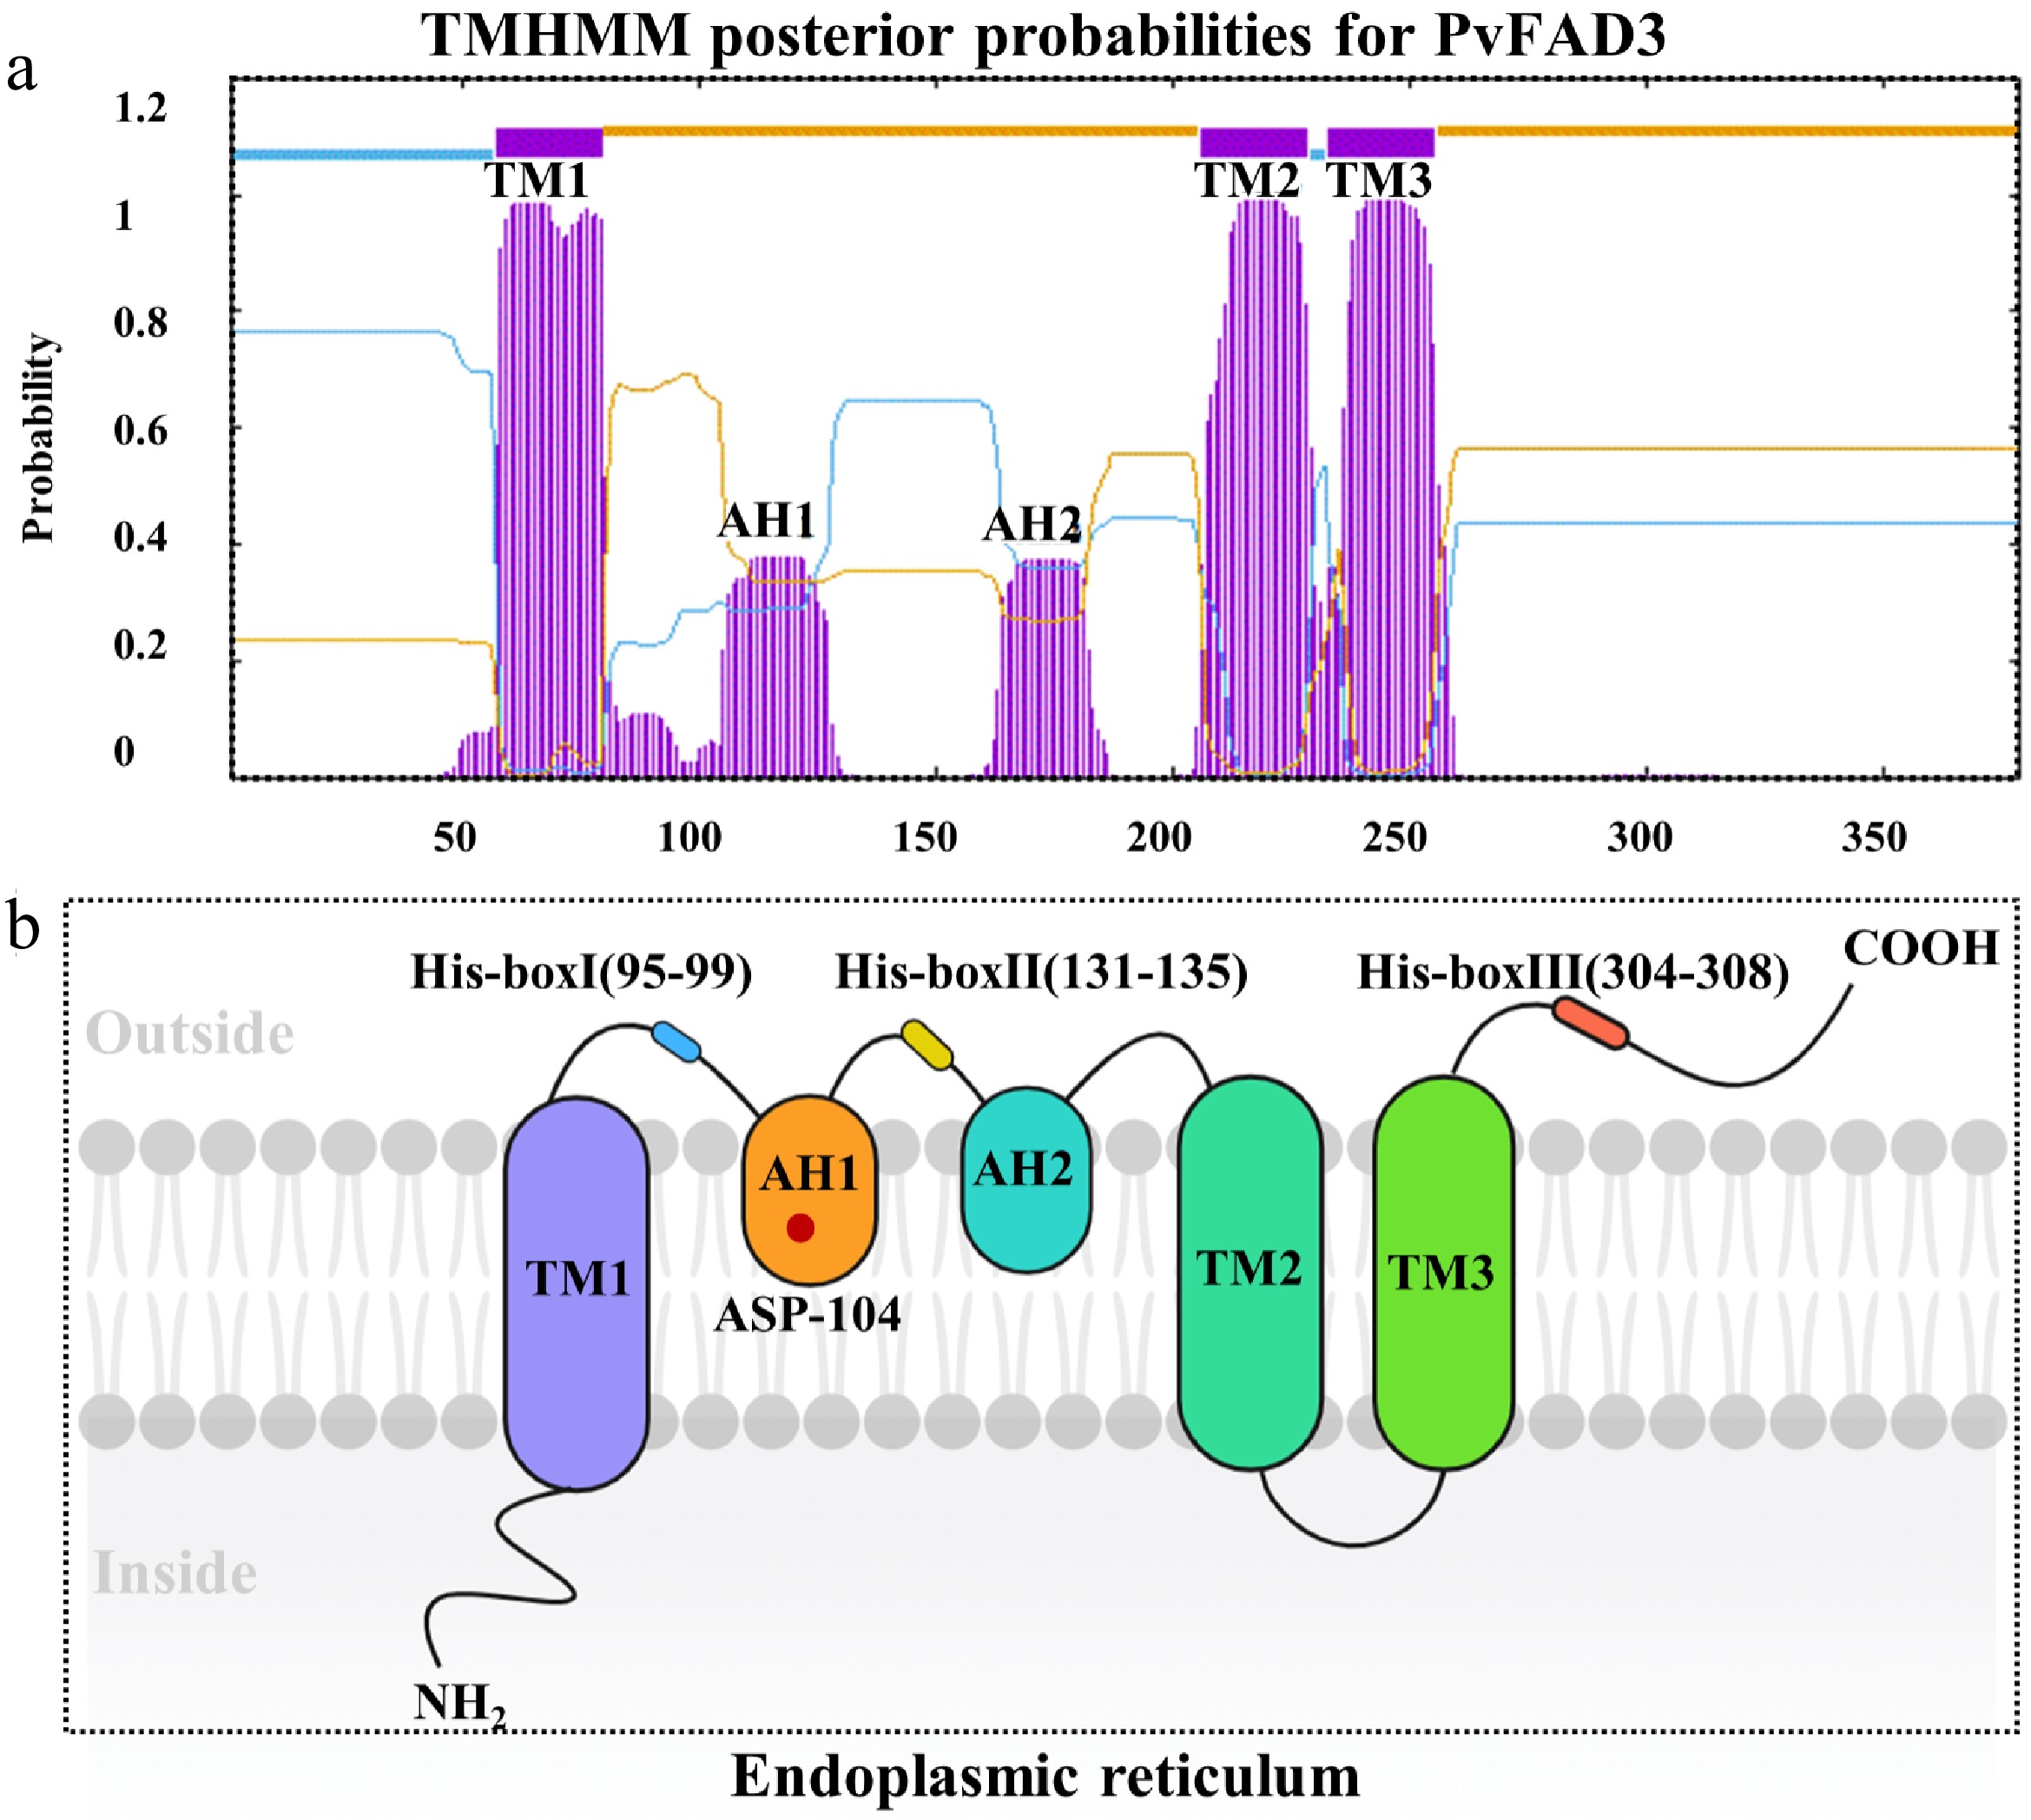
Figure 4.
The topological model of PvFAD3. (a) PvFAD3 protein cross membrane structure prediction. The purple structure represents a cross-membrane or inlaid protein structure. (b) Topological model prediction of PvFAD3 proteins. TM1, TM2, and TM3: Protein transmembrane structure. AH1 and AH2: Protein mosaic structure. His-boxI, His-boxII, and His-boxIII: Histidine active region. Red Star: ASP-104.
-
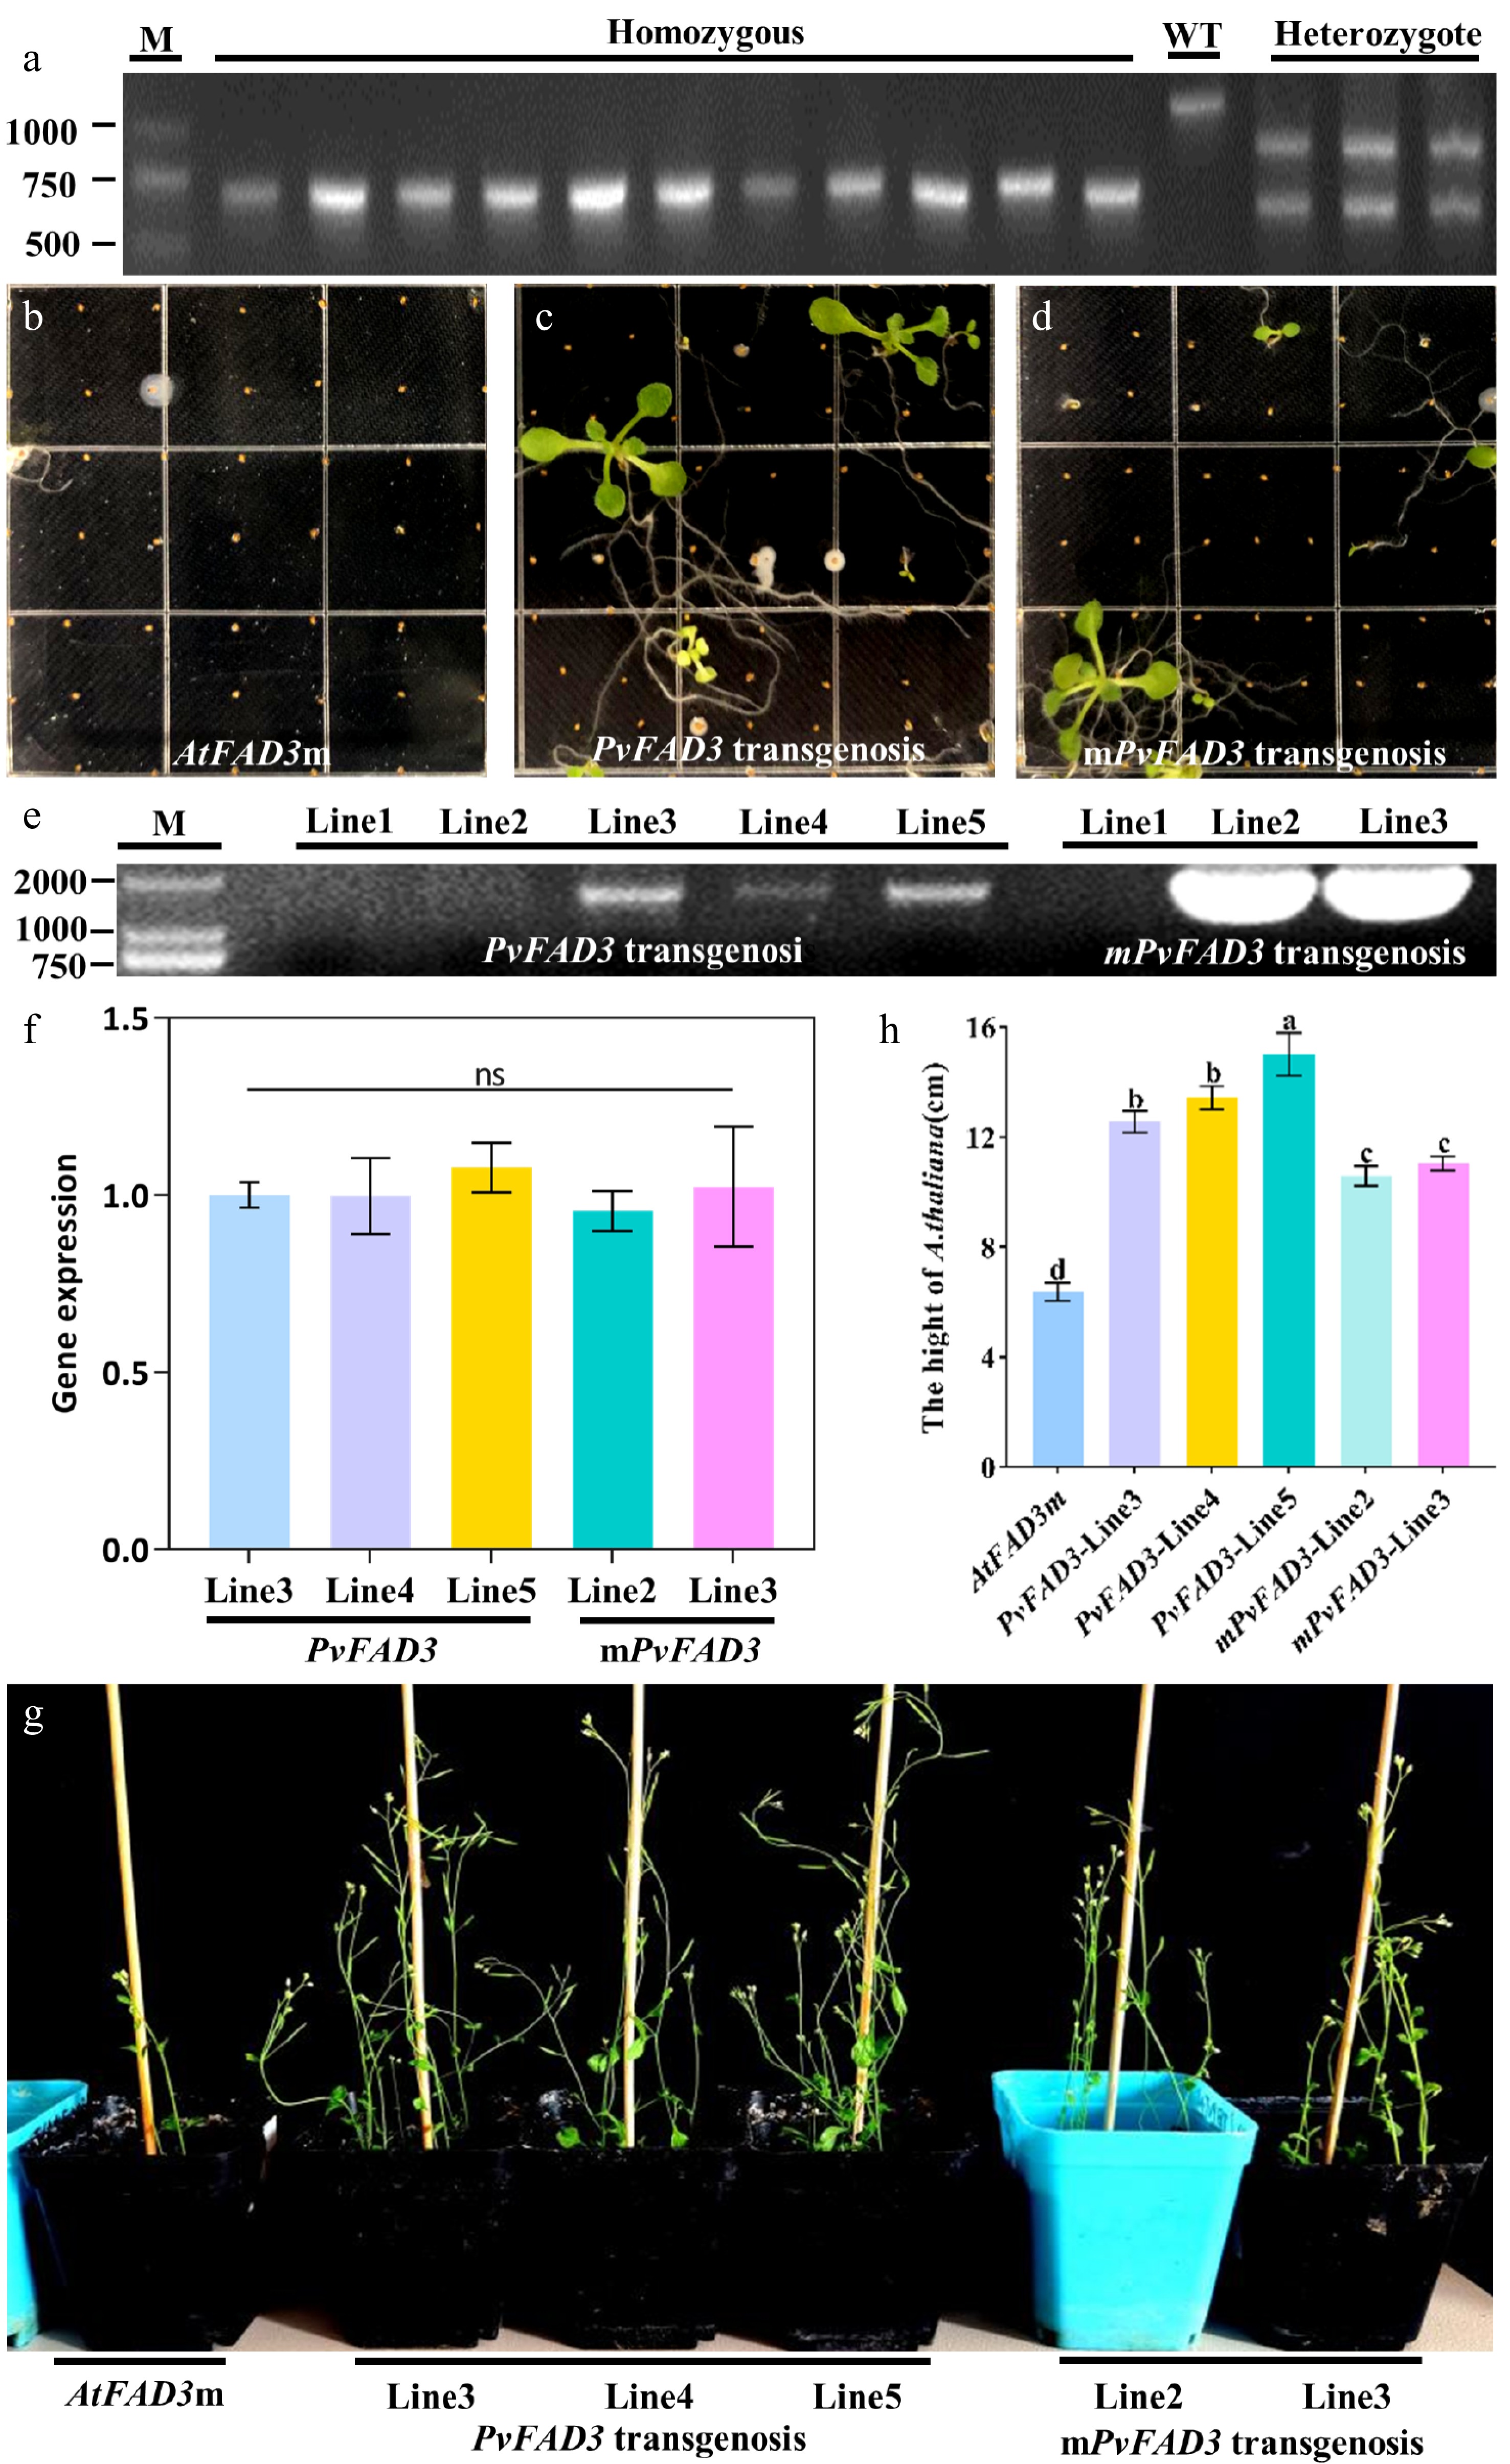
Figure 5.
Homozygous screening and genetic transformation of AtFAD3m. (a) AtFAD3m homozygote, WT and AtFAD3m heterozygote. (b) AtFAD3m seeding. (c) The transgenic PvFAD3 positive seedlings of T1 generation were screened for Kana+ resistance. (d) The transgenic mPvFAD3 positive seedlings of T1 generation were screened for Kana+ resistance. (e) PCR screening of transgenic plants. (f) RT-qPCR validation of transgenic plants. (g) When T3 positive seedlings were transplanted into soil for 5 weeks, the growth state of transformed PvFAD3 and mPvFAD3 was significantly better than that of AtFAD3m. (h) Plant height statistics of AtFAD3m, PvFAD3, and mPvFAD3.
-
Culture condition Group FA components (%) C14:0 C16:0 C16:1 C18:0 C18:1 C18:2 C18:3 30 °C pYES2 1.28 ± 0.34c 12.16 ± 0.76e 43.12 ± 0.61a 2.82 ± 0.06c 21.36 ± 0.65a 19.26 ± 0.40c 0.00 ± 0.00e pYES2-PvFAD3 12.63 ± 0.45a 44.03 ± 0.54b 6.24 ± 0.08c 1.59 ± 0.04d 9.87 ± 0.55c 17.14 ± 0.64d 8.49 ± 0.09b pYES2-mPvFAD3 1.67 ± 0.07c 15.27 ± 0.53d 42.23 ± 0.49a 4.15 ± 0.06b 22.77 ± 0.55a 7.35 ± 0.39e 6.56 ± 0.17c 20 °C pYES2 0.00 ± 0.00d 15.98 ± 0.30d 29.01 ± 0.42b 4.53 ± 0.22a 14.09 ± 0.76b 36.39 ± 0.71a 0.00 ± 0.00e pYES2-PvFAD3 10.99 ± 0.23b 62.04 ± 0.34a 1.42 ± 0.15d 1.33 ± 0.07d 6.78 ± 0.43d 1.92 ± 0.28f 15.52 ± 0.32a pYES2-mPvFAD3 1.94 ± 0.22c 18.50 ± 0.54c 28.09 ± 0.43b 4.66 ± 0.05a 19.64 ± 0.68a 22.10 ± 0.44b 5.06 ± 0.47d Different letters indicate significant differences (p < 0.05). Table 1.
Fatty acid compositions in different yeasts.
-
Group FA components (%) C16:0 C18:0 C18:1 C18:2 C18:3 C20:0 C20:1 Total AtFAD3m AtFAD3m - line1 1.62 ± 0.02d 0.78 ± 0.04c 2.79 ± 0.06de 6.94 ± 0.06g 0.21 ± 0.02b 0.42 ± 0.02d 3.03 ± 0.05f 15.78 ± 0.08f AtFAD3m - line2 1.65 ± 0.06d 0.80 ± 0.04c 2.93 ± 0.06d 7.51 ± 0.08e 0.20 ± 0.03b 0.44 ± 0.03cd 3.15 ± 0.04e 16.68 ± 0.16e AtFAD3m - line3 1.64 ± 0.03d 0.80 ± 0.06c 2.74 ± 0.04e 7.25 ± 0.15f 0.19 ± 0.01b 0.40 ± 0.02d 3.07 ± 0.05ef 16.09 ± 0.26f PvFAD3 transfer PvFAD3 - line3 1.77 ± 0.06c 0.79 ± 0.04c 3.59 ± 0.19c 9.78 ± 0.03b 0.29 ± 0.02a 0.55 ± 0.04b 4.13 ± 0.07c 20.90 ± 0.33c PvFAD3 - line4 1.75 ± 0.02c 0.83 ± 0.06c 3.62 ± 0.06c 9.53 ± 0.06c 0.30 ± 0.02a 0.57 ± 0.02b 4.12 ± 0.05c 21.73 ± 0.12c PvFAD3 - line5 2.35 ± 0.06a 1.10 ± 0.03a 4.67 ± 0.13a 10.96 ± 0.05a 0.29 ± 0.03a 0.65 ± 0.02a 5.14 ± 0.05a 25.17 ± 0.06a mPvFAD3 transfer mPvFAD3 - line2 1.76 ± 0.08c 0.85 ± 0.03bc 3.68 ± 0.09c 8.49 ± 0.08d 0.19 ± 0.01b 0.47 ± 0.02c 3.94 ± 0.08d 19.40 ± 0.16d mPvFAD3 - line3 1.92 ± 0.07b 0.91 ± 0.02b 4.08 ± 0.05b 9.67 ± 0.10bc 0.19 ± 0.02b 0.53 ± 0.03b 4.36 ± 0.06b 21.66 ± 0.04b Different letters indicate significant differences (p < 0.05). Table 2.
Fatty acid compositions in Arabidopsis seeds.
Figures
(5)
Tables
(2)