-
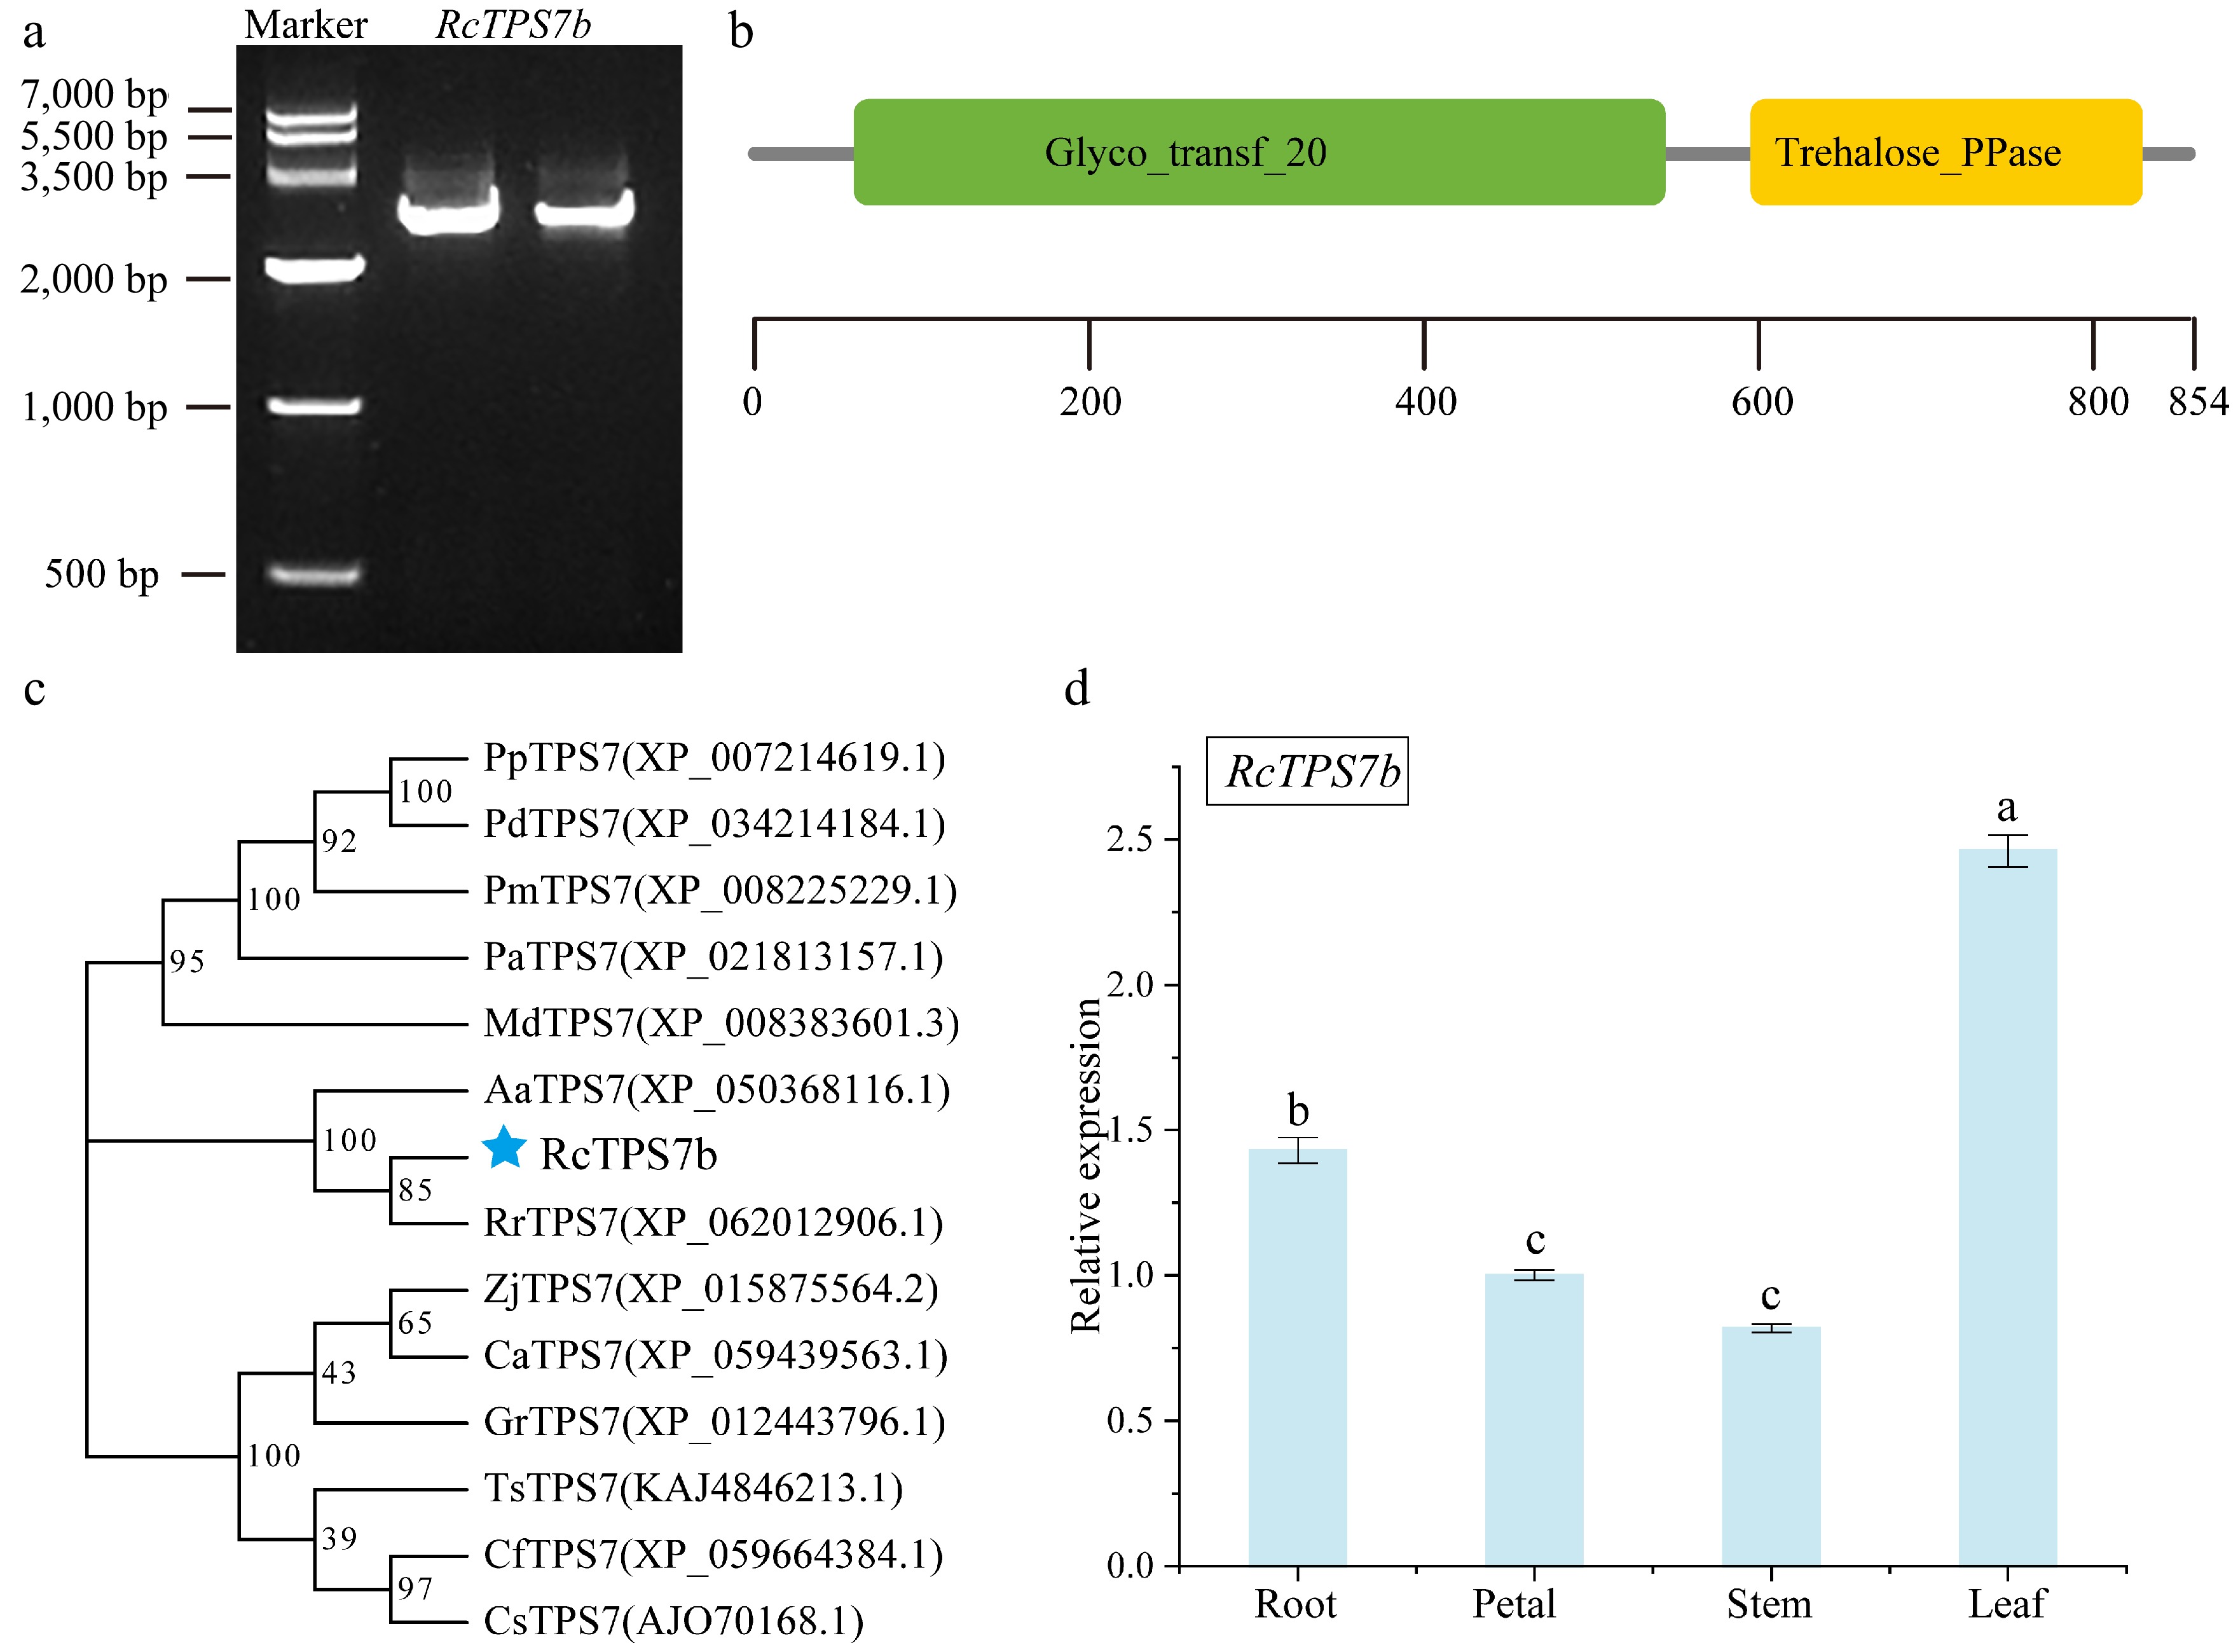
Figure 1.
Characterization and phylogenetic analysis of RcTPS7b. (a) PCR amplification of RcTPS7b. (b) Conserved protein domains analysis of RcTPS7b. The green box represents the Glyco_transf_20 (TPS) domain, and the yellow box represents the trehalose_PPase (TPP) domain. (c) Phylogenetic tree of TPS7 orthologs. Pp, Prunus persica; Pd, Prunus dulcis; Pm, Prunus mume; Pa, Prunus avium; Md, Malus domestica; Aa, Argentina anserina; Rr, Rosa rugosa; Zj, Ziziphus jujuba; Ca, Corylus avellana; Gr, Gossypium raimondii; TS, Turnera subulata; Cf, Cornus florida; Cs, Camellia sinensis. Bootstrap values are shown at the nodes. The blue star indicates RcTPS7b. (d) Tissue-specific expression of RcTPS7b in roots, stems, leaves, and petals (mean ± SD; ANOVA; a > b > c labels; p < 0.05).
-
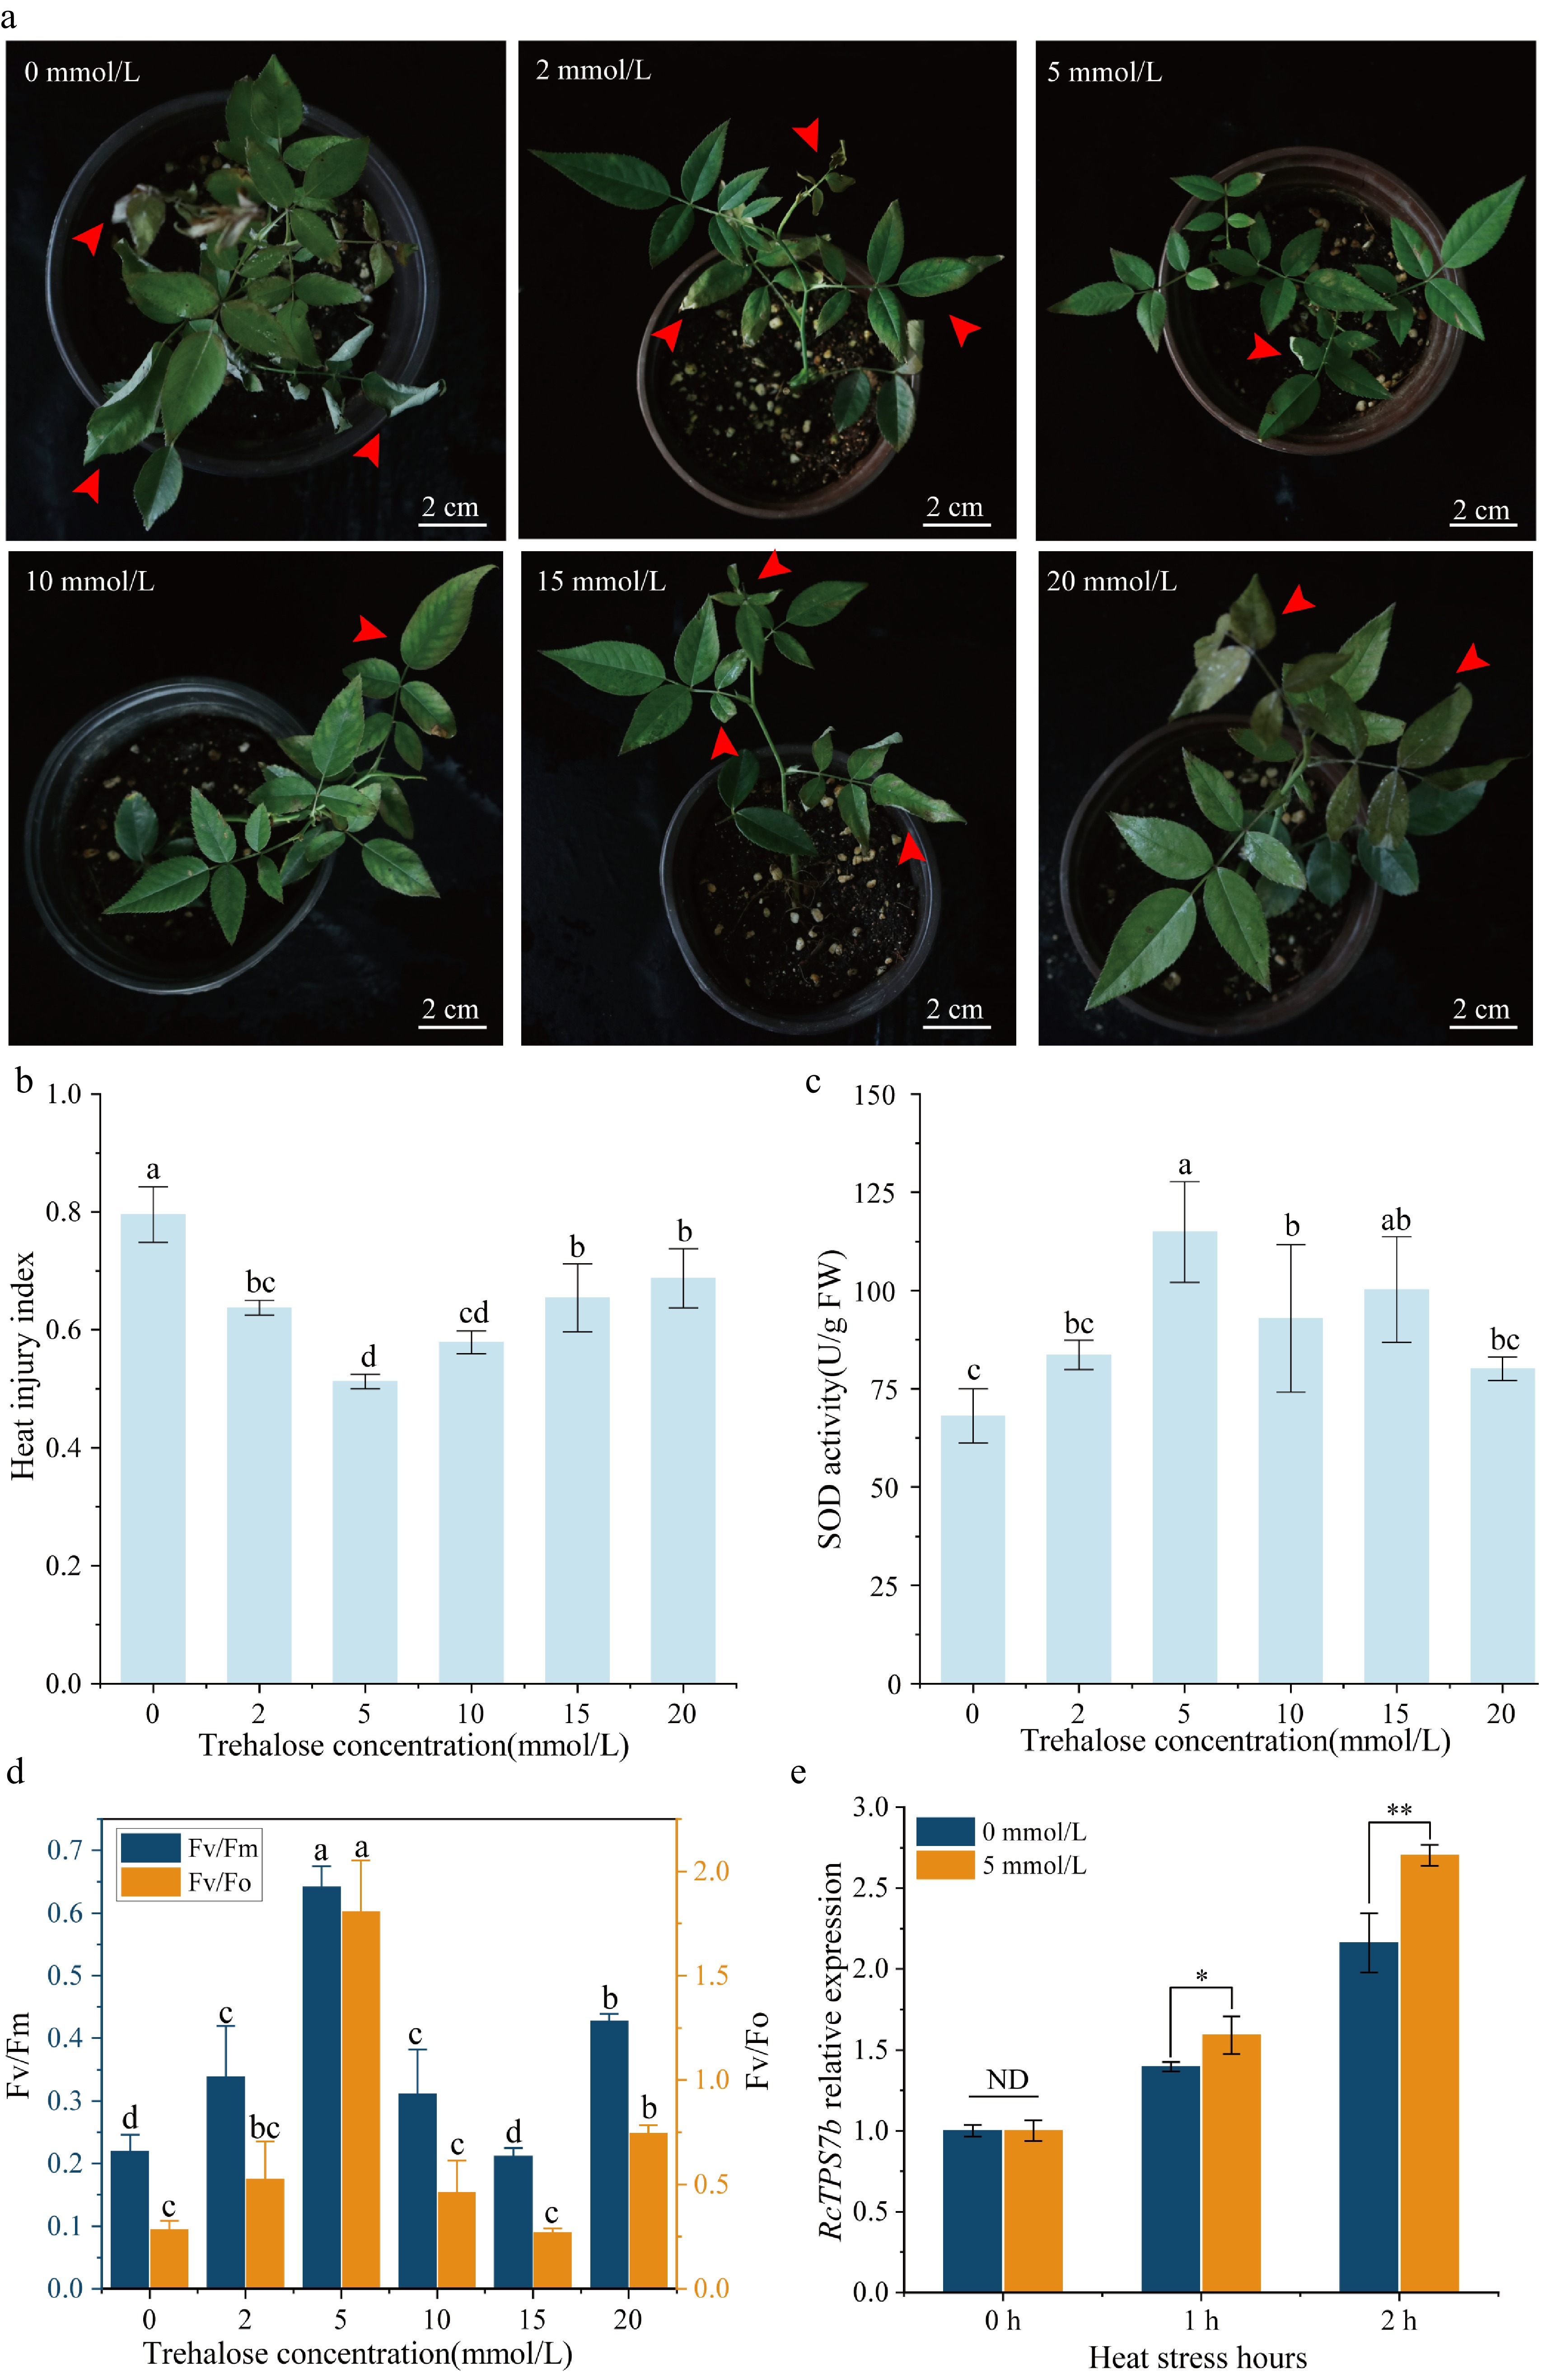
Figure 2.
Exogenous trehalose treatment improved the heat tolerance of R. chinensis 'Slater's Crimson China'. (a) Phenotypic analysis of R. chinensis 'Slater's Crimson China' treated with 0–20 mmol/L trehalose under 45 °C for 36 h. (b) Heat injury index analysis. (c) SOD activity analysis. (d) Parameter analysis of the photosynthetic system. (e) Transcription analysis of RcTPS7b in R. chinensis plants treated with 0 or 5 mmol/L trehalose under heat stress. Data are presented as the mean ± SD of three biological replicates. In (b)–(d), letters denote significant differences (ANOVA; a > b > c >d; p < 0.05). In (e), * p < 0.05 and ** p < 0.01 (Student's t-test; ND, no difference).
-
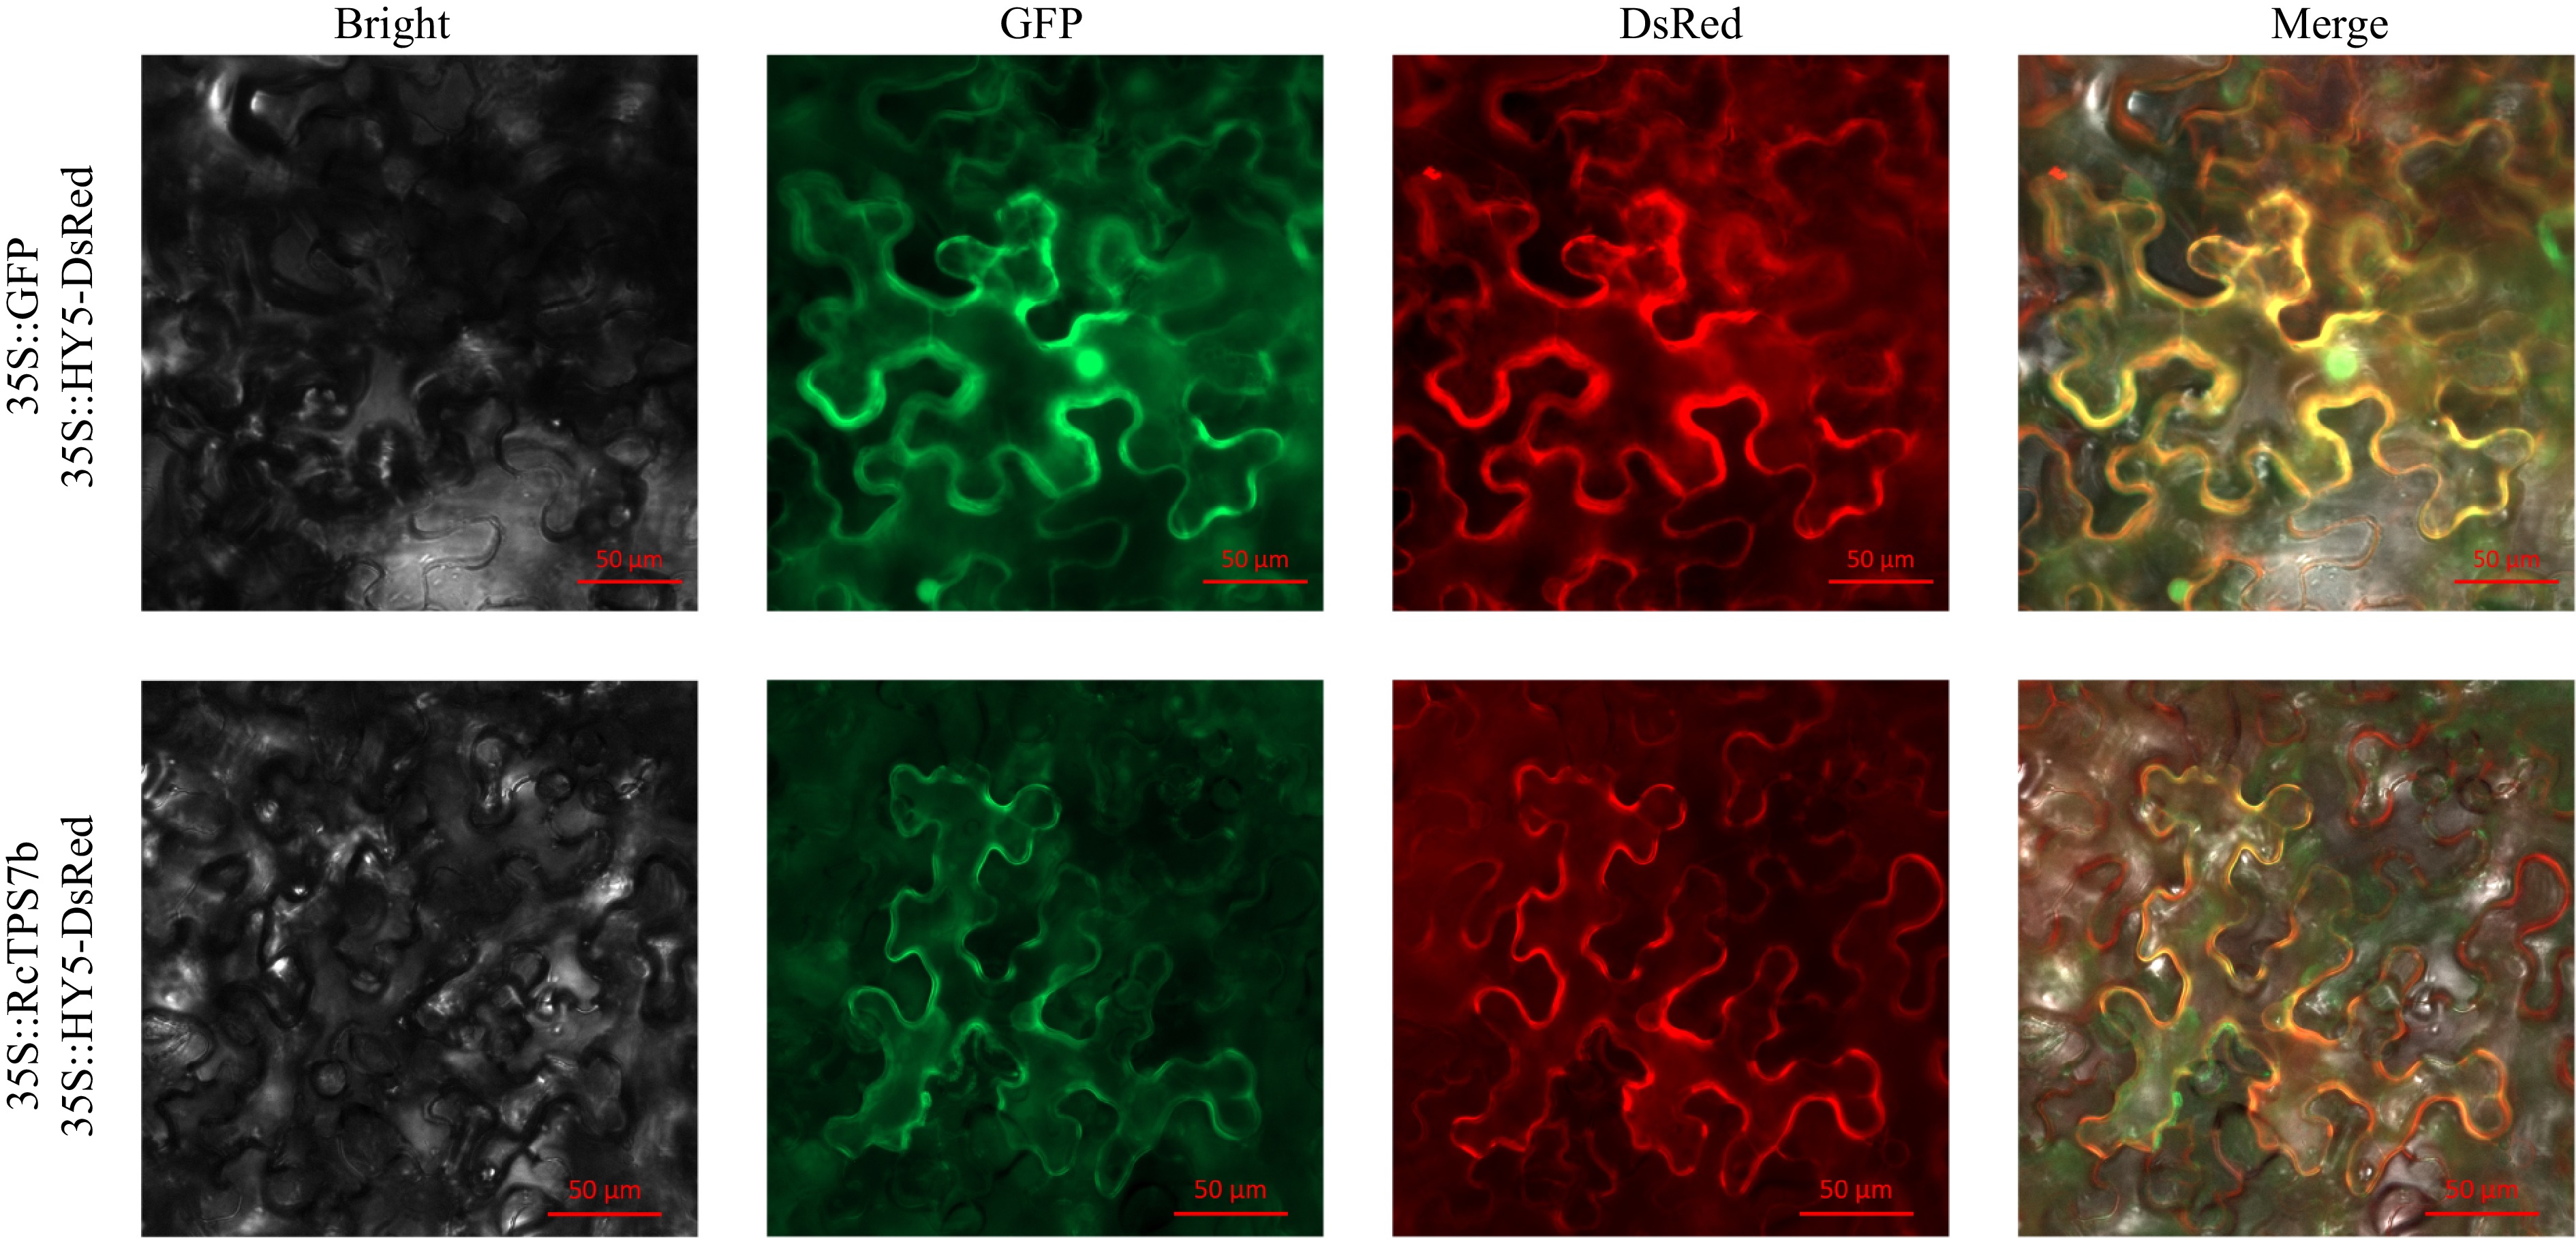
Figure 3.
Subcellular localization of RcTPS7b in tobacco leaves. Bright, brightfield; GFP, GFP fluorescence; DsRed, cell membrane marker fluorescence; Merge, superimposed field.
-
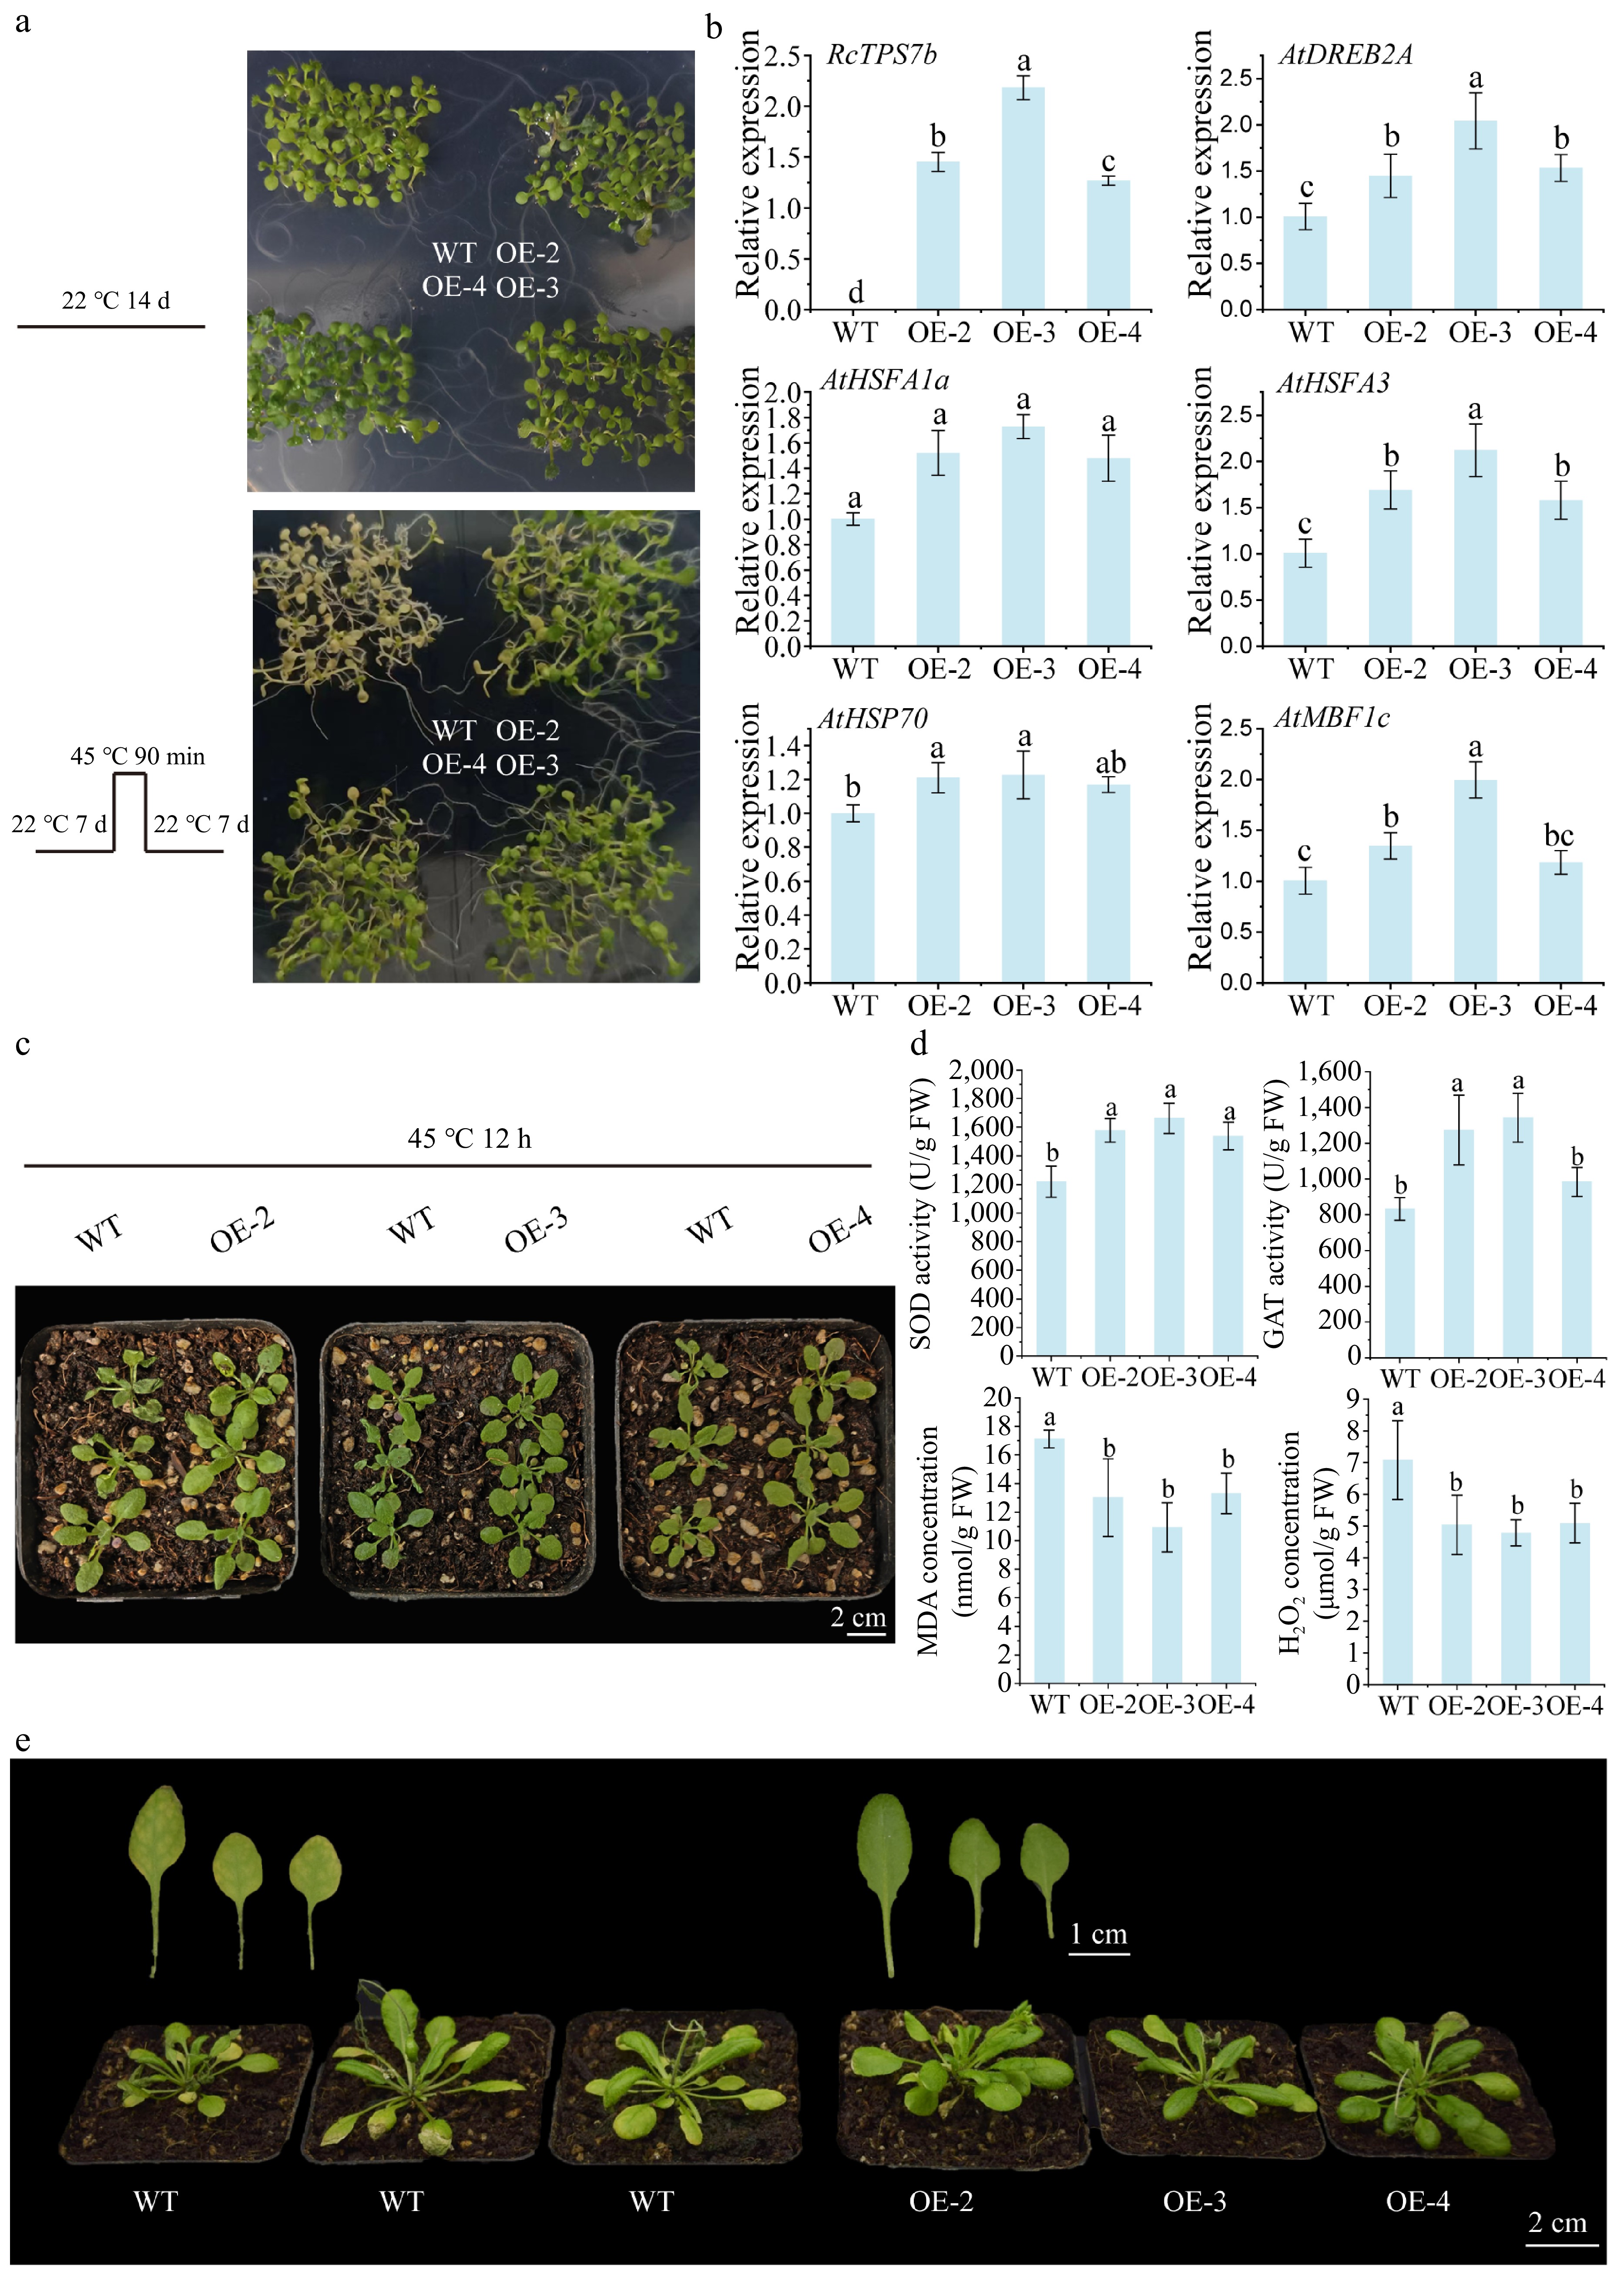
Figure 4.
Overexpression of RcTPS7b improved the heat tolerance of A. thaliana. (a) The phenotypic changes in 7-day-old WT and overexpression (OE) lines were observed at 22 °C for 14 days, at 22 °C for 7 d then at 45 °C for 90 min, and then at 22 °C for 7 d. (b) Transcriptional expression of RcTPS7b and heat stress response genes in 7-day-old WT and OE lines after 90 min of heat stress at 45 °C followed by 7 d of recovery growth at 22 °C (ANOVA; a > b > c > d; p < 0.05). (c) Phenotypic changes in 20-day-old WT and OE lines under heat stress at 45 °C for 12 h. (d) Determination of the content of physiologically active substances in 20-day-old WT and OE lines under 45 °C heat stress for 12 h (ANOVA; a > b; p < 0.05). (e) Phenotypic changes in 30-day-old WT and OE lines under heat stress at 45 °C for 36 h. Data are presented as the mean ± SD of three biological replicates.
-
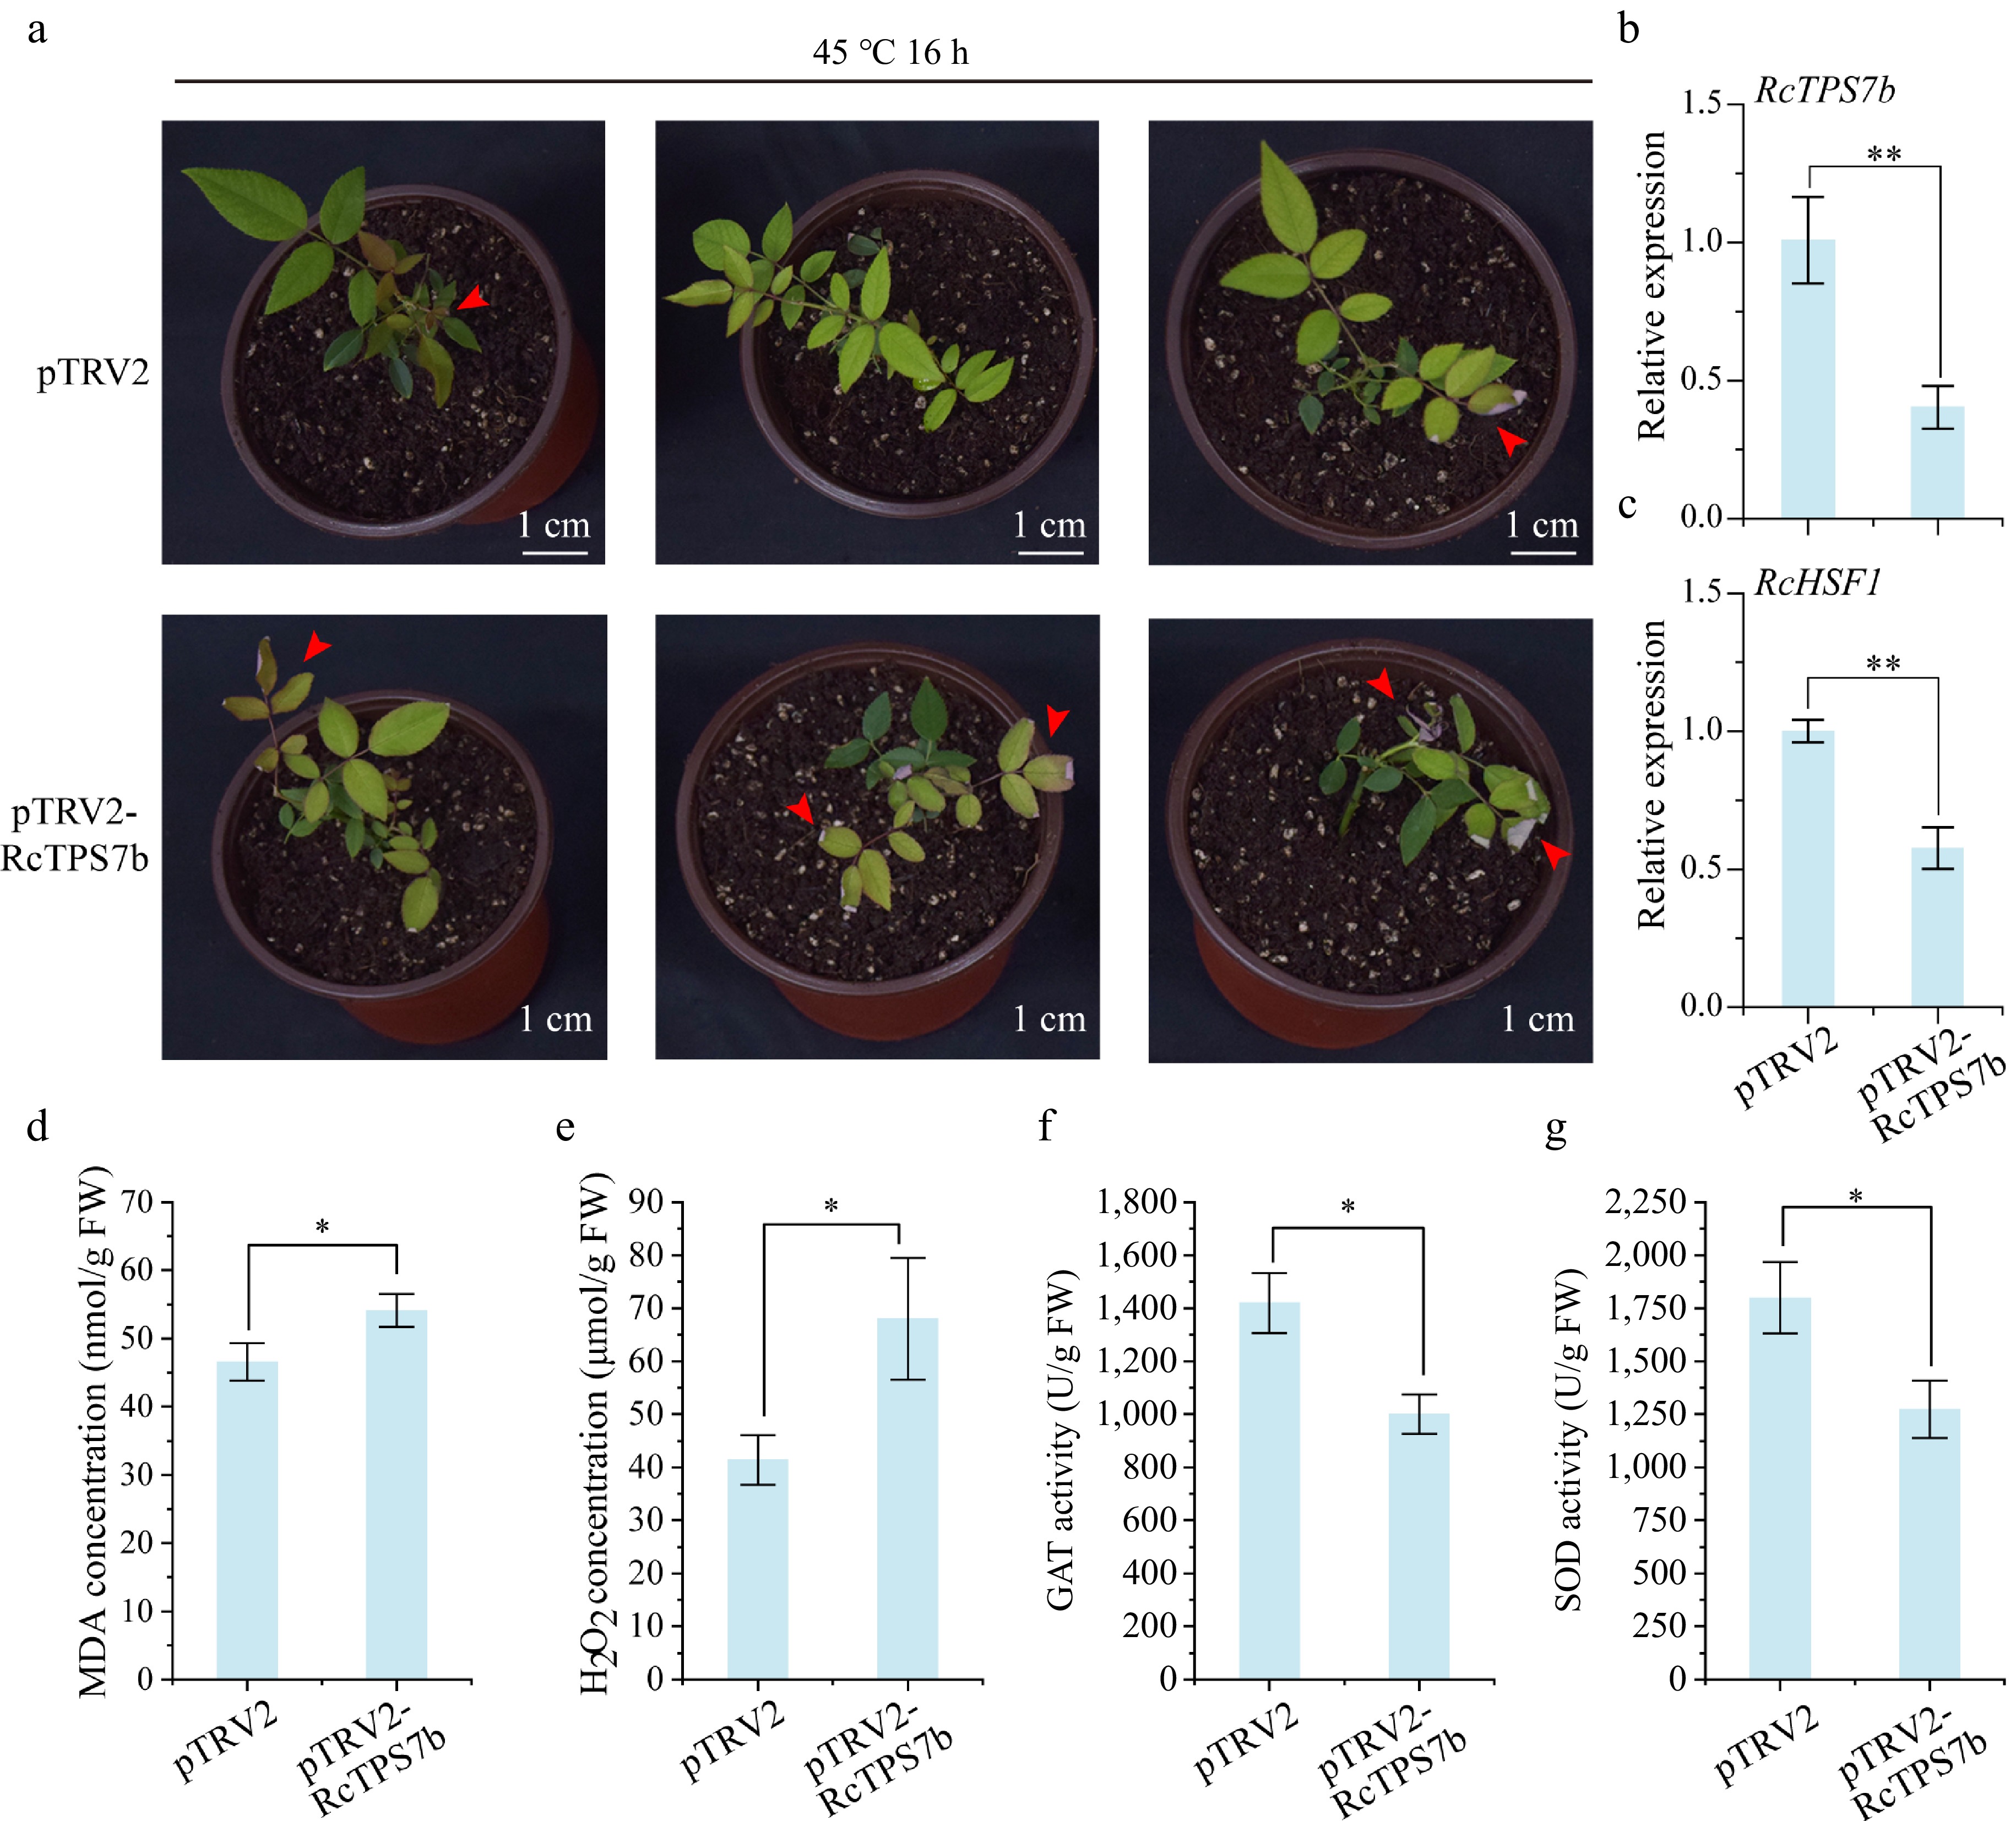
Figure 5.
Transient silencing of RcTPS7b decreased the heat tolerance of R. chinensis plants. (a) Phenotypic changes in RcTPS7b-silenced and control plants after 45 °C heat stress for 16 h. (b), (c) Transcript levels of RcTPS7b and RcHSF1 in VIGS-treated plants. (d)–(g) The content of physiologically active substances in RcTPS7b-silenced and control plants after 45 °C heat stress for 16 h. Data are presented as the mean ± SD of three biological replicates. Statistical significance: * p < 0.05 and ** p < 0.01 (Student's t-test).
-
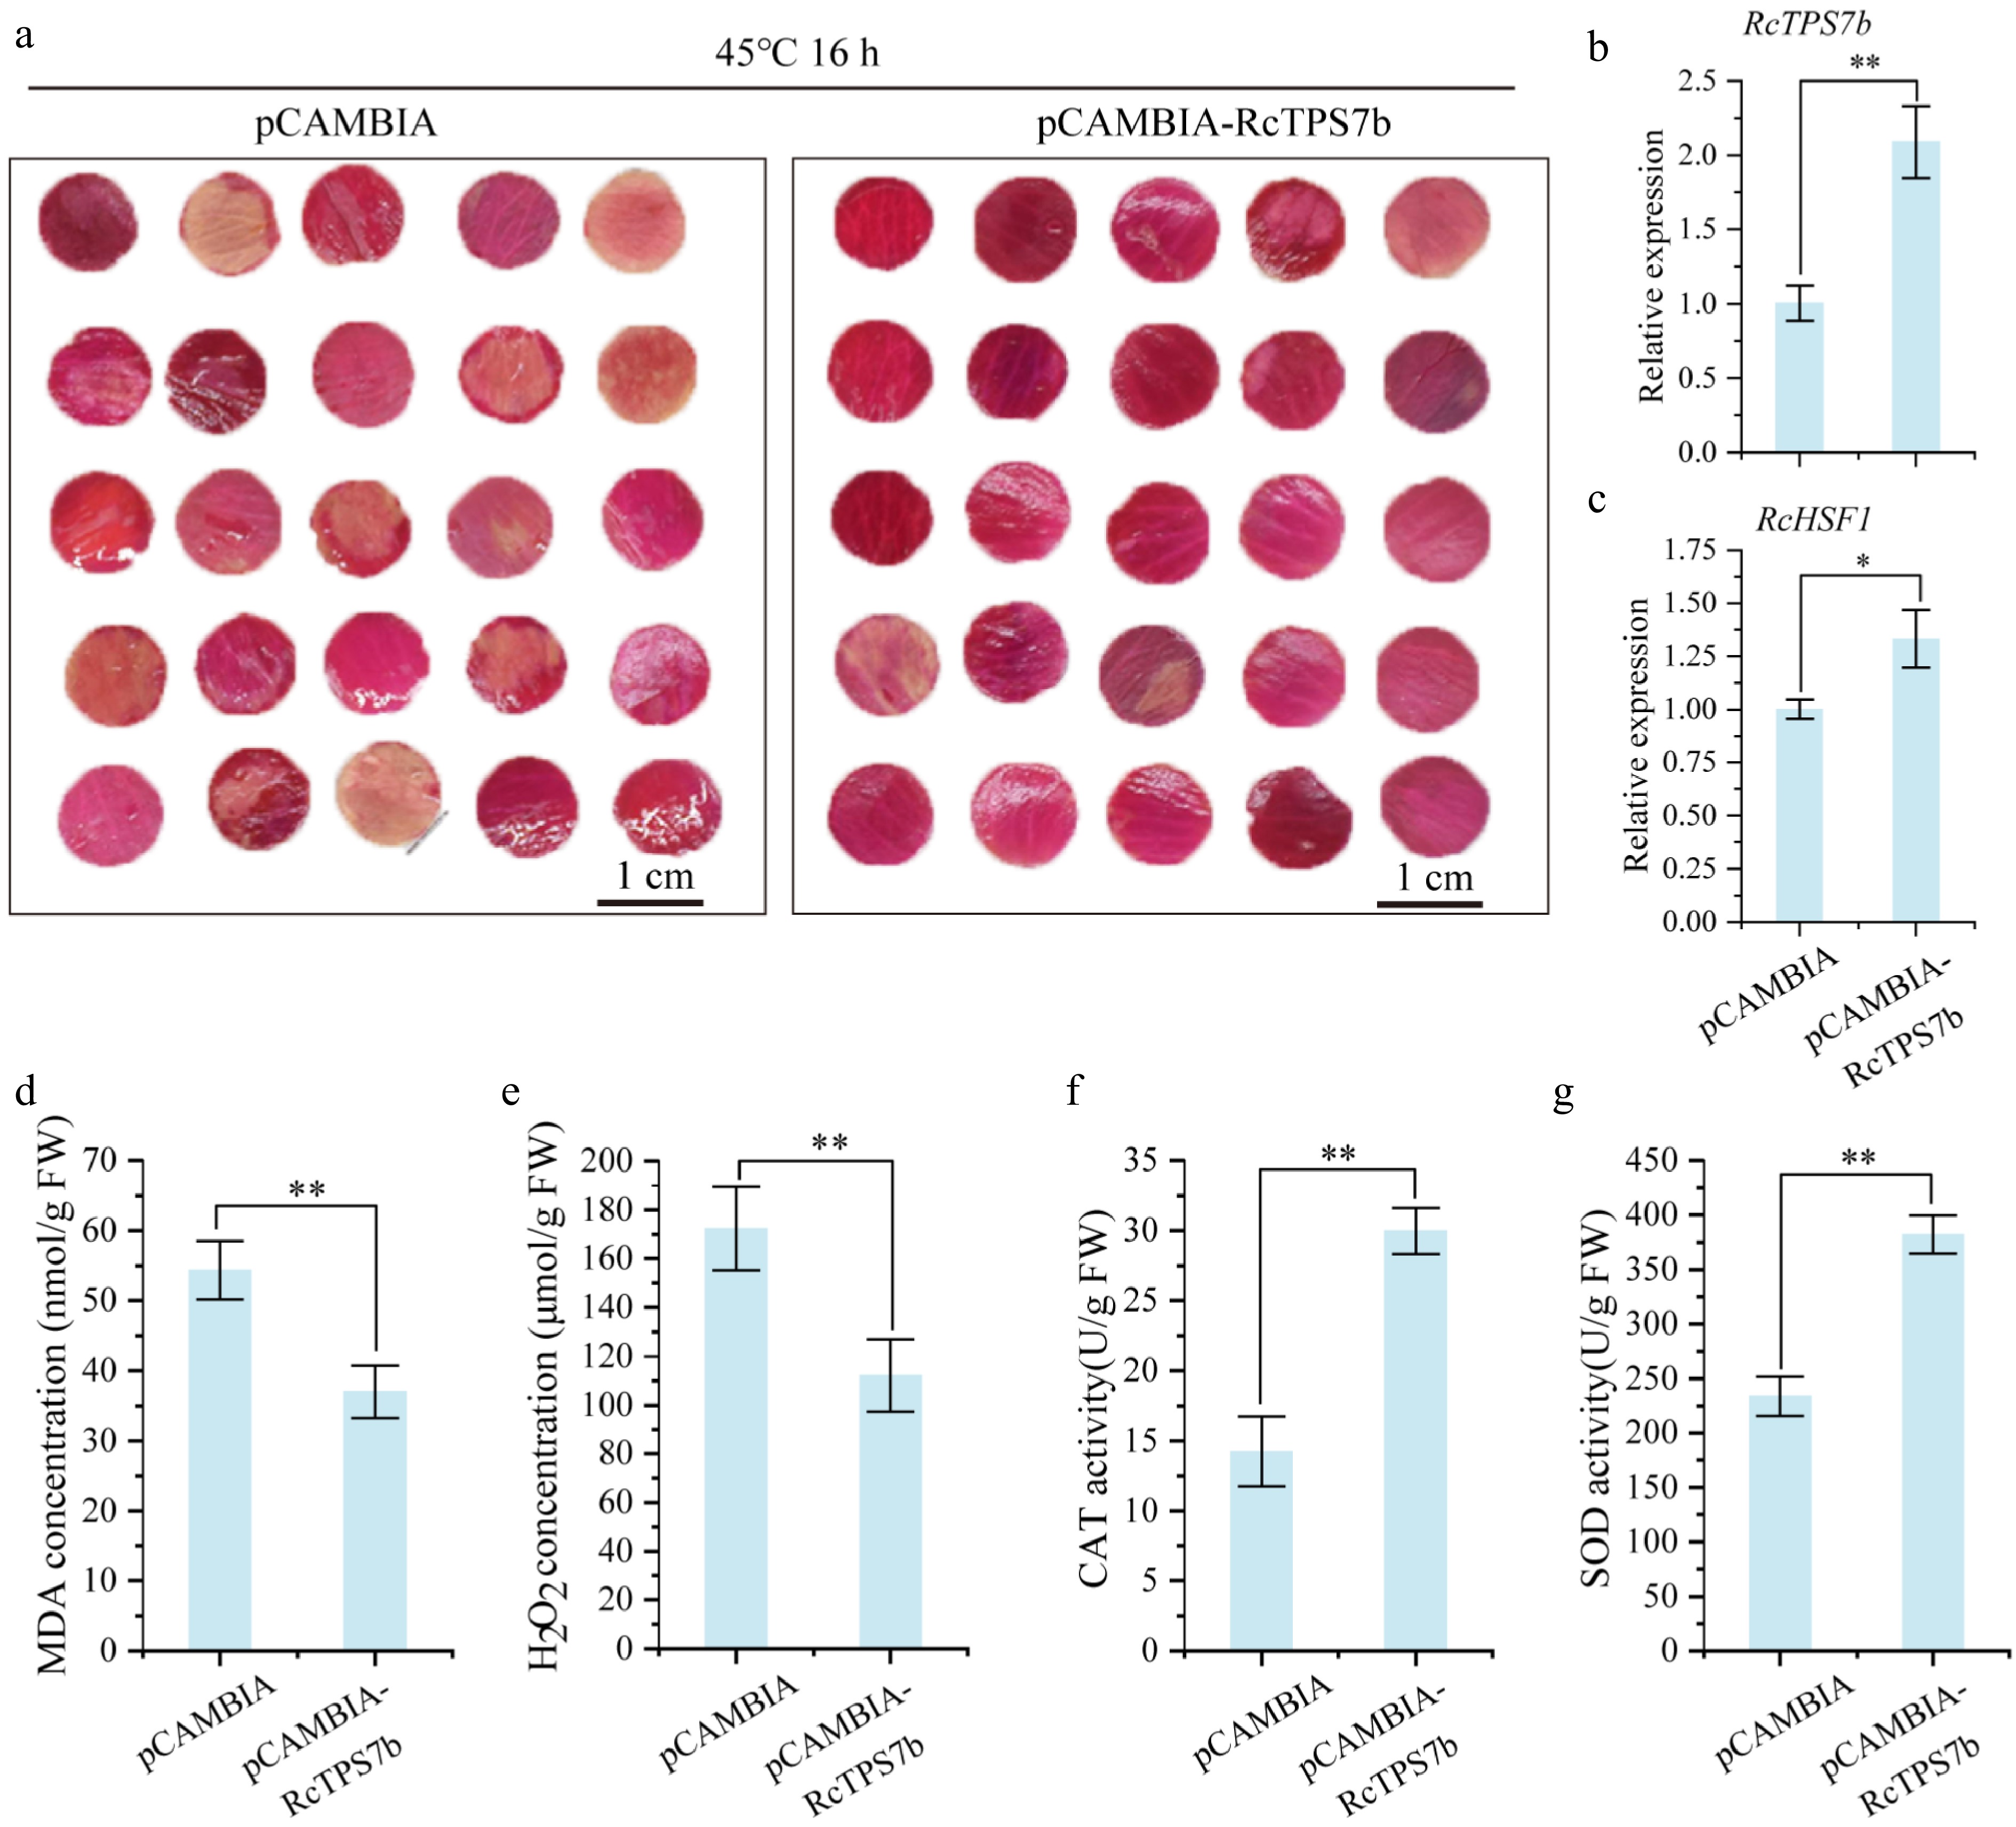
Figure 6.
Transient overexpression of RcTPS7b increased the heat tolerance of rose petals. (a) Phenotypic changes in RcTPS7b-overexpressing and control petals after 45 °C heat stress for 16 h. (b), (c) RcTPS7b/RcHSF1 transcript levels after overexpression. (d)–(g) The content of physiologically active substances in RcTPS7b-overexpressing and control petals after 45 °C heat stress for 16 h. Data are presented as the mean ± SD of three biological replicates. Statistical significance: * p < 0.05 and ** p < 0.01 (Student's t-test).
-
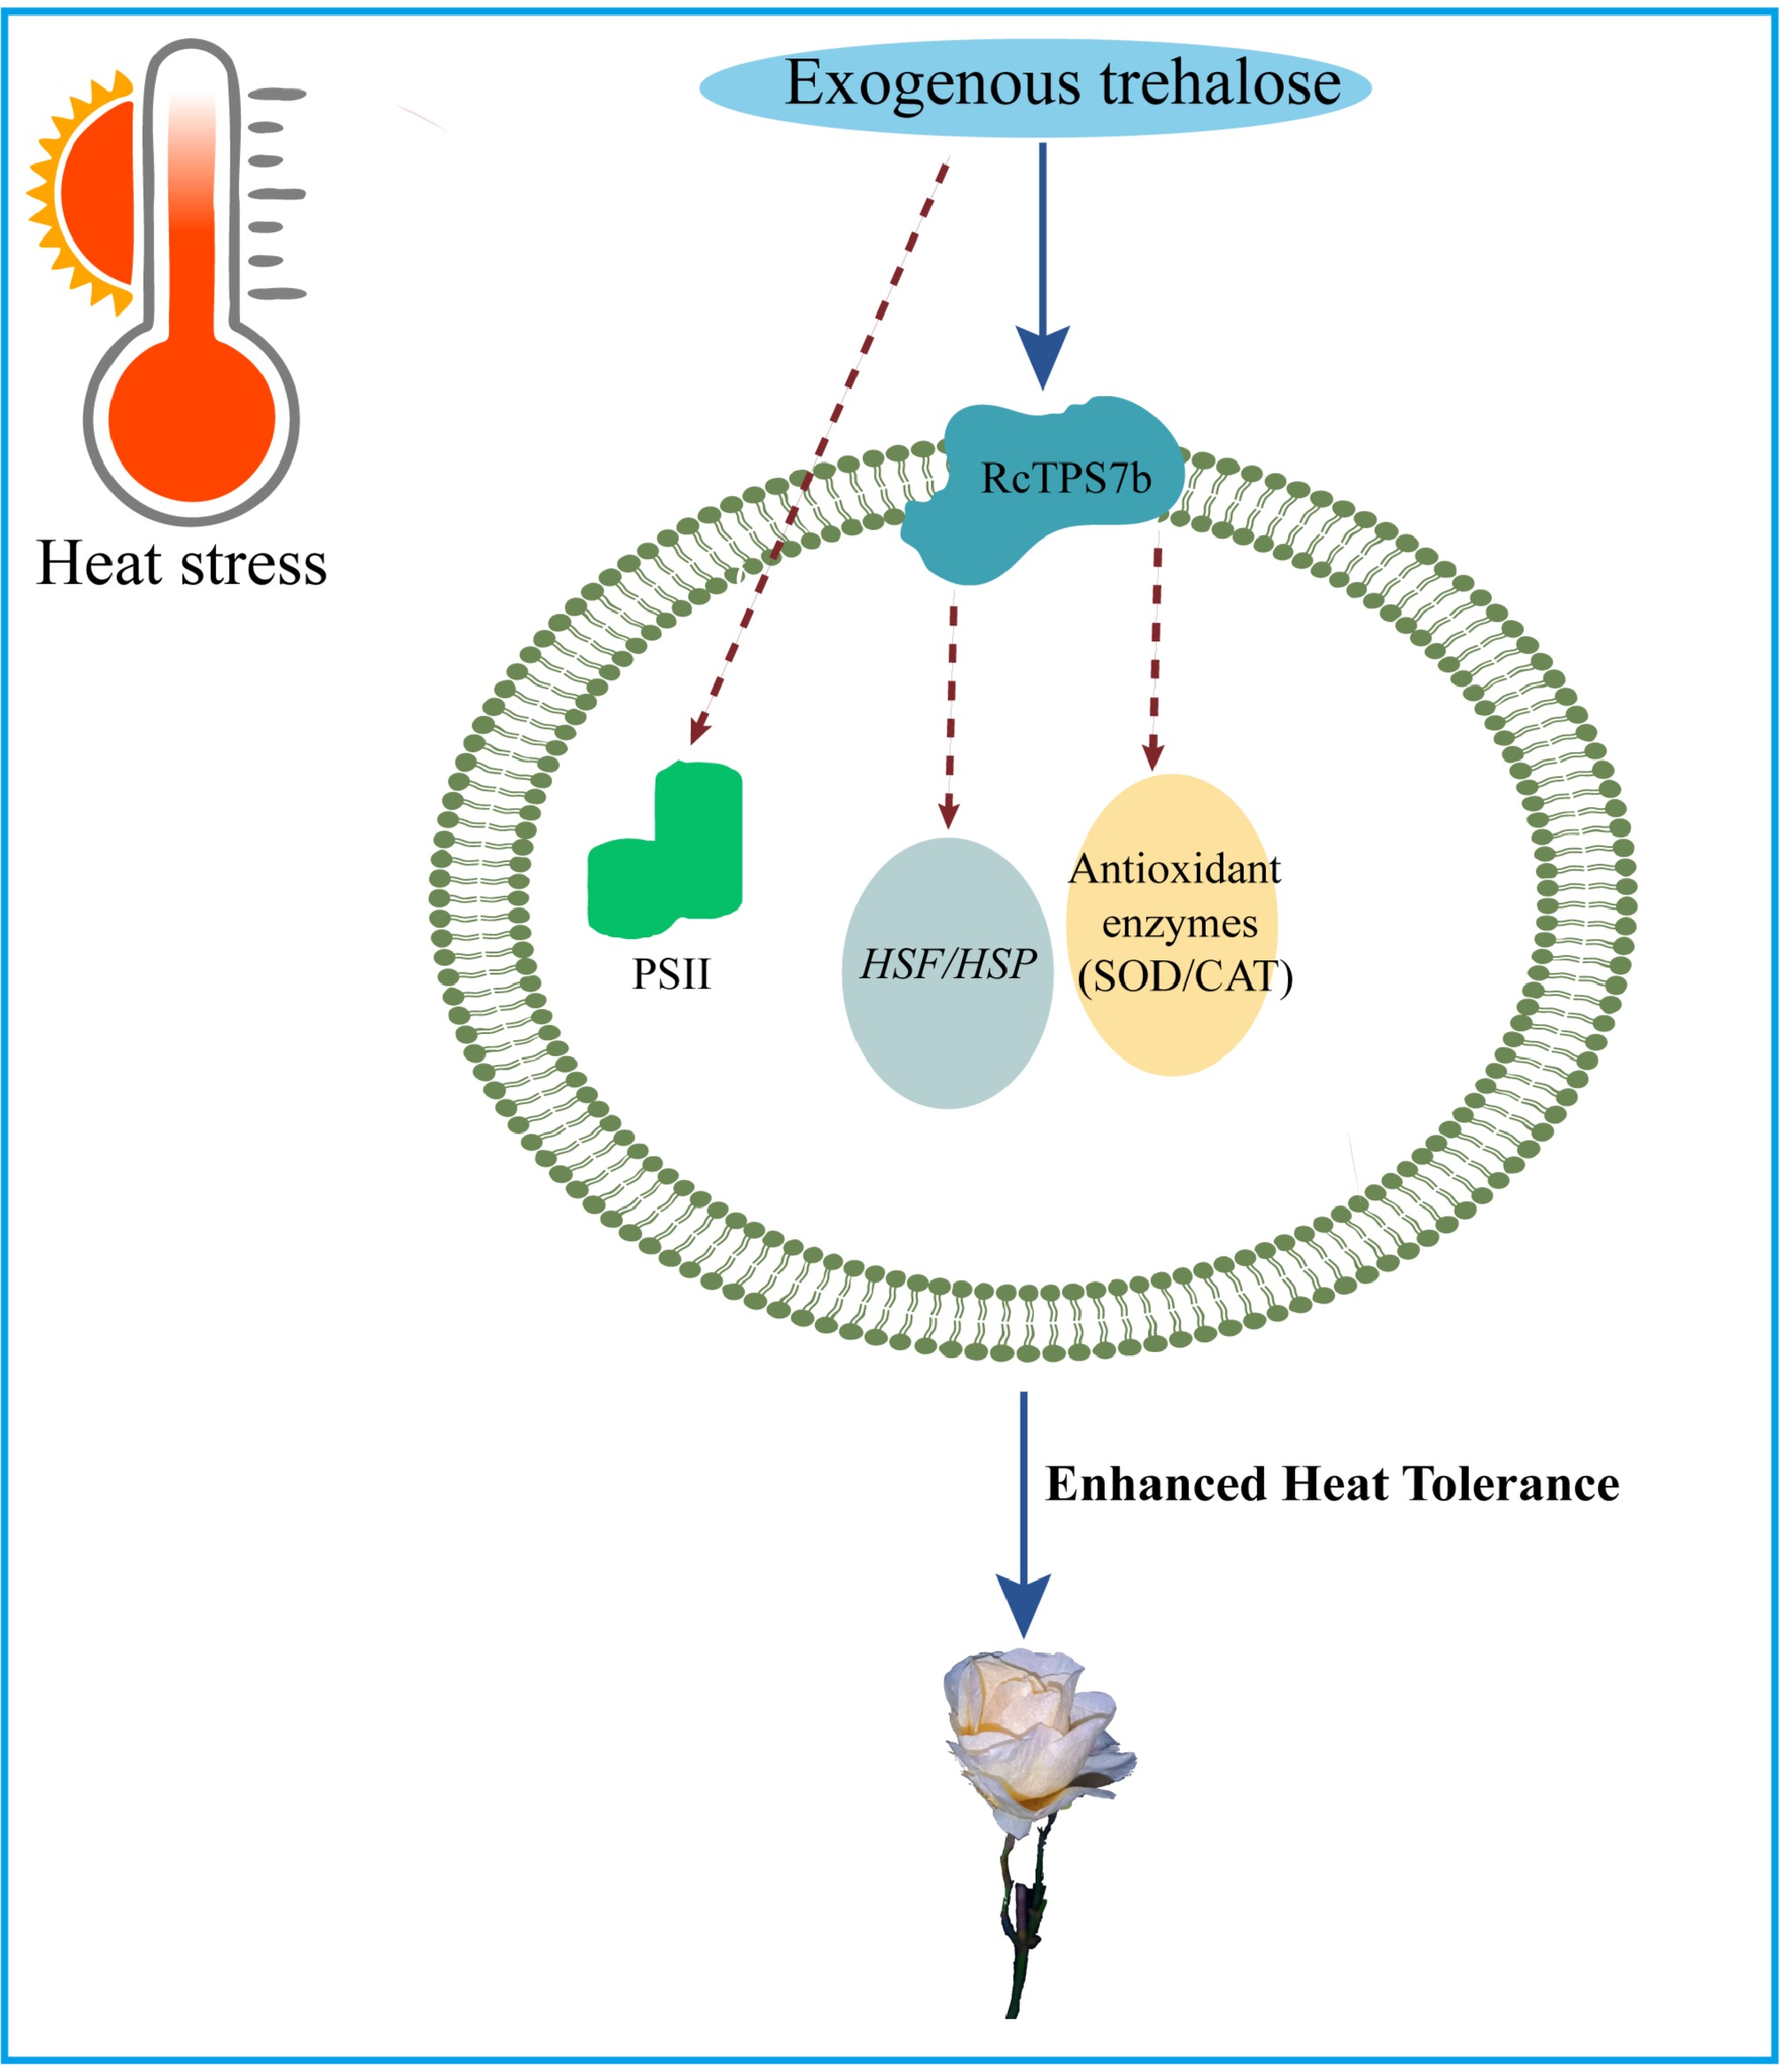
Figure 7.
Trehalose-RcTPS7b-HSF/antioxidant network in heat stress tolerance in R. chinensis.
Figures
(7)
Tables
(0)