-
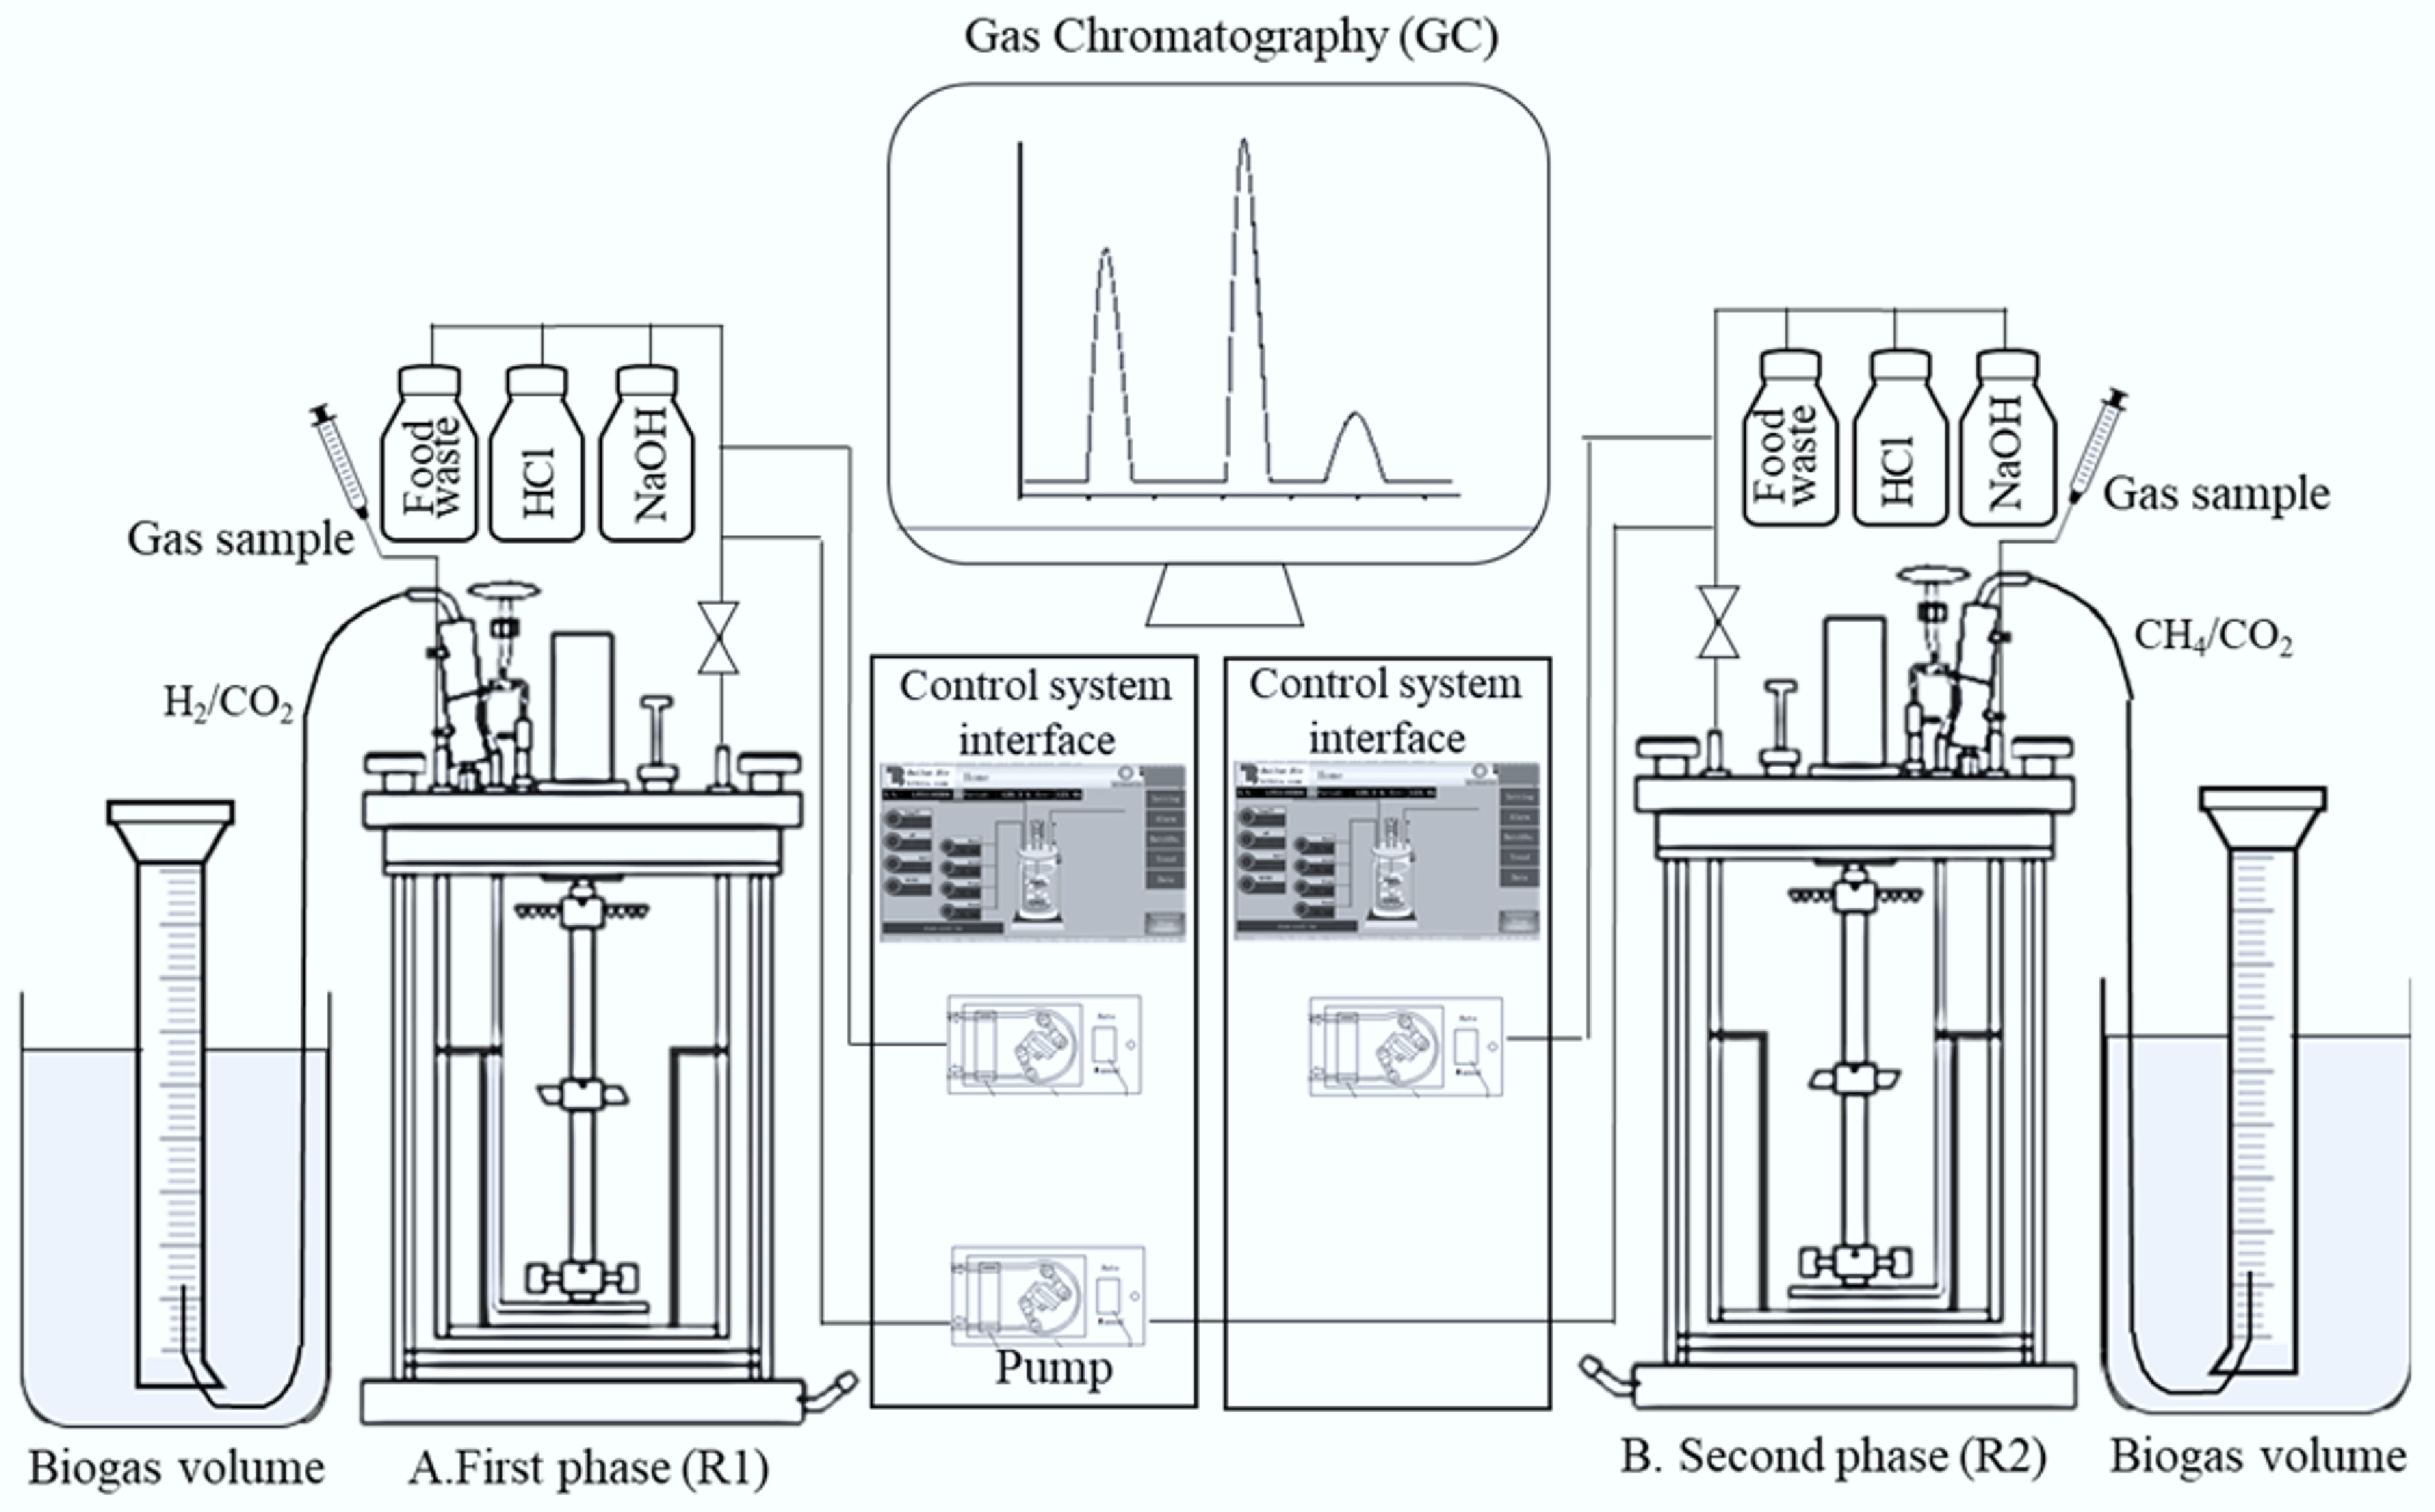
Figure 1.
Schematic representation of the TPAD system showing that A: R1 operated with or without biochar supplementation; B: R2 operated with or without biochar supplementation.
-
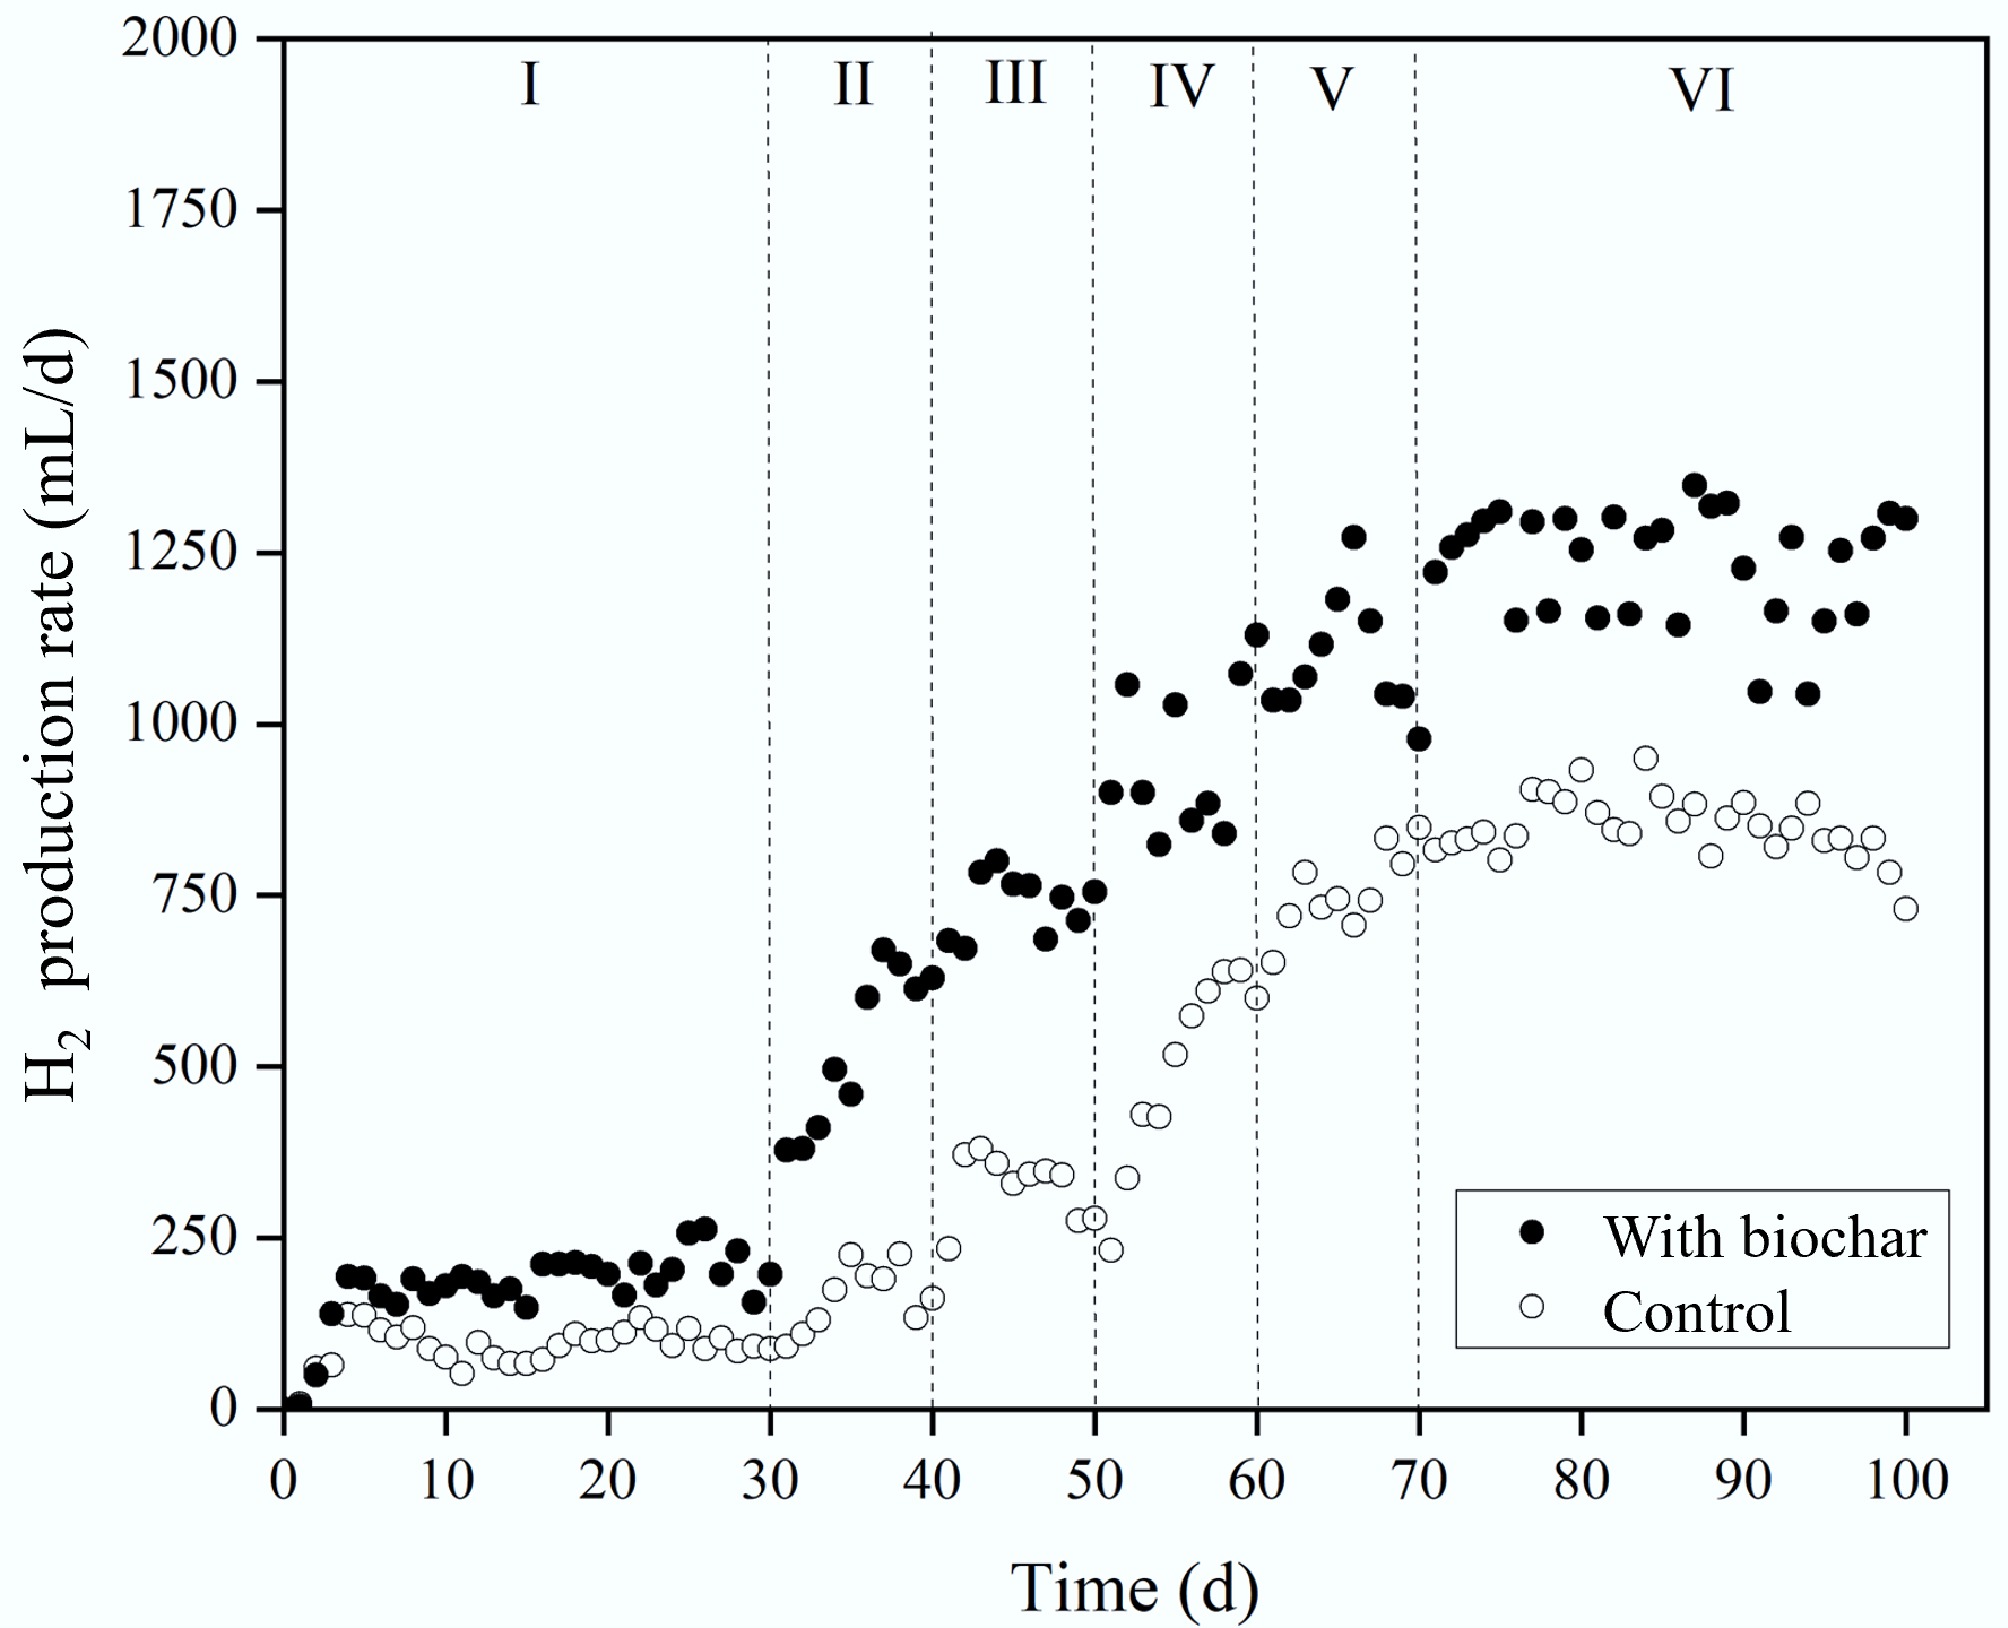
Figure 2.
Effect of biochar addition on H2 production rate.
-
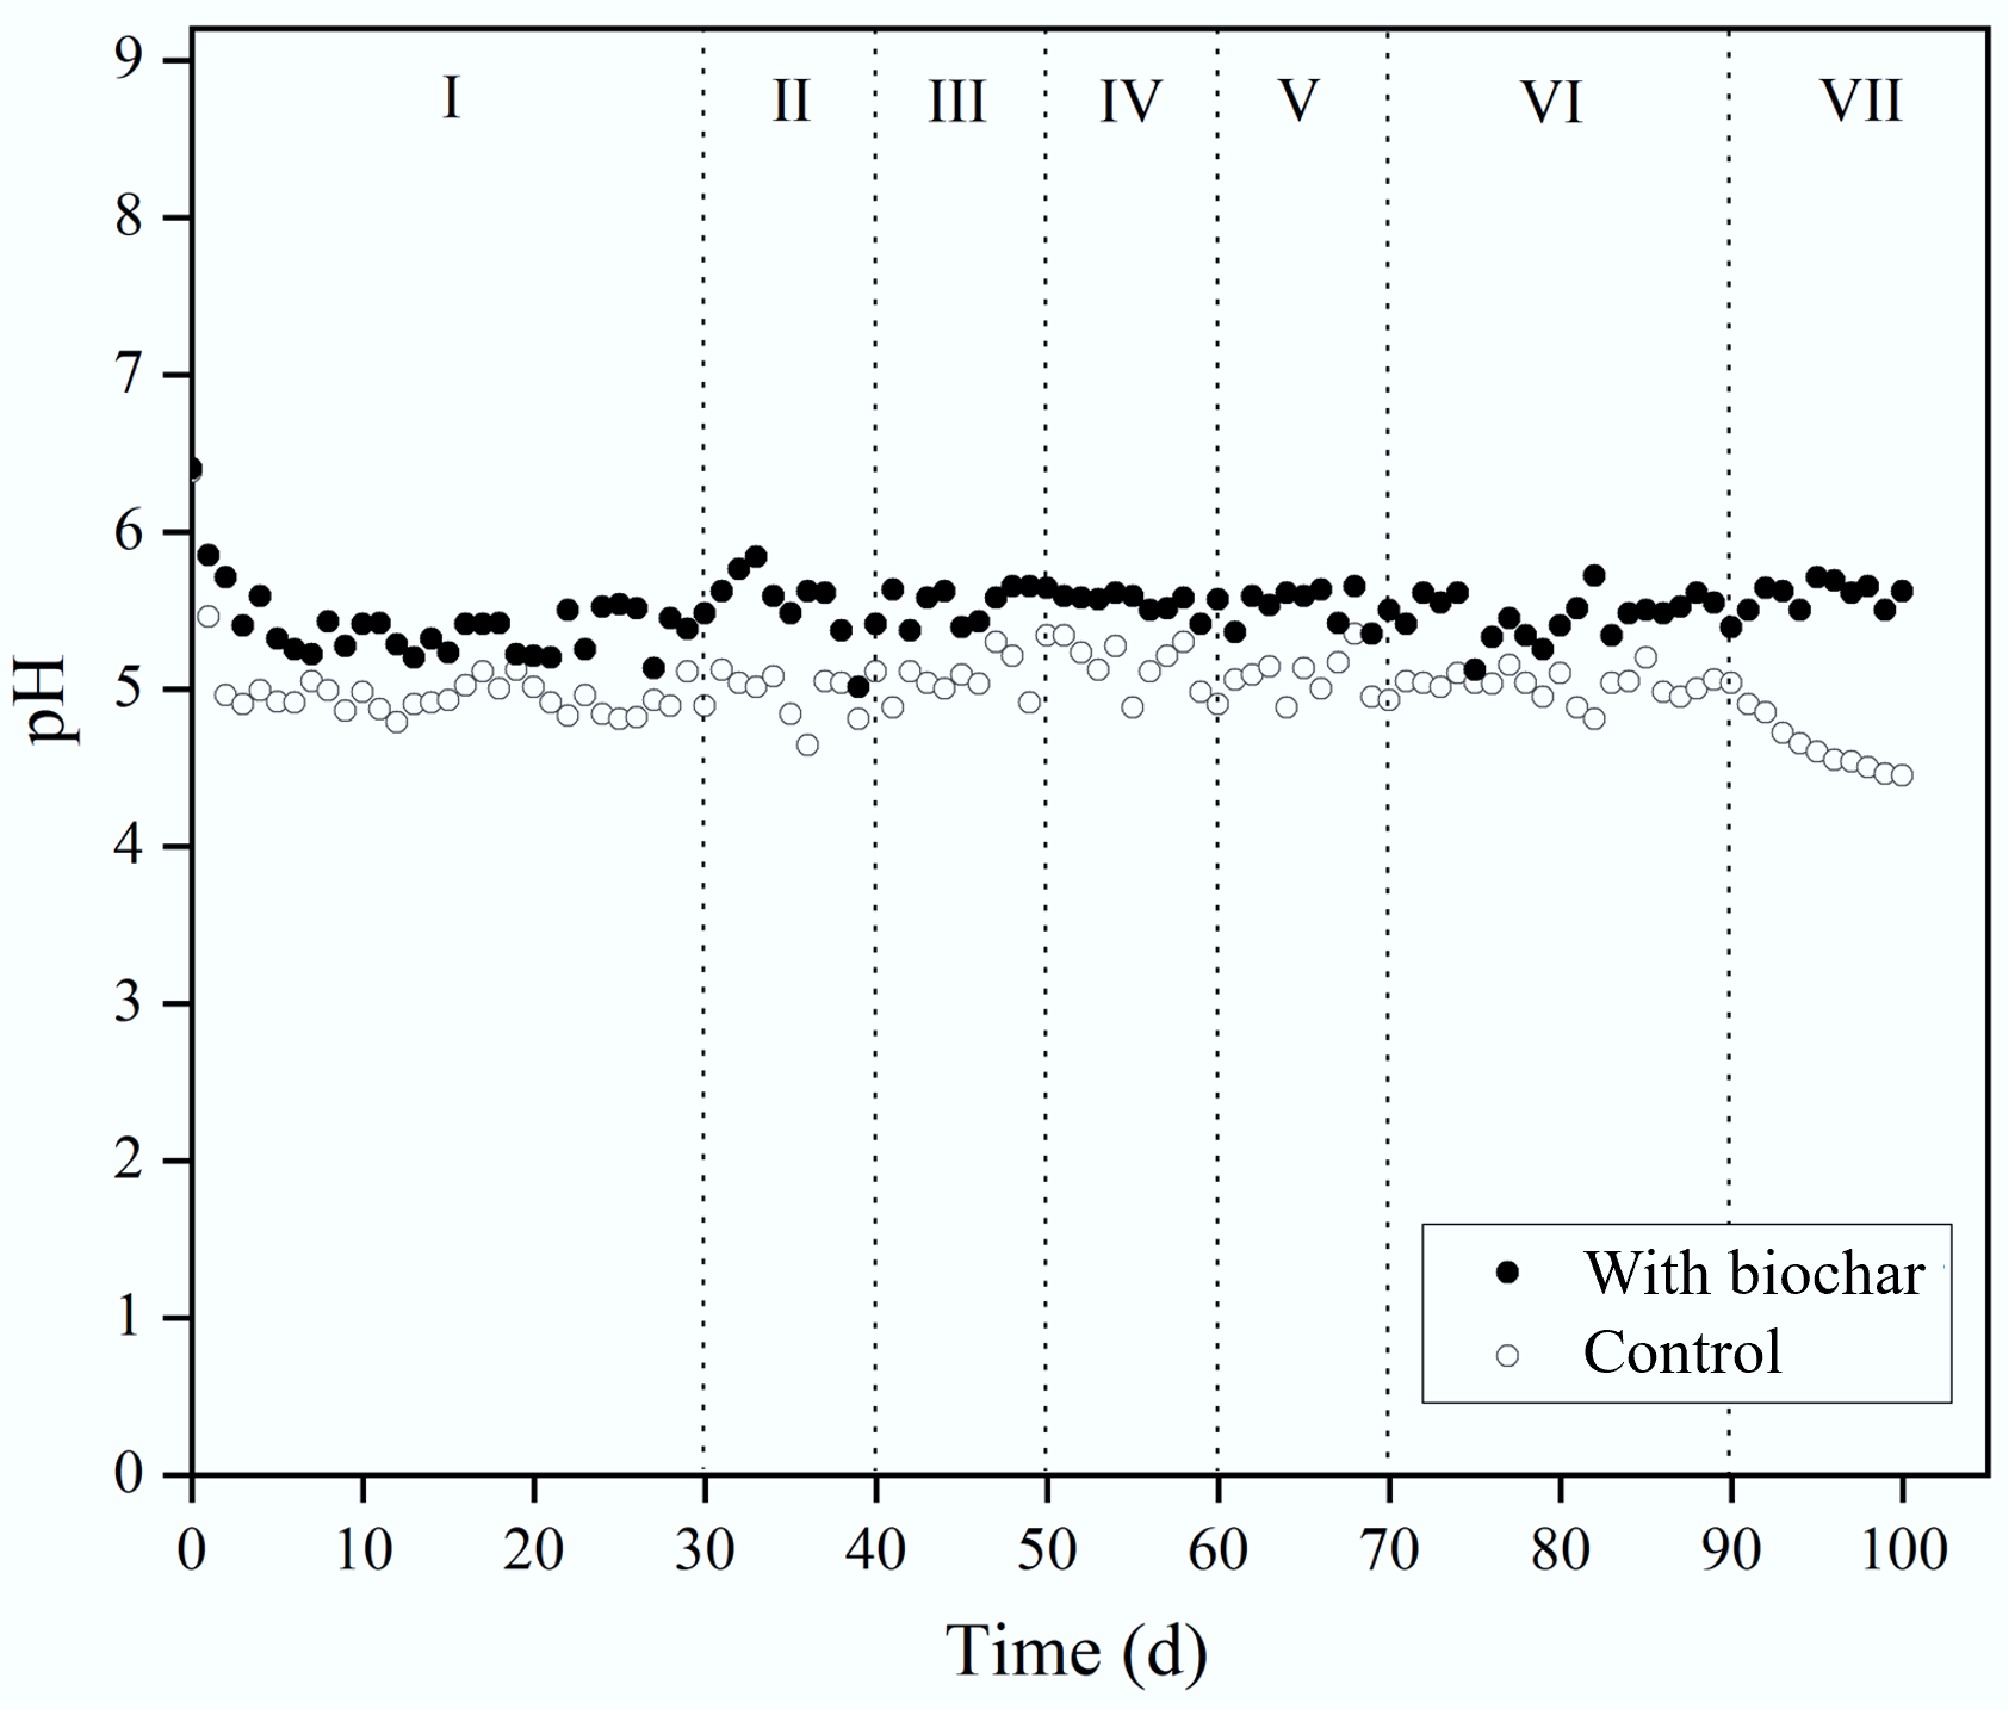
Figure 3.
Effect of biochar addition on pH during H2 production.
-
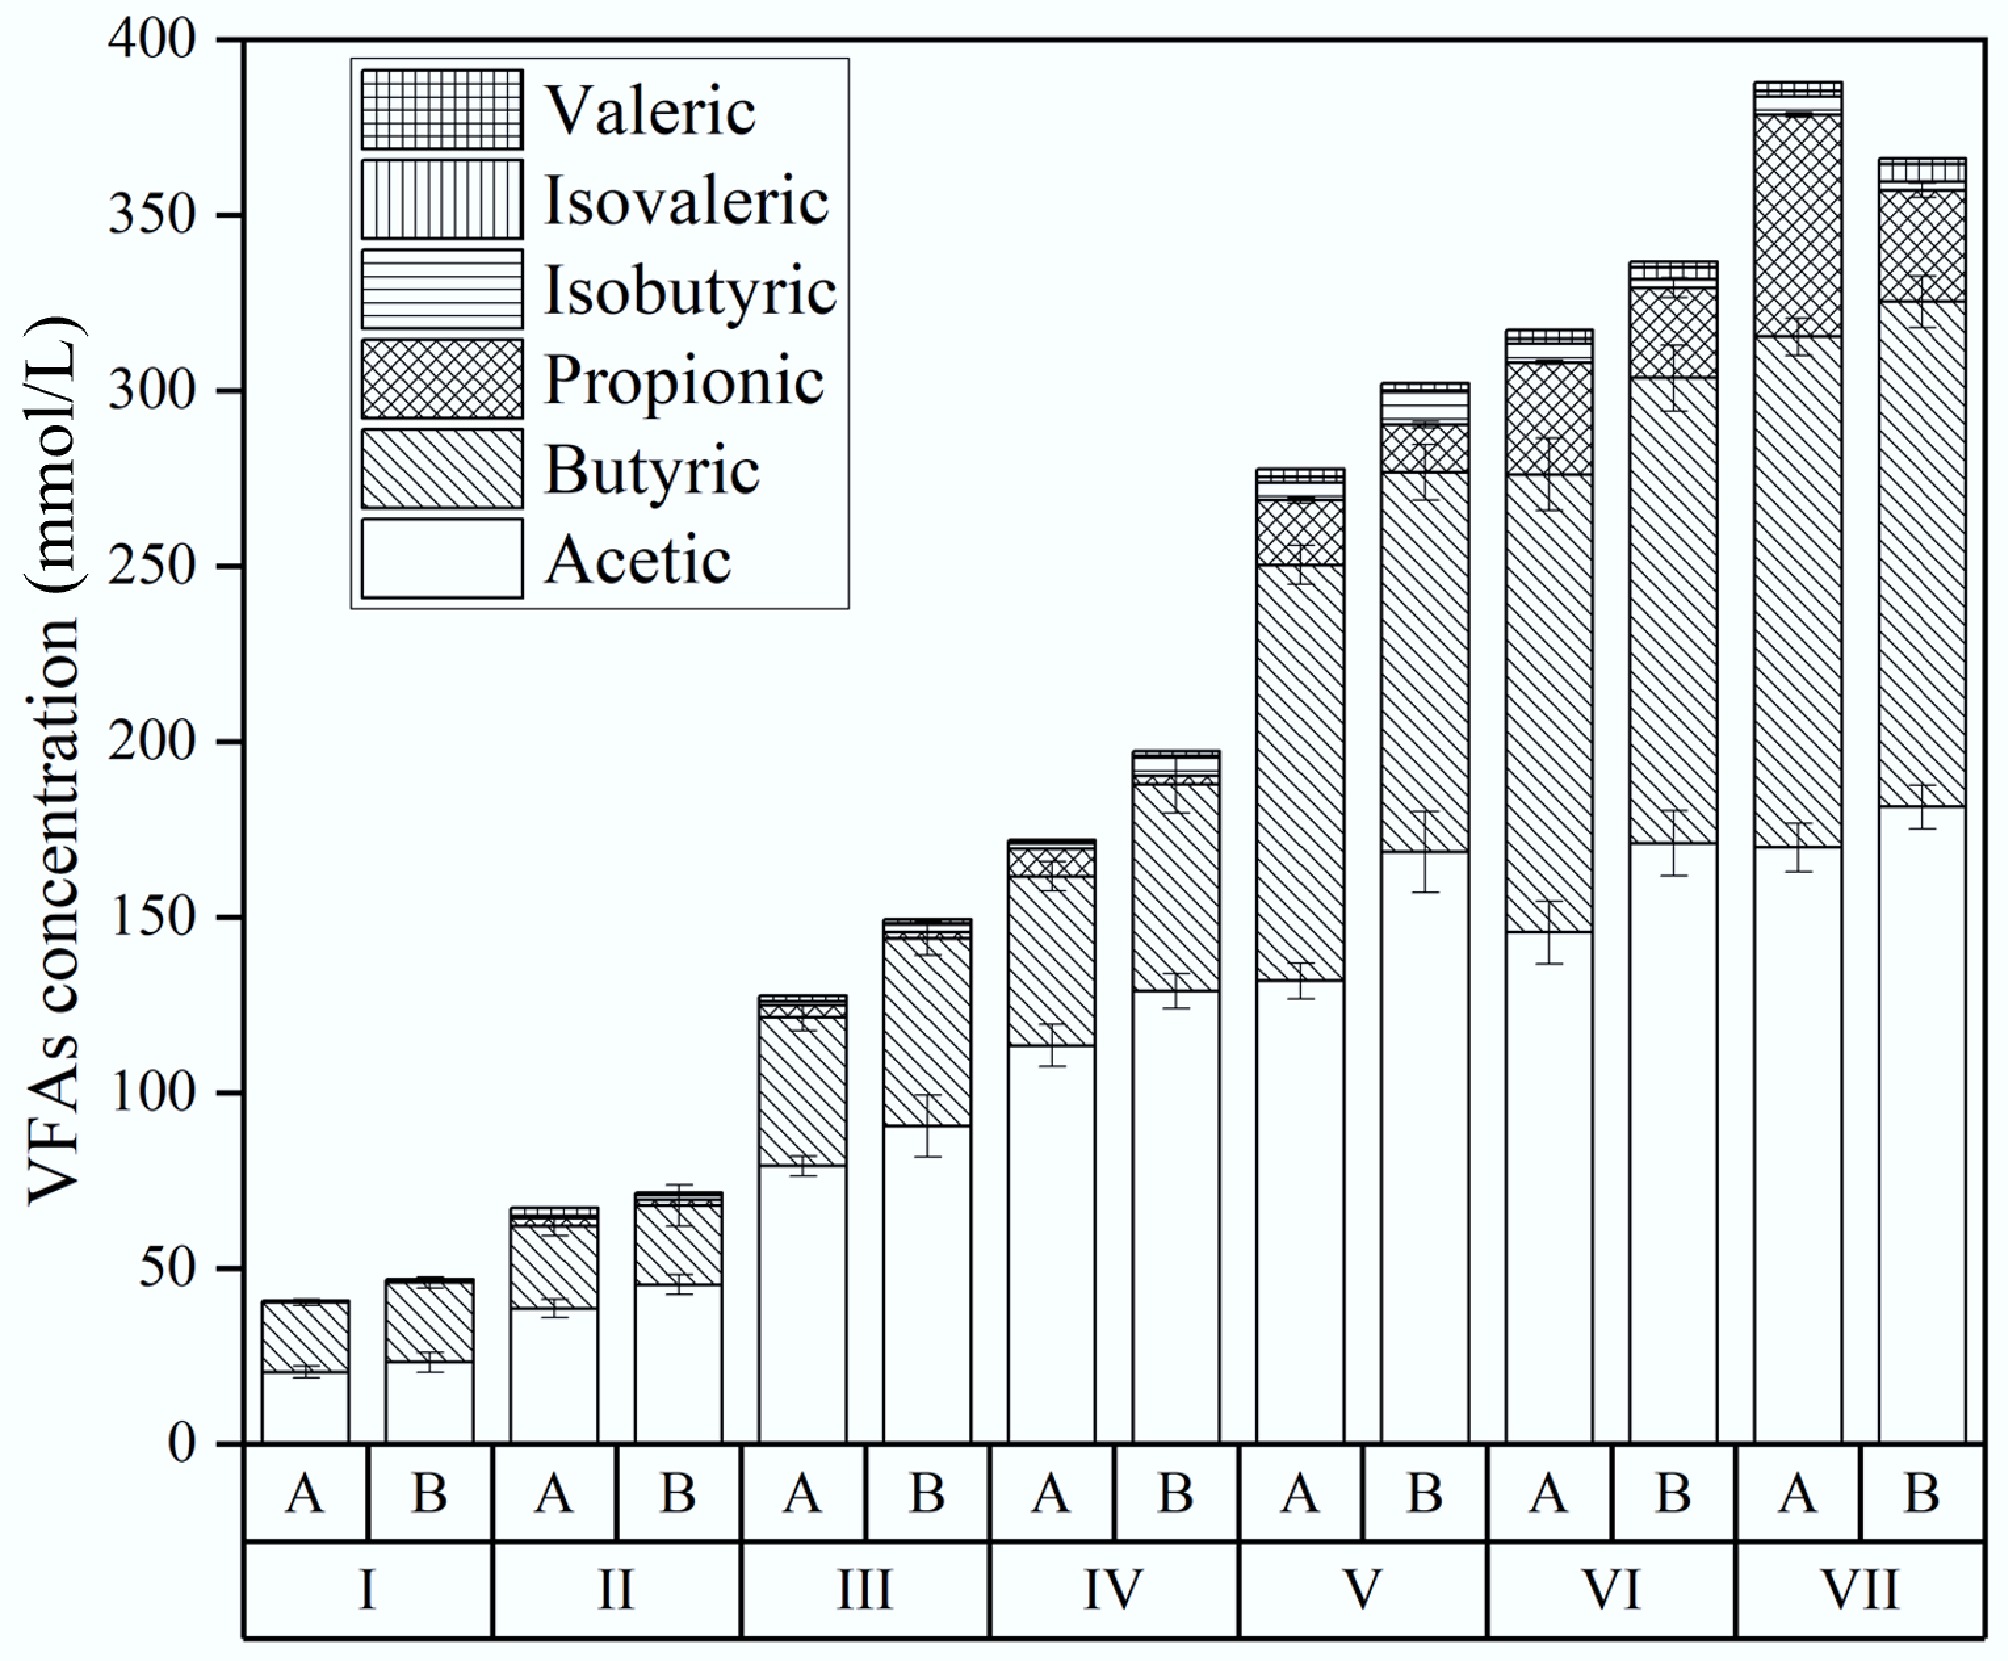
Figure 4.
Effect of biochar addition on VFA during H2 production. A is the reactor without biochar, and B is the reactor with biochar addition.
-
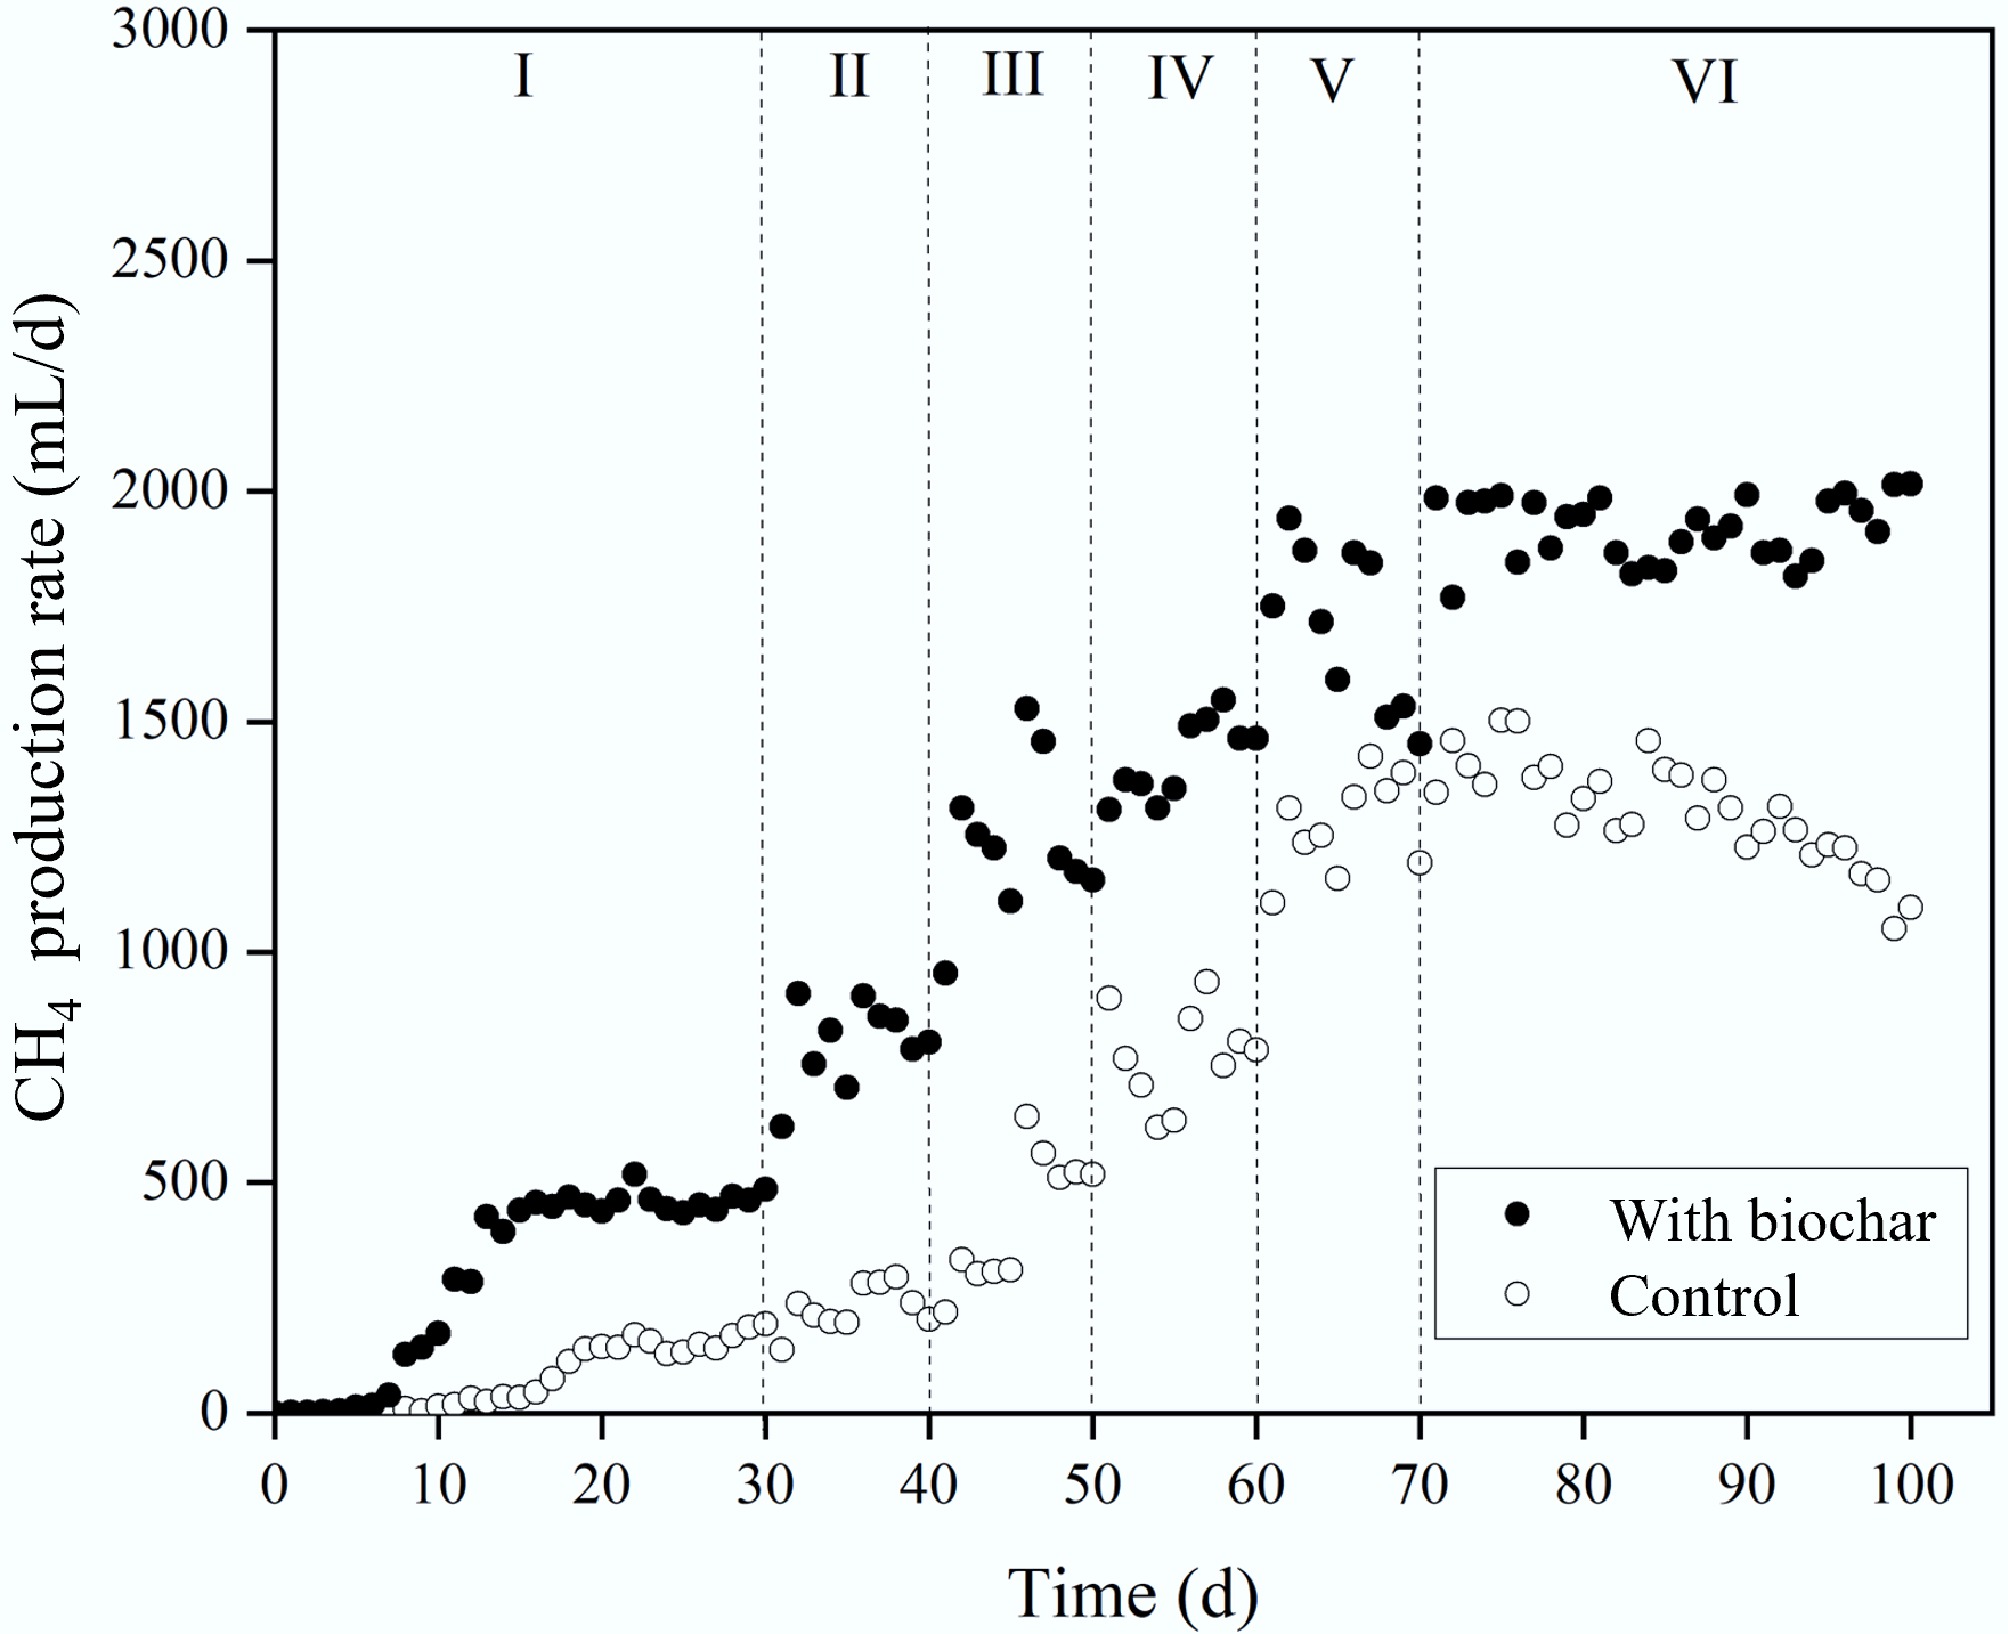
Figure 5.
Effect of biochar addition on CH4 production rate.
-
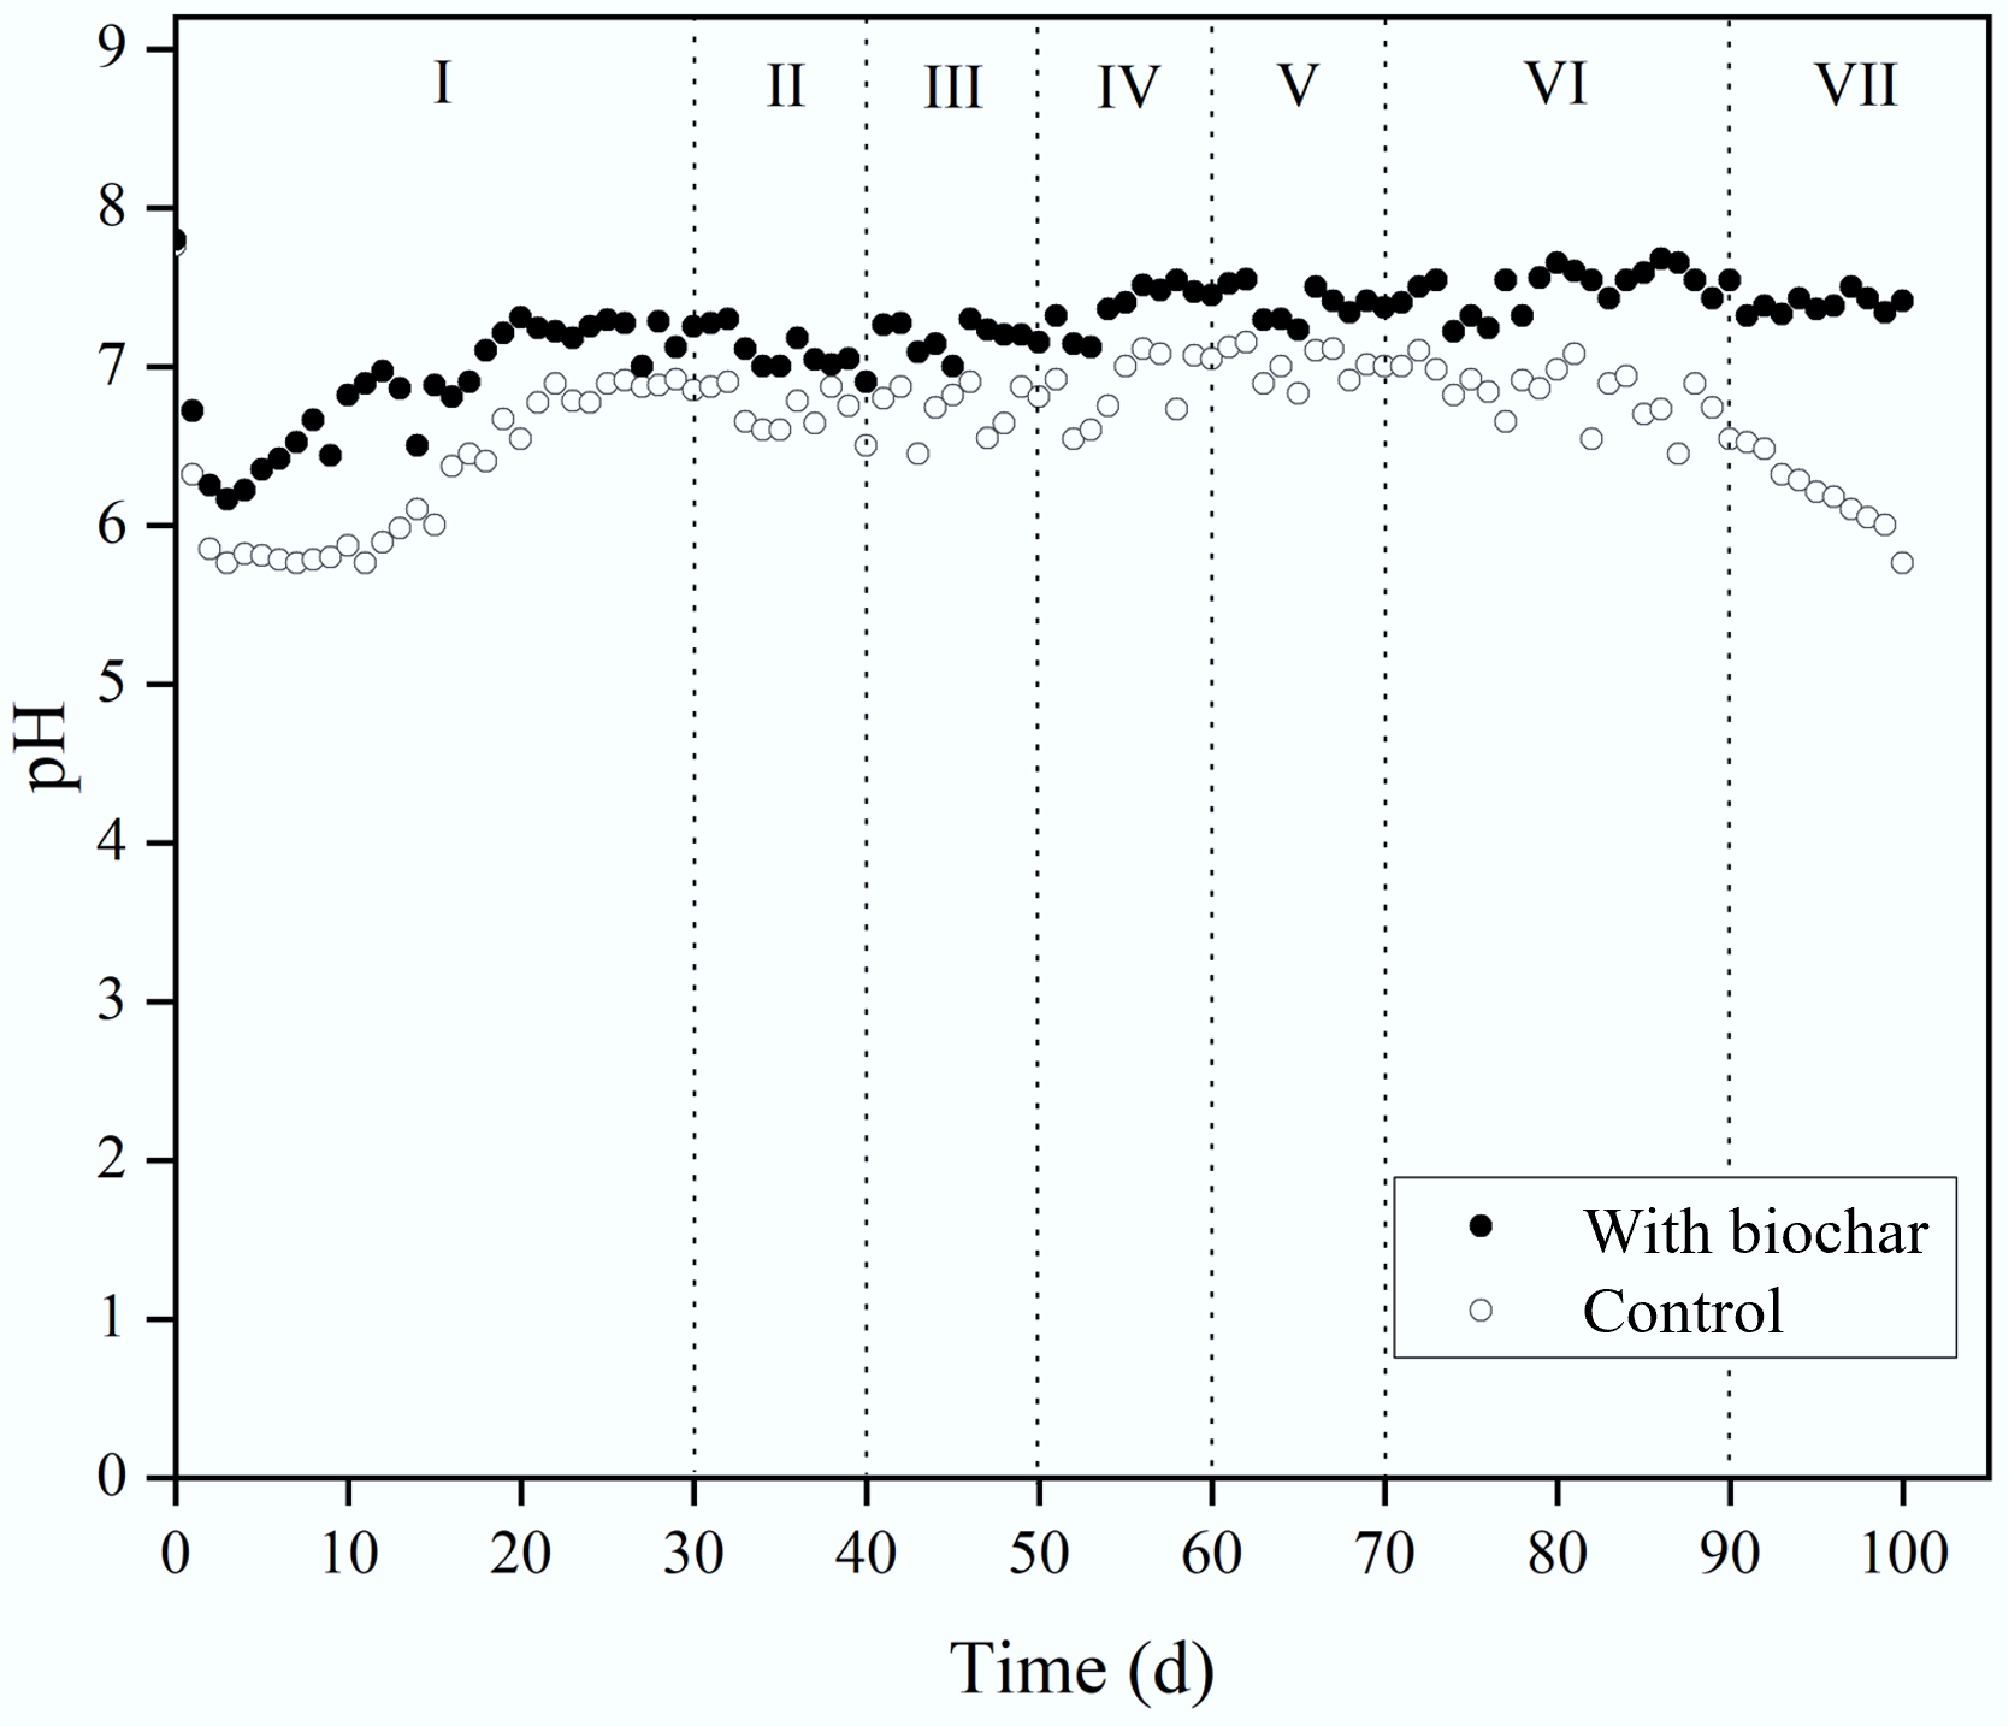
Figure 6.
Effect of biochar addition on pH during CH4 production.
-
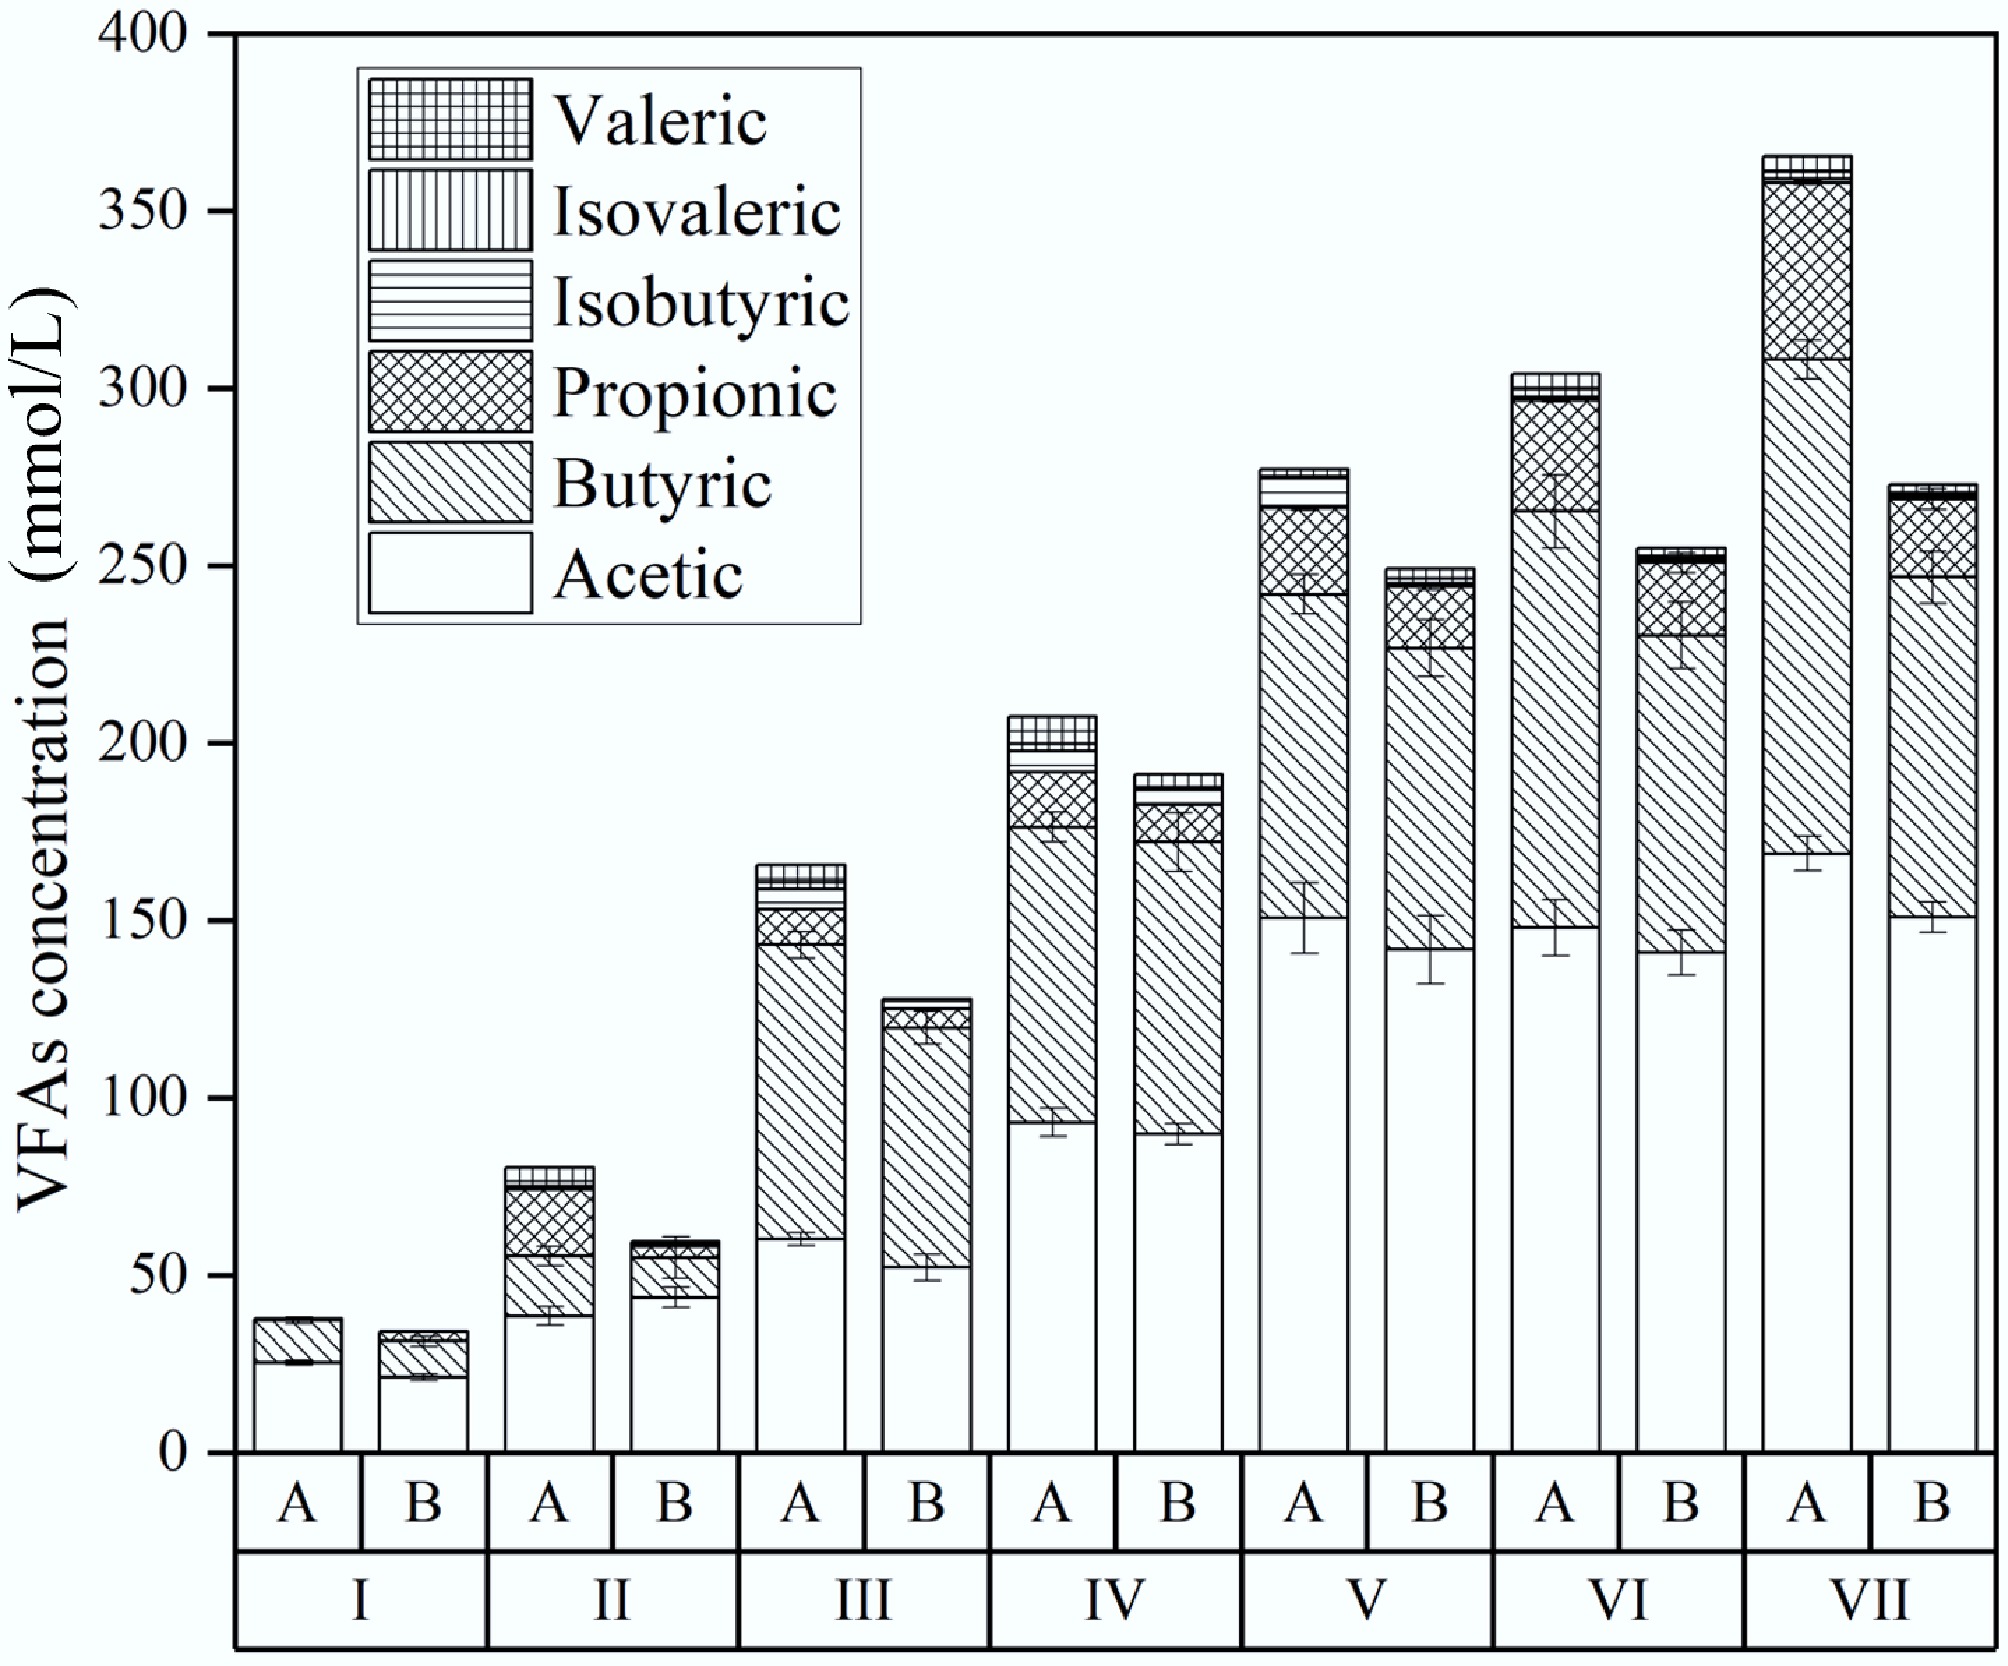
Figure 7.
Effect of biochar addition on VFA during CH4 production. A is the reactor without biochar, and B is the reactor with biochar addition.
-
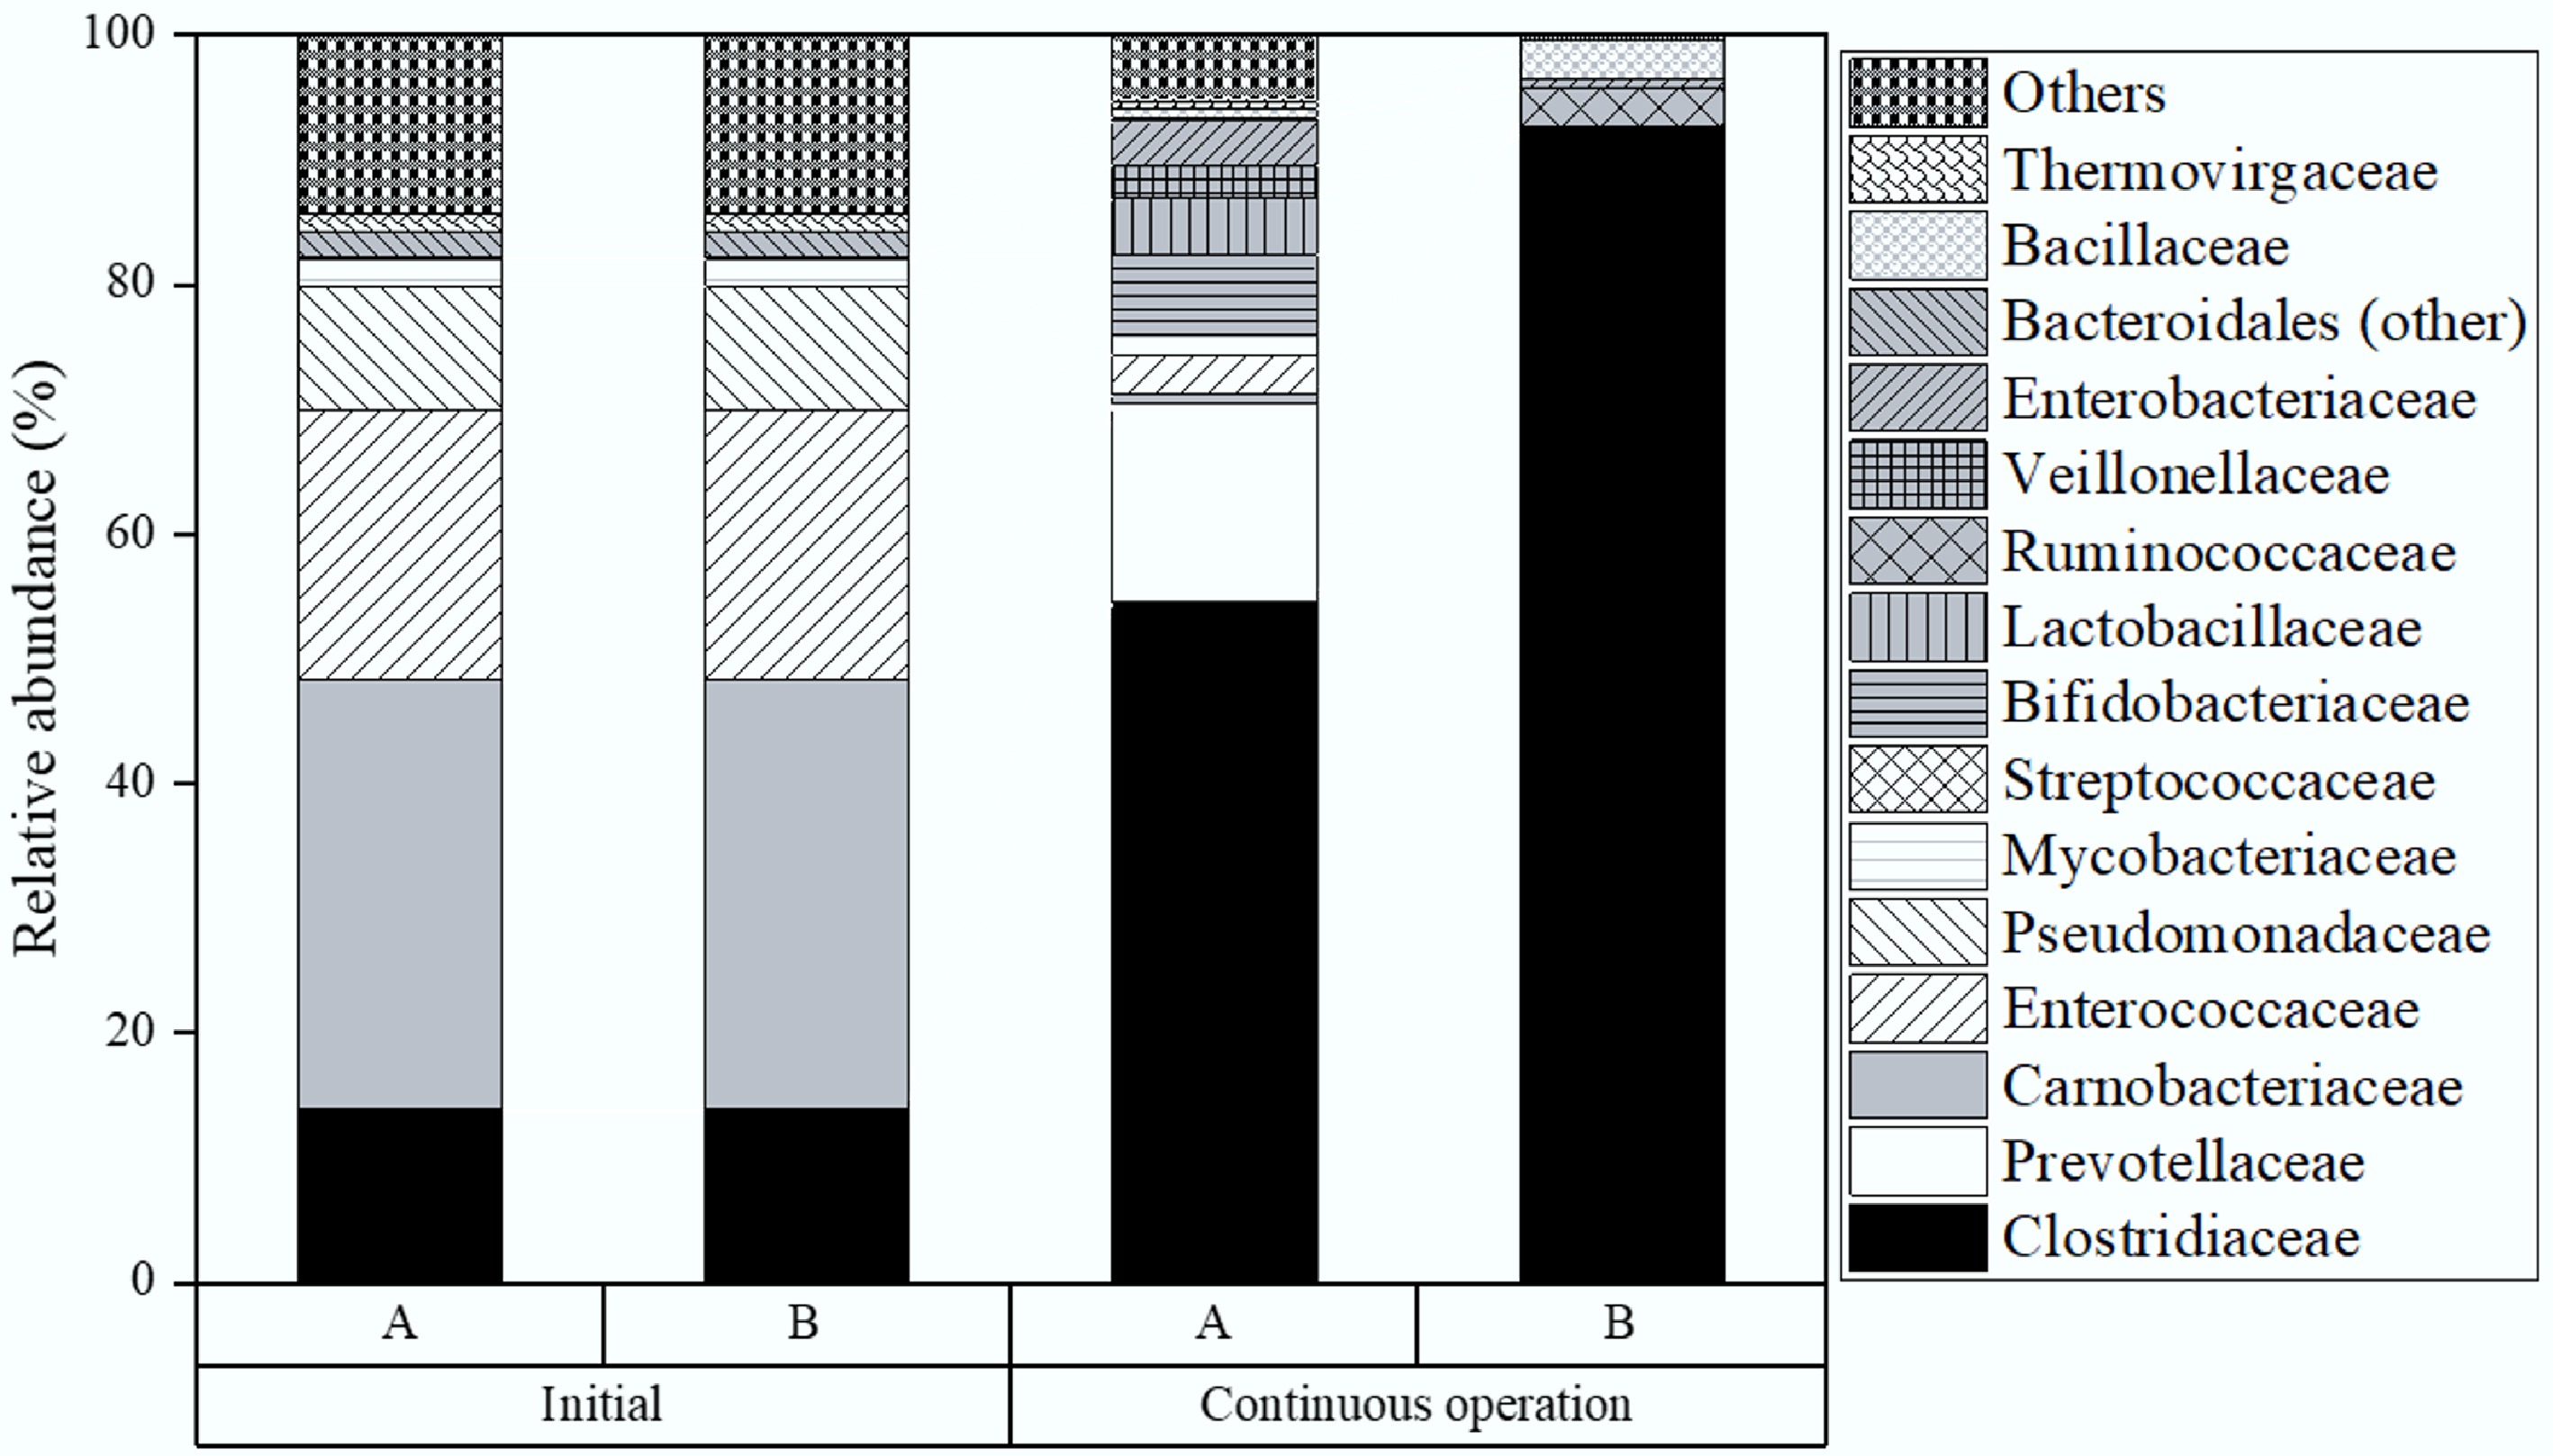
Figure 8.
Microbial distribution in the first phase of TPAD, A with, and B without biochar addition during semi-continuous operation.
-
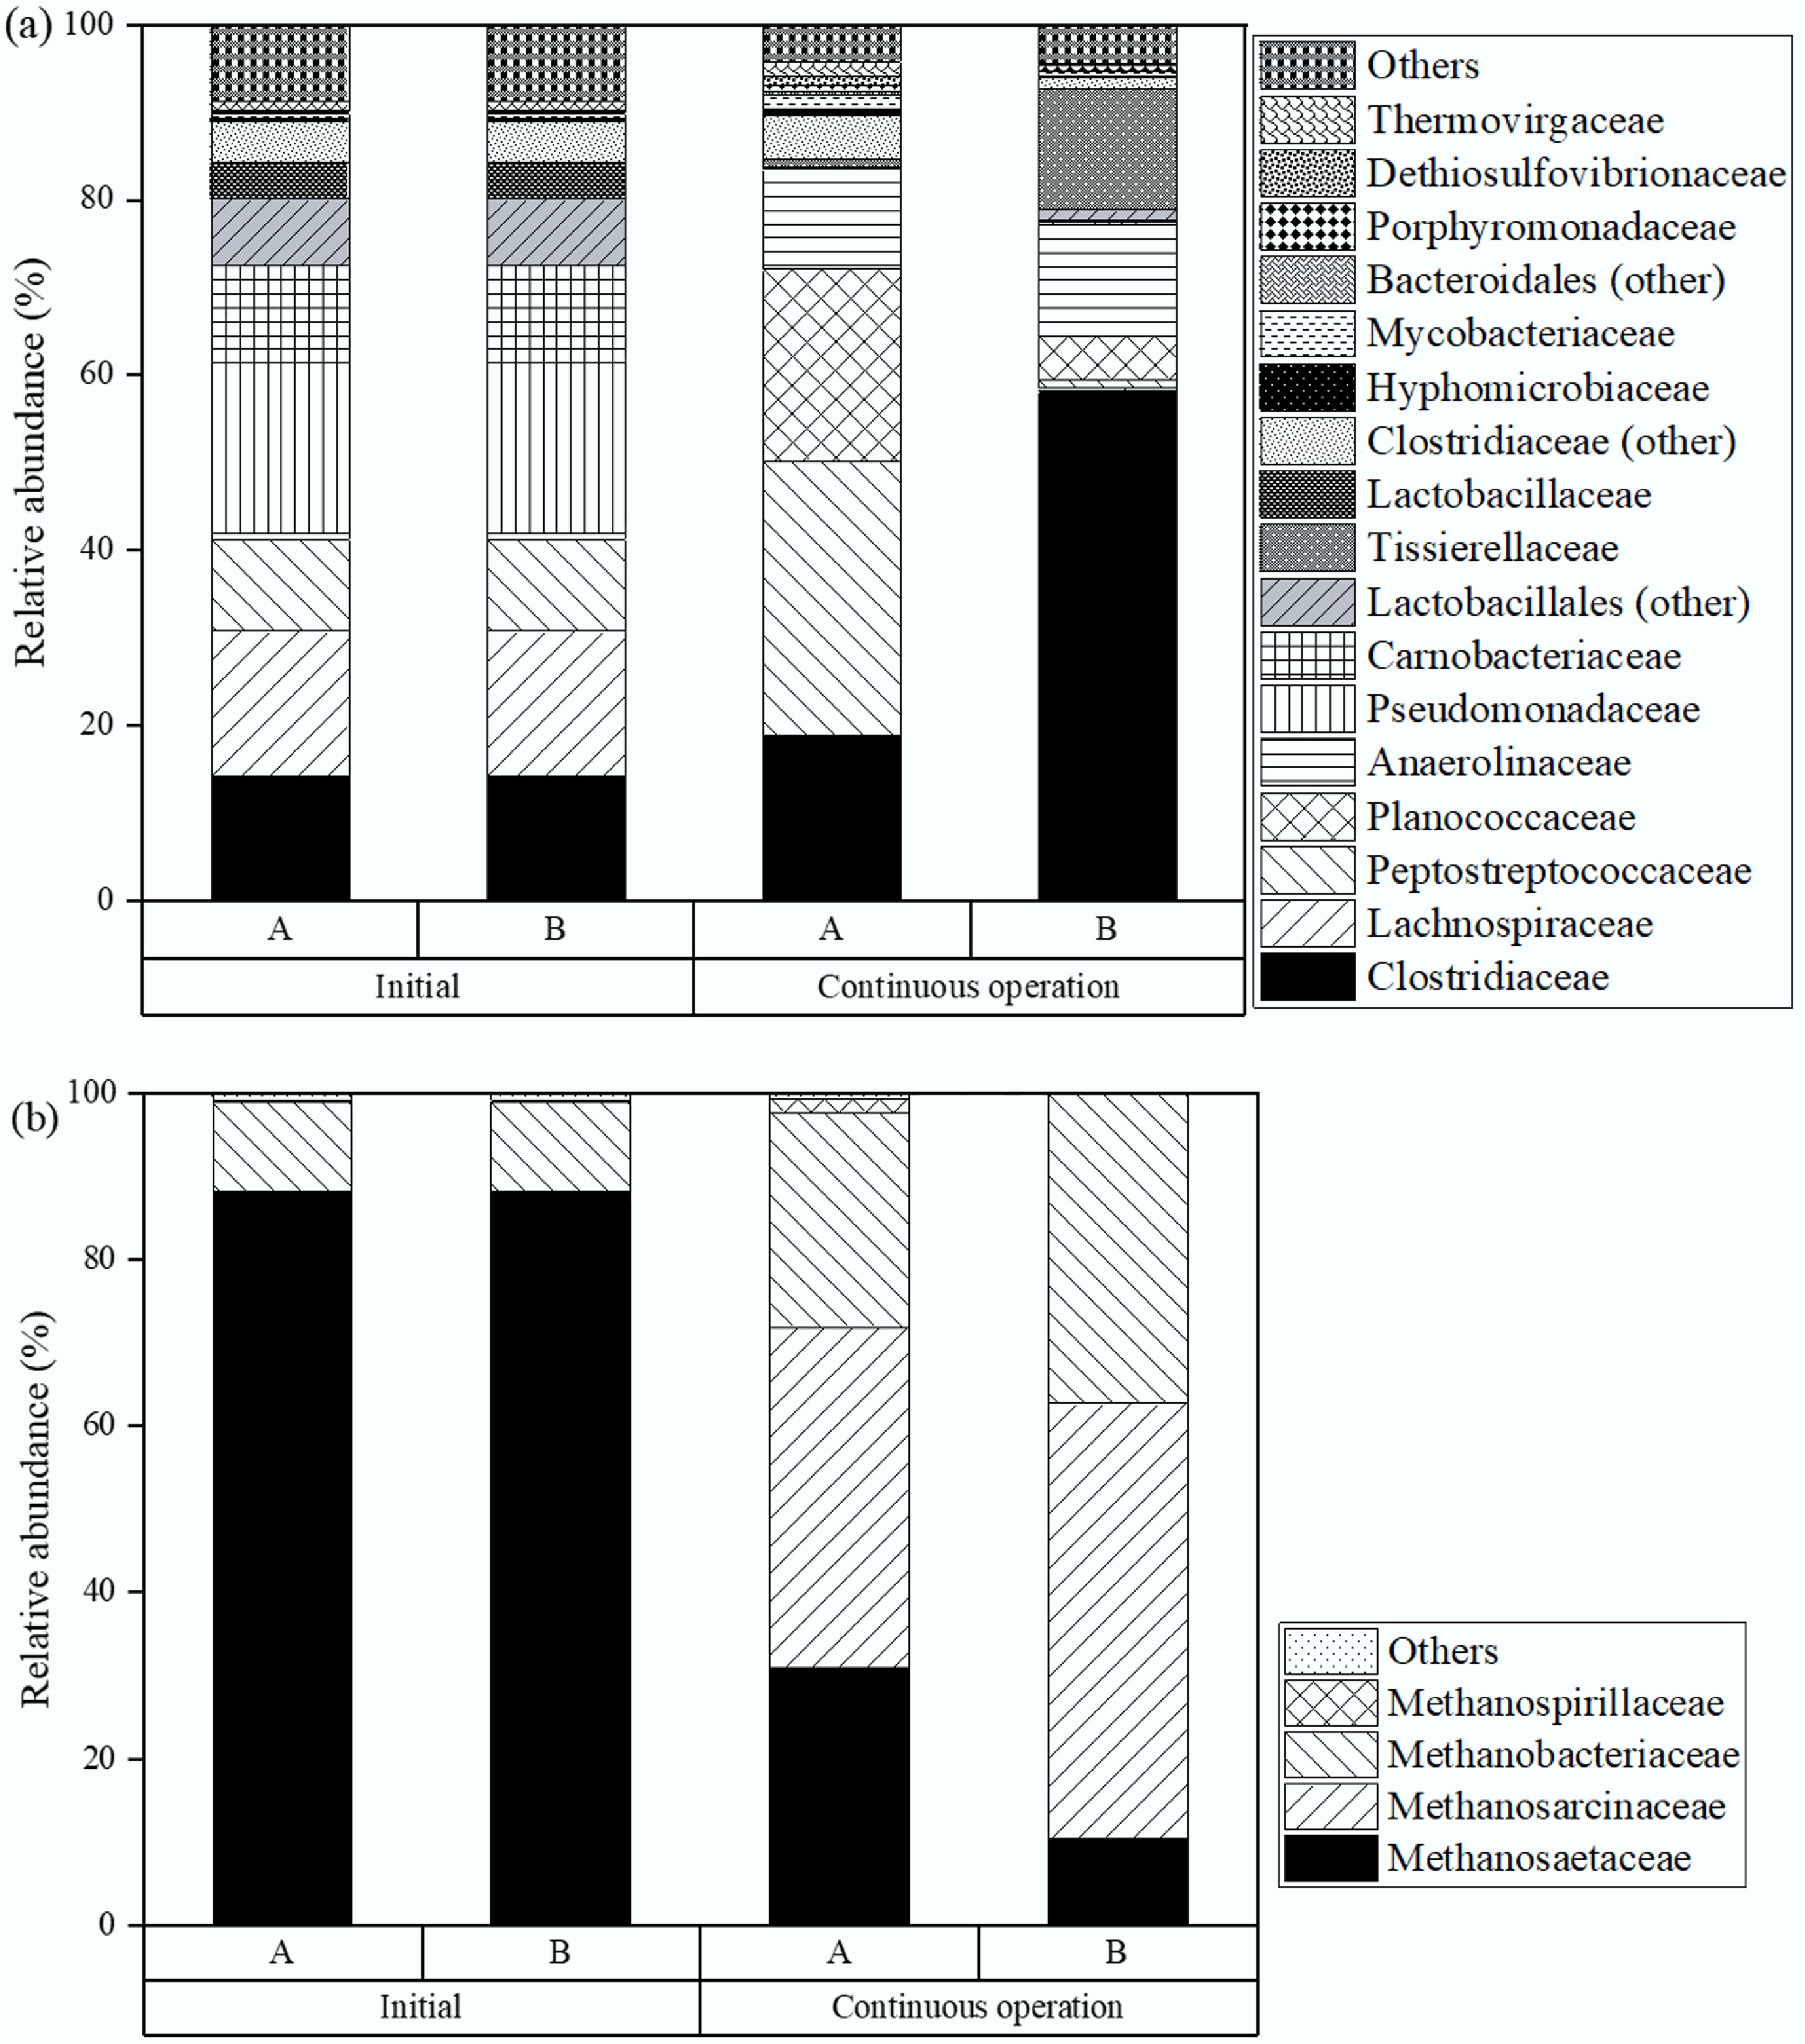
Figure 9.
Microbial distribution at the family level in the second phase of TPAD with (a), and without (b) biochar addition during semi-continuous operation.
-
Parameter Food waste Biochar 650 °C Carbon (%) 42.7 67.37 Nitrogen (%) 2.3 0.75 Hydrogen (%) 9.1 1.05 Sulphur (%) 0.3 0.1 C/N ratio 18.6 89.8 Total solids (%) 61.2 96.6 Volatile solids (%) 59.5 83.7 pH 4.9 8.47 Particle size distribution (µm) ND 3.5–25.9 BET surface area (m2/g) ND 265.34 Pore volume (cm3/g) 0.108 ND: not determined. Table 1.
Characteristics of the food waste and biochar
-
Reactor Stage OLR
(g VS/(L·d))HRT (d) Operation time (d) Biochar addition (g/L) R1 without biochar I 0.5 3 30 0 II 1 3 10 0 III 2 3 10 0 IV 3 3 10 0 V 4 3 10 0 VI 4 3 20 0 VII 6 3 10 0 R2 without biochar I 0.5 10 30 0 II 1 10 10 0 III 2 10 10 0 IV 3 10 10 0 V 4 10 10 0 VI 4 10 20 0 VII 6 10 10 0 R1 with biochar I 0.5 3 30 15 II 1 3 10 15 III 2 3 10 15 IV 3 3 10 15 V 4 3 10 15 VI 4 3 20 15 VII 6 3 10 15 R2 with biochar I 0.5 10 30 15 II 1 10 10 15 III 2 10 10 15 IV 3 10 10 15 V 4 10 10 15 VI 4 10 20 15 VII 6 10 10 15 Table 2.
Summary of experimental conditions
-
Reactor Stage Gas composition Biogas production rate (L·d) YH (mL/g VS) YM (mL/g VS) pH H2 (%) CH4 (%) CO2 (%) R1 without biochar I 30.26 0.63 69.15 302 92.74 0 4.9 ± 0.1 II 33.61 0.37 66.01 480 81.71 0 5.0 ± 0.3 III 43.76 0 56.23 682 81.40 0 5.1 ± 0.1 IV 47.82 0 51.96 1,116 82.59 0 5.1 ± 0.1 V 49.38 0 50.61 1,488 93.72 0 5.0 ± 0.3 VI 50.44 0 49.55 1,647 107.82 0 5.1 ± 0.2 VII 41.47 0 51.53 1,510 90.96 0 4.8 ± 0.3 R2 without biochar I 14.04 37.71 48.24 147 0 99.97 6.2 ± 0.1 II 0 64.77 35.22 353 0 140.20 6.7 ± 0.2 III 0 74.14 25.86 564 0 152.96 6.8 ± 0.3 IV 0 73.26 26.73 1,062 0 172.71 6.7 ± 0.1 V 0 72.62 27.38 1,736 0 212.69 6.8 ± 0.3 VI 0 74.41 25.58 1,801 0 227.63 6.8 ± 0.1 VII 0 62.13 28.87 1,621 199.71 6.2 ± 0.4 R1 with biochar I 37.37 0.35 61.31 467 138.36 0 5.4 ± 0.1 II 45.17 0 54.82 1158 146.25 0 5.5 ± 0.2 III 50.71 0 49.28 1,462 164.24 0 5.5 ± 0.3 IV 50.14 0 49.85 1,890 168.24 0 5.5 ± 0.1 V 51.58 0 48.41 2,115 176.51 0 5.6 ± 0.1 VI 53.15 0 46.84 2,320 189.73 0 5.6 ± 0.2 VII 52.42 0 47.58 2,329 183.59 0 5.4 ± 0.3 R2 with biochar I 14.51 39.66 47.44 648 0 199.13 6.8 ± 0.1 II 0 74.04 25.96 1,104 0 224.27 7.1 ± 0.2 III 0 76.36 23.63 1,654 0 312.48 7.2 ± 0.1 IV 0 77.63 22.36 1,867 0 315.16 7.3 ± 0.1 V 0 80.24 19.75 2,215 0 394.54 7.3 ± 0.2 VI 0 81.21 17.24 2,383 0 407.17 7.4 ± 0.2 VII 0 80.65 19.35 2,361 0 374.24 7.3 ± 0.2 Table 3.
Performance of reactor during H2 and CH4 production
Figures
(9)
Tables
(3)