-
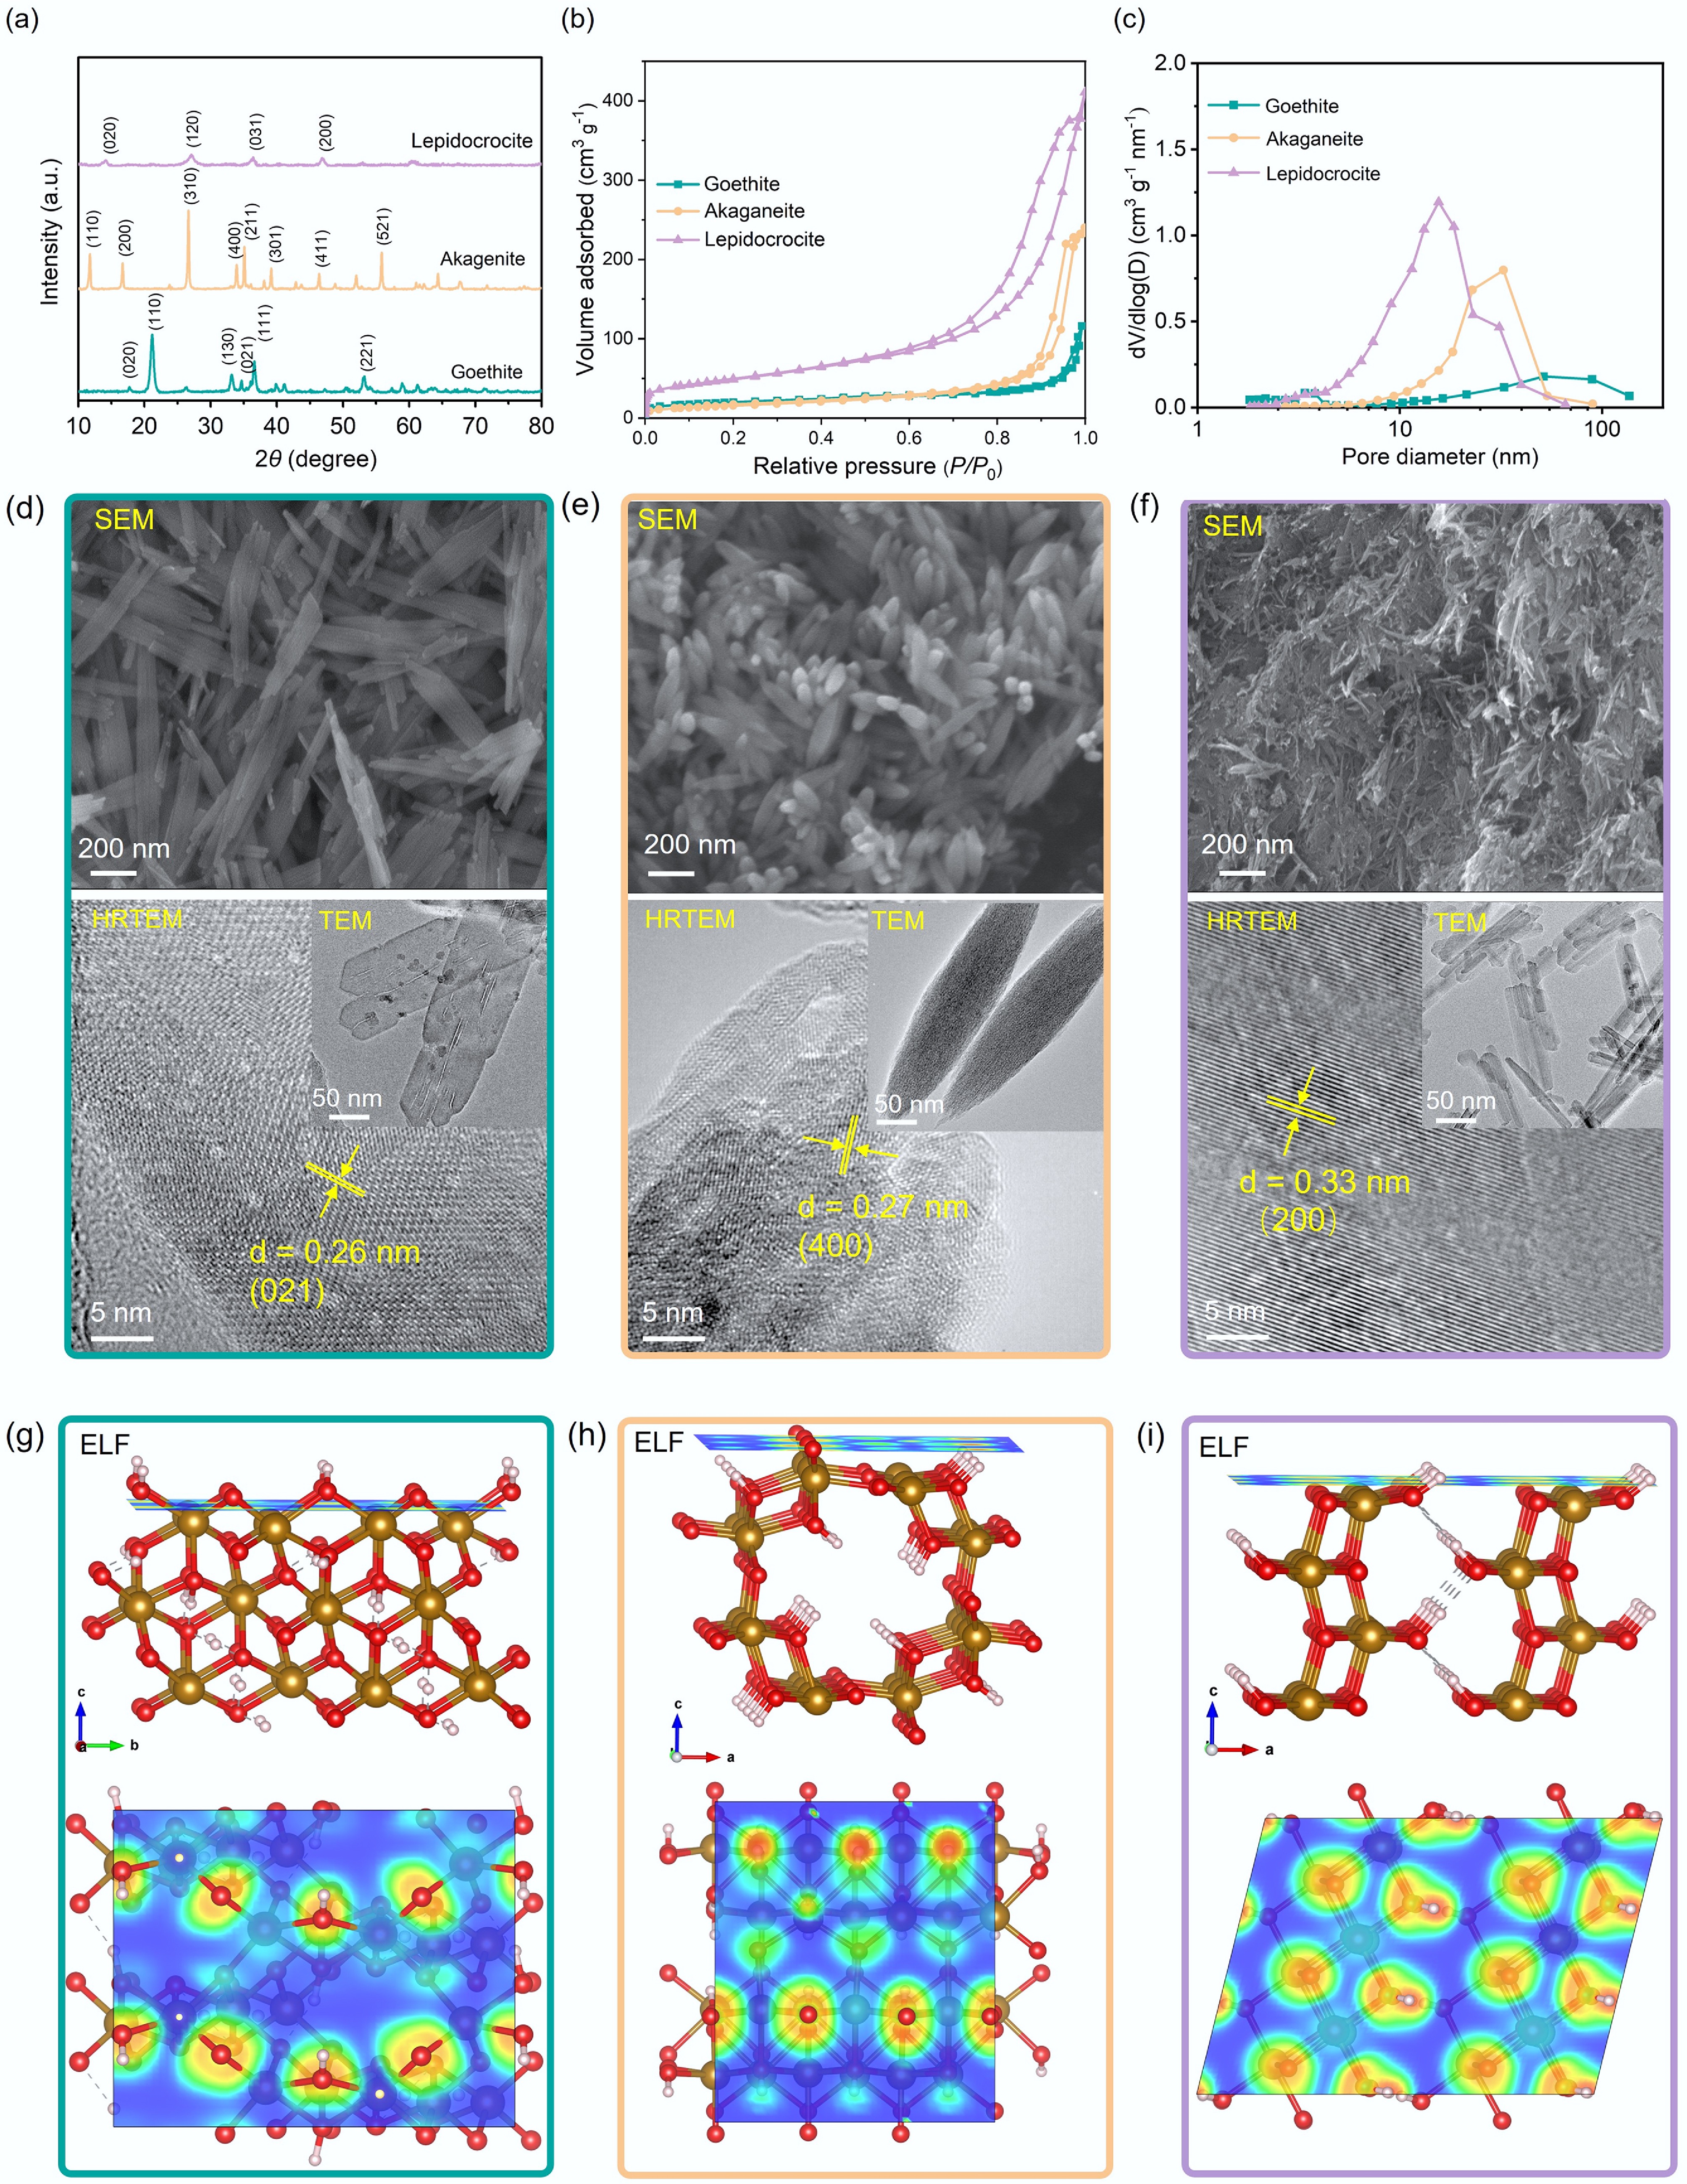
Figure 1.
(a) X-ray diffraction (XRD) patterns, (b) nitrogen adsorption–desorption isotherms, and (c) pore size distribution curves of goethite, akaganeite, and lepidocrocite. Scanning electron microscopy (SEM), transmission electron microscopy (TEM), and high-resolution TEM (HRTEM) images of (d) goethite, (e) akaganeite, and (f) lepidocrocite. Electron localization function (ELF) analysis of (g) goethite, (h) akaganeite, and (i) lepidocrocite. Red regions in the ELF isosurface represent strong electron localization, while blue regions indicate delocalized electron states.
-
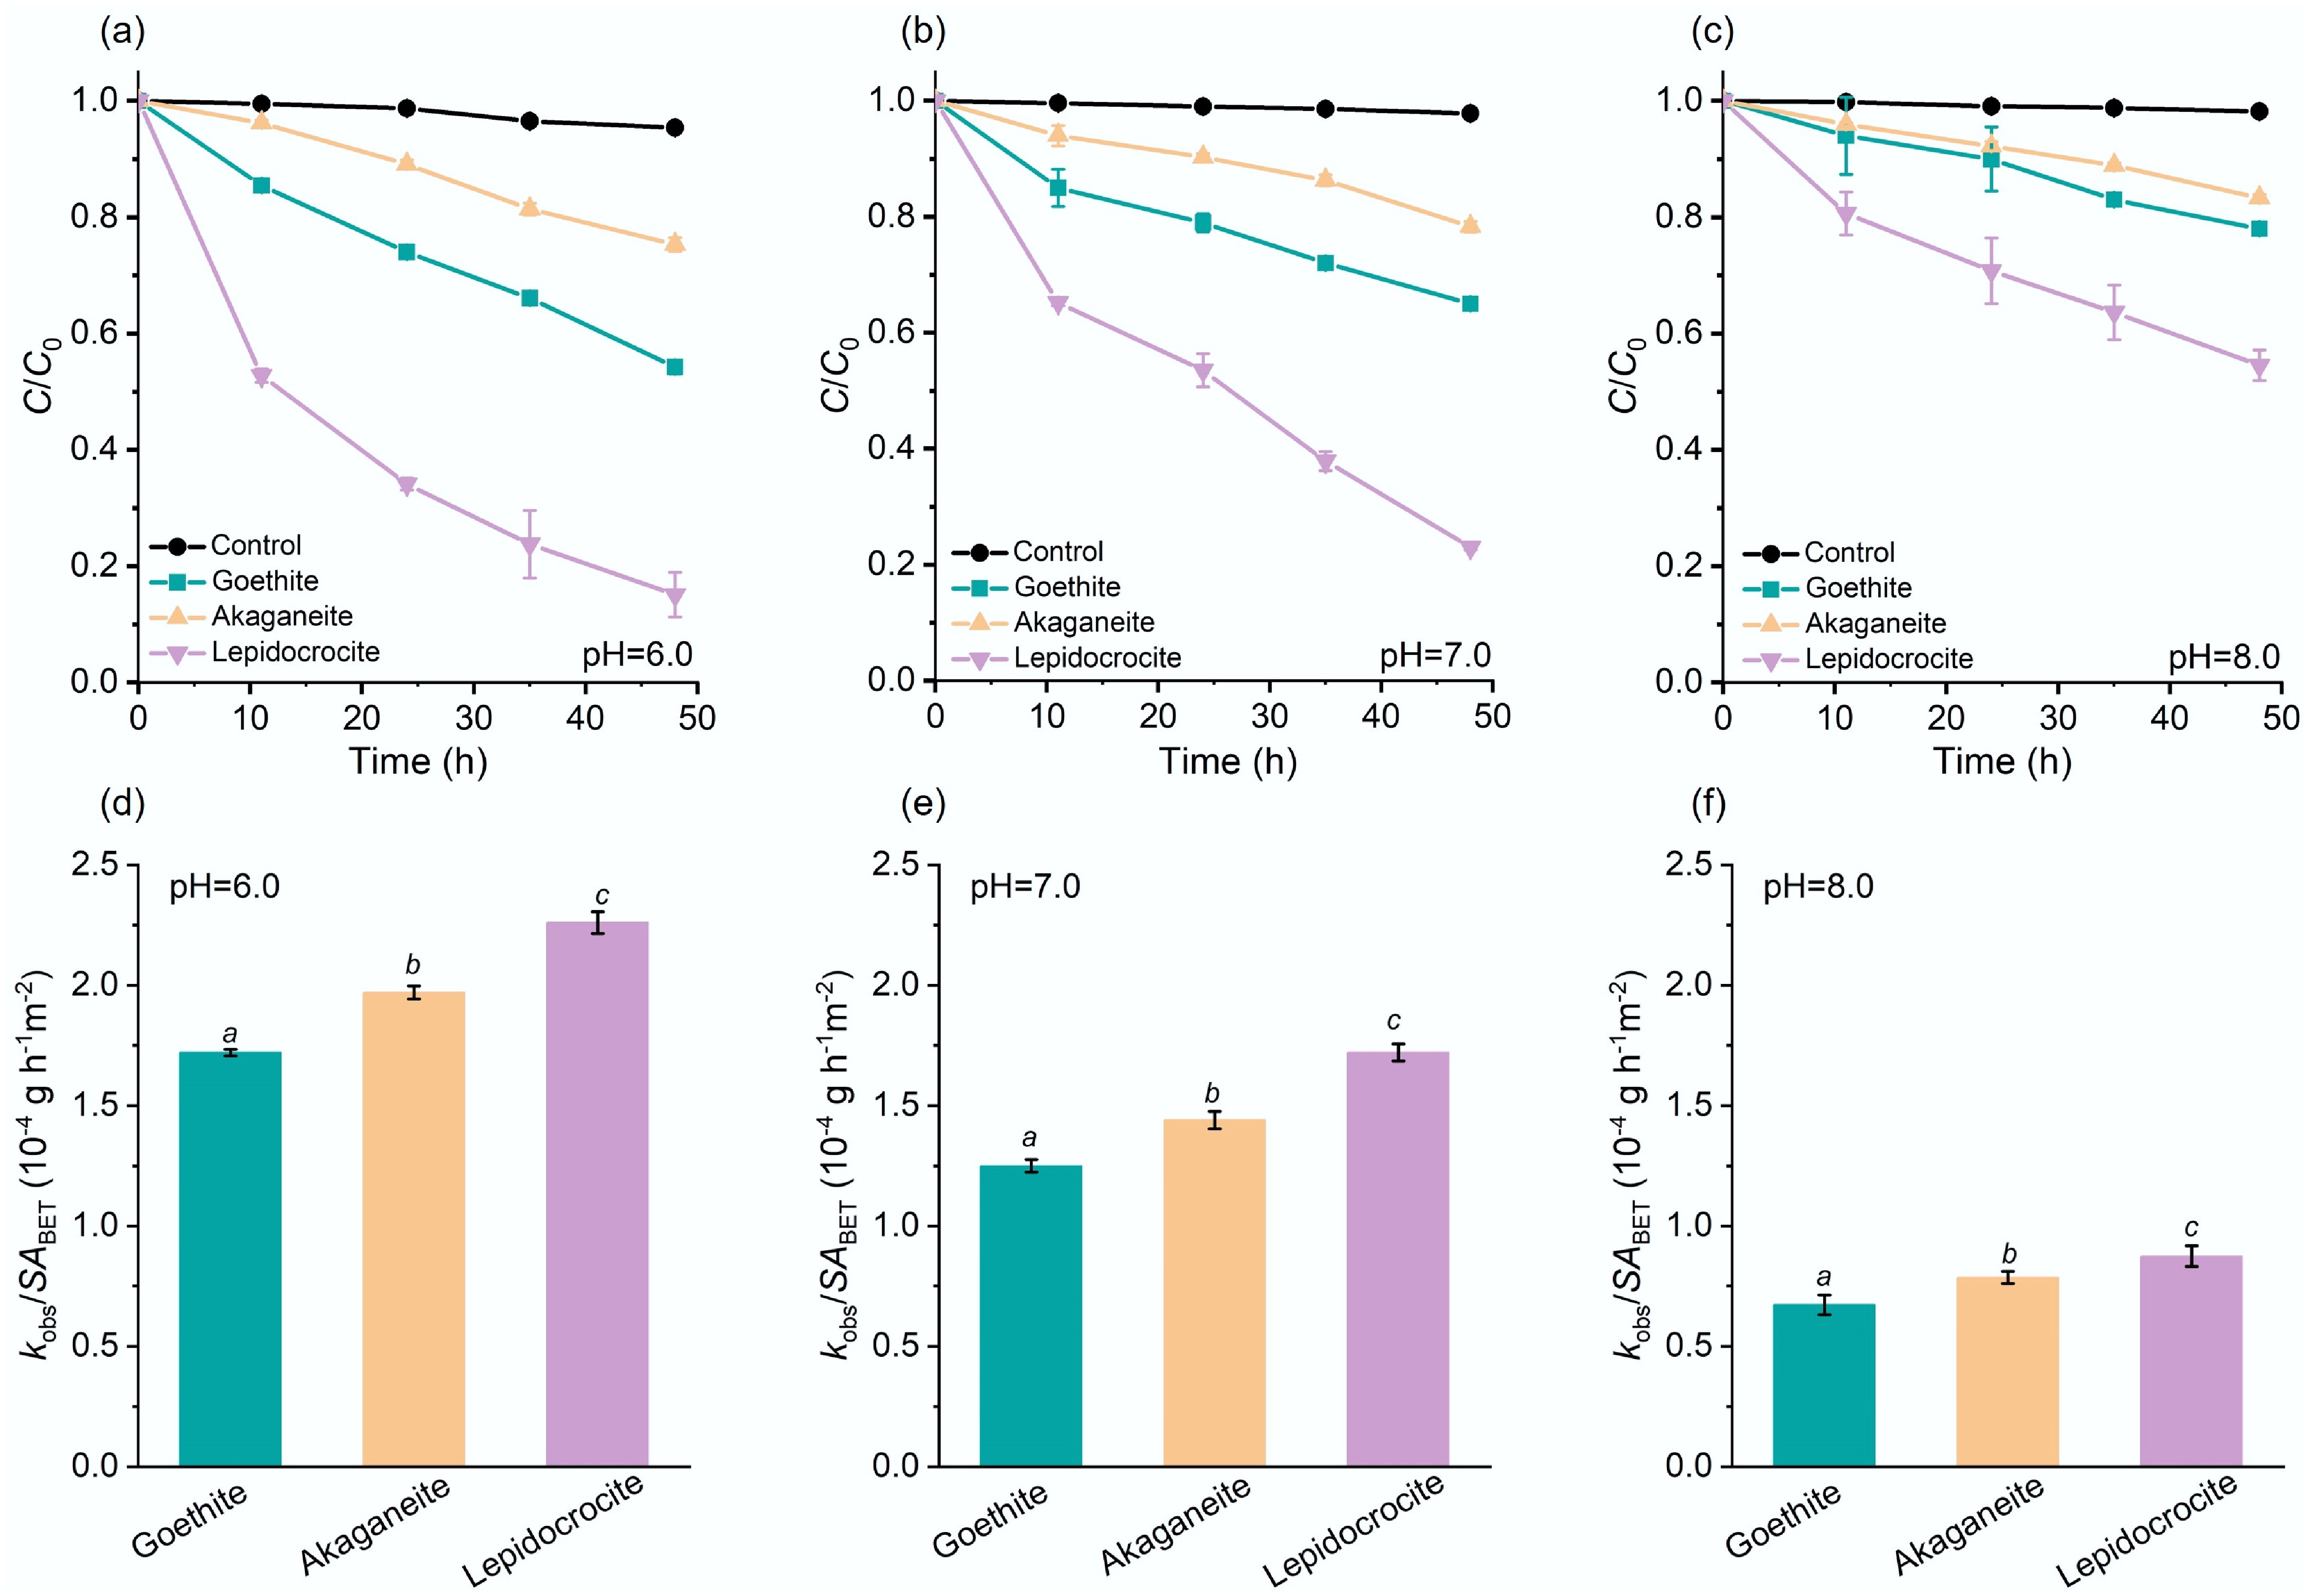
Figure 2.
Efficiencies of iron oxyhydroxide nanoparticles in catalyzing pNPP hydrolysis. Catalytic pNPP hydrolysis kinetic curves in the absence (denoted as 'Control'), or presence of the iron oxyhydroxide nanoparticles at pH (a) 6.0, (b) 7.0, (c) 8.0, and (d)–(f) the corresponding surface area-normalized kobs. Initial pNPP concentration: 6.0 mg L−1. The italic letters denote significant differences (p < 0.05).
-

Figure 3.
(a)–(c) Initial hydrolysis reaction rate (r0) vs initial pNPP concentration (C0), with lines representing least-squares fit to the L–H model, (d)–(f) linear plot of r0−1 vs C0−1, (g)–(i) L–H model parameters KL (representing surface adsorption affinity), and (j)–(l) kr (representing surface reactivity) determined for each material at pH 6.0, 7.0, and 8.0.
-
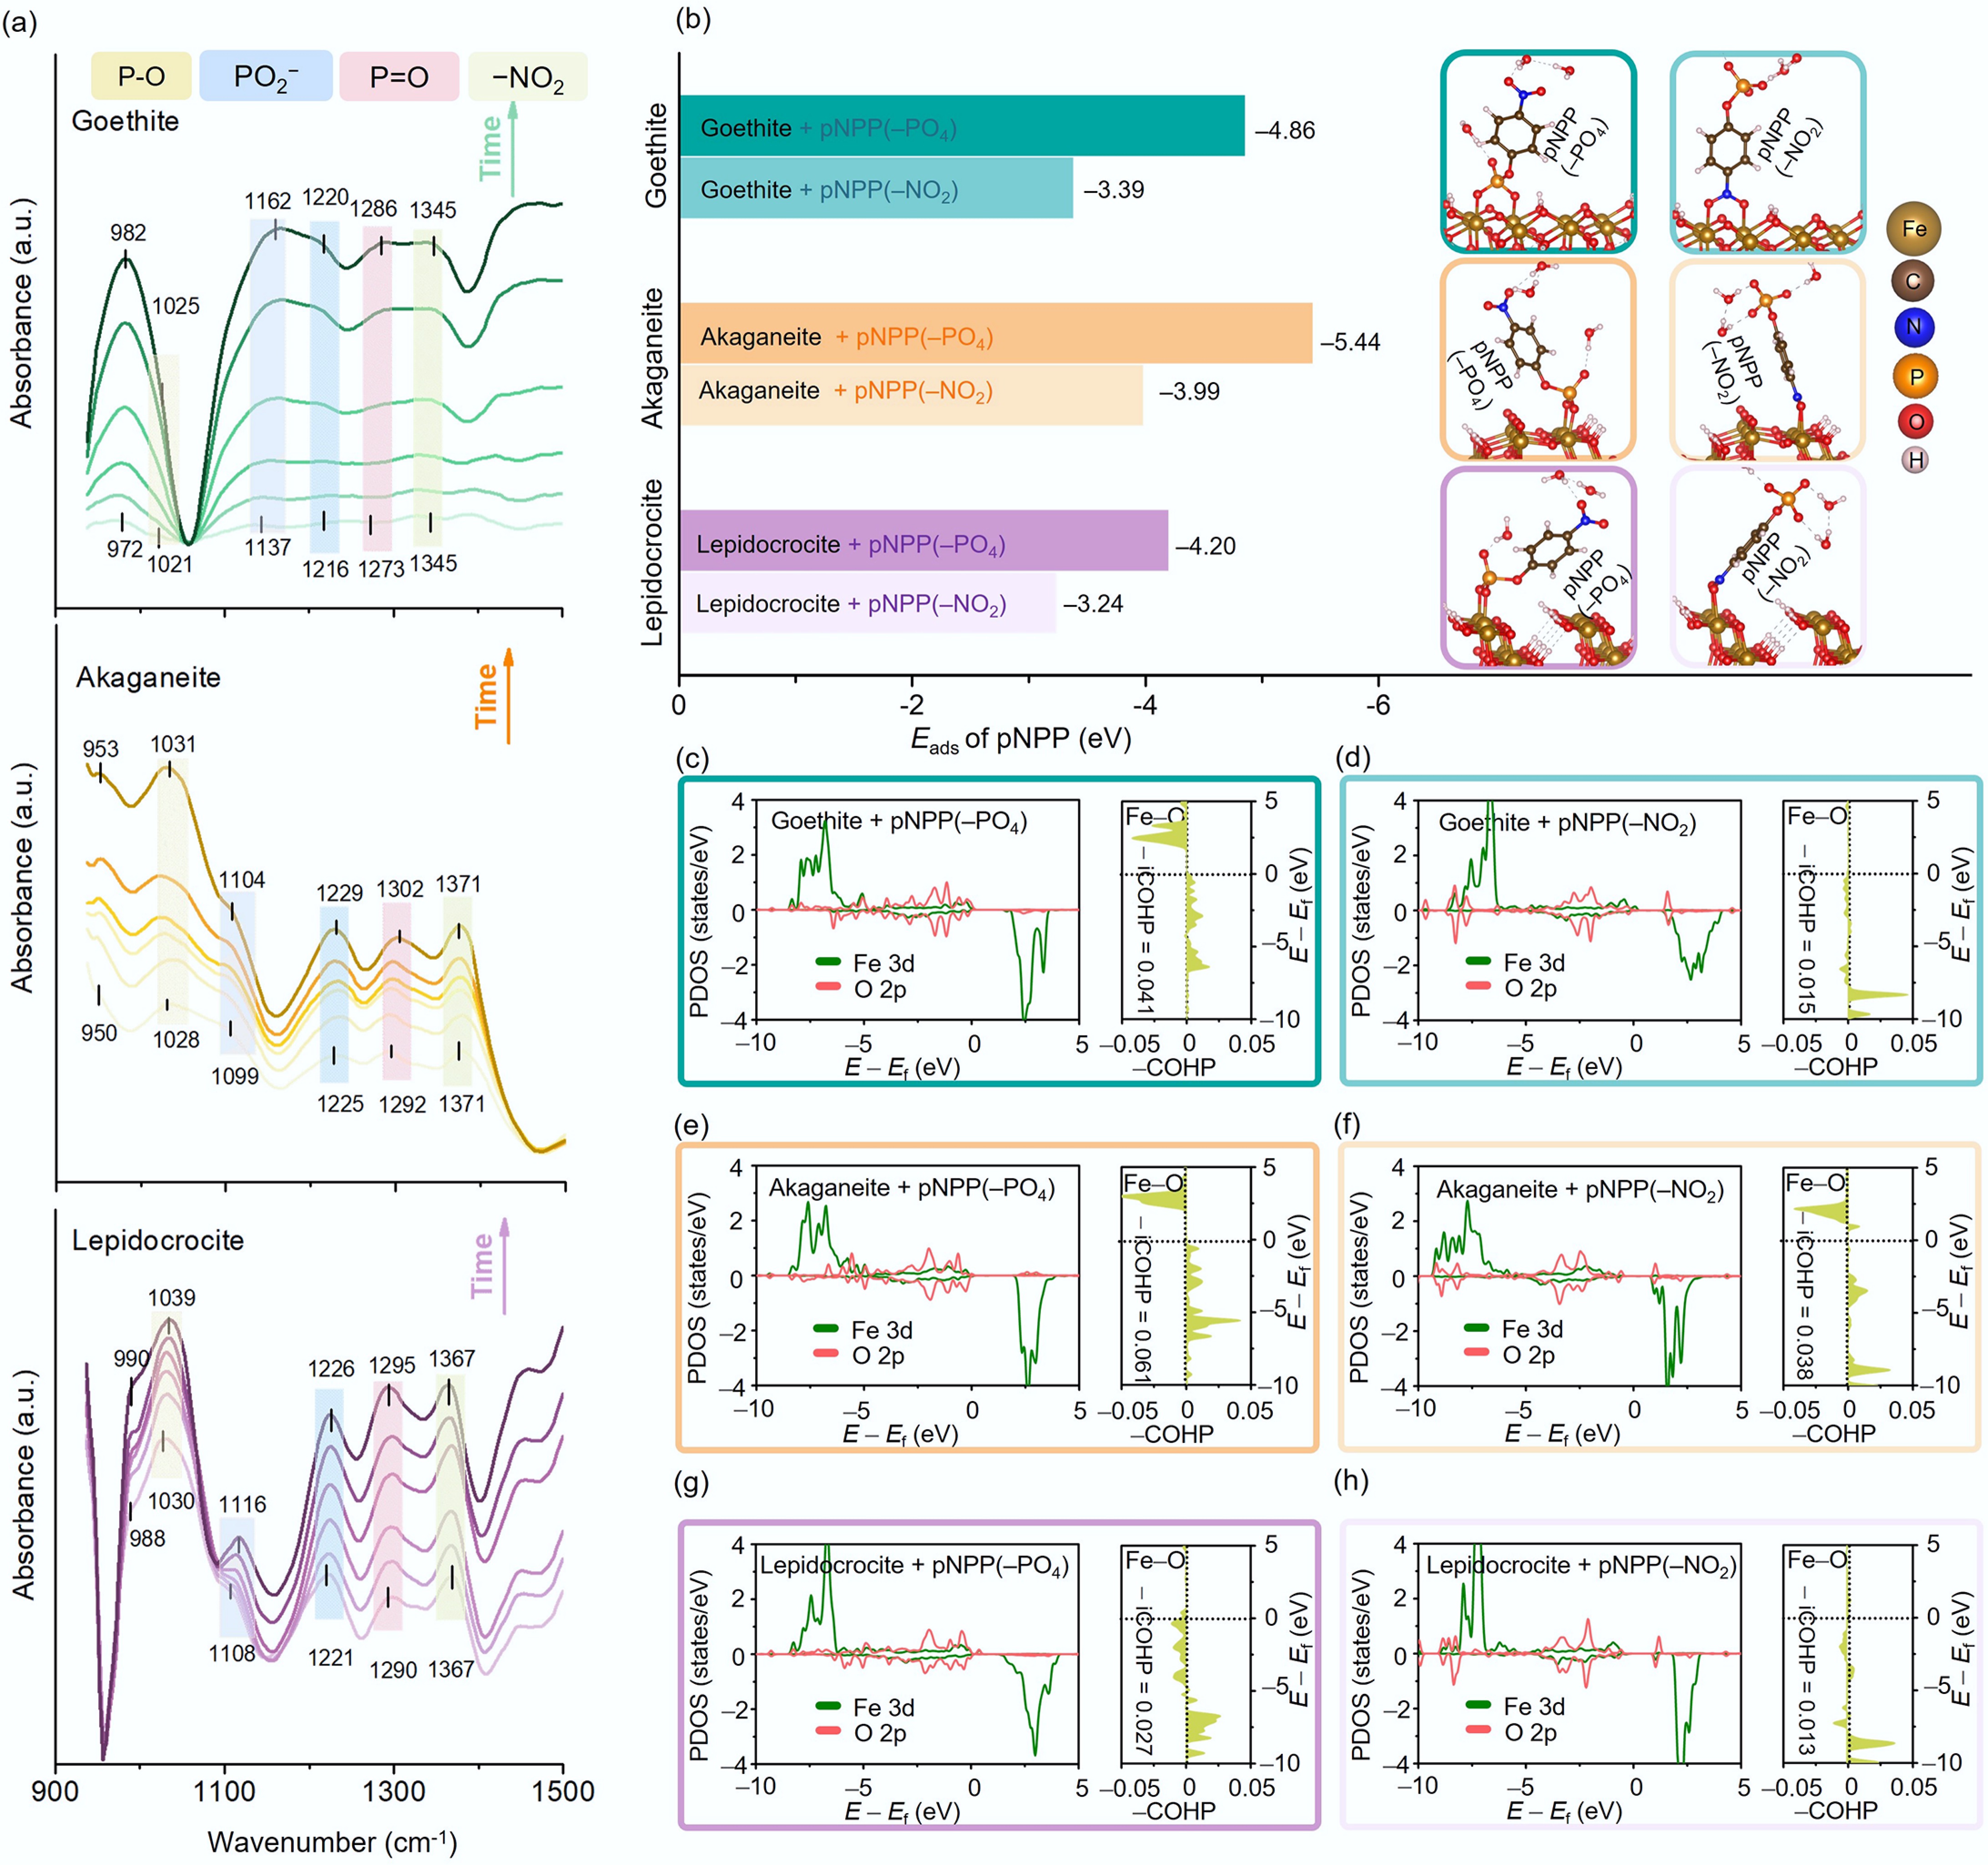
Figure 4.
(a) In situ ATR-FTIR spectra of goethite, akaganeite, and lepidocrocite (along the direction indicated by the arrow; the time is: 5, 30, 60, 90, 130, and 180 min). (b) The adsorption energy (Eads) of pNPP on goethite, akaganeite, and lepidocrocite via different functional groups (−PO4 or −NO2) and the corresponding stable adsorption configurations (insets). The PDOS and COHP of Fe 3d and O 2p orbitals during adsorption in various configurations: adsorption of pNPP via the −PO4 or −NO2 group on (c), (d) goethite, (e), (f) akaganeite, and (g), (h) lepidocrocite.
-
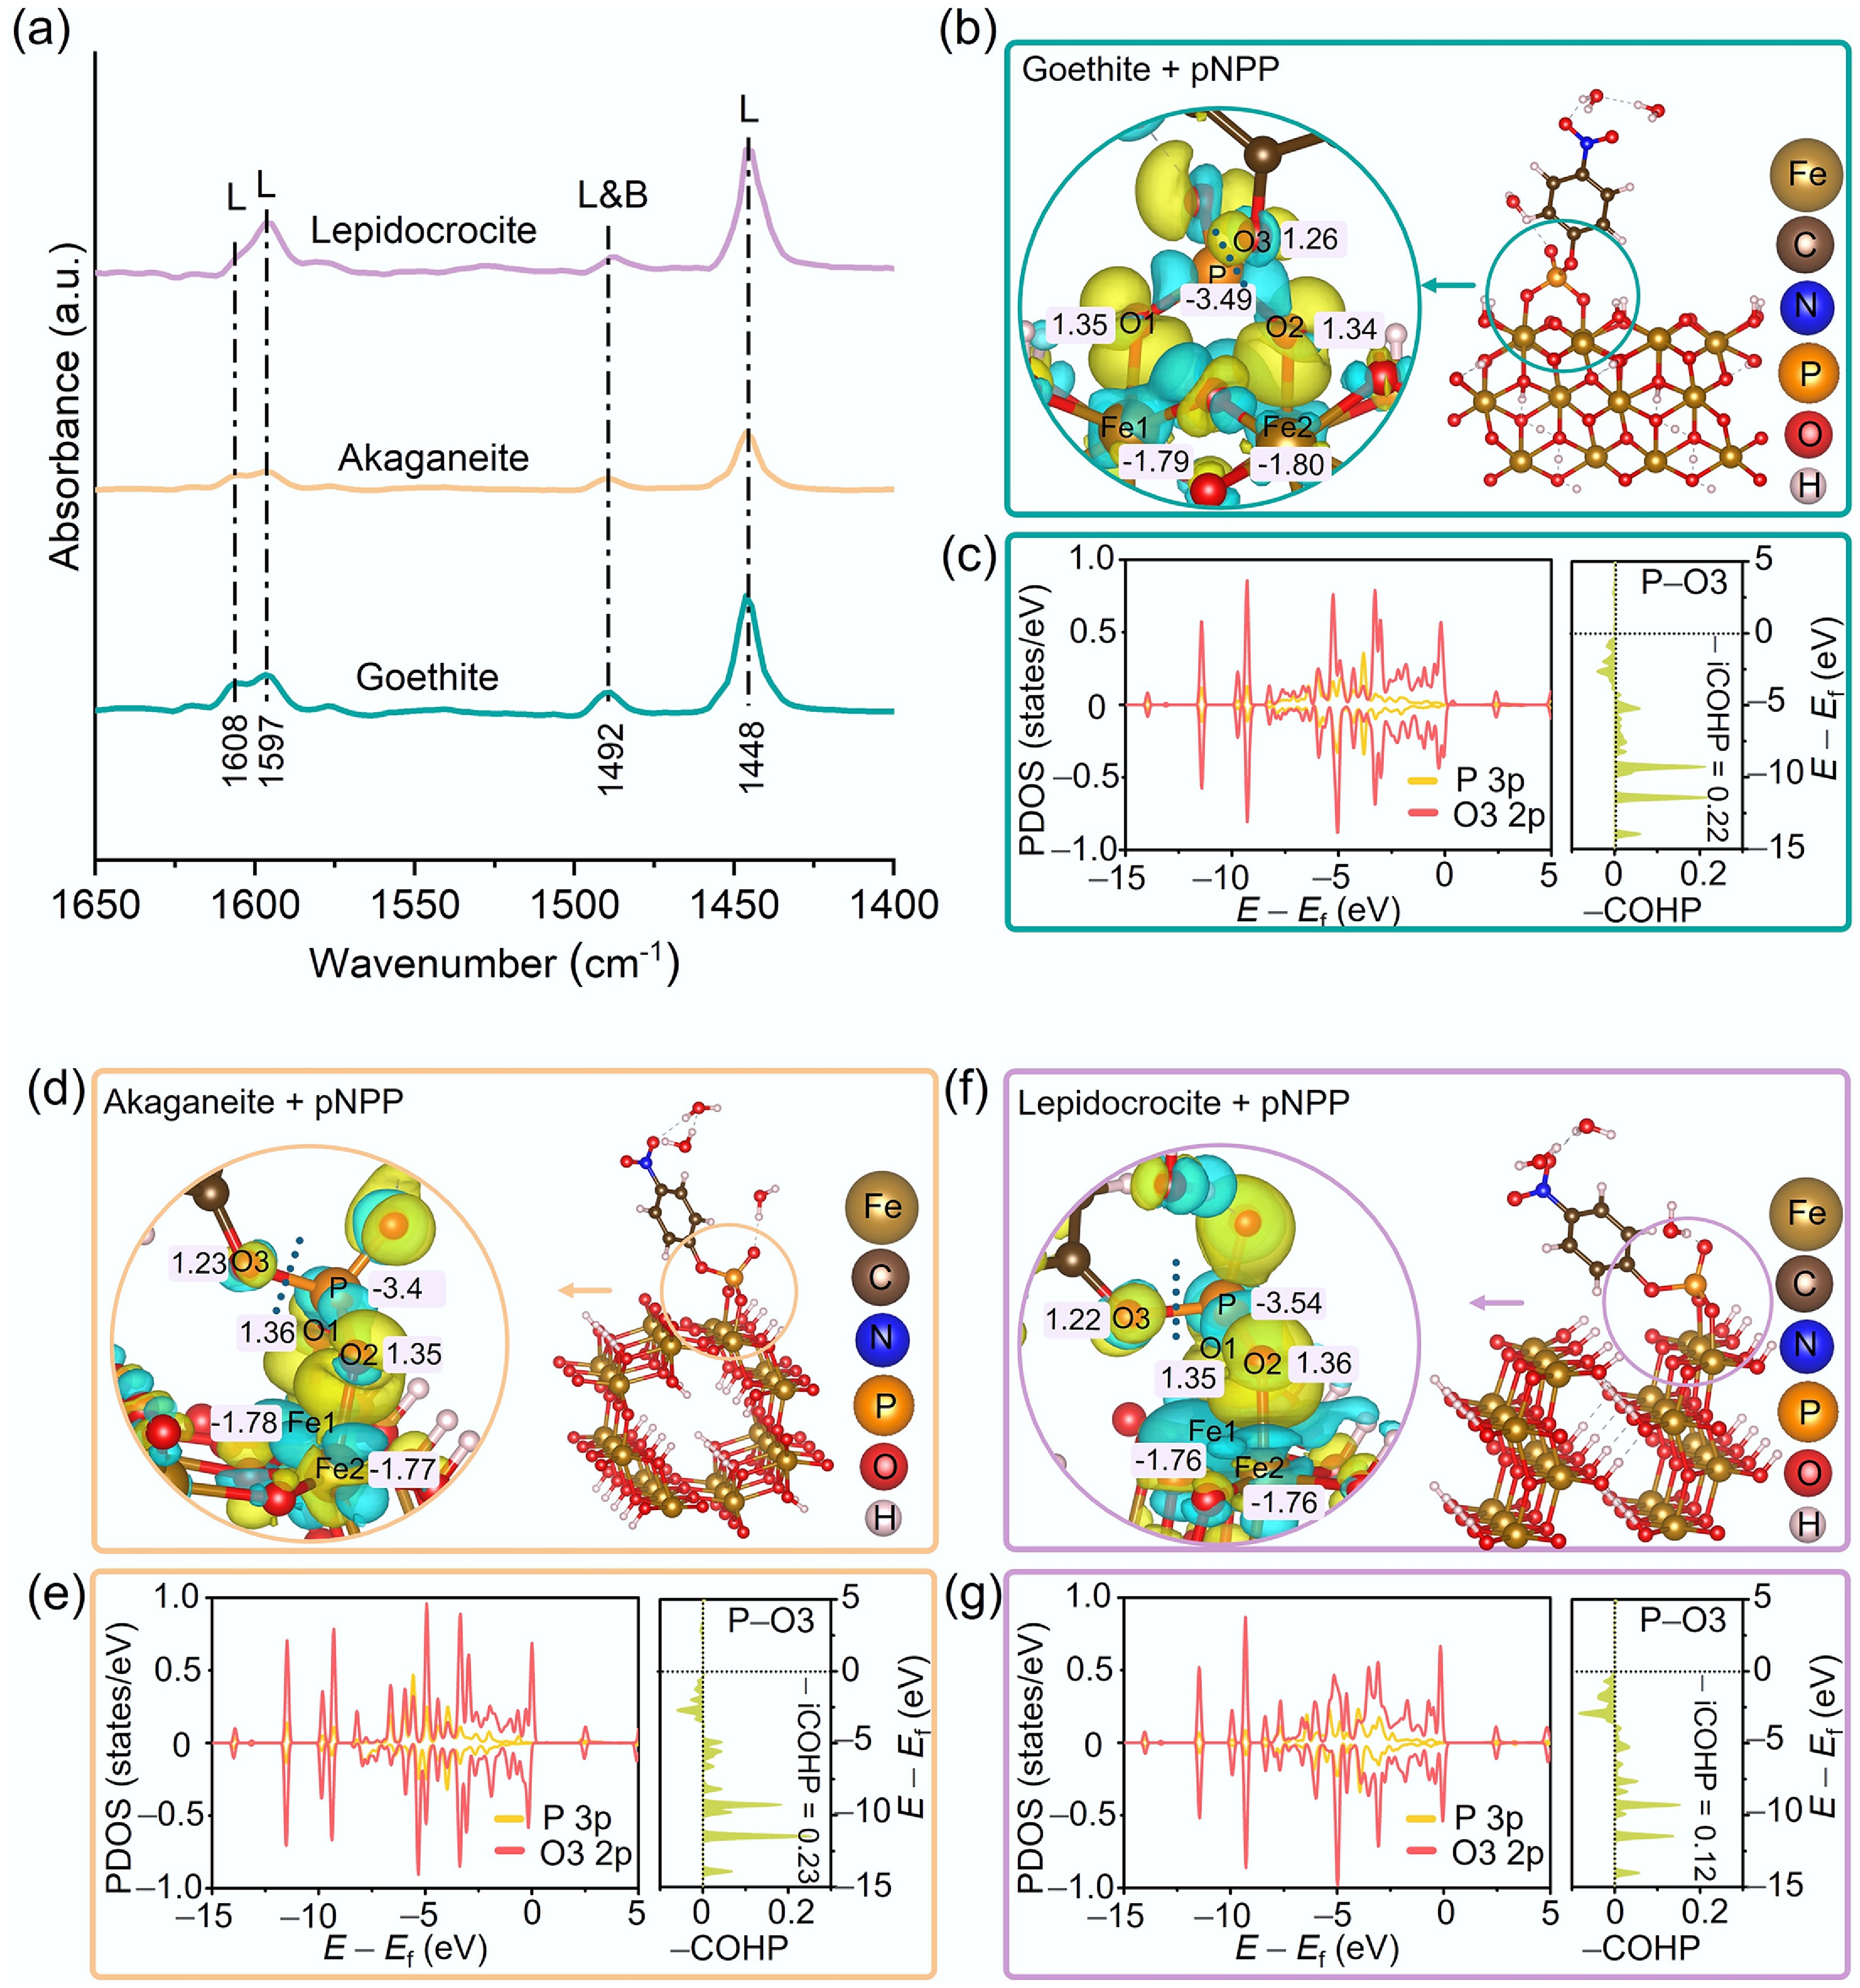
Figure 5.
(a) Py-IR spectra of goethite, akaganeite, and lepidocrocite. Charge density differences and Bader charge analyses for pNPP molecules adsorbed onto the surfaces of (b) goethite, (d) akaganeite, and (f) lepidocrocite. Yellow and cyan regions represent electron accumulation and depletion, respectively. PDOS and COHP analyses of the P 3p and O3 2p orbitals in pNPP adsorbed on (c) goethite, (e) akaganeite, and (g) lepidocrocite, respectively.
Figures
(5)
Tables
(0)