-
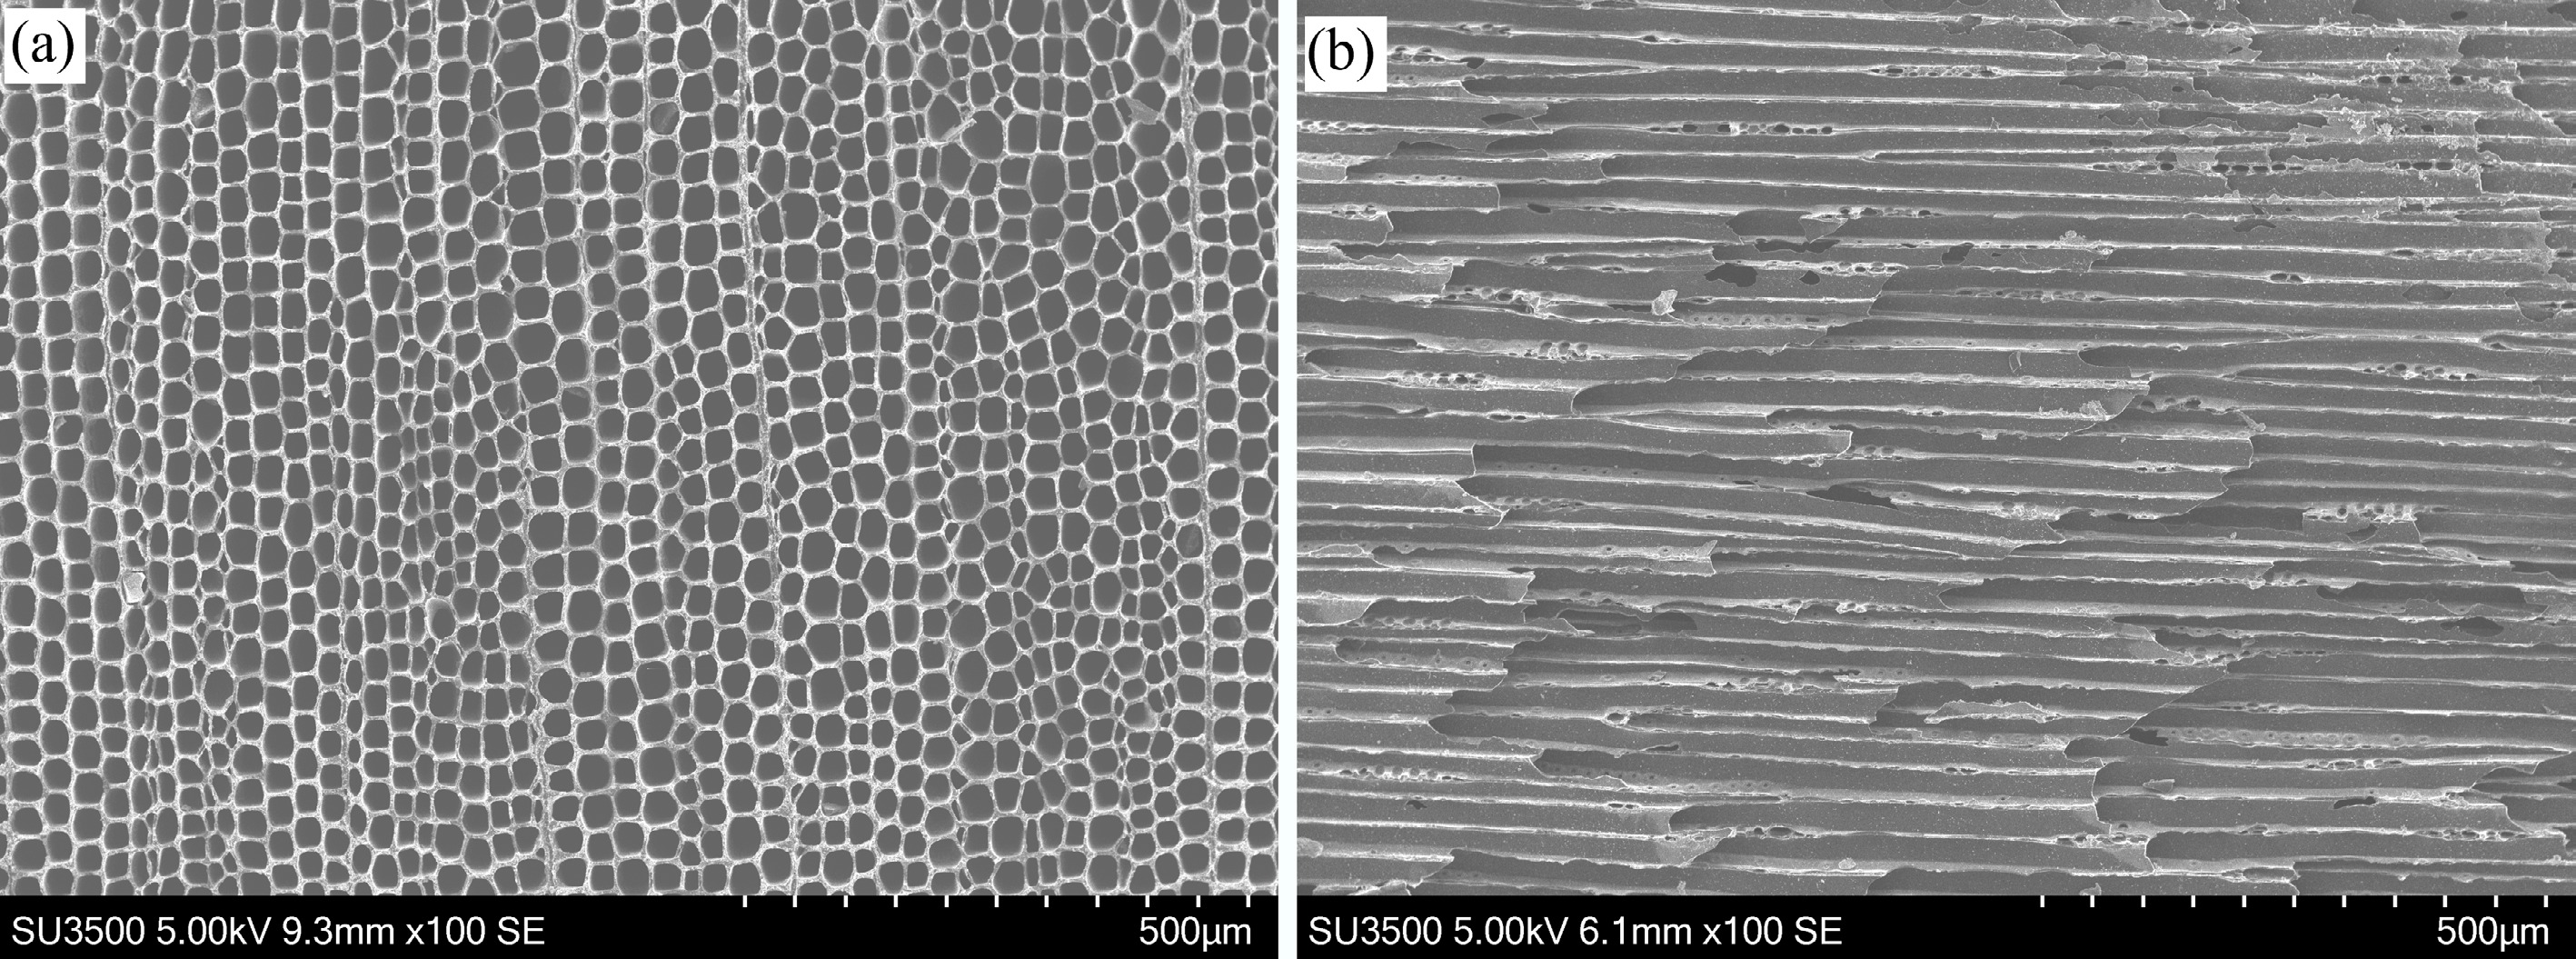
Figure 1.
SEM images of pine biochar (a) produced at 1,000 °C in axial, and (b) transverse orientations.
-
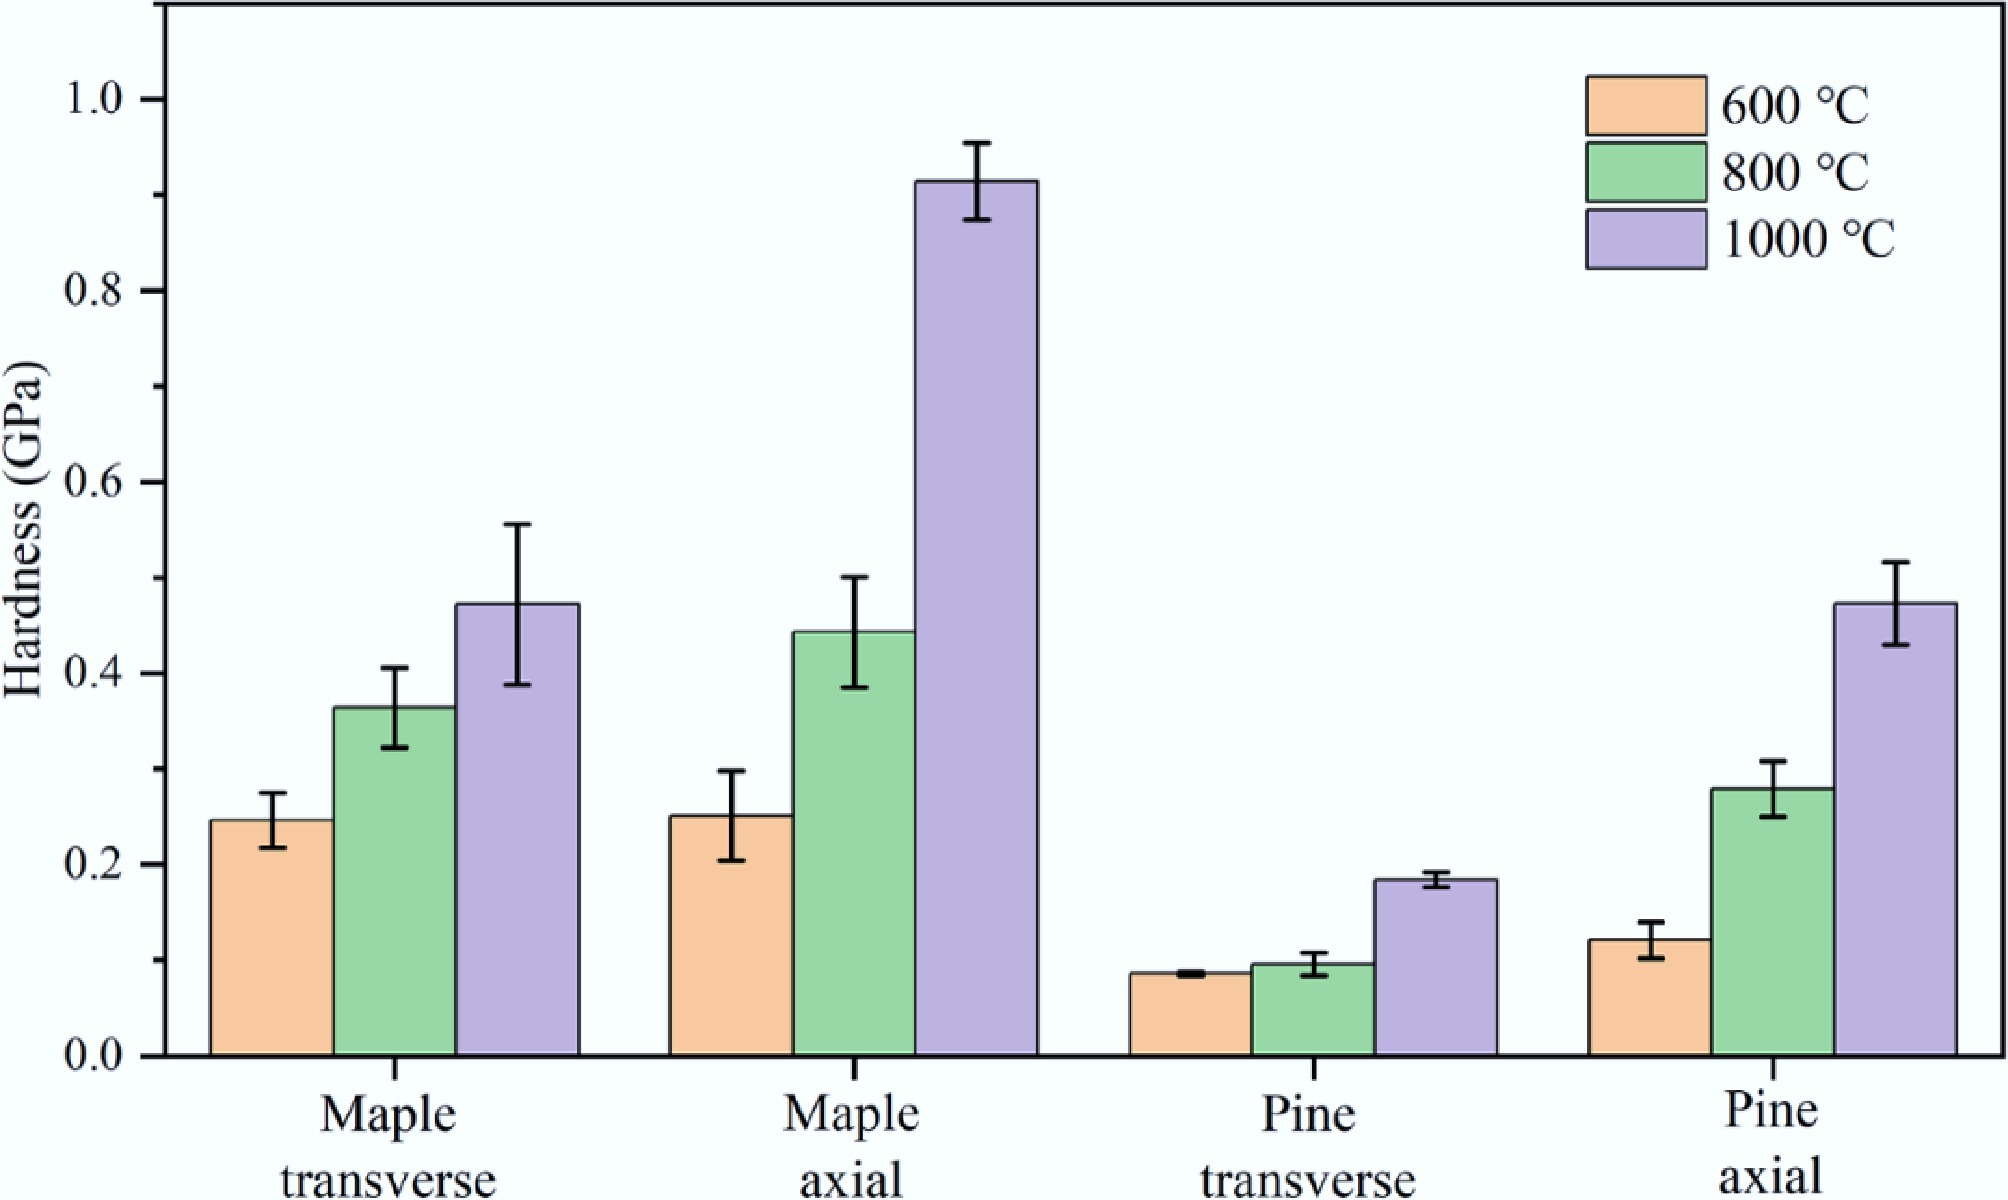
Figure 2.
Hardness of maple and pine biochar produced at 600, 800, and 1,000 °C in axial and transverse directions.
-
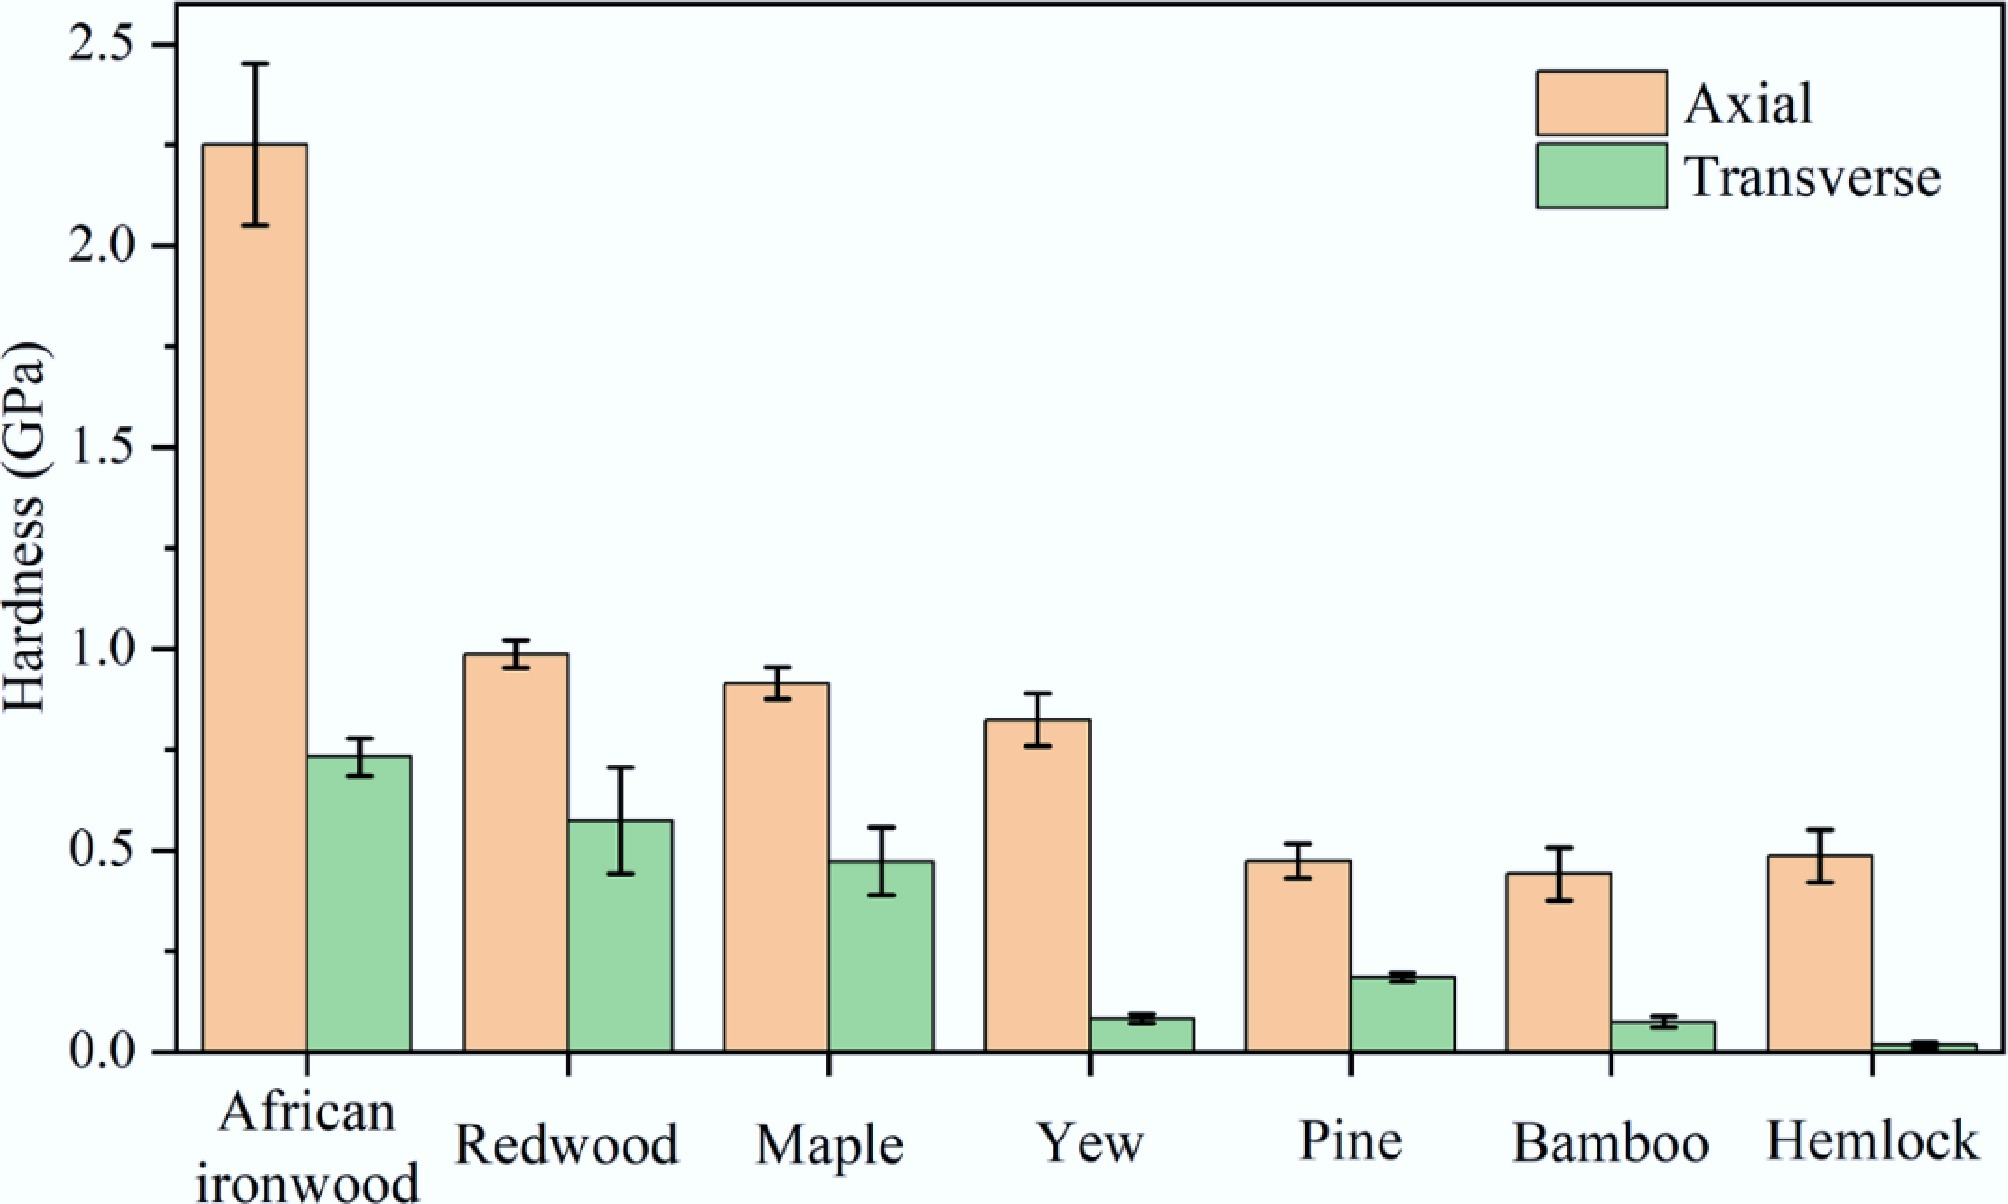
Figure 3.
Hardness of biochar in axial and transverse directions for different wood species pyrolyzed at 1,000 °C.
-
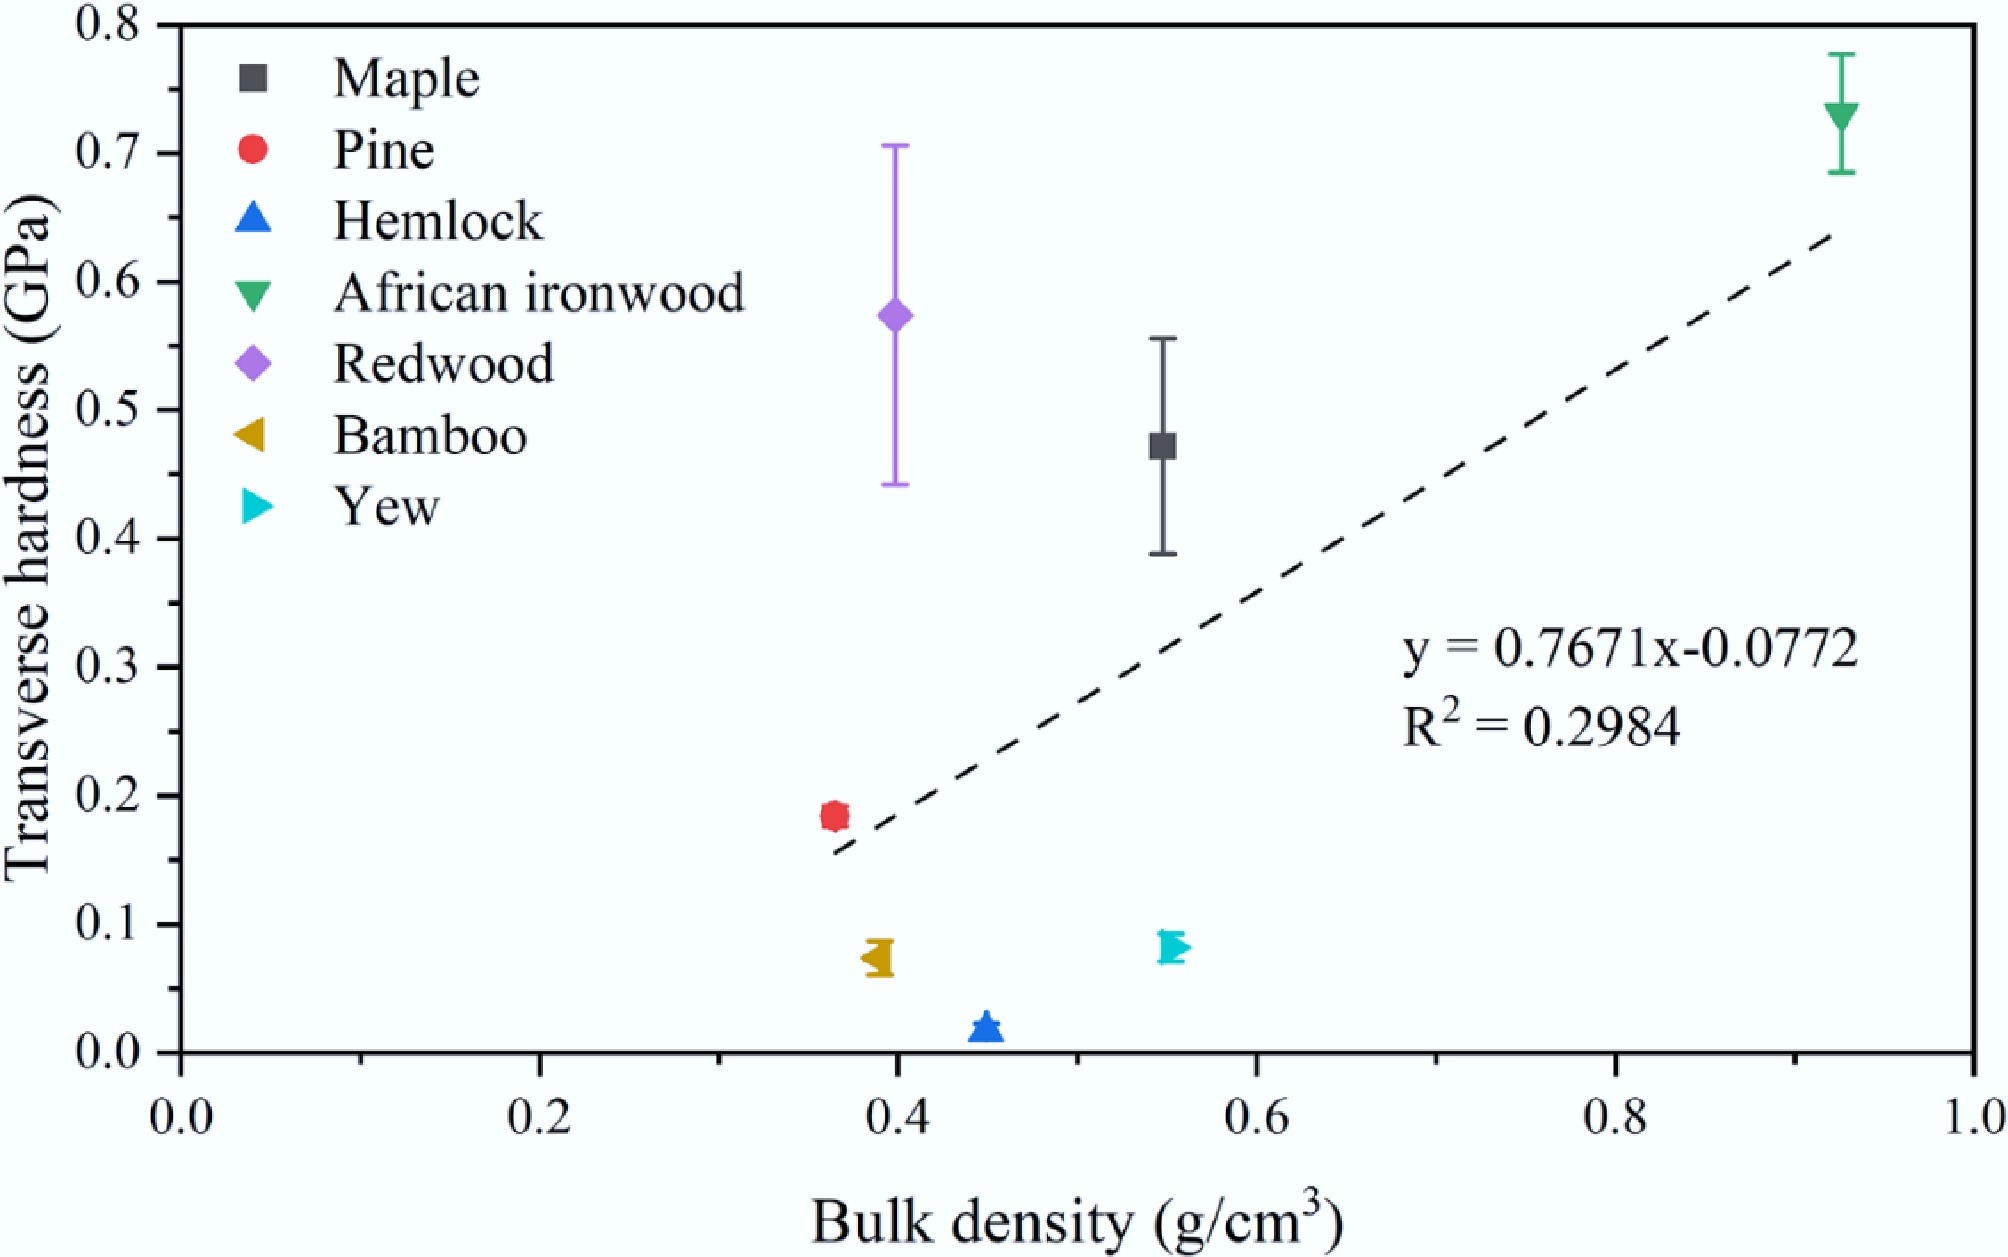
Figure 4.
Relationship between transverse hardness and bulk density of biochar for different species produced at 1,000 °C.
-
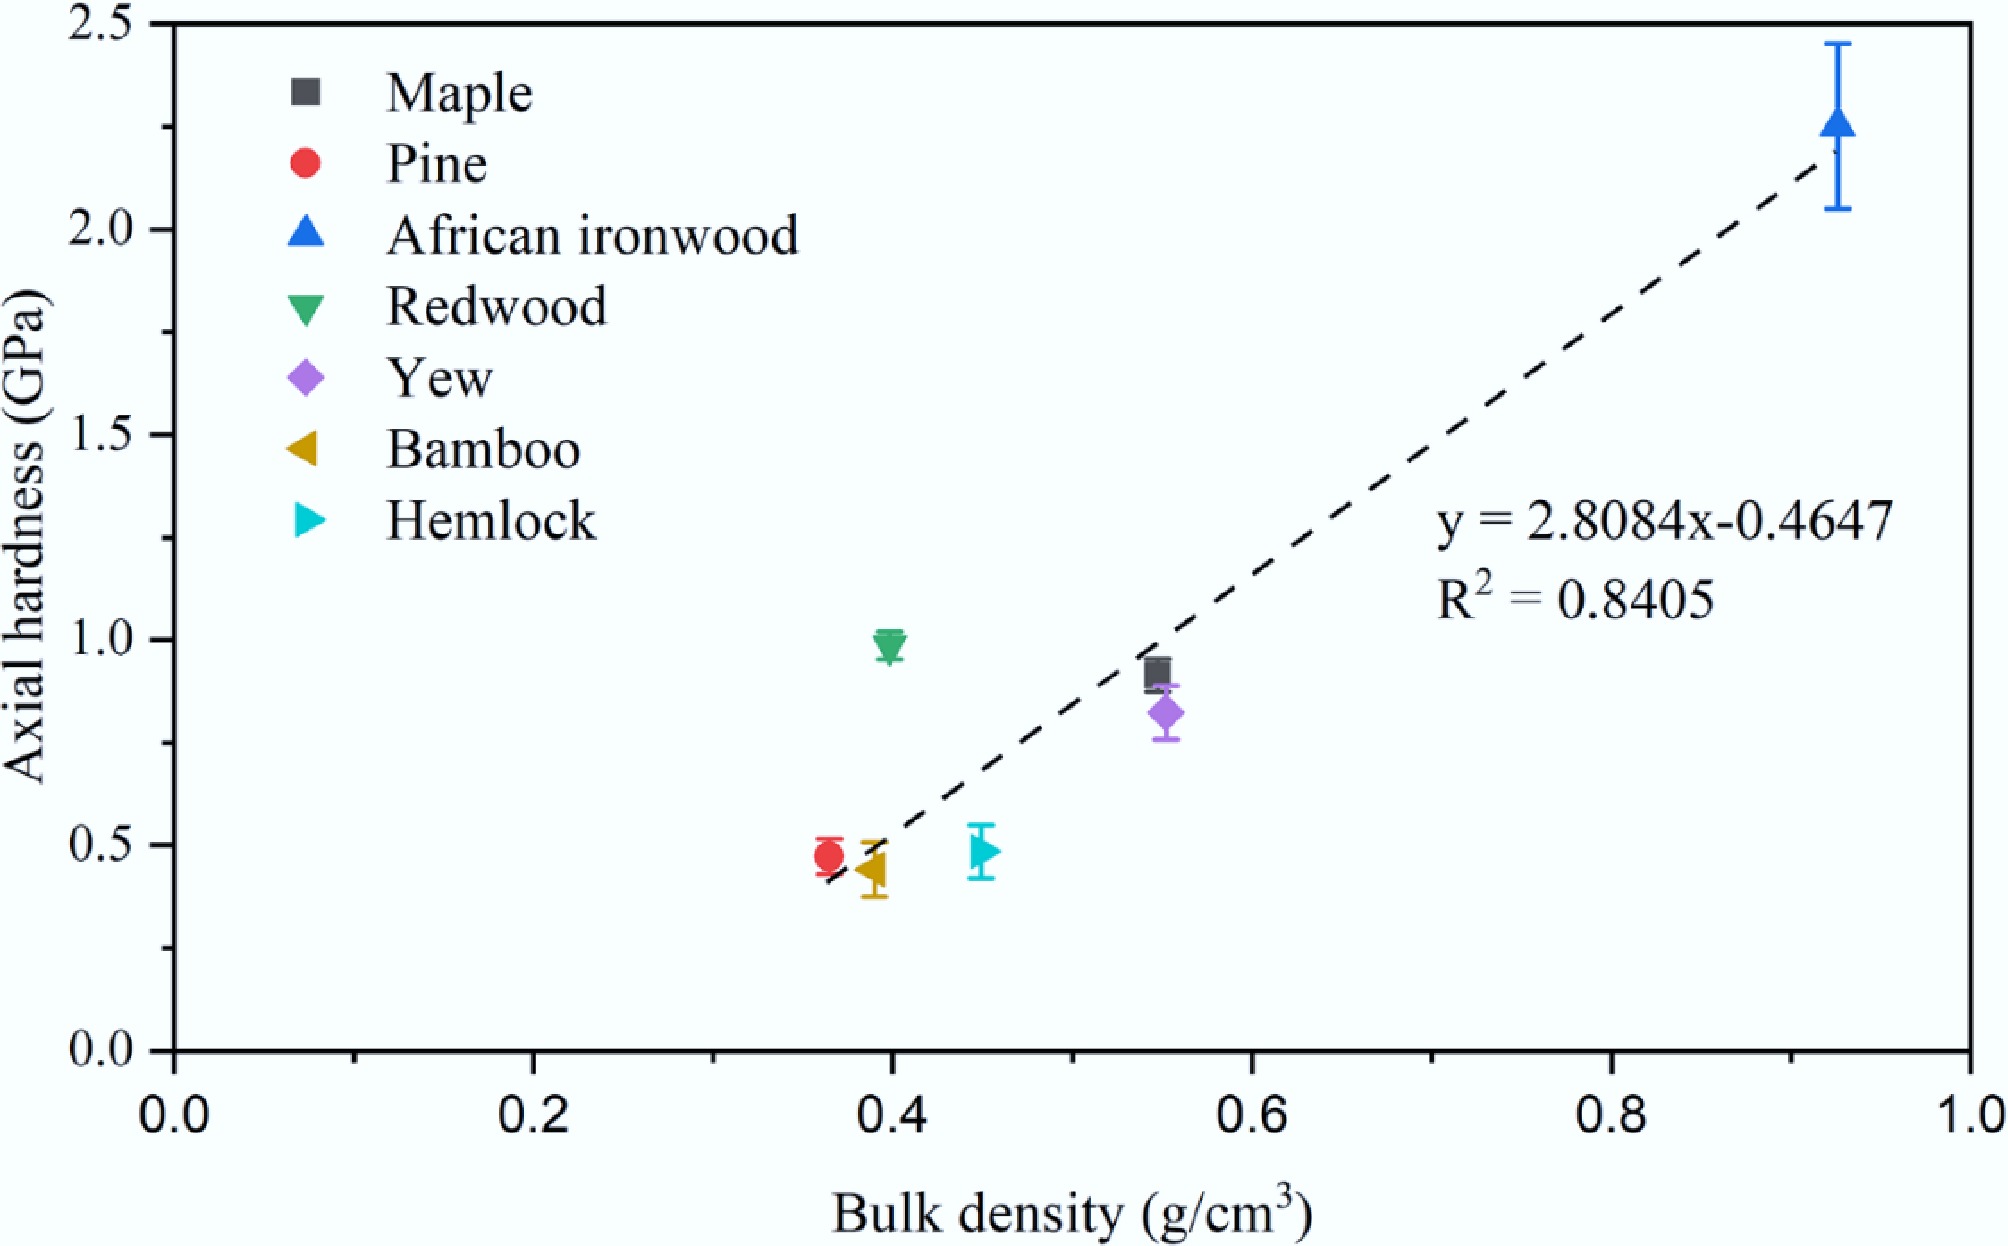
Figure 5.
Relationship between axial hardness and bulk density of biochar for different species produced at 1,000 °C.
-
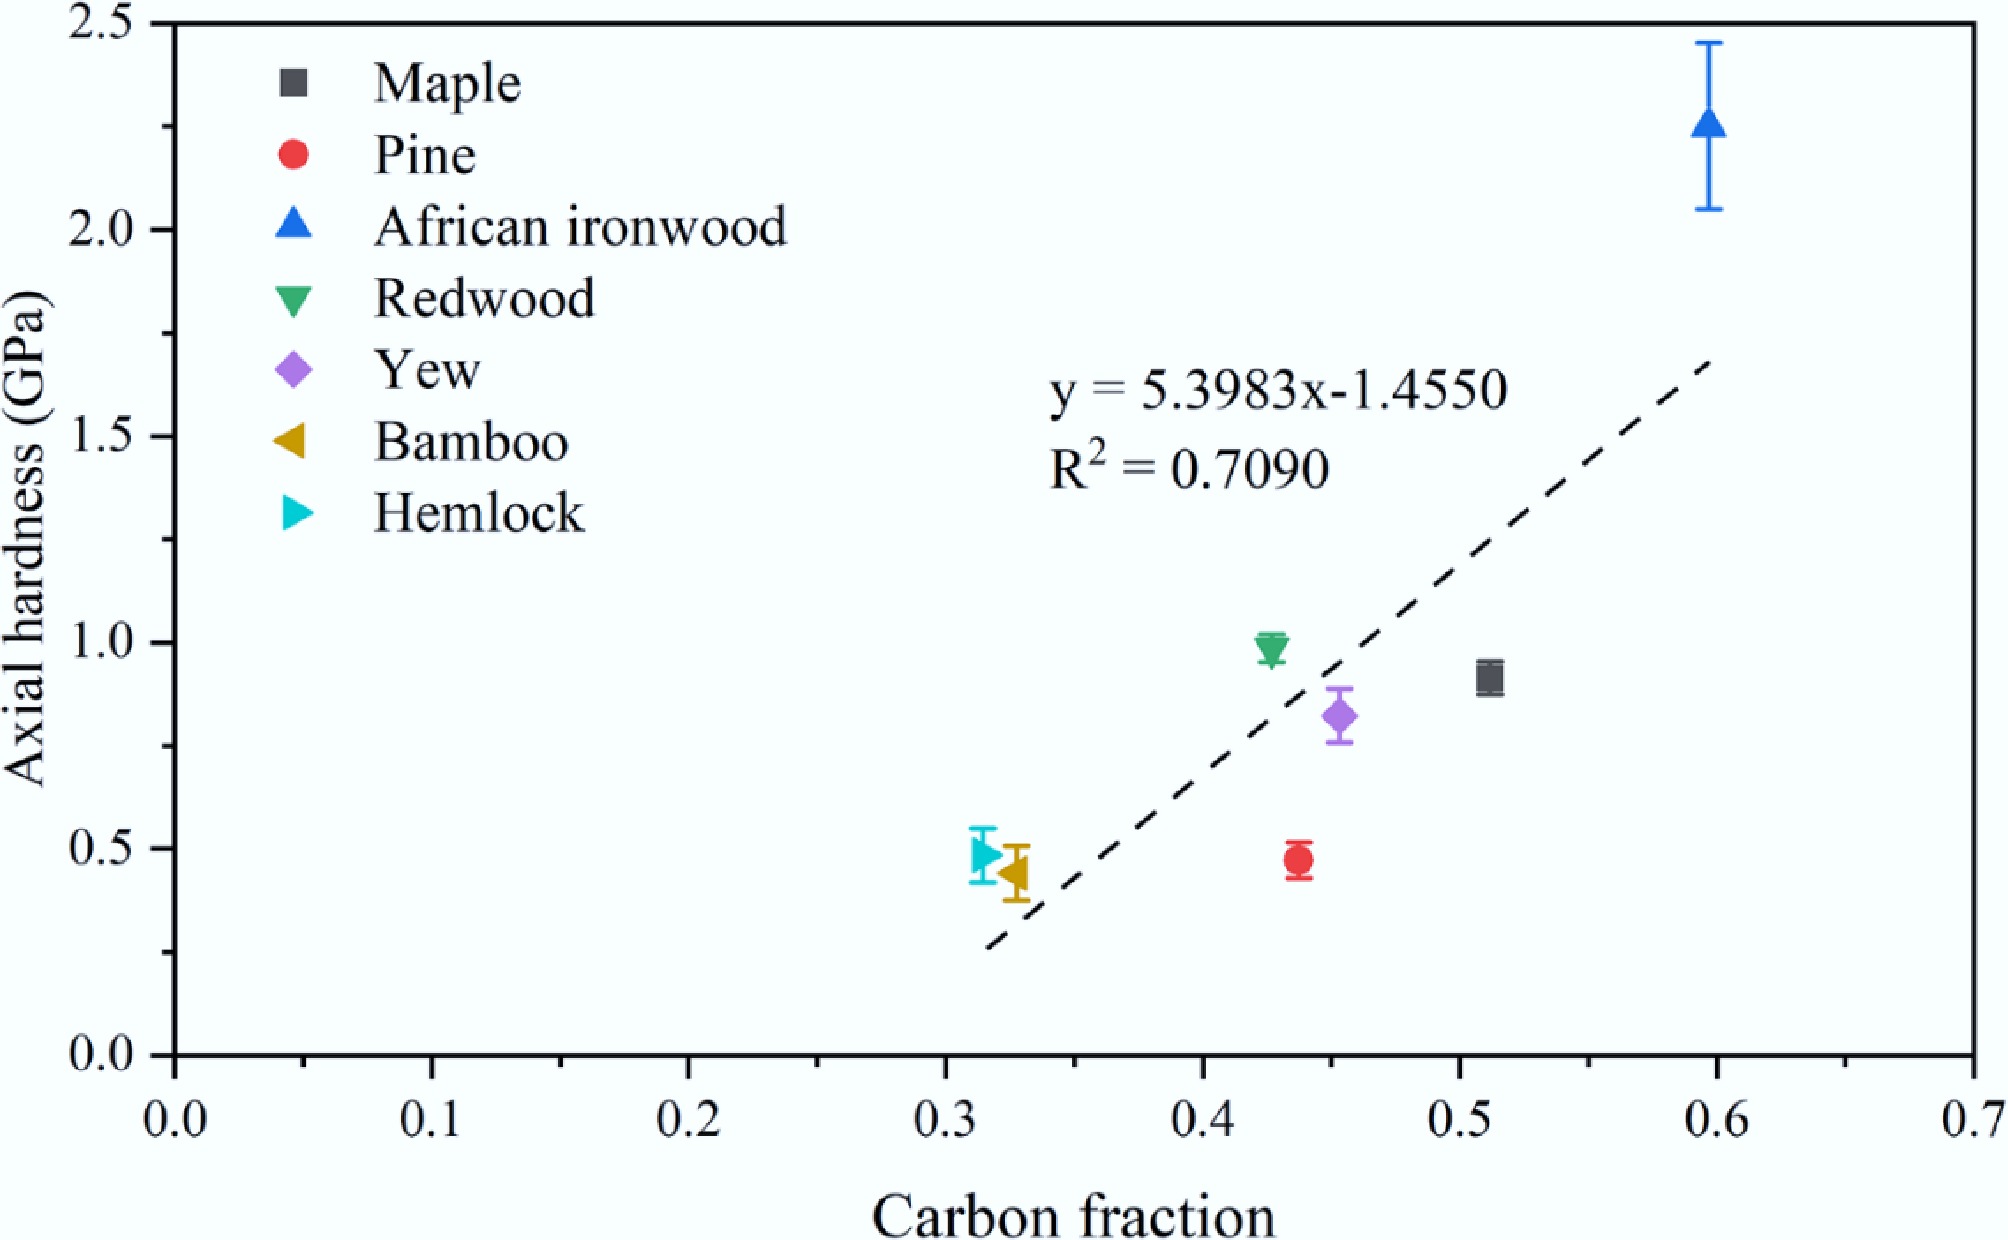
Figure 6.
Axial hardness of biochar pyrolyzed at 1,000 °C vs carbon fraction.
-
Parameter Uncertainty source Mitigation Magnitude Micro-indentation Epoxy infiltration Vacuum impregnation + SEM exclusion ΔHV ≈ 0.116 GPa Nano-indentation Surface roughness Calibration of indentation positions + low indentation depth ± 3% Orientation Cutting angle deviation Sample preparation + surface parallelism check (optical) < 5° Carbon fraction SEM threshold sensitivity Multi-operator validation ± 5% RSD Statistical significance (p < 0.05) was assessed via ANOVA in OriginPro 2023. Table 1.
Uncertainty management for various types of tests
-
Sample Temperature
(°C)Transverse
hardness (GPa)Axial hardness
(GPa)Maple 600 0.246 ± 0.029 0.251 ± 0.047 800 0.364 ± 0.042 0.443 ± 0.058 1,000 0.472 ± 0.084 0.914 ± 0.040 Pine 600 0.086 ± 0.002 0.121 ± 0.019 800 0.096 ± 0.012 0.279 ± 0.029 1,000 0.184 ± 0.008 0.473 ± 0.043 Table 2.
Hardness of maple and pine biochar produced at 600, 800, and 1,000 °C in axial and transverse directions from micro-indentation testing
-
Wood species Axial hardness
(GPa)Transverse
hardness (GPa)Anisotropy
(A/T)African ironwood 2.251 ± 0.201 0.731 ± 0.046 3.08 Redwood 0.987 ± 0.034 0.574 ± 0.132 1.72 Maple 0.914 ± 0.040 0.472 ± 0.084 1.94 Yew 0.823 ± 0.065 0.082 ± 0.011 10.04 Pine 0.473 ± 0.043 0.184 ± 0.008 2.57 Bamboo 0.441 ± 0.066 0.074 ± 0.013 5.96 Hemlock 0.485 ± 0.065 0.017 ± 0.006 28.53 Table 3.
Hardness of biochar in axial and transverse directions for different wood species pyrolyzed at 1,000 °C
-
Species Pyrolysis
temperature (°C)Bulk density (g/cm3) Wood density (g/cm3) Maple 600 0.4125 0.78 800 0.4423 1,000 0.5474 Pine 600 0.3002 0.41 800 0.3509 600 Pine 1,000 0.3647 African ironwood 1,000 0.9260 1.35 Redwood 1,000 0.3983 0.68 Yew 1,000 0.5521 0.72 Bamboo 1,000 0.3898 0.76 Hemlock 1,000 0.4490 0.55 Table 4.
Bulk density of different wood biochar under different pyrolysis temperature
-
Biochar species Carbon fraction African ironwood 0.5967 Maple 0.5116 Yew 0.4532 Pine 0.4373 Redwood 0.4268 Bamboo 0.3274 Hemlock 0.3144 Table 5.
Summarized carbon fraction of different biochar species
-
Species Pyrolysis
temperature (°C)Axial hardness
(GPa)Transverse
hardness (GPa)Maple 1,000 4.04 ± 0.16 − Pine 1,000 4.41 ± 0.05 4.38 ± 0.71 Bamboo 1,000 − 3.64 ± 0.52 Table 6.
Intrinsic hardness measured using nano-indentation technique for maple, pine, and bamboo biochar created at 1,000 °C
Figures
(6)
Tables
(6)