-
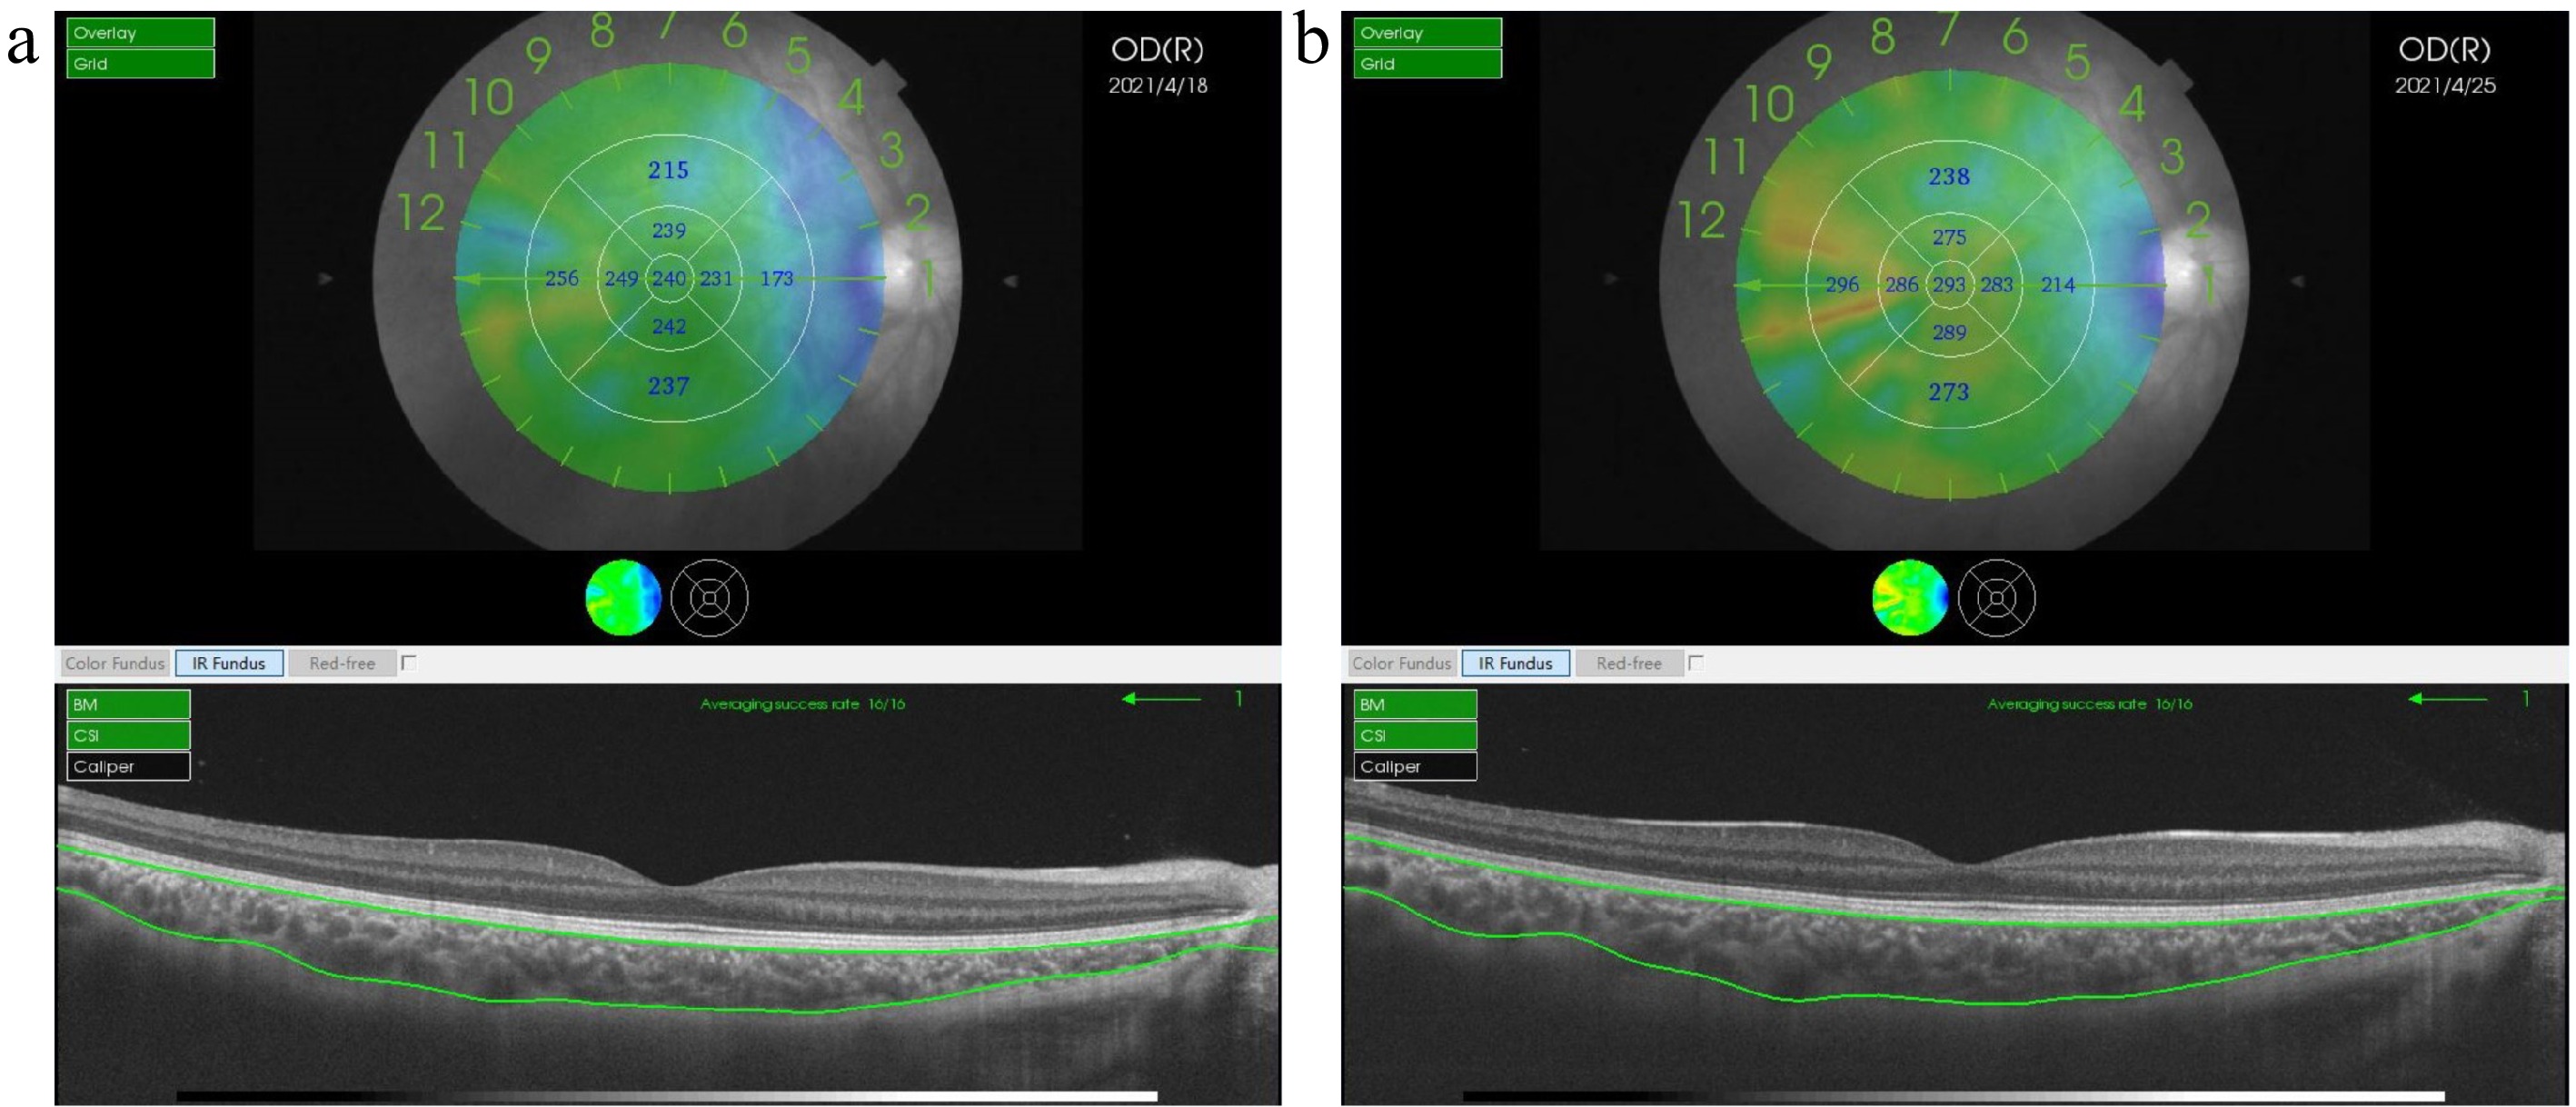
Figure 1.
Choroidal thickness measurements using swept-source optical coherence tomography. (a) Baseline choroidal imaging. (b) Post-atropine choroidal imaging. Representative images show a cross-sectional B-scan (below) with automated choroidal segmentation (green outline) and an en-face view (above) with the Early Treatment Diabetic Retinopathy Study (ETDRS) grid overlay. The en-face map includes an orientation scale (1–12) corresponding to the B-scan positions. Arrows indicate Orientation 1, corresponding to the B-scan displayed below. Subfoveal choroidal thickness was measured vertically at the foveal center. Parafoveal choroidal thickness was calculated as the average of measurements in the four quadrants of the 3- mm diameter ETDRS ring. A color-coded thickness map on the ETDRS grid shows the distribution of choroidal thicknesses (warmer colors indicate thicker areas).
-
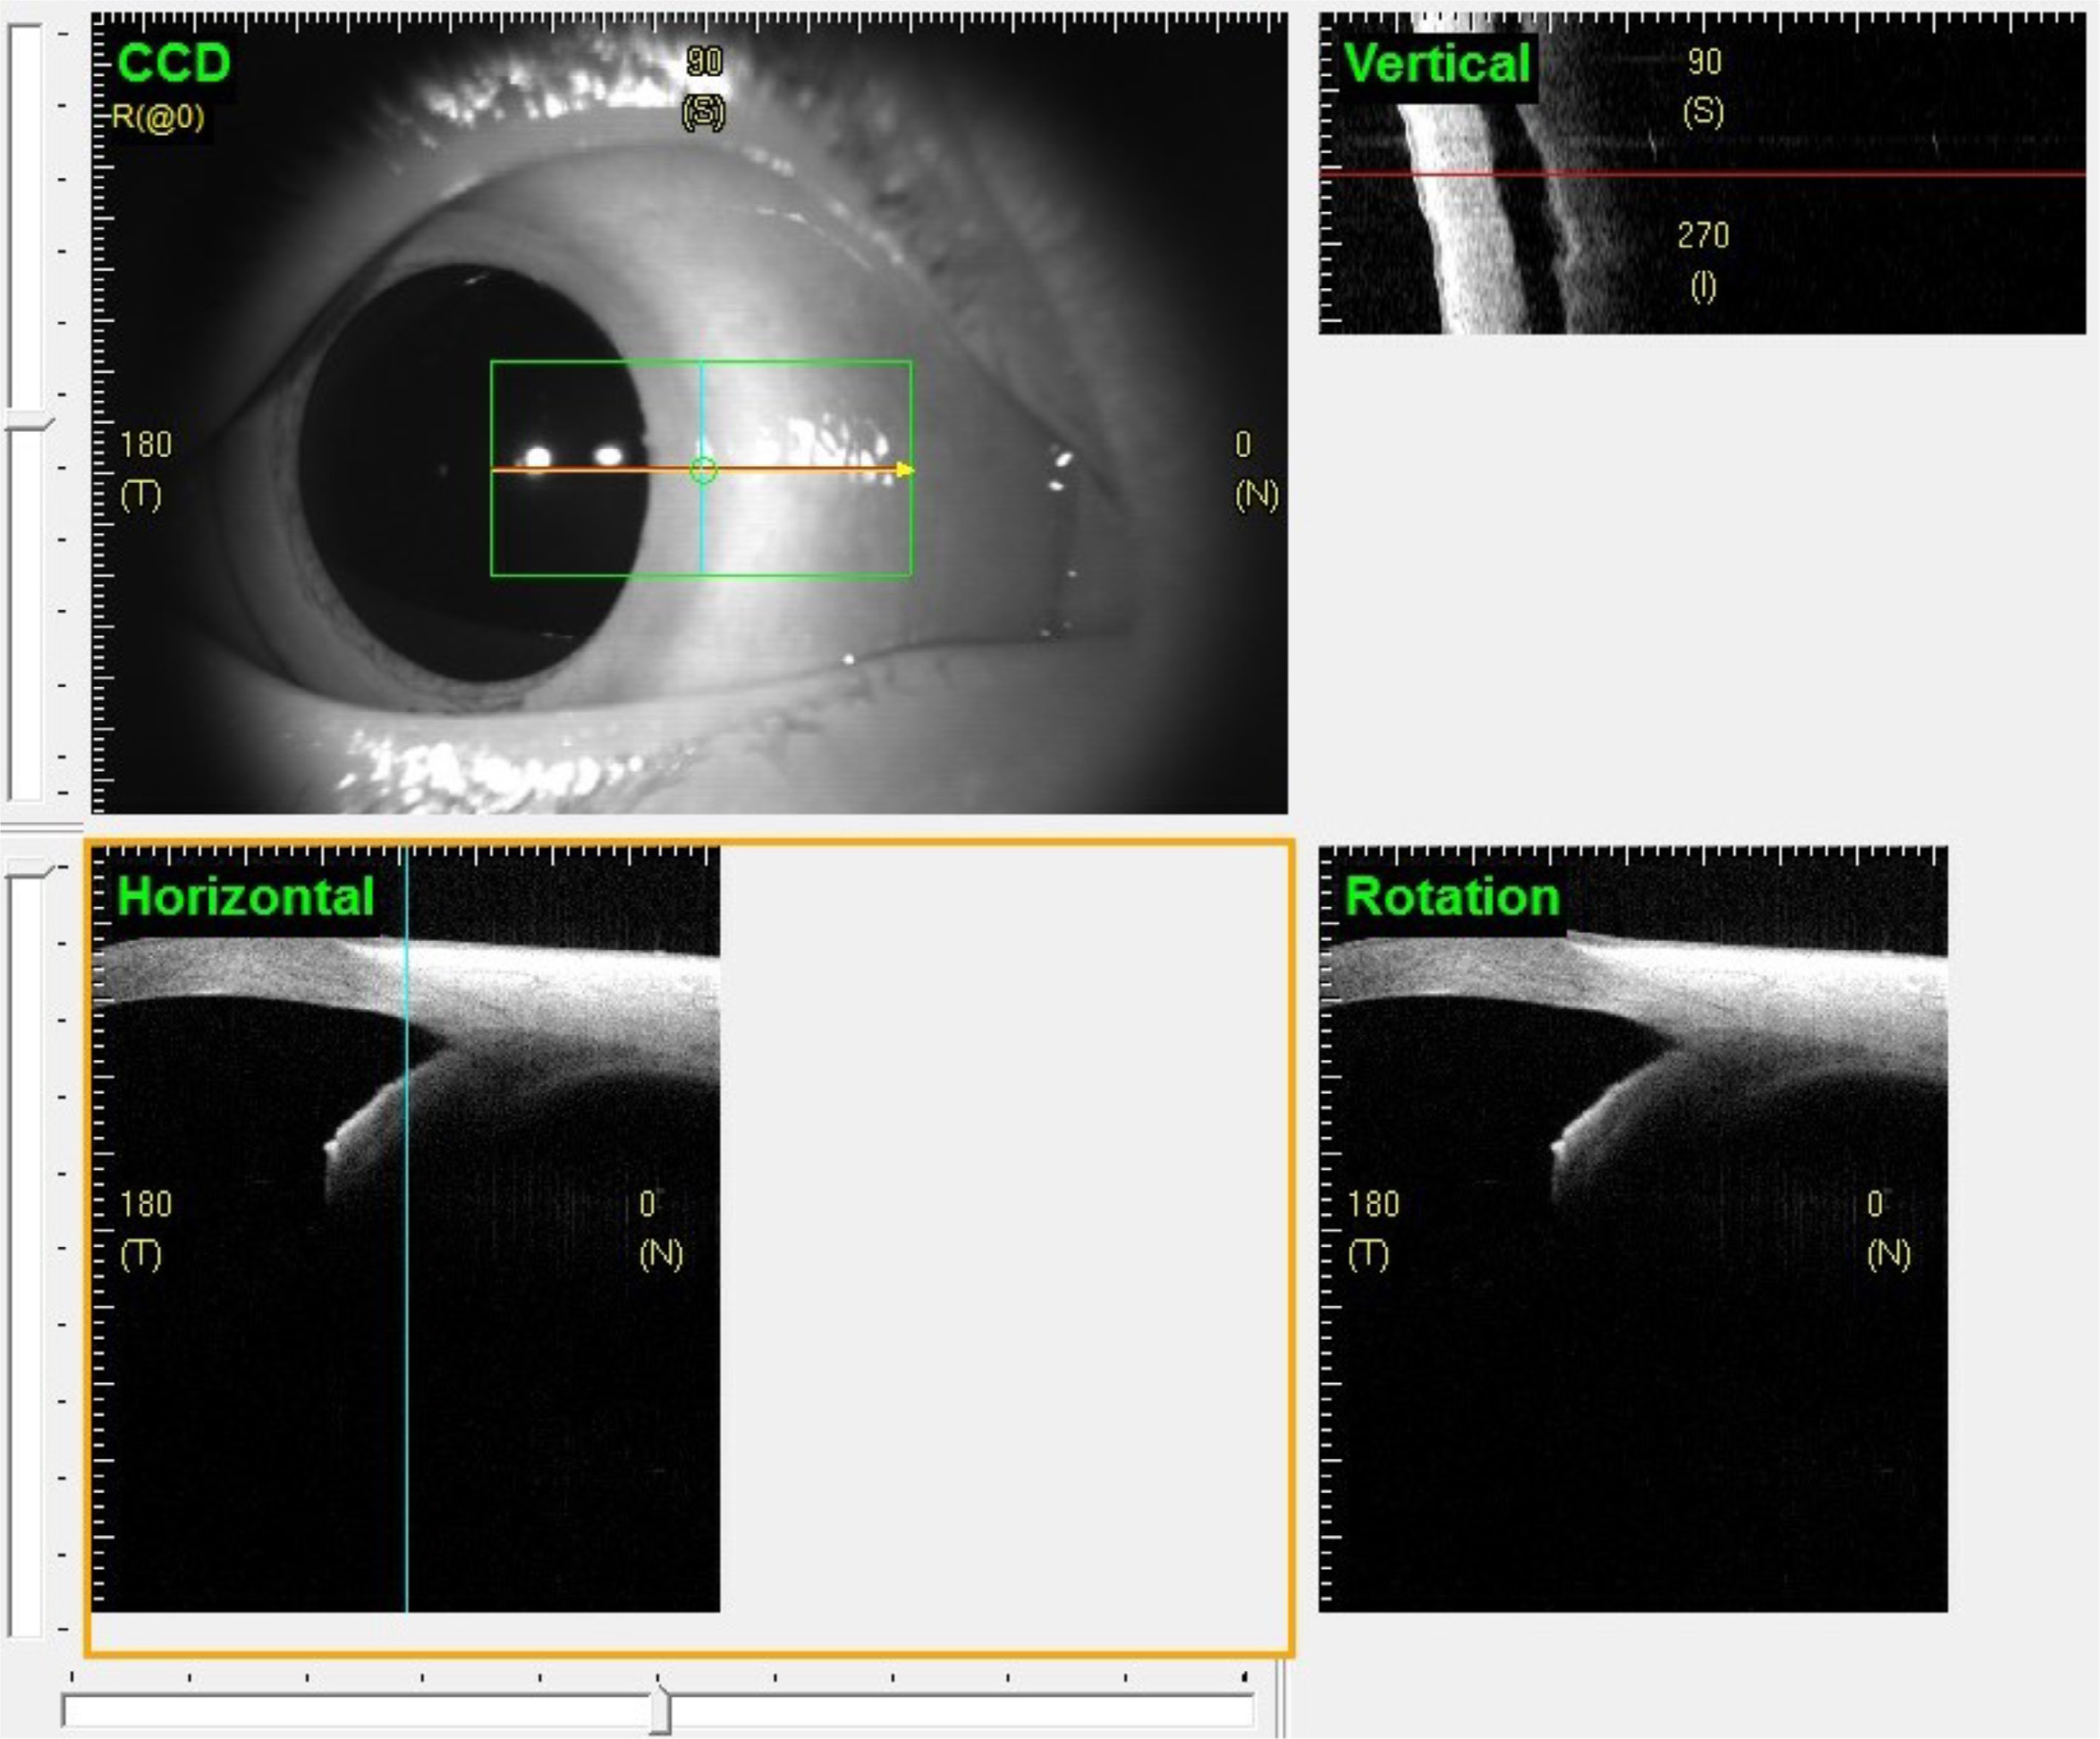
Figure 2.
Imaging plane selection protocol for measuring ciliary muscles using anterior segment OCT (AS-OCT). Upper left: External view showing eye positioning with the fixation target at 55° and 30 cm from the central axis of the device, while maintaining the chin and head at 0°. The green selection box indicates the AS-OCT scan area. There are three lines in the green selection box; the cyan vertical line can move horizontally, and the red horizontal line can move vertically. The yellow rotation line can be rotated around the intersection of the horizontal and vertical lines. A suitable plane can be selected by adjusting the lines' positions. In this image, the rotation line is hidden behind the horizontal line (the rotation angle is 0°). Upper right: Vertical cross-section corresponding to the cyan line's position. Lower left: Horizontal cross-section corresponding to the red line's position. Lower right: Rotational cross-section corresponding to the yellow rotation line's position.
-
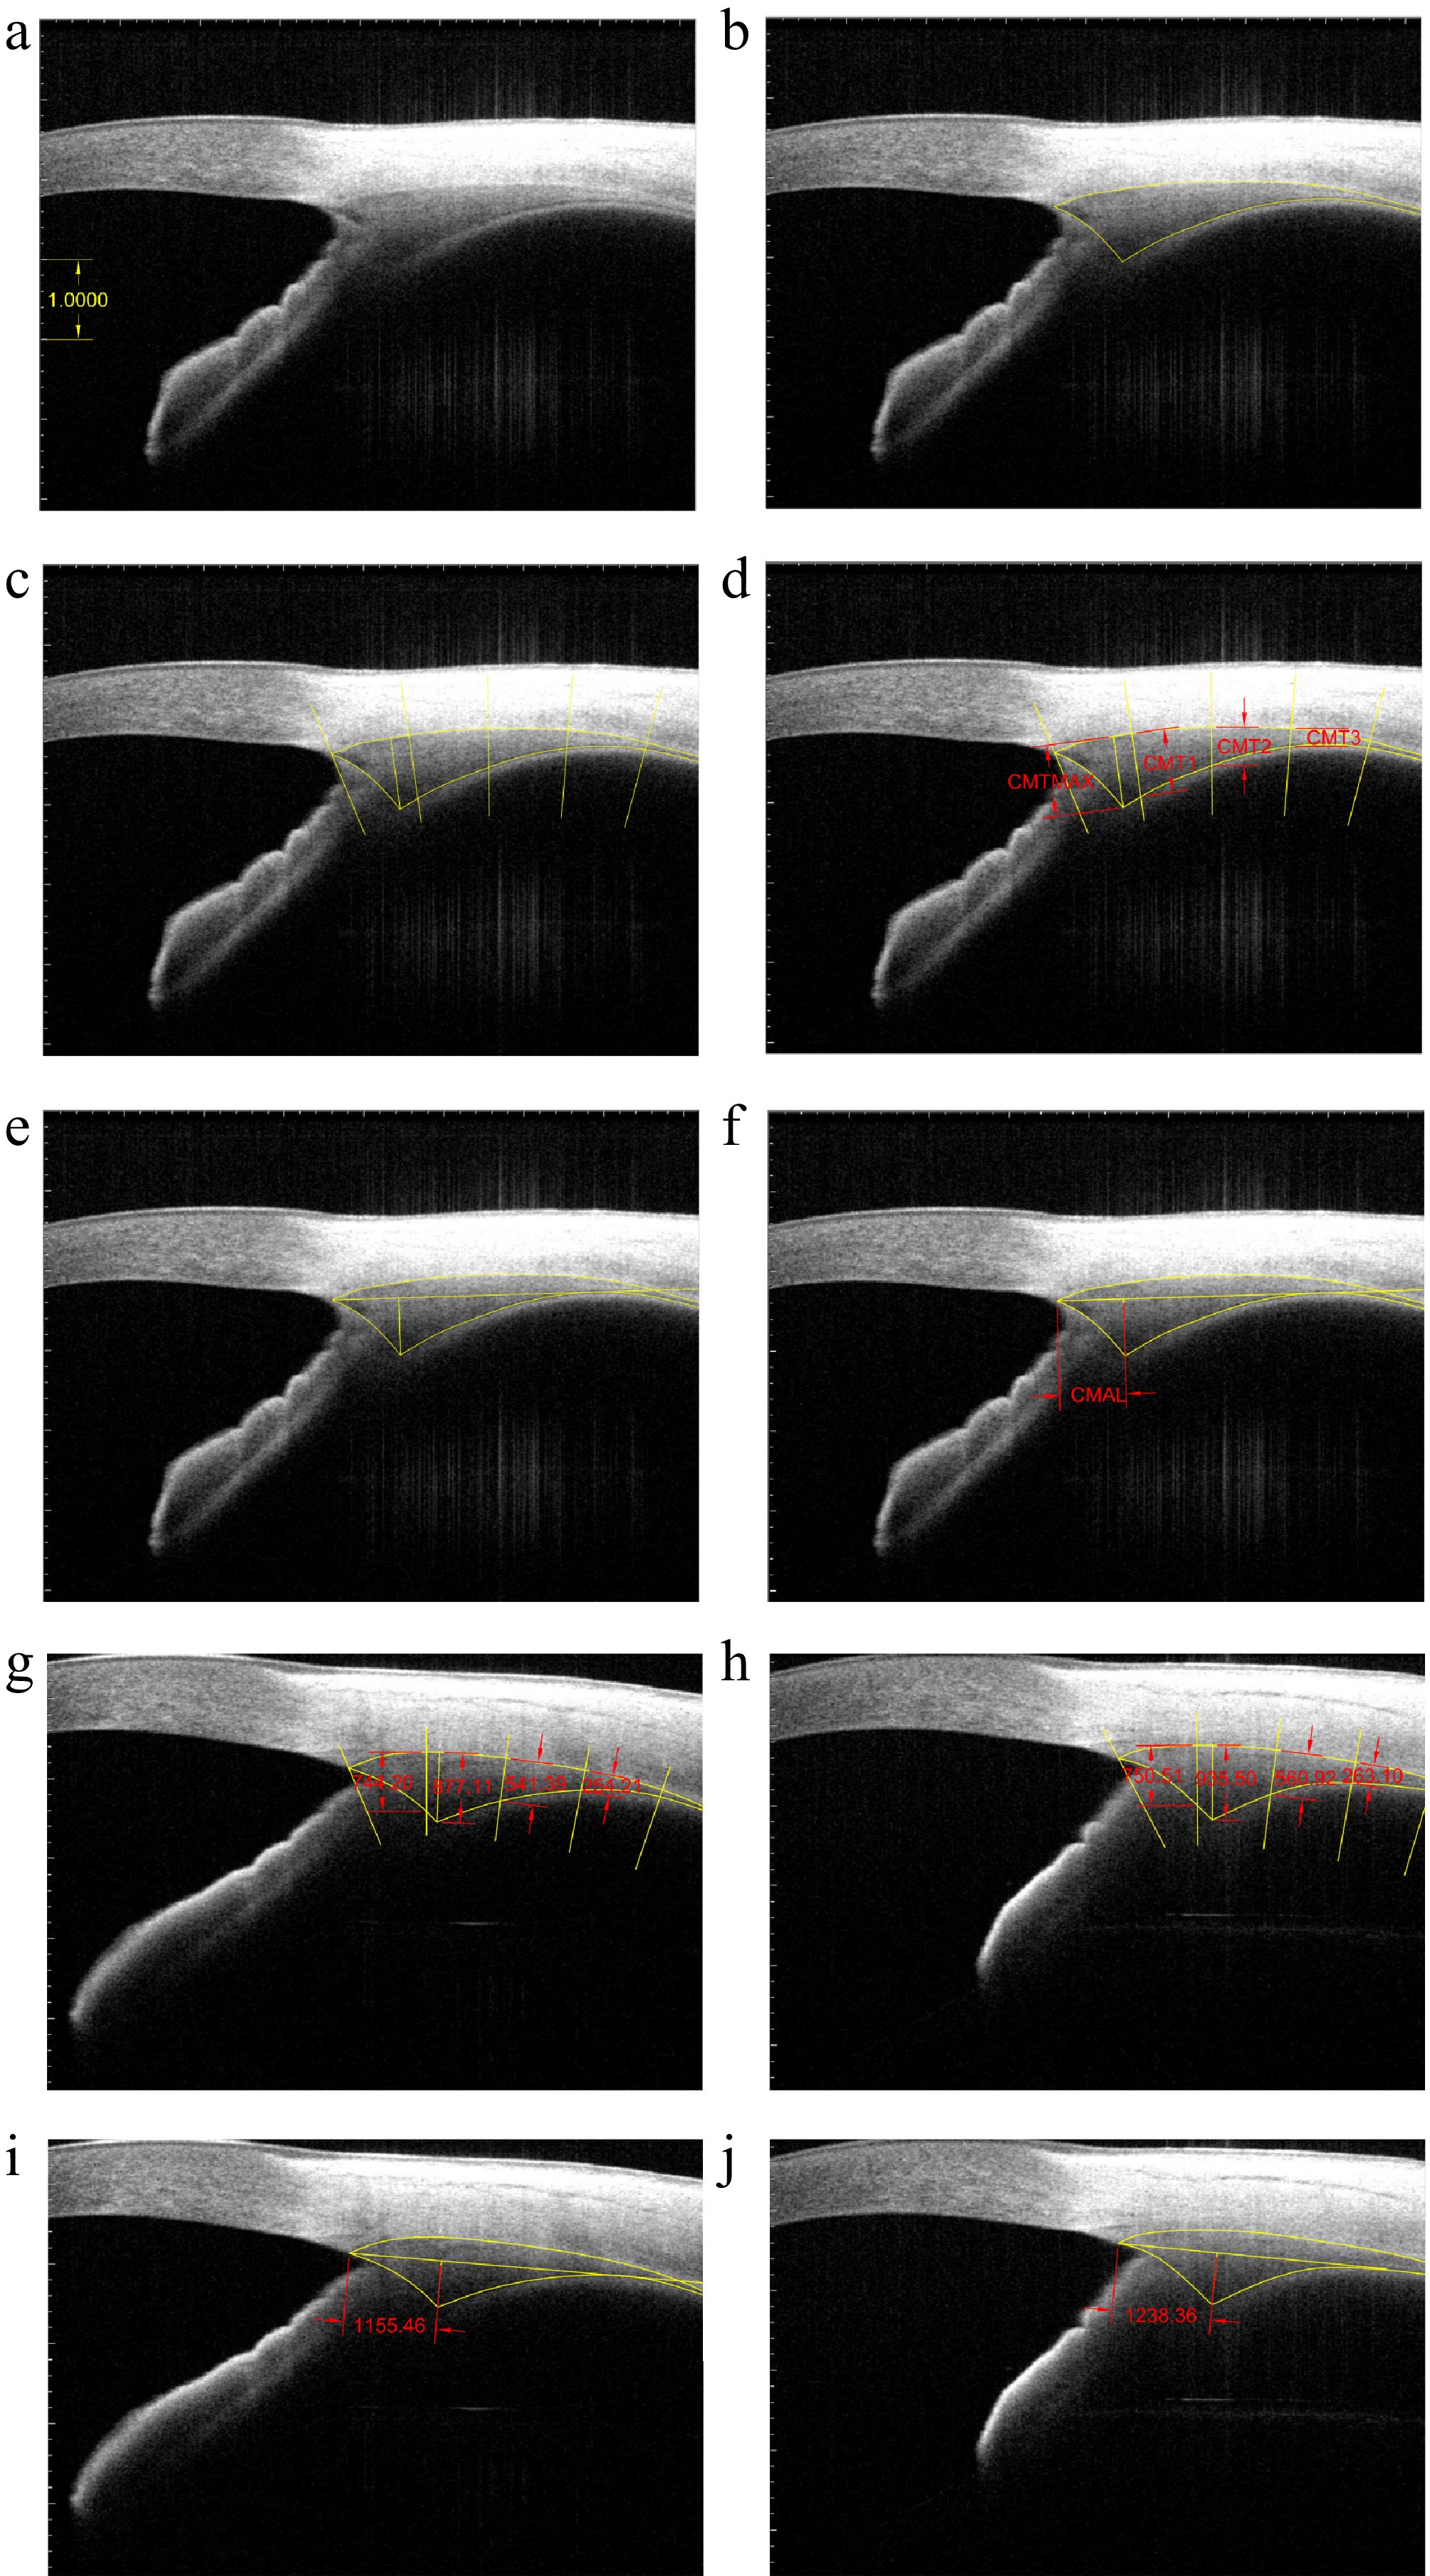
Figure 3.
Measurement of ciliary muscle parameters using anterior segment optical coherence tomography. (a) An internal 1-mm ruler was used for calibration (white scale bar). (b) Contouring: Manual tracing of the ciliary muscle's contour (yellow curves). (c) Thickness landmark placement: Placement of perpendicular measurement lines (yellow straight lines) at 1-mm intervals along the scleral curvature (outer ciliary muscle boundary) from the scleral spur. (d) Thickness parameters (red double arrows and red labels): Ciliary muscle thickness at 1 (CMT1), 2 (CMT2), and 3 mm (CMT3) posterior to the scleral spur (SS), and maximum thickness (CMTmax). (e) Position landmark placement: Placement of a tangent line (yellow horizontal line) along the pigmented ciliary muscle epithelium (the posterior ciliary muscle boundary). (f) Position parameter (red double arrows and red label): Distance along tangent line from the scleral spur to the foot of the perpendicular from CMTmax point was regarded as the CMAL. (g) Baseline thickness parameters (red text). (h) Thickness parameters after atropine treatment (red text). (i) Baseline position parameters (red text). (j) Position parameters after atropine treatment (red text).
-
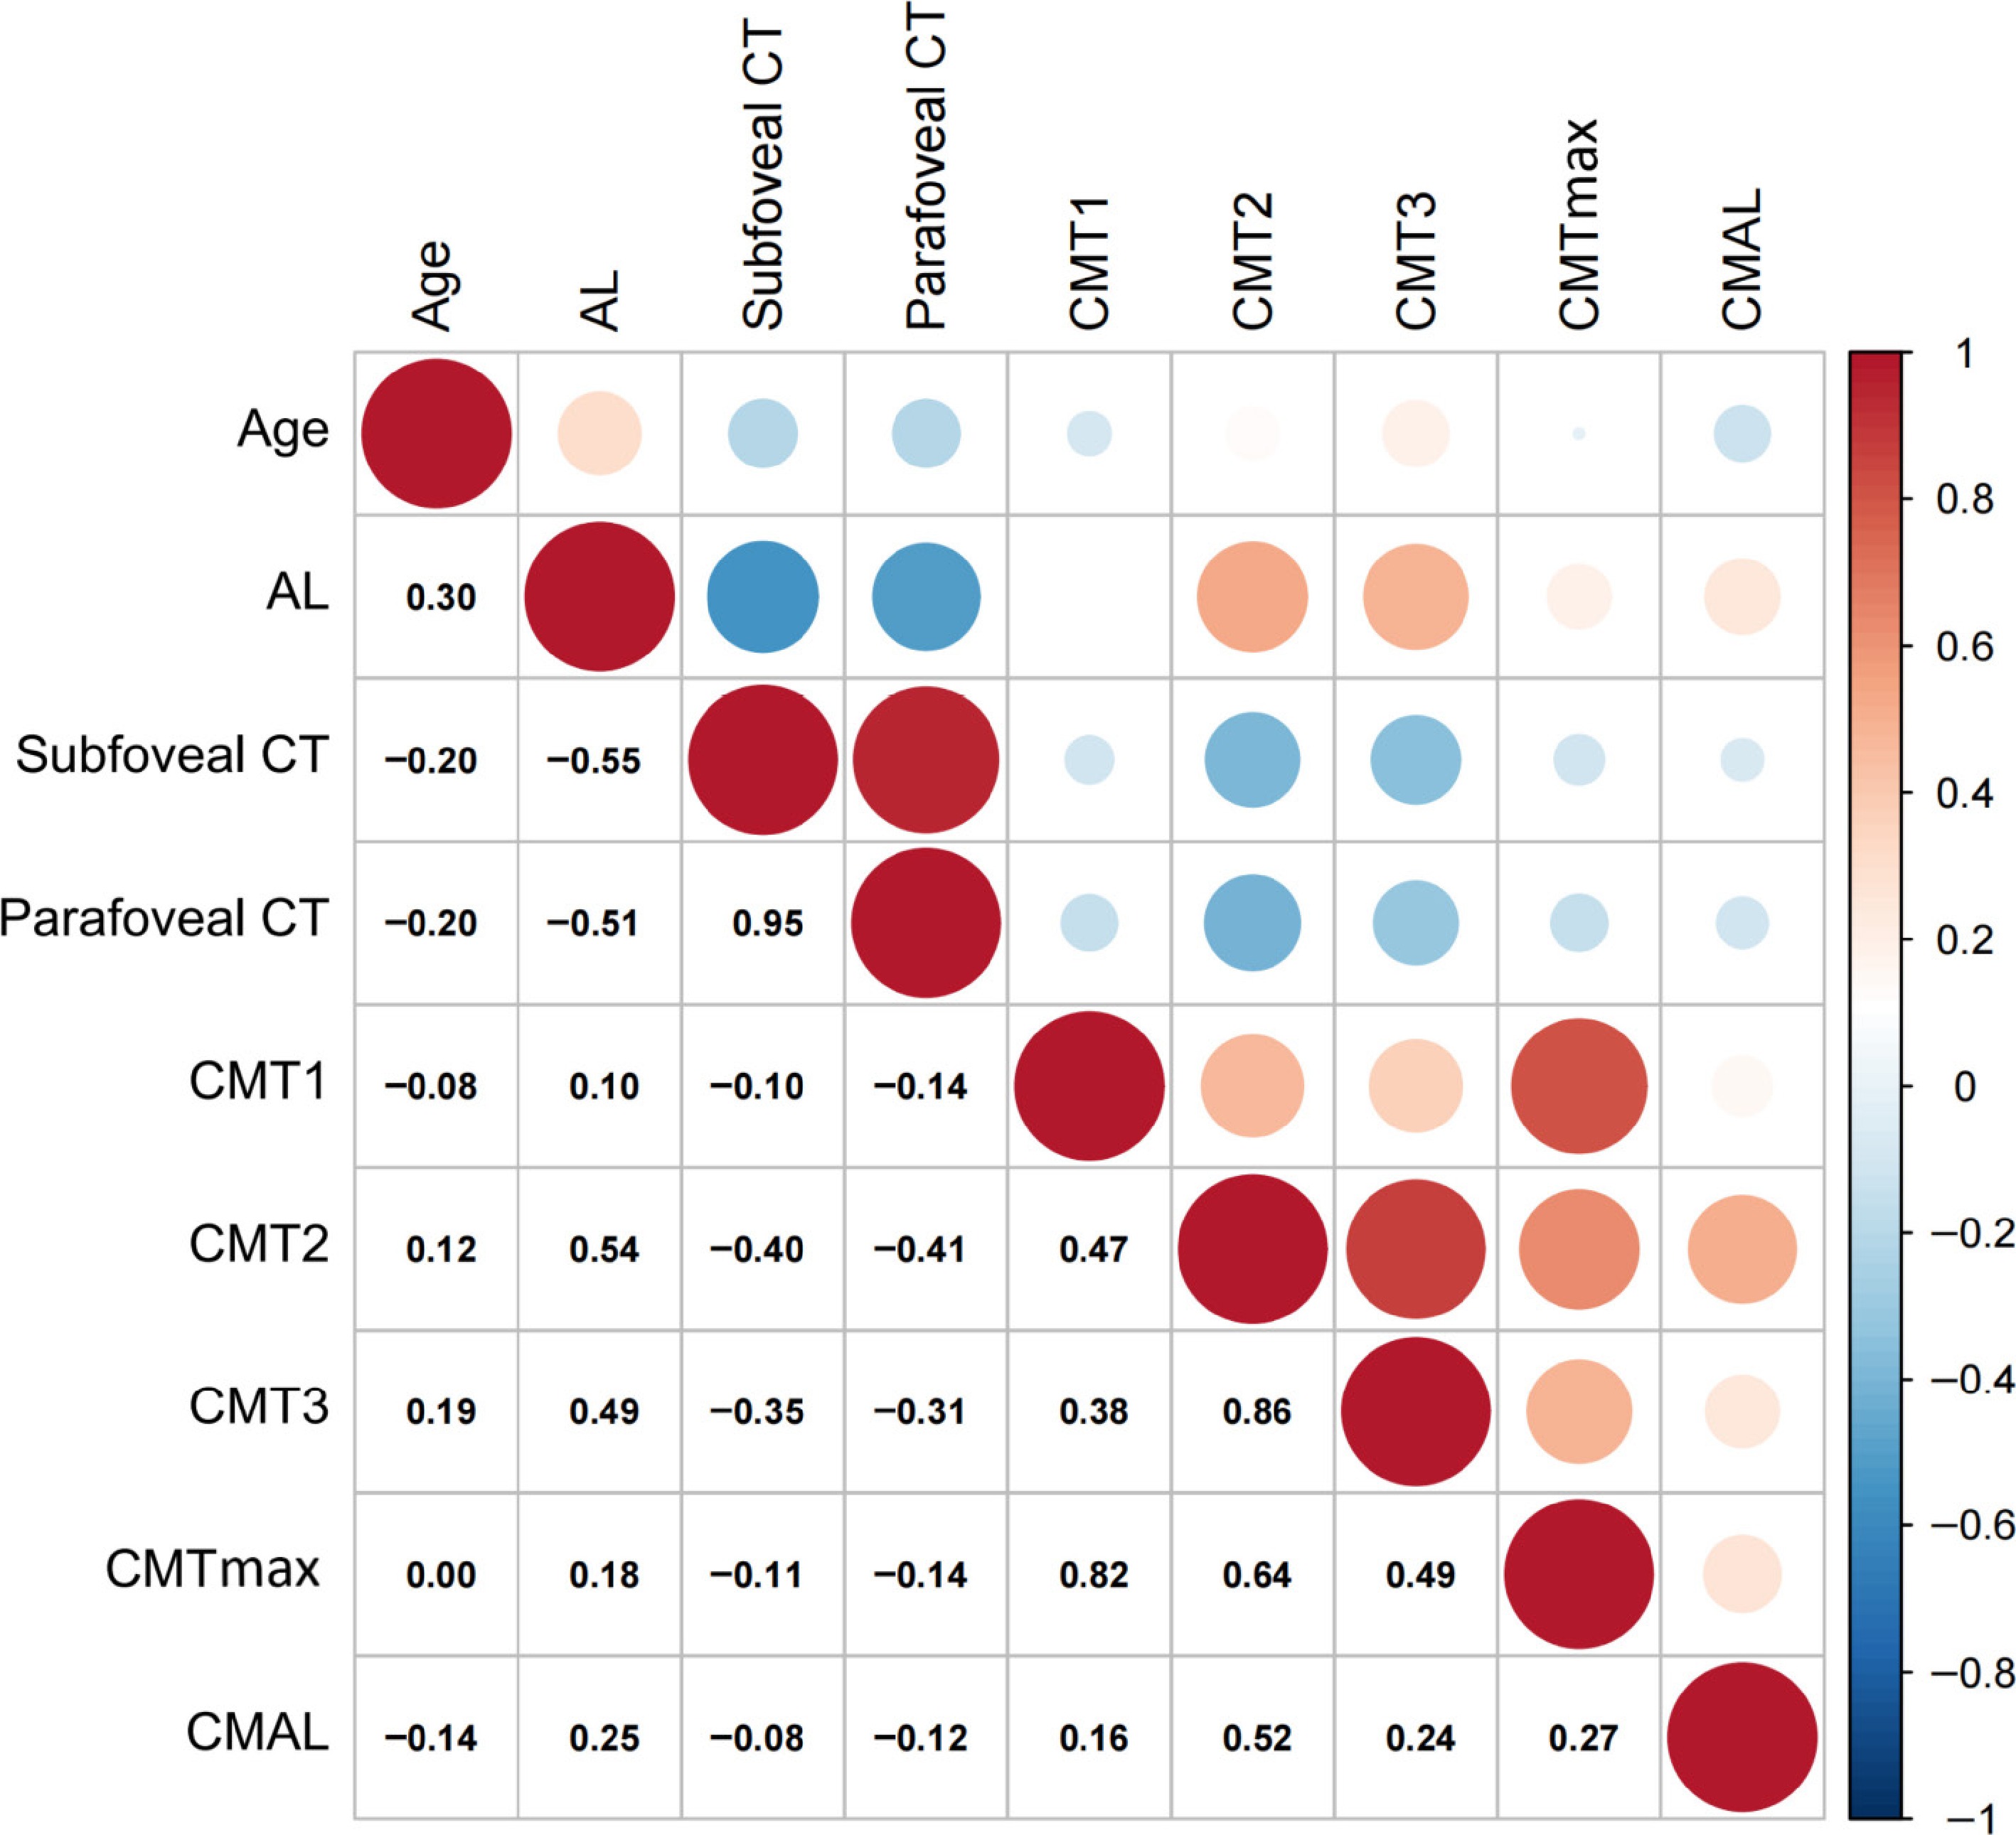
Figure 4.
Heatmap of the correlations among age, baseline anterior segment biometry, baseline choroidal thickness, and baseline ciliary muscle biometry (n = 48 eyes). The number in the grid on the lower left side of the picture is the Pearson correlation coefficient of the two parameters in the vertical and horizontal columns. The colored dots on the upper right-hand side of the picture are the correlation coefficients presented in color. The right side of the picture shows the relationship between color and correlation coefficient. Red dots represent positive correlations, and blue dots represent negative correlations. The size of the dots represents the p-value of the Pearson correlation coefficient. The larger the dot, the more significant the correlation. AL, axial length; CT, choroidal thickness; CMT1, ciliary muscle thickness at 1 mm from the scleral spur; CMT2, ciliary muscle thickness at 2 mm from the scleral spur; CMT3, ciliary muscle thickness at 3 mm from the scleral spur; CMTmax, maximum ciliary muscle thickness; CMAL, tangent length from the ciliary muscle apex to the scleral spur.
-
Myopia (n = 12) Emmetropia (n = 17) Hyperopia (n = 19) Baseline Difference Baseline Difference Baseline Difference Age (mean ± SD, years)c 6.76 ± 1.25 7.60 ± 1.53 6.86 ± 1.55 SE (median (Q1, Q3), D)d −2.13 (−3.19, −1.50)a 0.88 (0.50, 1.00)b −0.75 (−0.88, −0.50)a 0.75 (0.50, 1.00)b 1.88 (0.19, 3.50) 1.13 (1.75, 2.50)b AL (mean ± SD, mm)c 23.74 ± 0.93a −0.03 ± 0.02b 23.49 ± 0.89a −0.02 ± 0.02b 21.87 ± 1.12 −0.03 ± 0.03b ACD (mean ± SD, mm)c 3.72 ± 0.28a 0.10 ± 0.04b 3.65 ± 0.23a 0.13 ± 0.07b 3.29 ± 0.23 0.30 ± 0.15b Subfoveal CT (mean ± SD, μm)c 244.33 ± 34.46a 29.67 ± 40.08b 240.29 ± 44.28a 18.06 ± 26.28b 291.00 ± 48.11 0.16 ± 38.98 Parafoveal CT (mean ± SD, μm)c 239.00 ± 32.98a 21.73 ± 13.47b 241.18 ± 38.92a 10.74 ± 21.33 283.95 ± 42.63 2.55 ± 36.40 Table 1 lists the basic information and anterior segment biometry of the three groups. 'Baseline' refers to the parameters before atropine-induced cycloplegia, and 'Difference' represents the change in each parameter after cycloplegia compared with before treatment (positive values indicate an increase, negative values indicate a decrease). SE, spherical equivalent; Q1, Quartile 1; Q3, Quartile 3; AL, axial length; SD, standard deviation; ACD, anterior chamber depth; CT, choroidal thickness. a Significantly different compared with the hyperopic group at baseline, p < 0.05. b Significantly changed after atropine, p < 0.05. c Normally distributed data represented by the mean ± SD; the paired t-test was used to test the differences before and after cycloplegia. d Skewed distribution data represented by the median (Q1, Q3); the Wilcoxon test was used to test the differences before and after cycloplegia. Table 1.
Anterior segment biometry before and after 1% atropine treatment in myopic, emmetropic, and hyperopic children.
-
Myopia Emmetropia Hyperopia Baseline Difference Baseline Difference Baseline Difference CMT1 (mean ± SD, µm) 728.62 ± 130.93 59.58 ± 116.77 755.50 ± 126.36 133.95 ± 101.59b 751.98 ± 89.74 135.91 ± 88.05b CMT2 (mean ± SD, µm) 444.06 ± 91.77a 56.20 ± 40.10b 435.61 ± 104.38a 104.49 ± 77.94b 343.65 ± 88.57 138.36 ± 88.33b CMT3 (mean ± SD, µm) 190.51 ± 56.88a 49.60 ± 38.98b 187.95 ± 51.16a 64.79 ± 61.20b 134.45 ± 49.24 97.29 ± 53.91b CMTmax (mean ± SD, µm) 864.15 ± 84.00 36.73 ± 83.70 838.81 ± 106.84 133.95 ± 90.34b 845.48 ± 110.74 112.45 ± 71.82b CMAL (mean ± SD, µm) 822.50 ± 181,62 131.67 ± 162.47b 774.71 ± 153.59 215.88 ± 180.70b 750.59 ± 117.13 102.35 ± 140.91b Table 2 lists ciliary muscle parameters at baseline and after the atropine intervention in myopic, emmetropic, and hyperopic groups. 'Baseline' refers to the parameters before atropine-induced cycloplegia, and 'Difference' represents the change in each parameter after cycloplegia compared with before the treatment (positive values indicate an increase; negative values indicate a decrease). Ciliary muscle parameters are represented by the mean ± SD, and the paired t-test was used to test the differences before and after cycloplegia. CMT1, ciliary muscle thickness at 1 mm from the scleral spur; SD, standard deviation; CMT2, ciliary muscle thickness at 2 mm from the scleral spur; CMT3, ciliary muscle thickness at 3 mm from the scleral spur; CMTmax, maximum ciliary muscle thickness; CMAL, tangent length from the ciliary muscle apex to the scleral spur. a Significantly different compared with the hyperopic group at baseline, p < 0.05. b Significantly changed after atropine, p < 0.05. Table 2.
Ciliary muscle parameters before and after 1% atropine treatment in myopic, emmetropic, and hyperopic children.
Figures
(4)
Tables
(2)