-
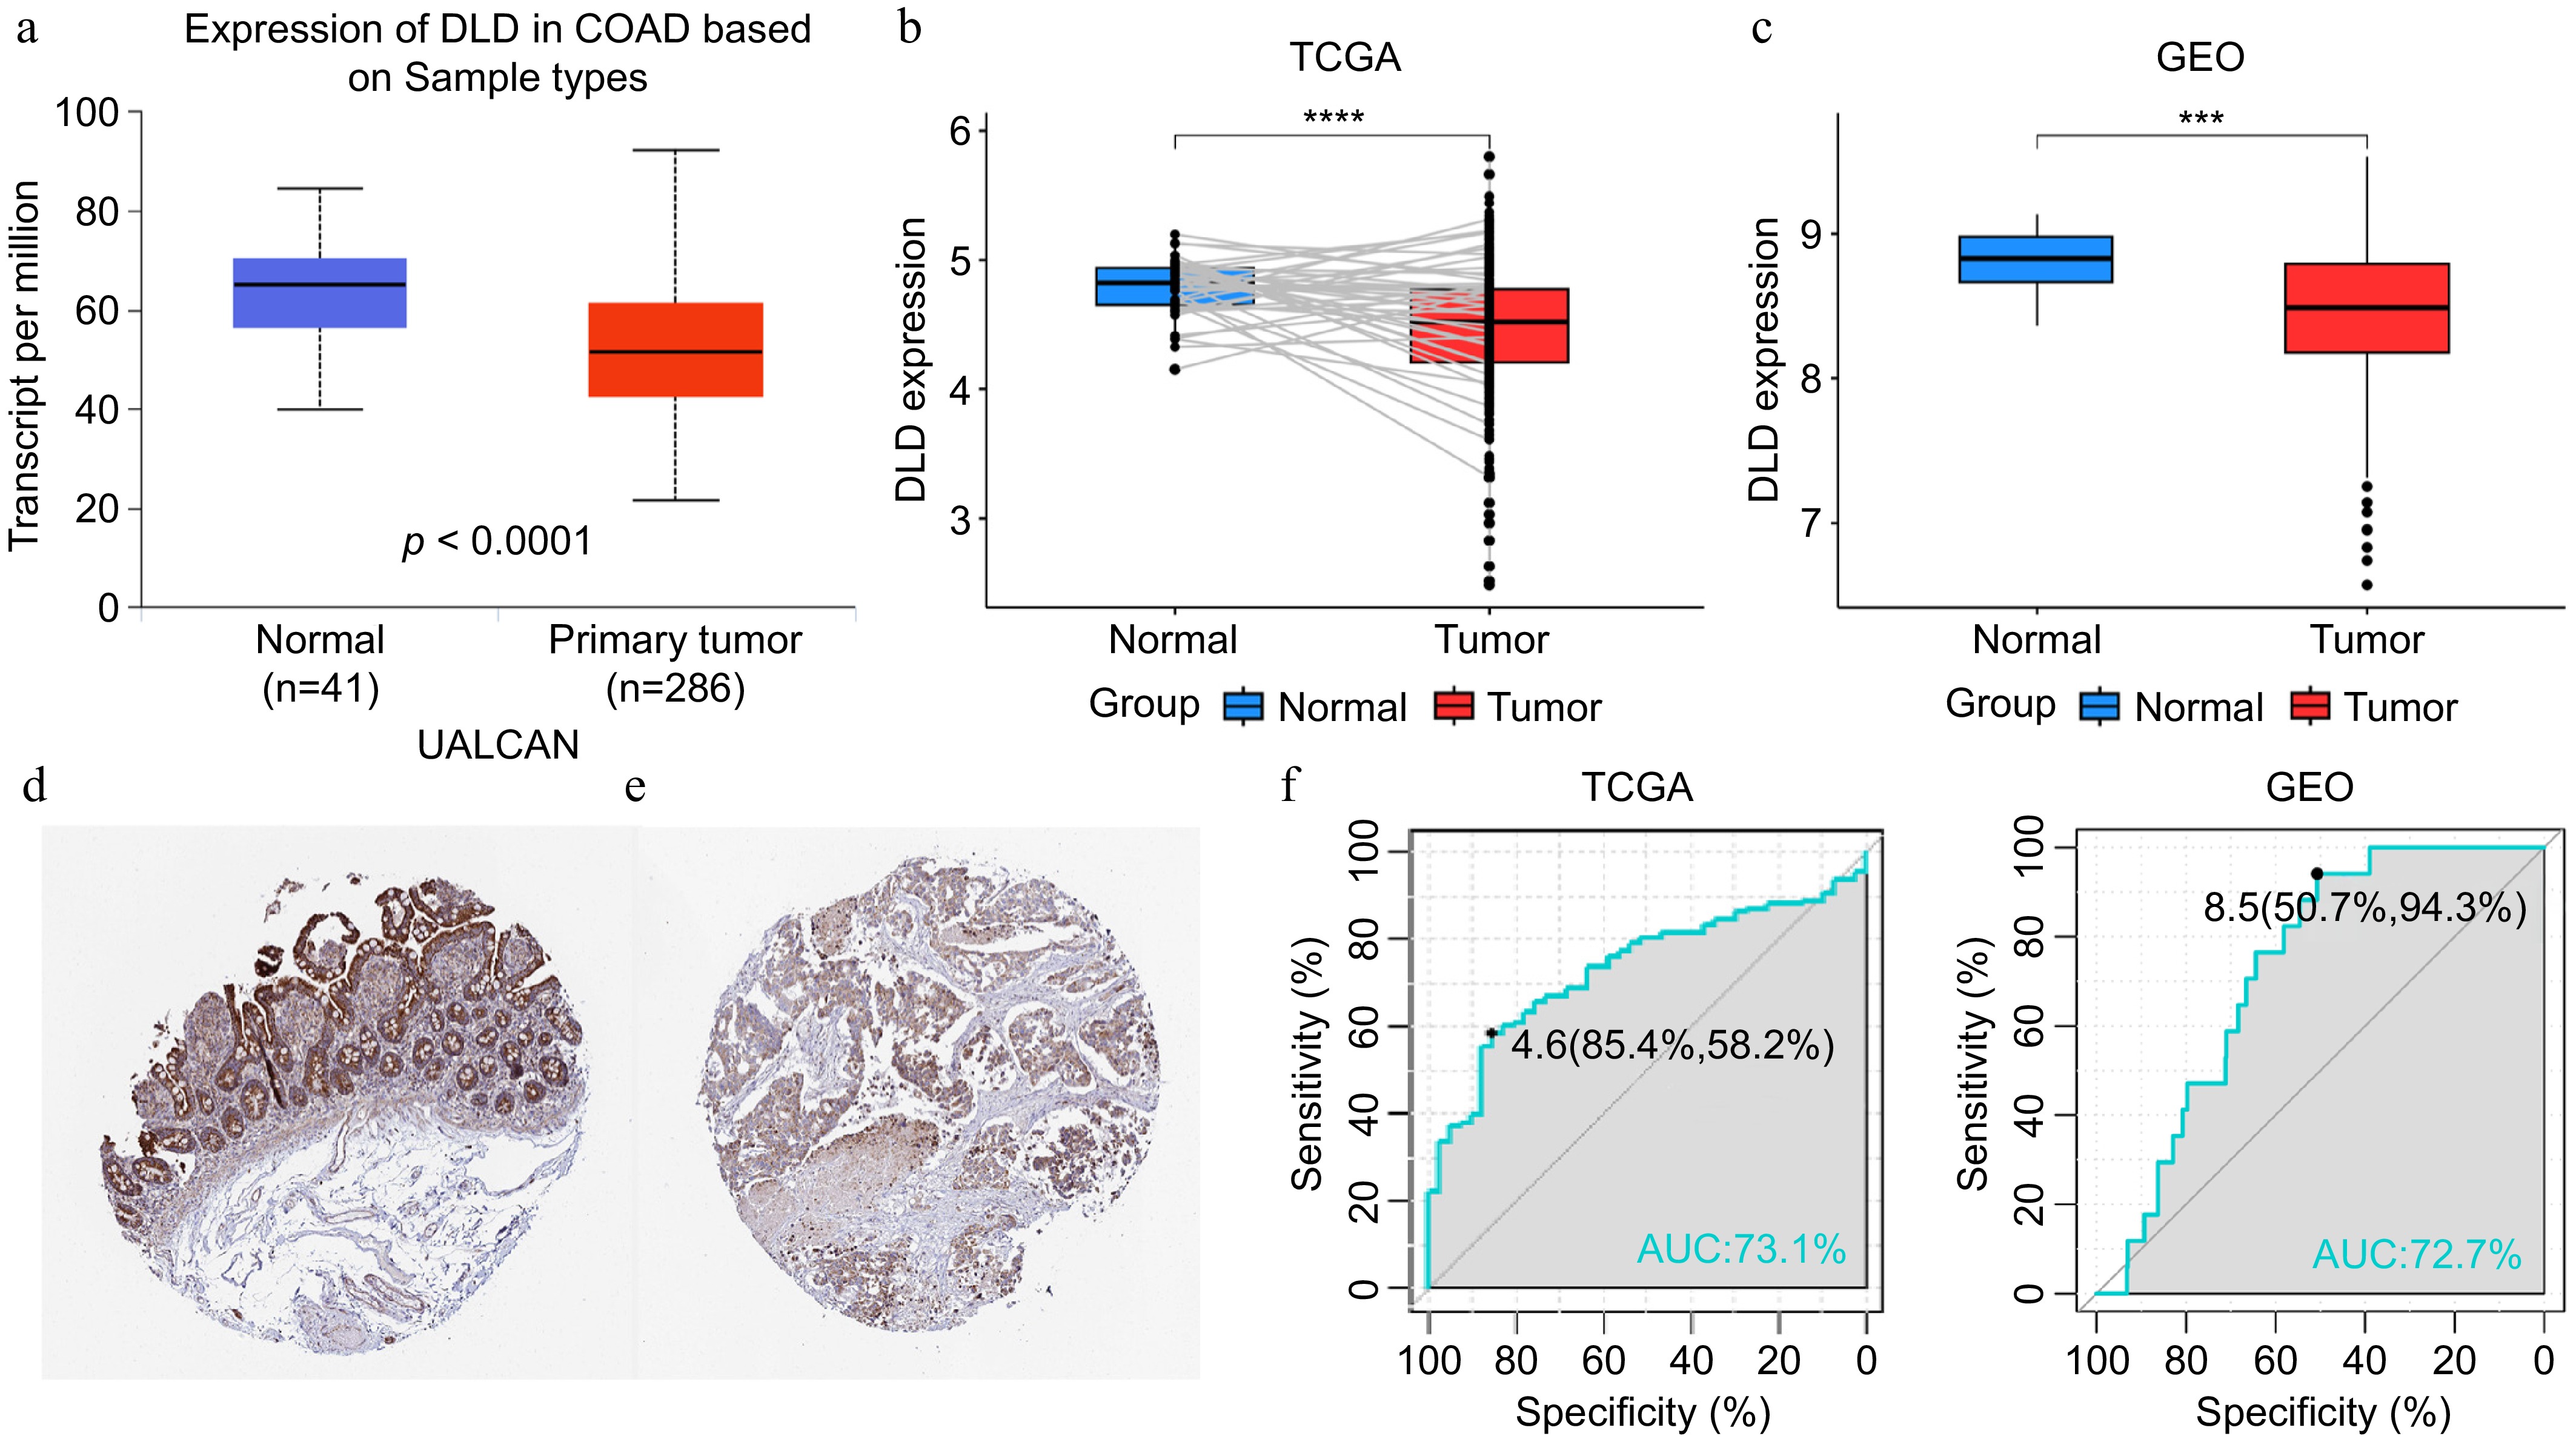
Figure 1.
DLD expression in colon cancer (CC). (a) mRNA expression of DLD in normal tissues and CC tissues, sourced from the the University of Alabama at Birmingham Cancer data analysis Portal (UALCAN) database. (b) Paired expression analysis of DLD in normal and colon adenocarcinoma (COAD) tissues sourced from The Cancer Genome Atlas (TCGA) database. (c) Expression analysis of DLD in normal and CC tissues sourced from the Gene Expression Omnibus (GEO) database. (d) Levels of DLD protein in normal colon tissues sourced from the Human Protein Atlas. (e) Levels of DLD protein in COAD tissues in the Human Protein Atlas database. (f), (g) The receiver operating characteristic (ROC) curve showed the high expression specificity of DLD in the TCGA database and GEO databases for CC. AUC, area under the curve. *** p < 0.001, **** p < 0.0001.
-
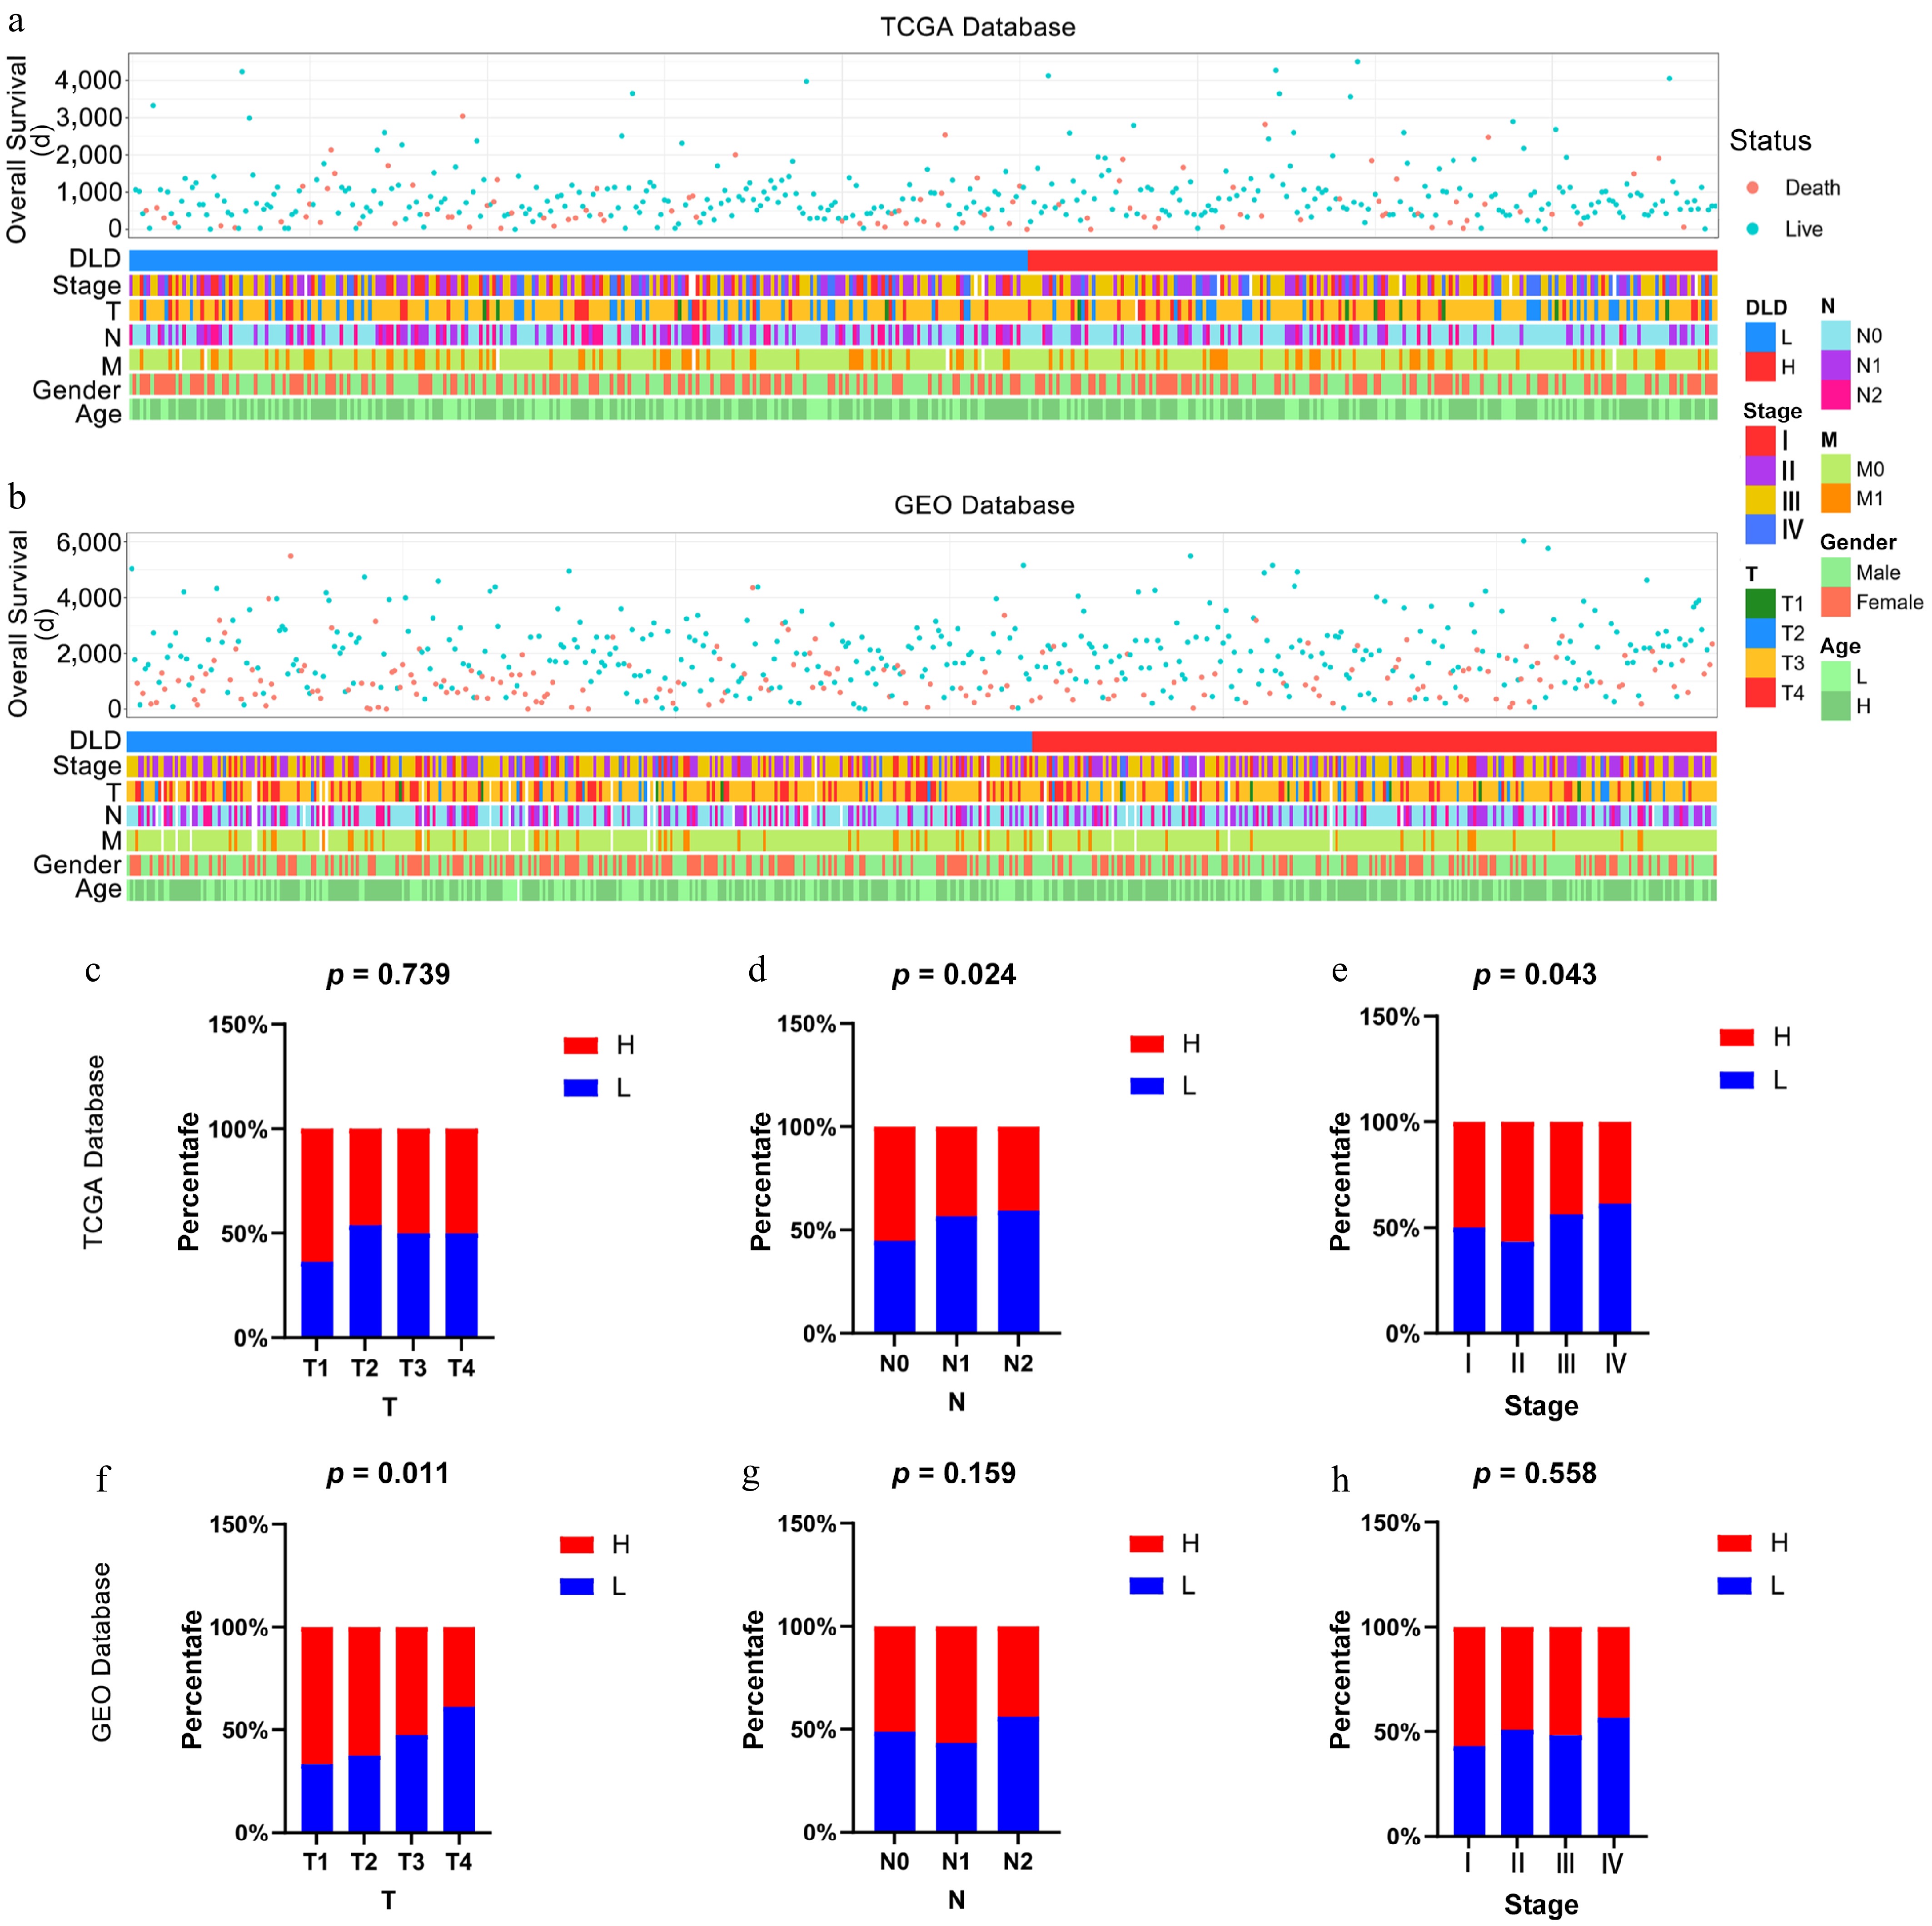
Figure 2.
Relationship between DLD and clinicopathological features of colon cancer (CC). (a) Status of clinicopathological features of CC associated with DLD in The Cancer Genome Atlas (TCGA) database. (b) Status of clinicopathological features of CC associated with DLD in the Gene Expression Omnibus (GEO) database. (c)–(h) Correlation of DLD expression with clinicopathological parameters including clinical stages, lymph node invasion, and pathological stage in CC patients in the TCGA database and GEO database. The significance of differences was tested by the χ2-test.
-
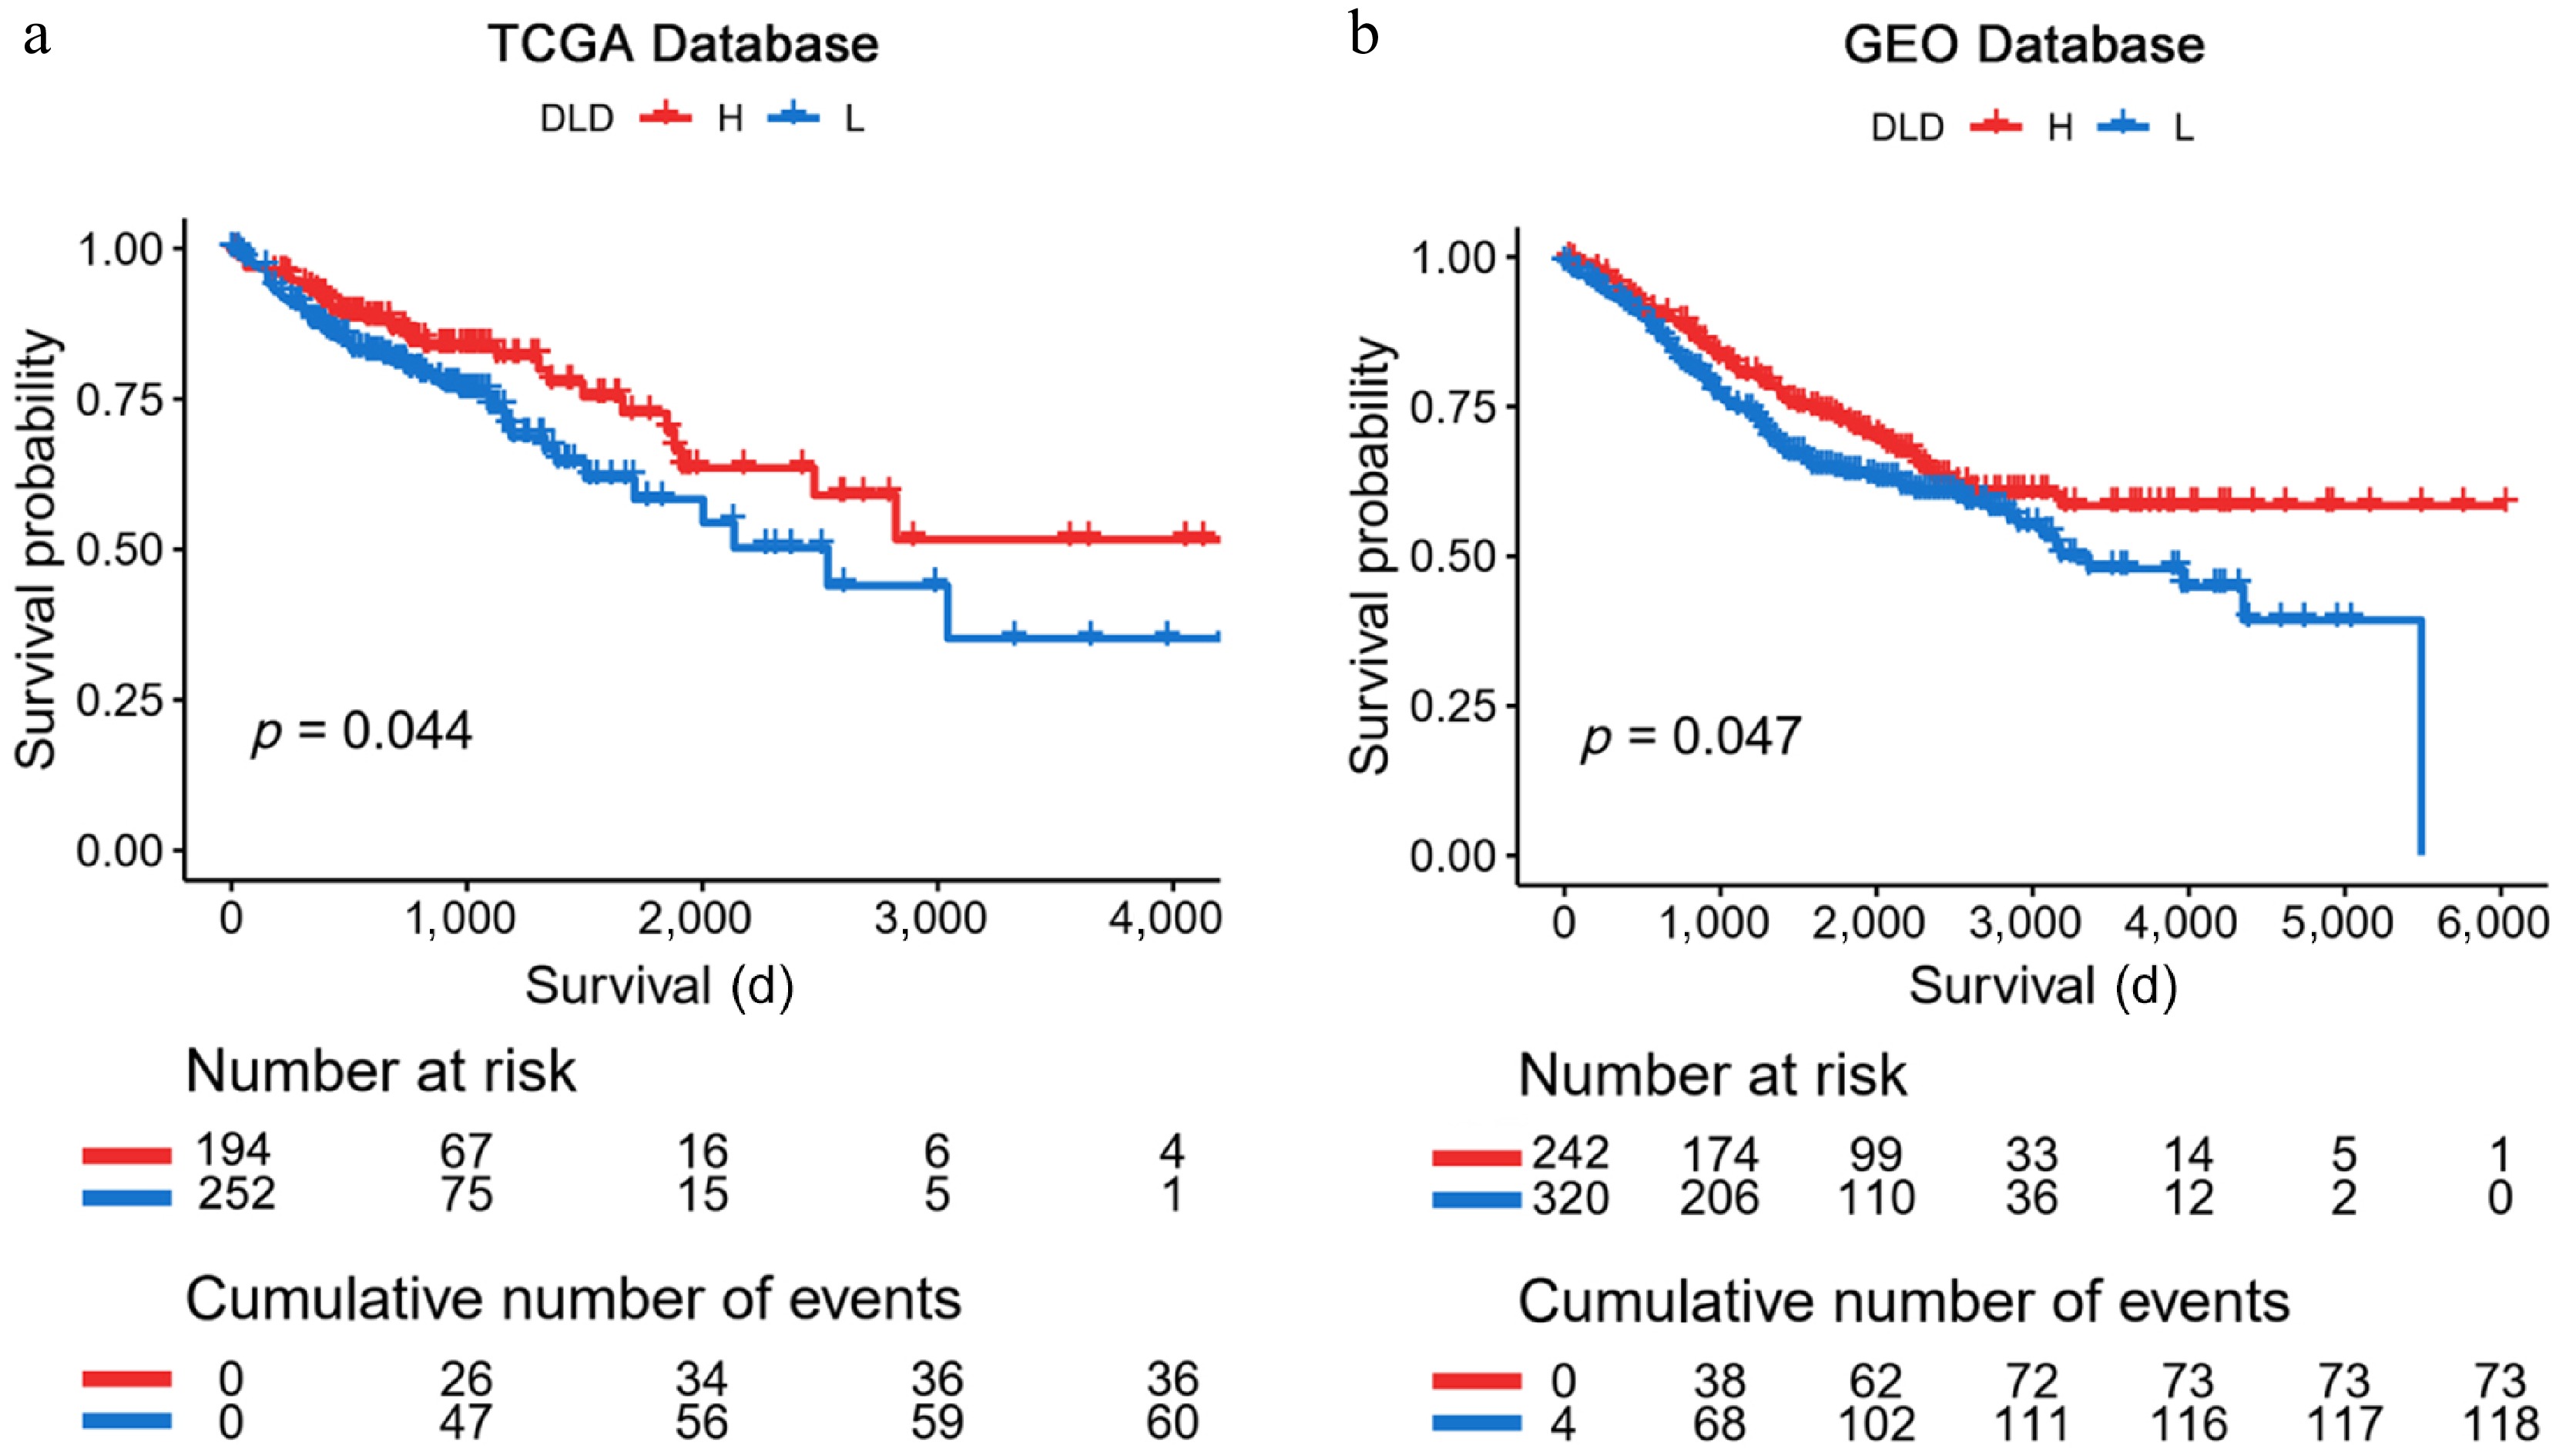
Figure 3.
Kaplan-Meier analysis of DLD expression in The Cancer Genome Atlas (TCGA) database and the Gene Expression Omnibus (GEO) database. (a), (b) Kaplan-Meier plots verified that high DLD mRNA levels are associated with better survival outcomes in patients with CC. Significance of prognostic value was tested by log-rank test.
-
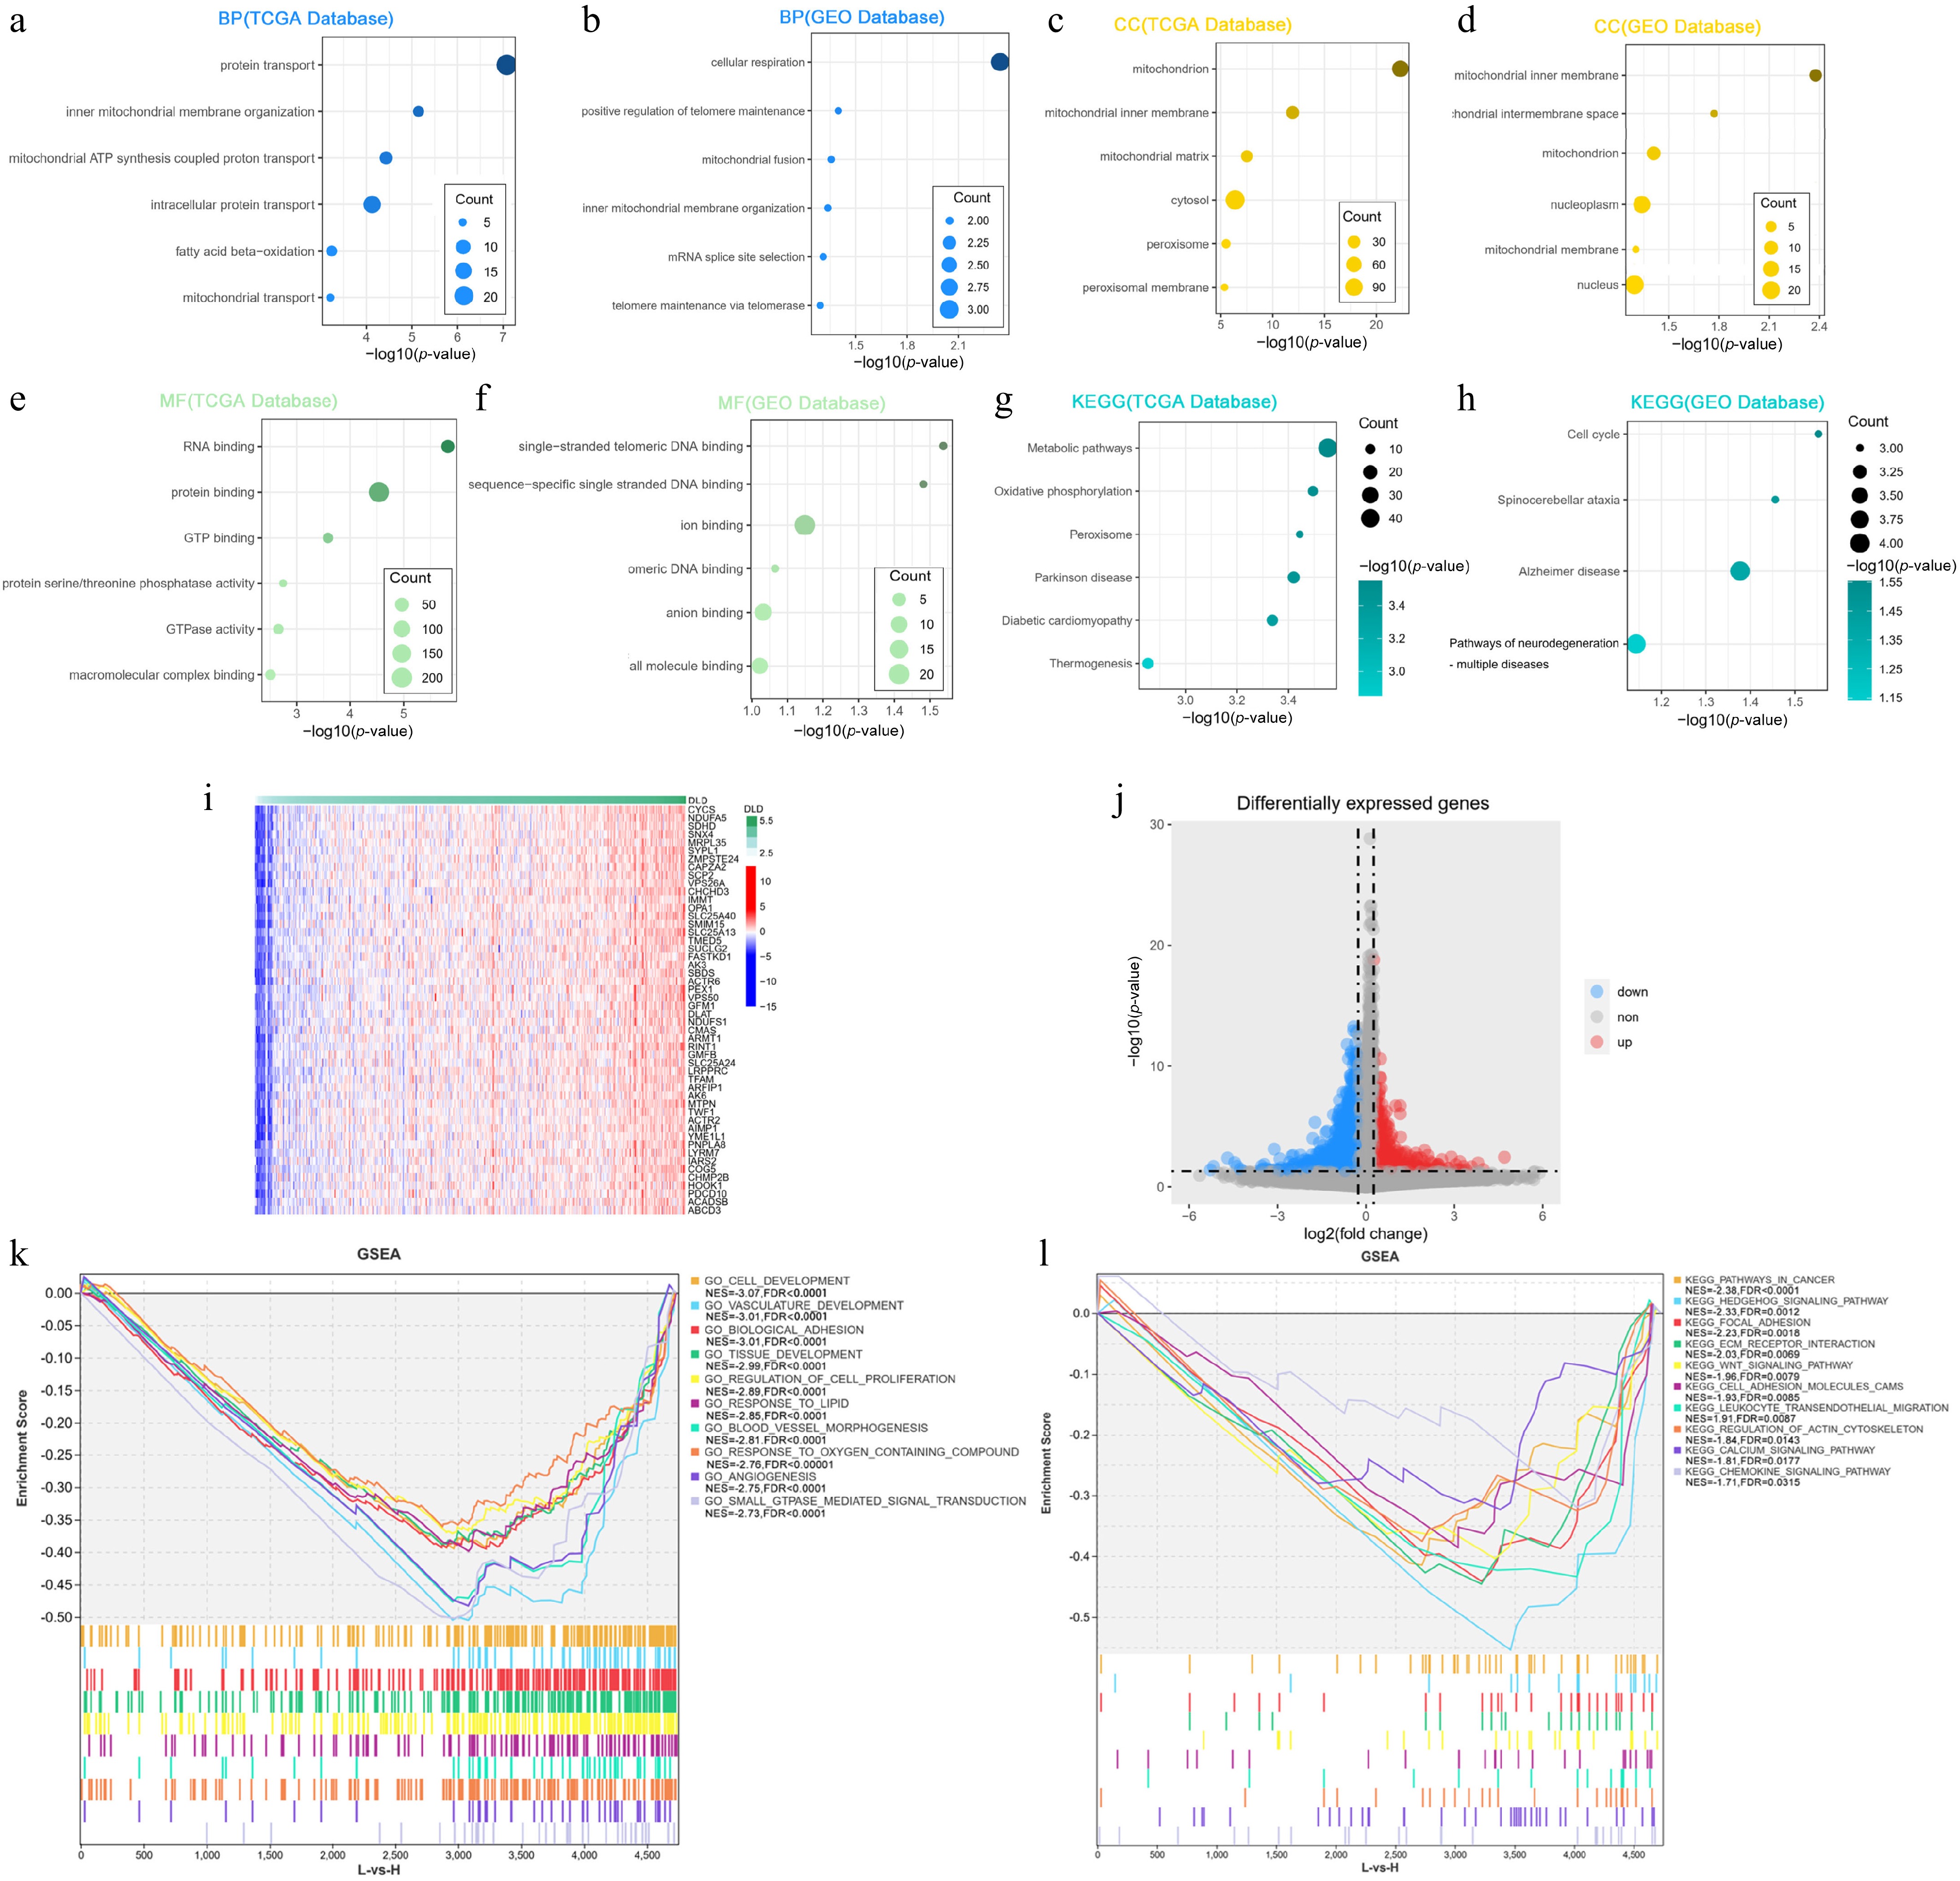
Figure 4.
DLD is closely related to the regulation of metabolic processes in CC. (a), (b) Biological processes (BP) mostly associated with DLD in The Cancer Genome Atlas (TCGA) database and the Gene Expression Omnibus (GEO) database. (c), (d) Cellular components (CC) mostly associated with DLD in the TCGA database and GEO database. (e), (f) The most relevant molecular functions (MFs) of DLD in the TCGA database and the GEO database. (g), (h) KEGG pathway analysis of DLD in the TCGA database and GEO database. (i) Heat map showing the top 50 co-expressed genes positively associated with DLD expression in the TCGA dataset. (j) Volcano plot showing differentially expressed genes in the high-DLD group versus the low-expression group in the TCGA dataset. (k), (l) Gene Ontology (GO) function and KEGG pathway enrichment analysis of differentially expressed genes in the high- versus low-DLD groups in the TCGA dataset.
-
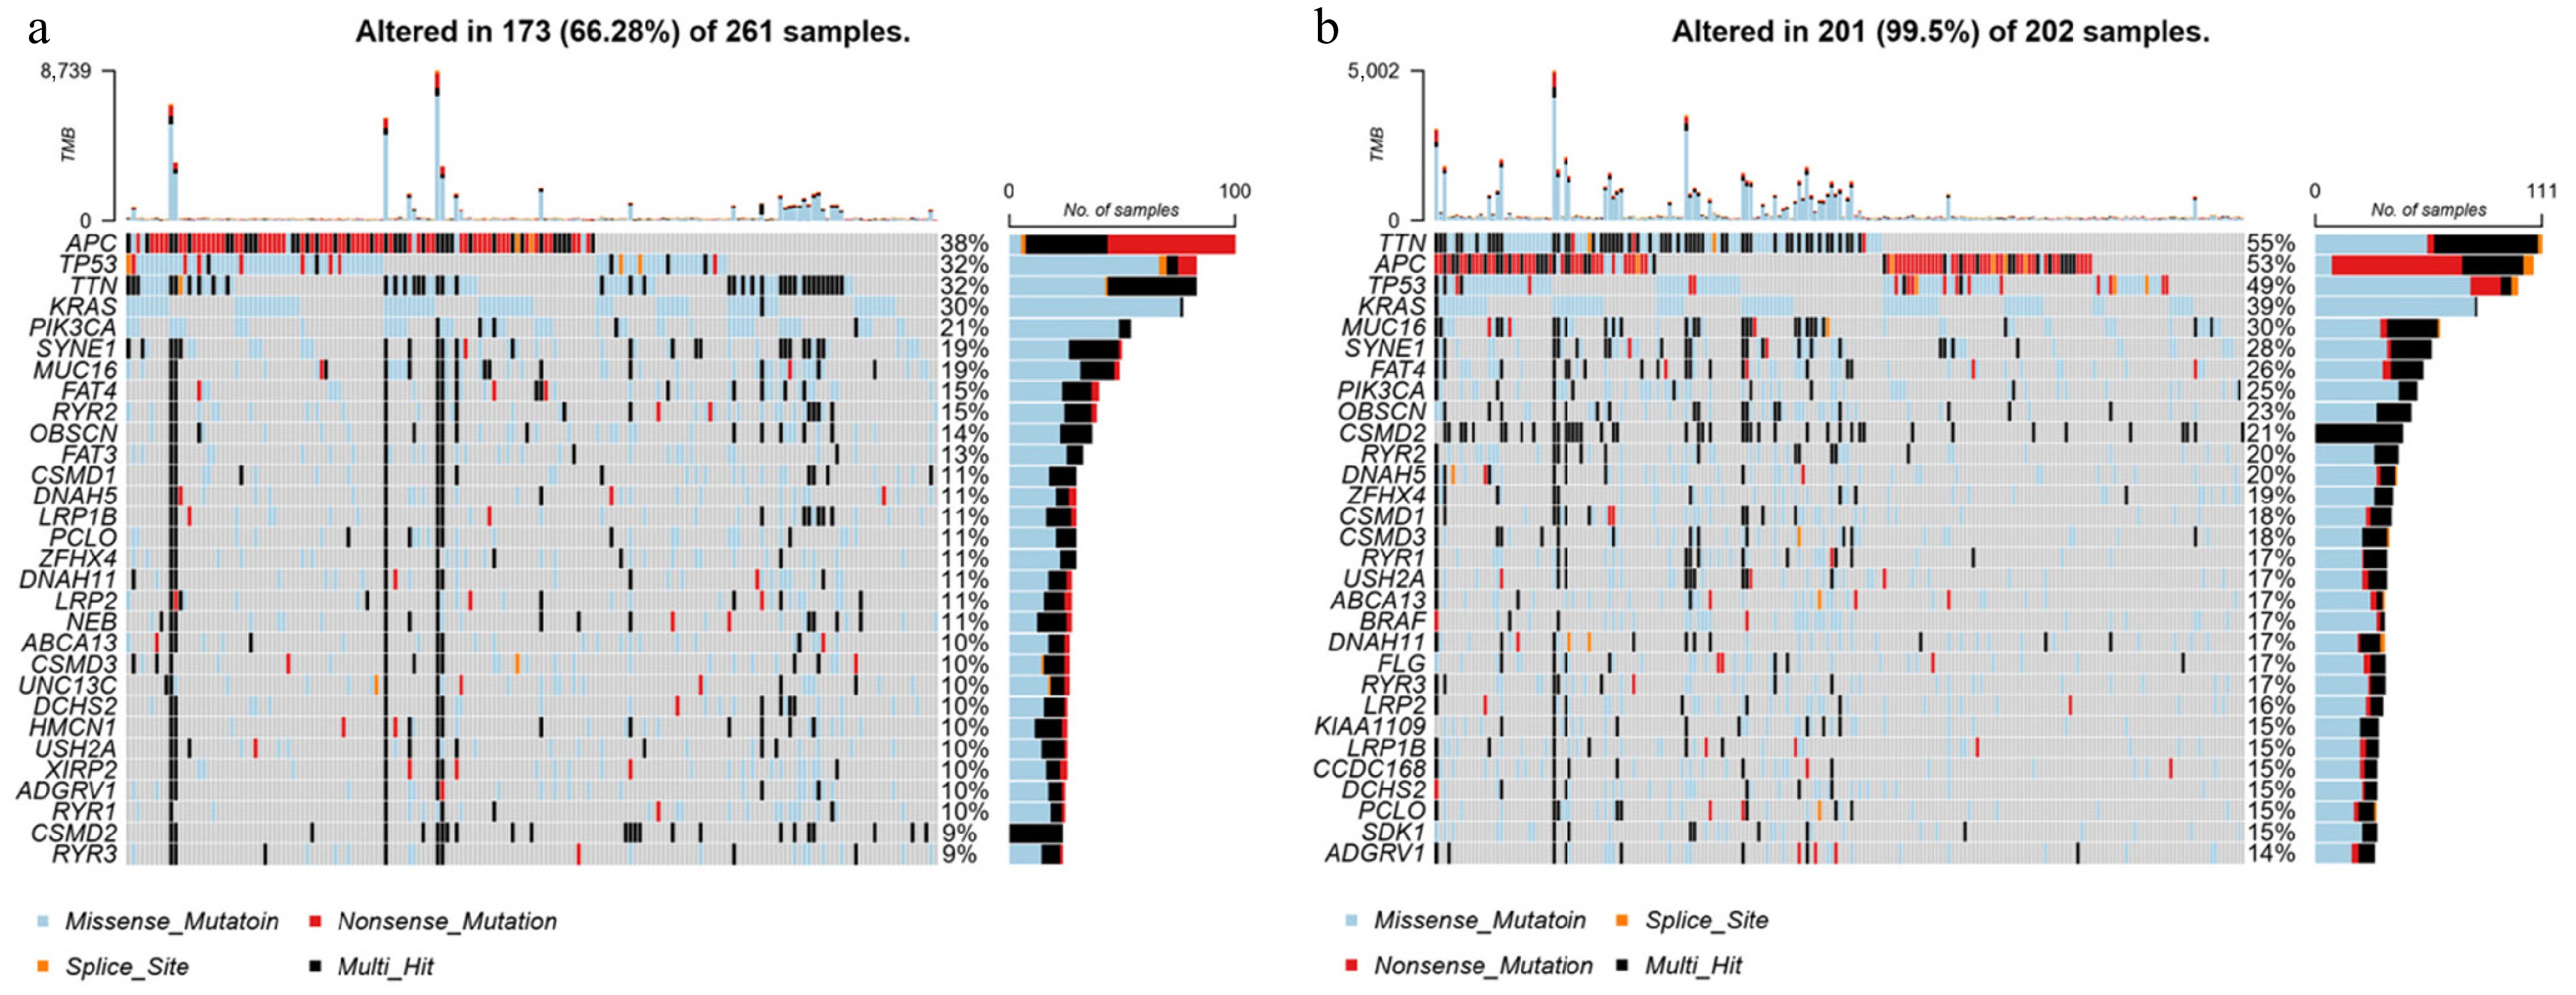
Figure 5.
Somatic mutation analysis in groups with high and low expression of DLD. Waterfall plot of the top 30 mutational genes in the (a) high-DLD group and (b) low-DLD group.
-
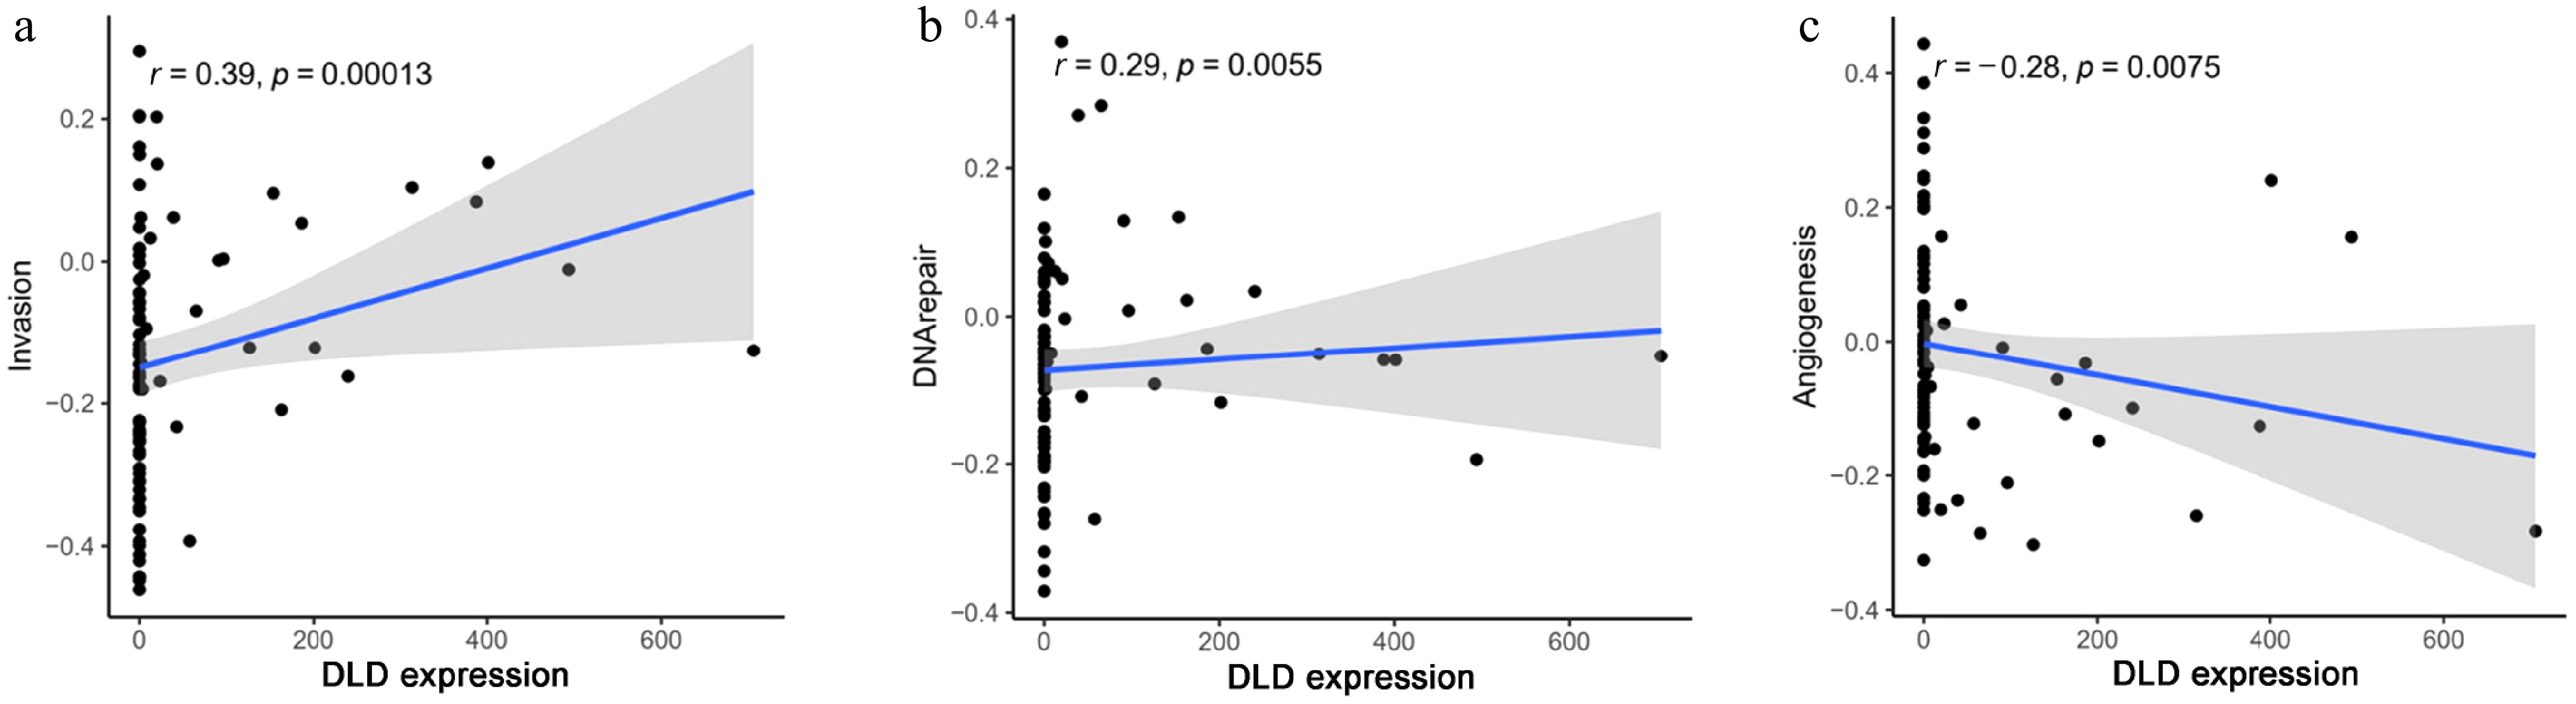
Figure 6.
Correlation between DLD expression and significantly different functional states in CC: (a) invasion, (b) DNA repair, and (c) angiogenesis.
-
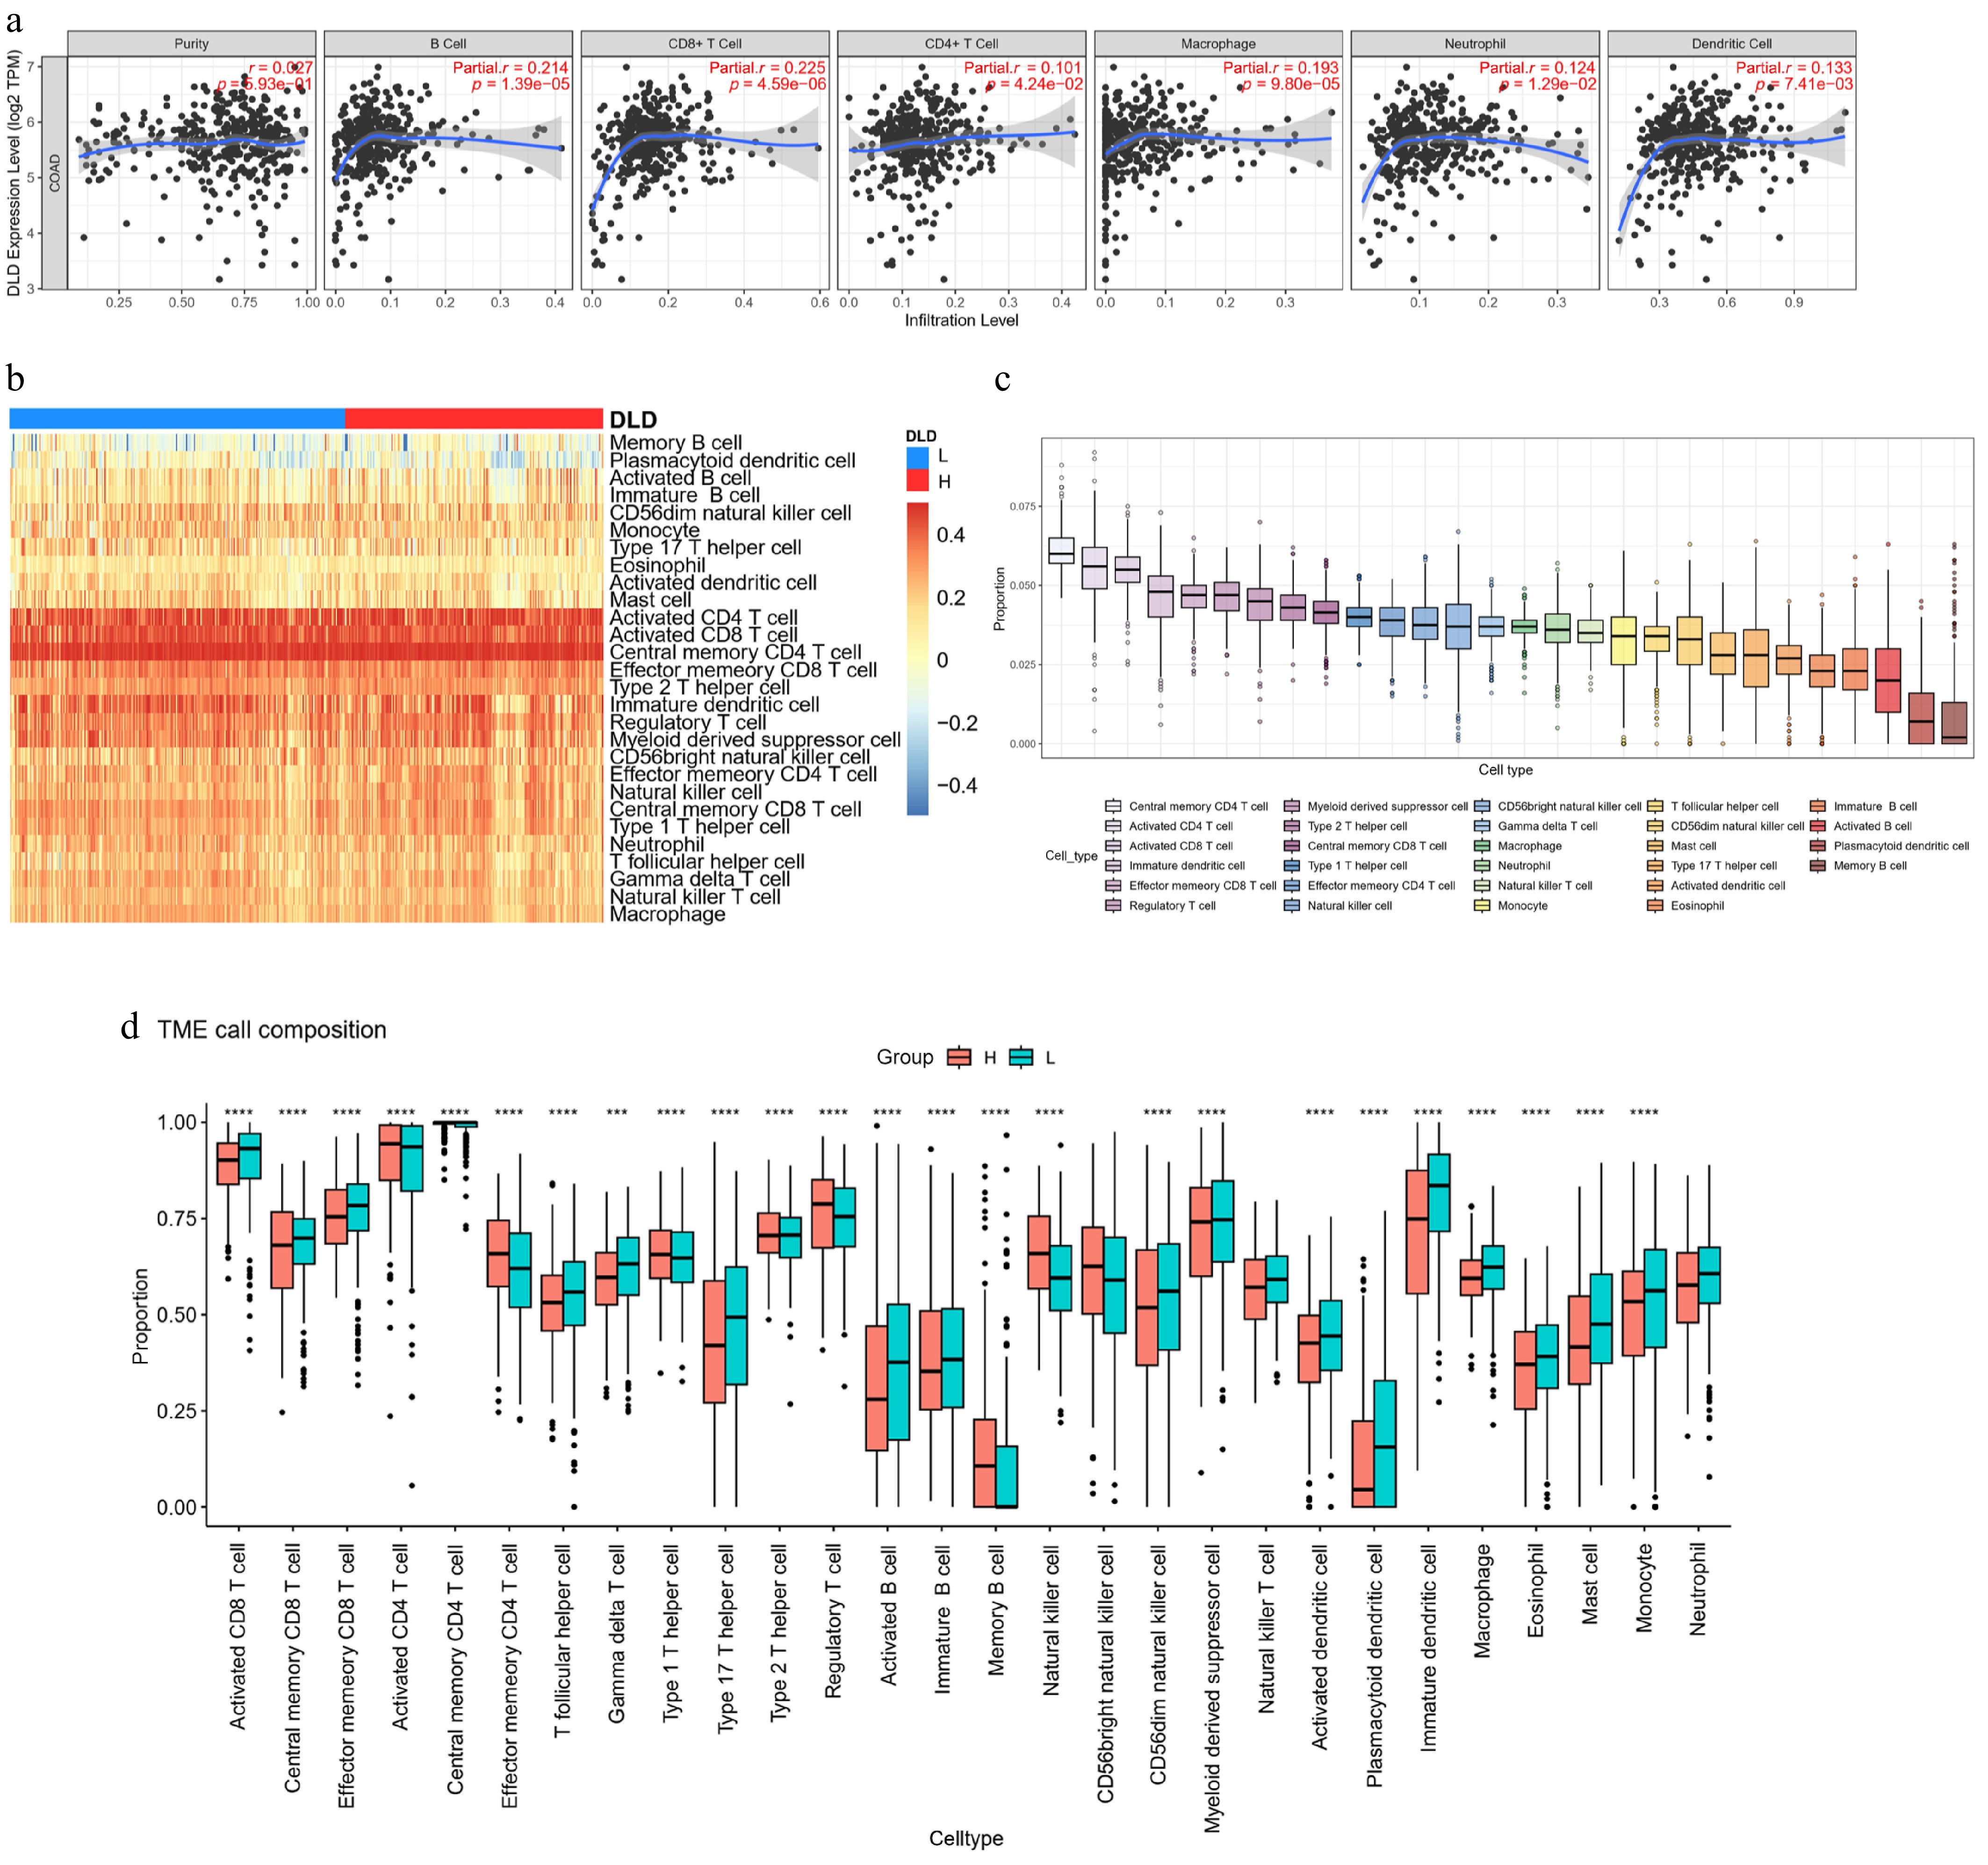
Figure 7.
DLD expression correlates with the degree of immune infiltration in CC. (a) Spearman's correlation between DLD expression and the abundance of six types of infiltrating immune cells. (b) Heat map showing differences in immune cell infiltration between the high- and low-DLD groups. (c) Proportion of 28 immune cell subtypes infiltrating in CC. (d) Changes in 28 immune cell subtypes between the high- and low-DLD groups in CC tumor samples. * p < 0.05; ** p < 0.01; *** p < 0.001; **** p < 0.0001.
Figures
(7)
Tables
(0)