-
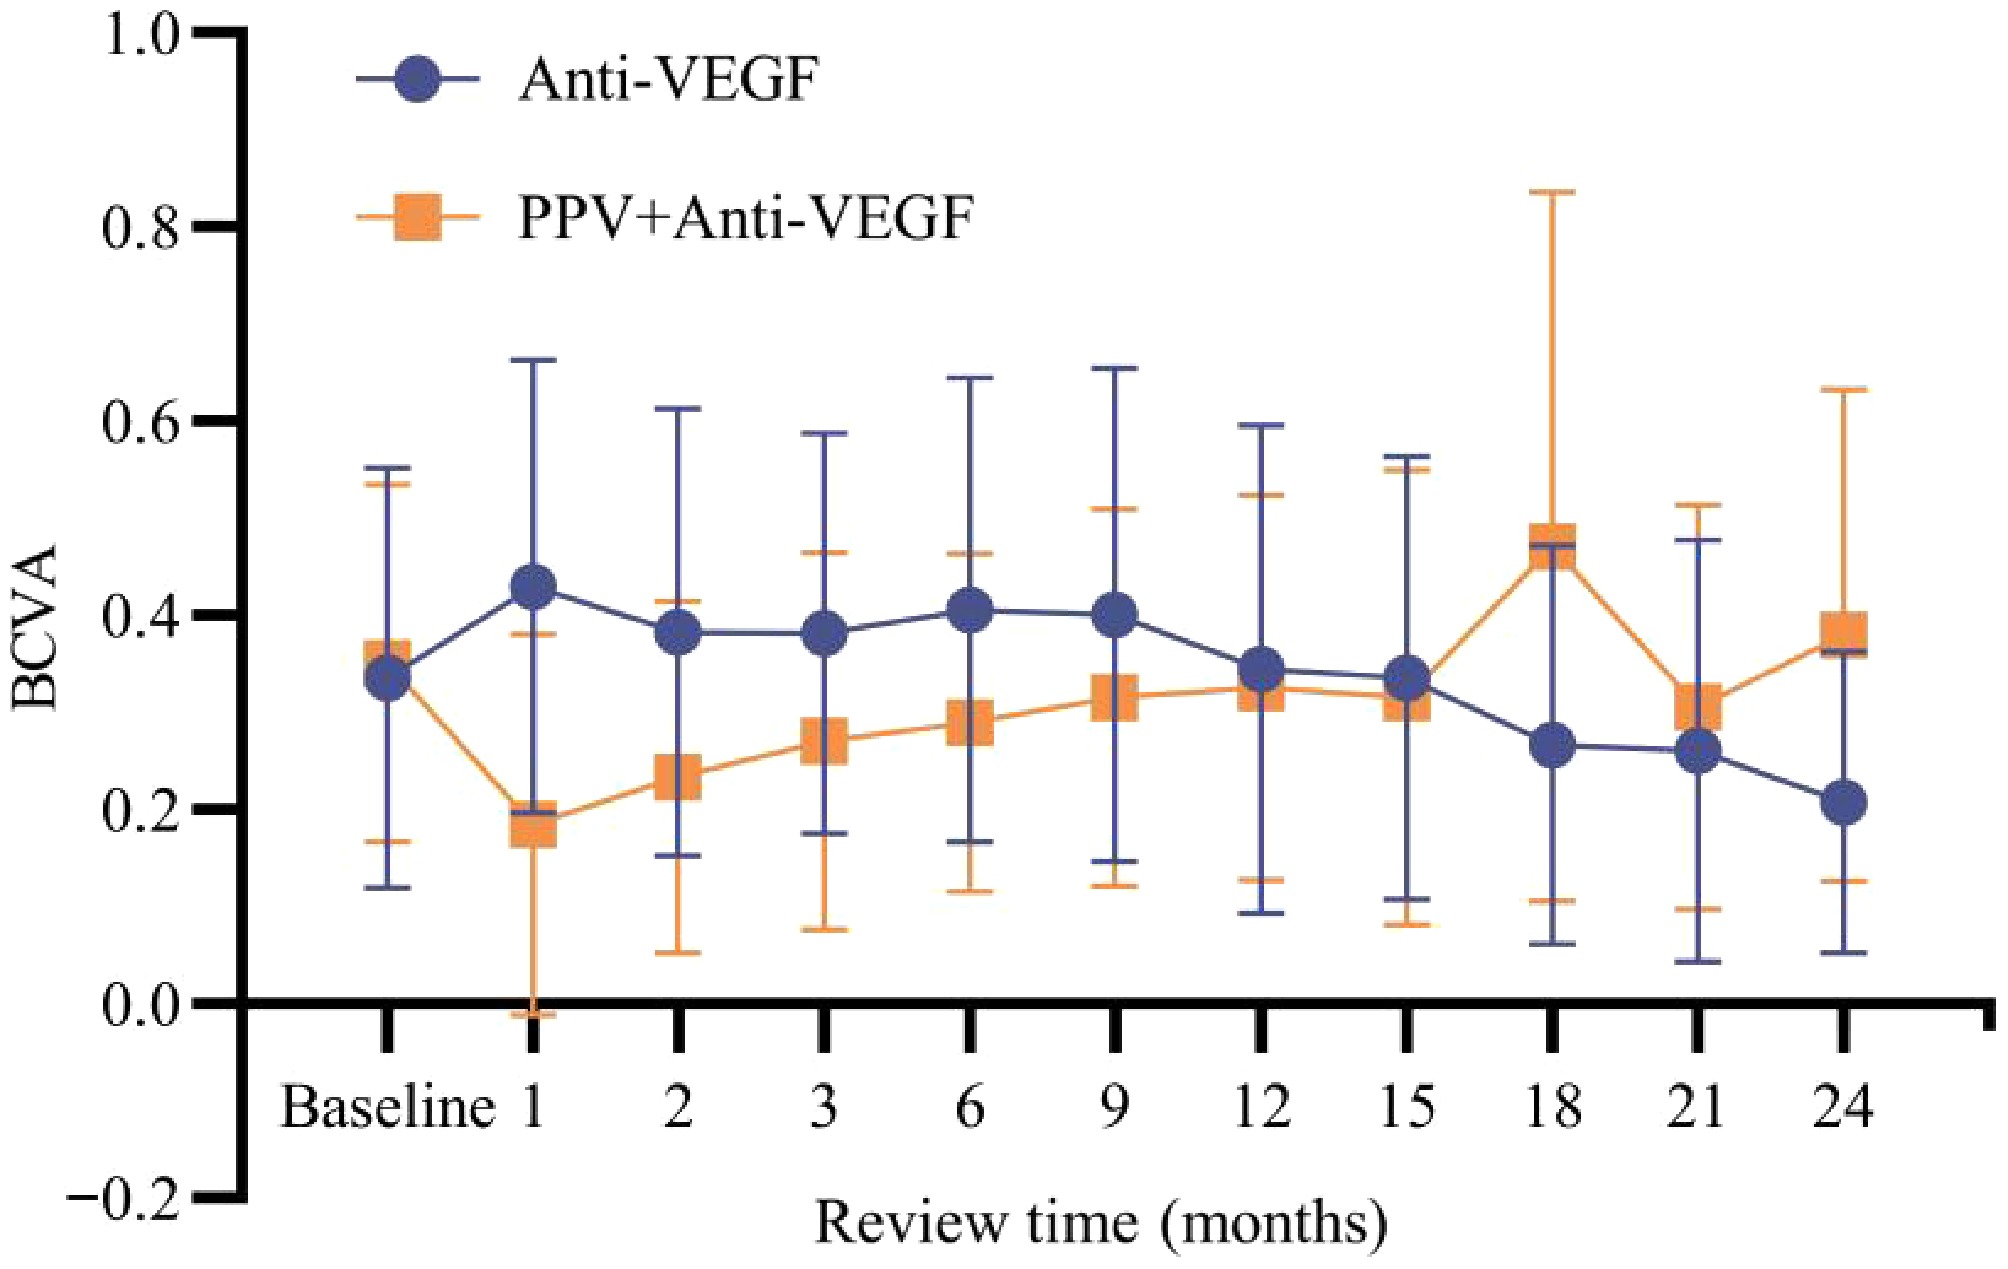
Figure 1.
Comparison of BCVA within 24 months and its development trend between the two groups.
-
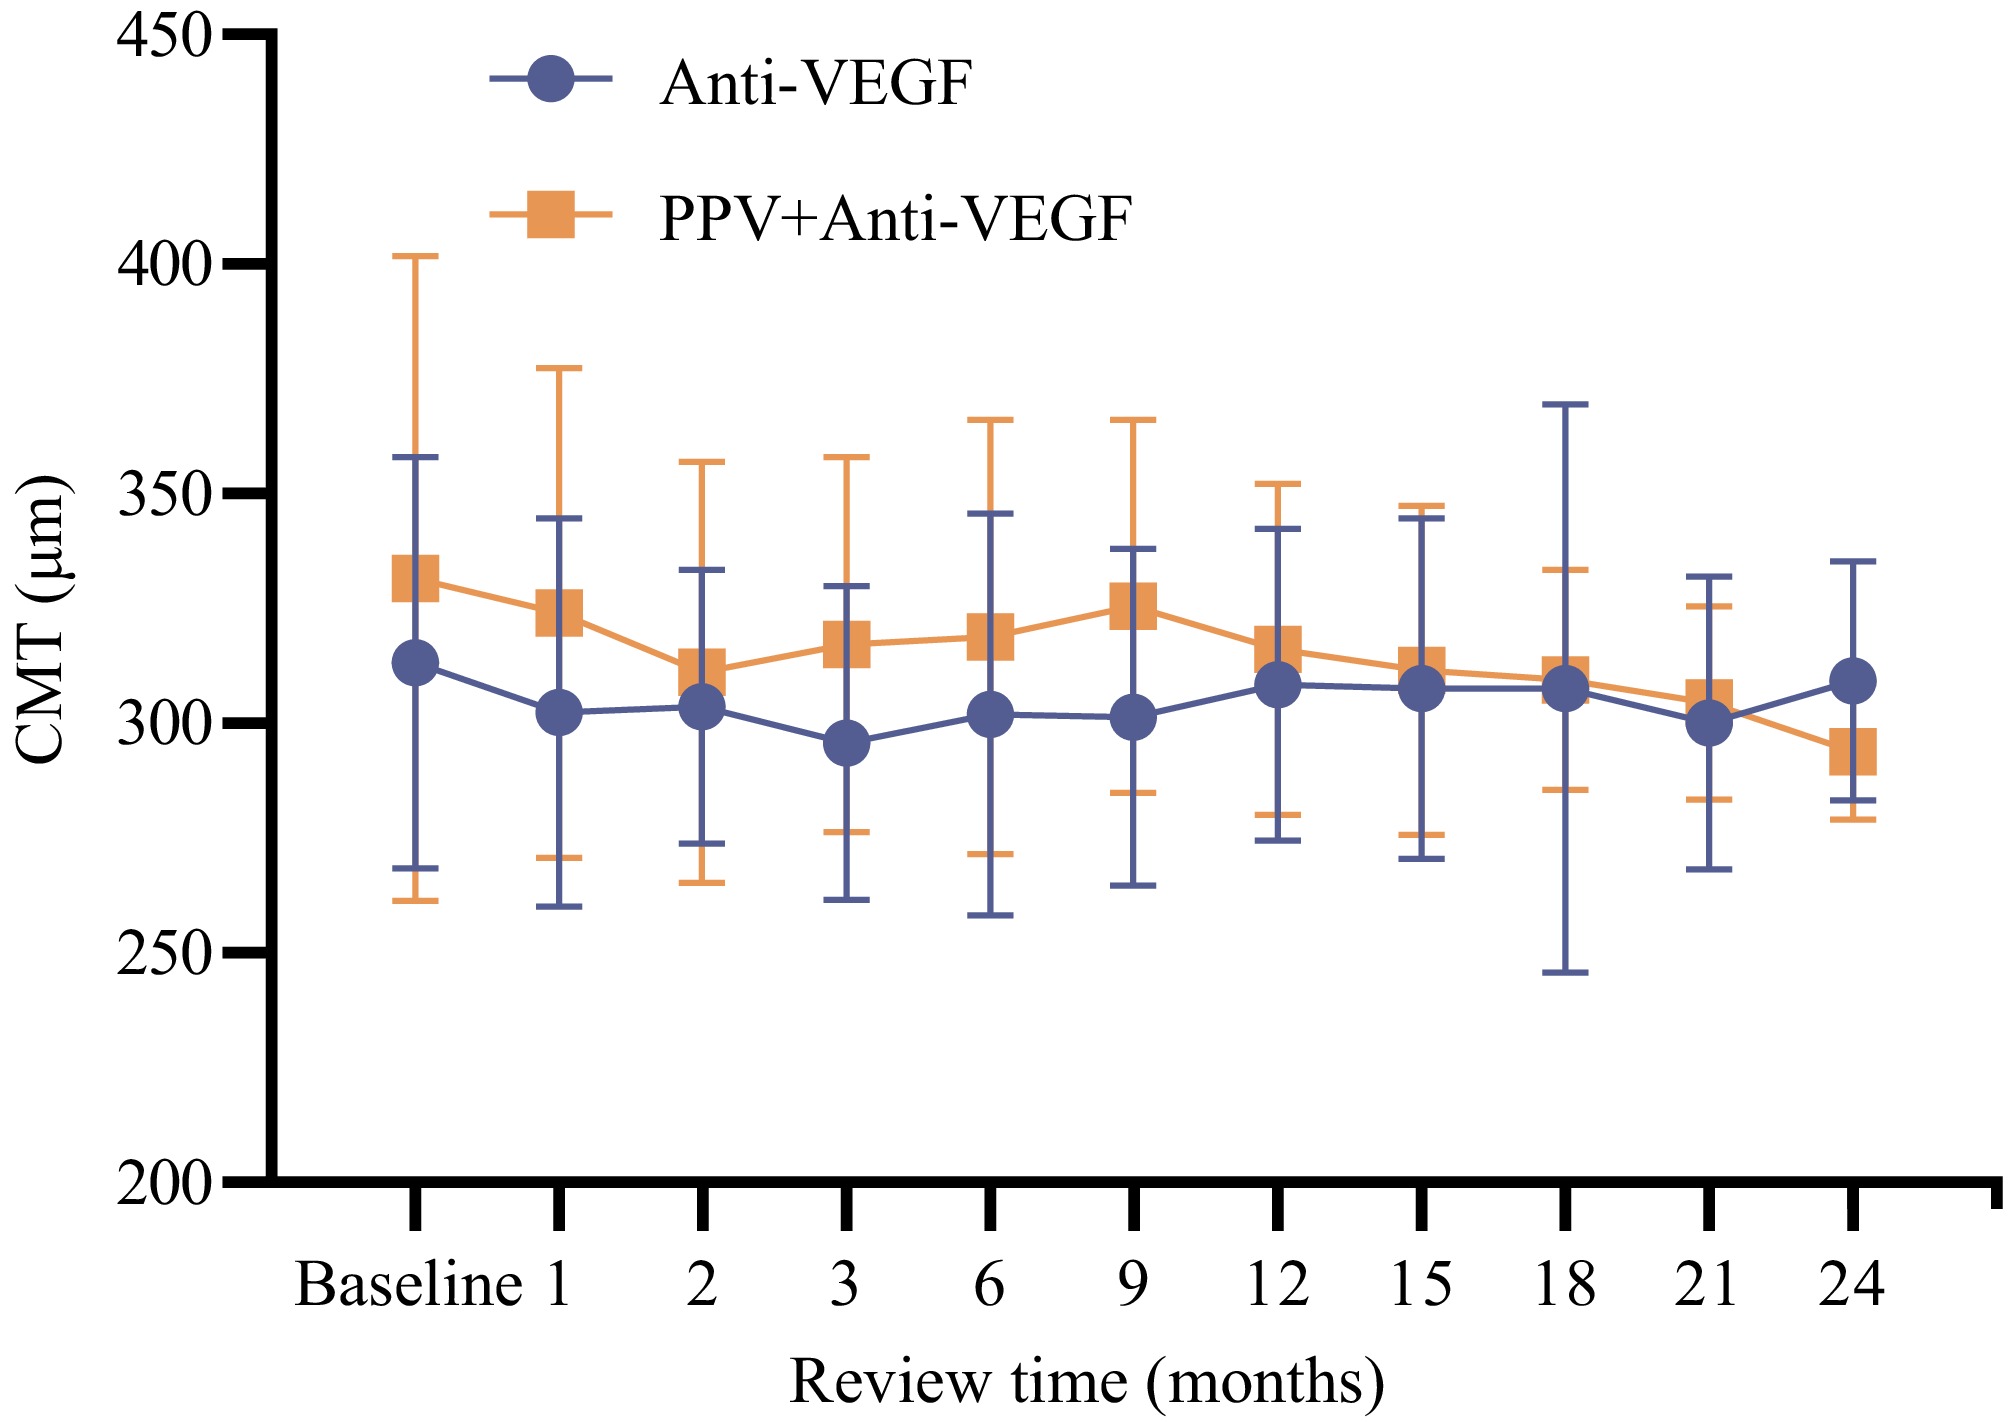
Figure 2.
Comparison of the trends of CMT values during the treatment period between the two groups.
-
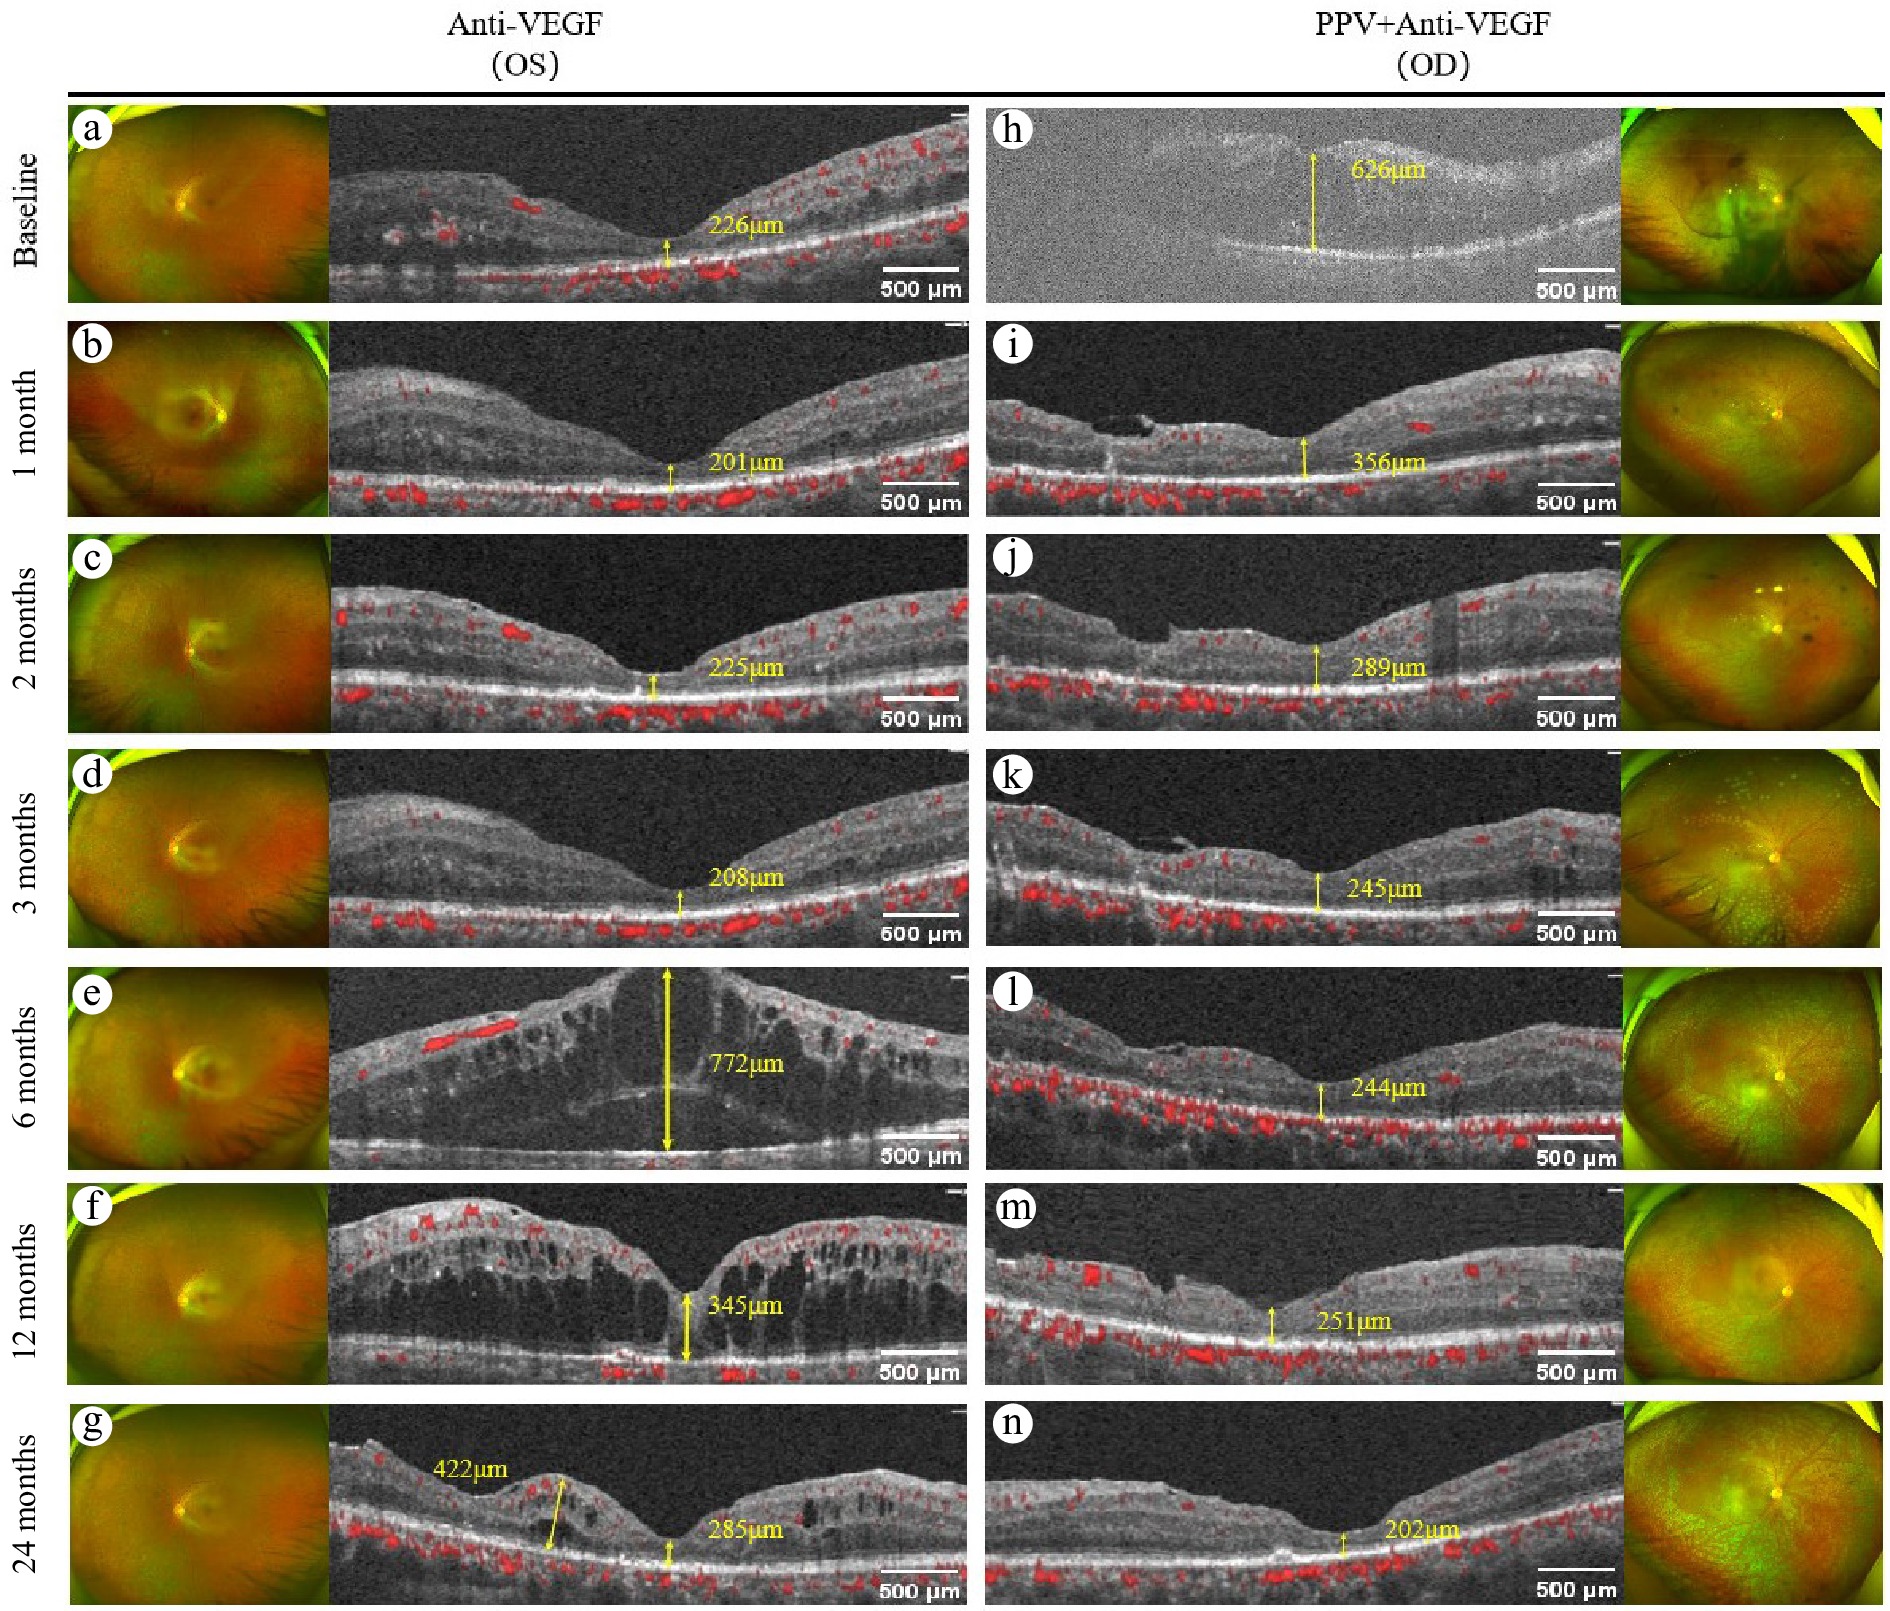
Figure 3.
Comparison of the changes in CMT values of the same patient after different treatment methods. (a)−(g) Show the changes in CMT on OCTA in the left eye after anti-VEGF therapy. Among them: (a) The CMT value at baseline is 226 μm. (b) The CMT value is 201μm after 1 month of treatment. (c) The CMT value is 225 μm after 2 months of treatment. (d) The CMT value is 208 μm after 3 months of treatment. (e) The CMT value is 772 μm after 6 months of treatment. (f) The CMT value is 345 μm after 12 months of treatment. (g) The CMT value is 285 μm after 24 months of treatment. (h)−(n) Show the changes in CMT on OCTA in the right eye following PPV combined with anti-VEGF therapy. Among them: (h) The CMT value at baseline is 626 μm. (i) The CMT value is 356 μm after 1 month of treatment. (j) The CMT value is 289 μm after 2 months of treatment. (k) The CMT value is 245 μm after 3 months of treatment. (l) The CMT value is 244 μm after 6 months of treatment. (m) The CMT value is 251 μm after 12 months of treatment. (n) The CMT value is 202 μm after 24 months of treatment.
-
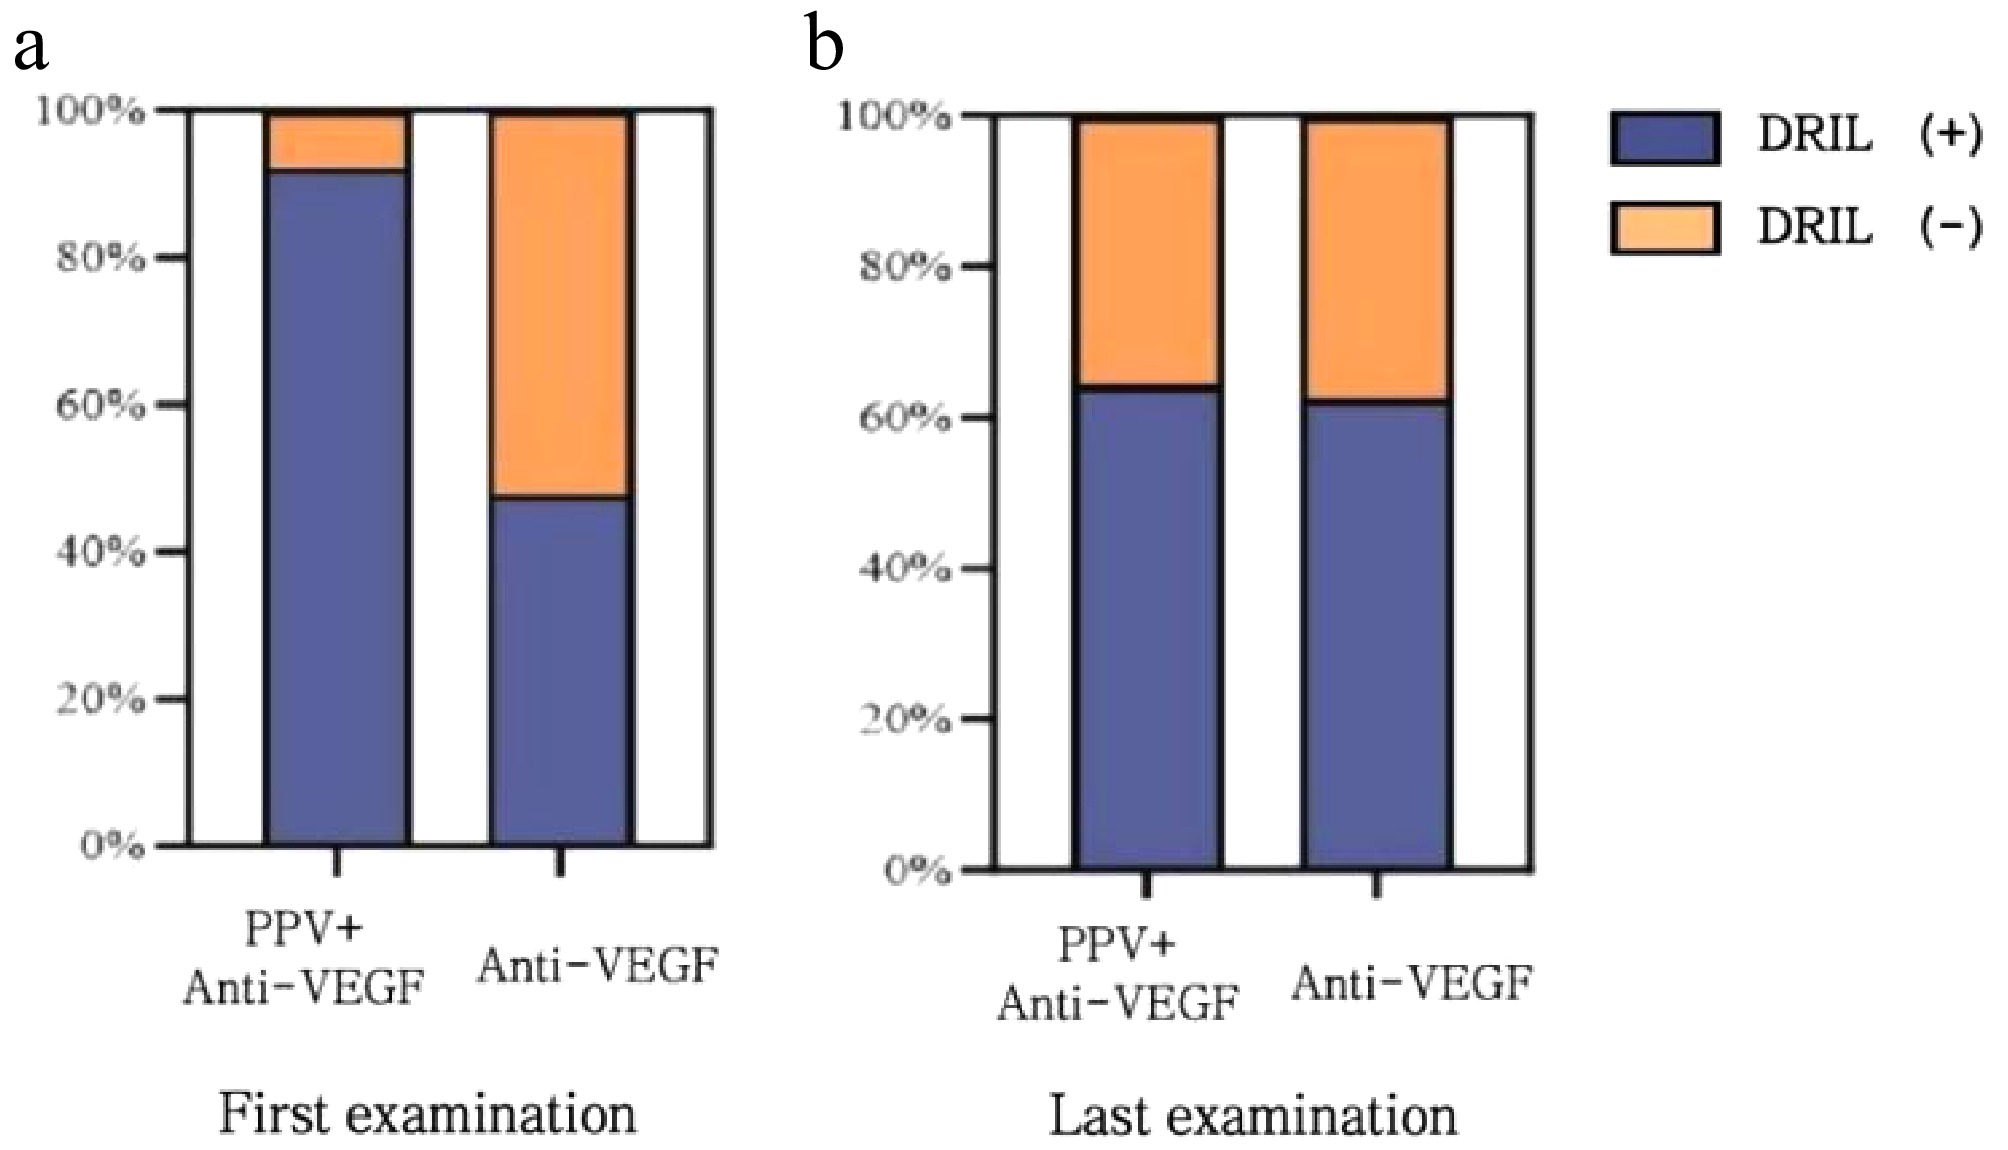
Figure 4.
Comparison of the occurrence rates of DRIL at the first diagnosis and the last visit between the two groups of patients. (a) At the first diagnosis, the incidence rate of DRIL in the multimodal treatment group was 92.3%, and that in the standalone treatment group was 47.8%. The comparison between the two groups showed p = 0.0024; (b) After 24 months of treatment, the incidence rate of DRIL in the multimodal treatment group was 65.3%, and that in the standalone treatment group was 61.5%. The comparison between the two groups showed p = 0.455.
-
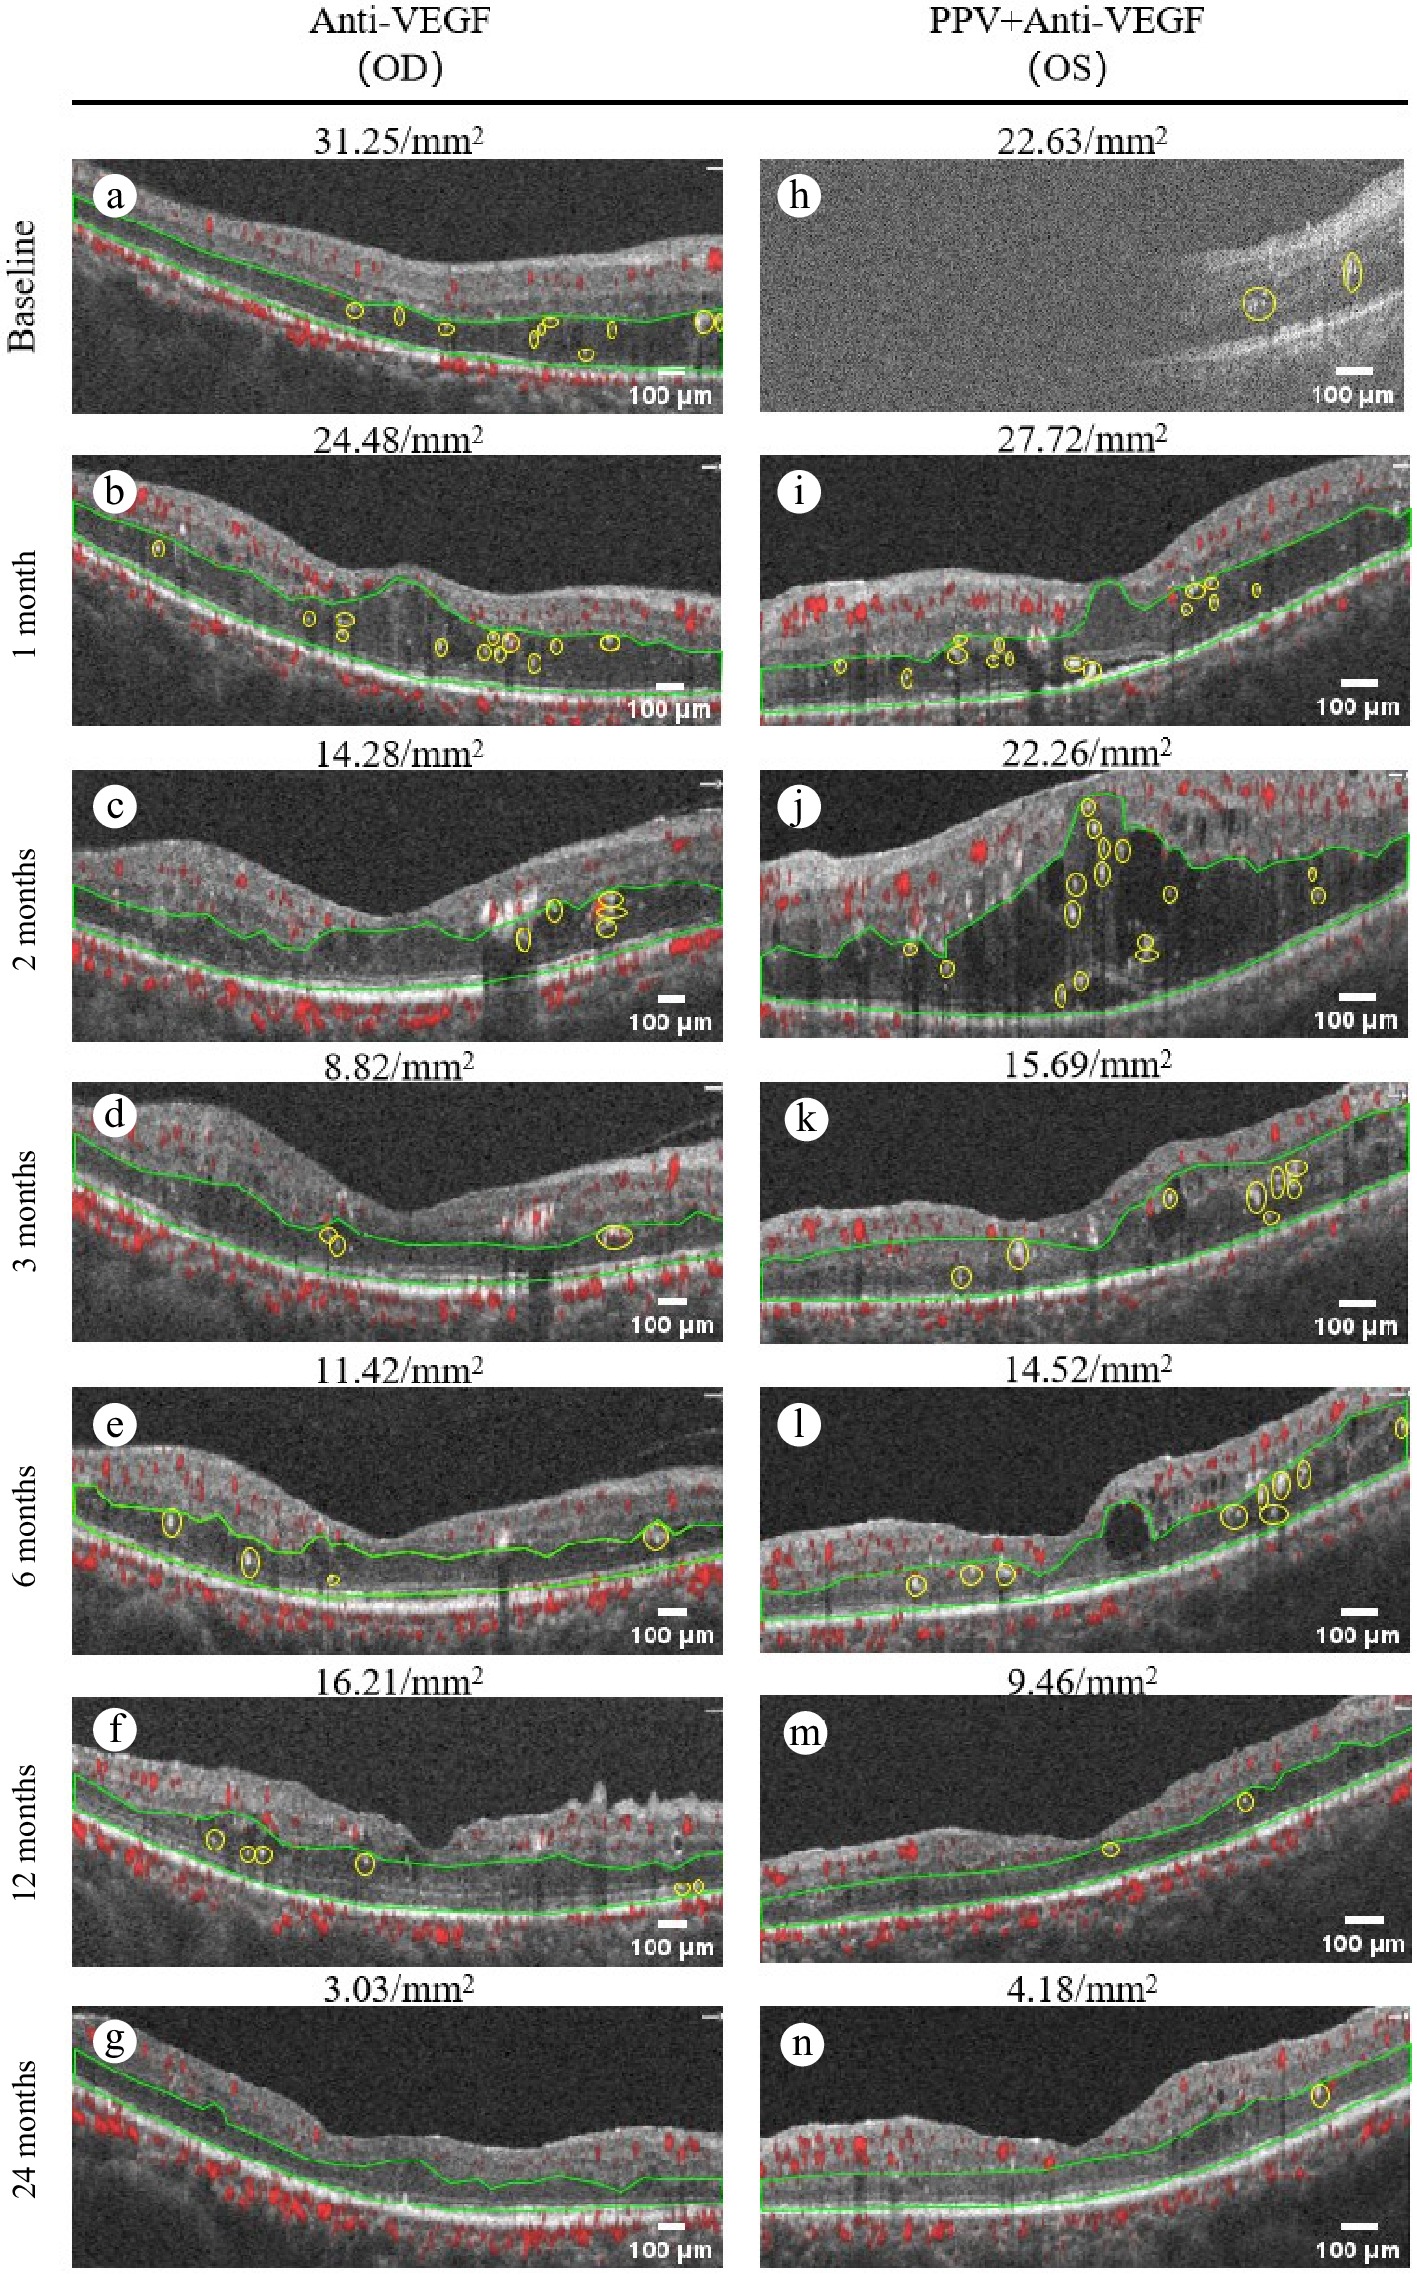
Figure 5.
Comparison of the number of HF in the same patient after different treatment methods. (a)–(g) Show the changes in the number of HF in OCTA during the standalone treatment for the right eye. Among them: (a) The number of HF shown in OCTA before the standalone treatment is 31.25/mm2. (b) The number of HF is 24.48/mm2 after 1 month of treatment. (c) The number of HF is 14.28/mm2 after 2 months of treatment. (d) The number of HF is 8.82/mm2 after 3 months of treatment. (e) The number of HF is 11.42/mm2 after 6 months of treatment. (f) The number of HF is 16.21/mm2 after 12 months of treatment. (g) The number of HF is 3.03/mm2 after 24 months of treatment. (h)–(n) Show the changes in the number of HF in OCTA during the treatment with multimodal treatment for the left eye. Among them: (h) number of HF shown in OCTA before the treatment with multimodal treatment is 22.63/mm2. (i) The number of HF is 27.72/mm2 after 1 month of treatment. (j) The number of HF is 22.26/mm2 after 2 months of treatment. (k) The number of HF is 15.69/mm2 after 3 months of treatment. (l) The number of HF is 14.52/mm2 after 6 months of treatment. (m) The number of HF is 9.468/mm2 after 12 months of treatment. (n) The number of HF is 4.18/mm2 after 24 months of treatment.
-
Group X ± S p Age (years) Standalone treatment 56.960 ± 11.220 0.277 Multimodal treatment 60.080 ± 10.329 Height (m) Standalone treatment 1.641 ± 0.073 0.250 Multimodal treatment 1.618 ± 0.073 Weight (kg) Standalone treatment 61.333 ± 12.294 0.962 Multimodal treatment 61.750 ± 13.642 Body mass index
(BMI) (kg/m2)Standalone treatment 22.611 ± 3.574 0.465 Multimodal treatment 23.351 ± 3.587 Duration of diabetes (years) Standalone treatment 10.000 ± 5.650 0.857 Multimodal treatment 9.710 ± 4.112 Table 1.
Basic information of the patients.
-
Review time
(months)PPV + Anti-VEGF Anti-VEGF N (%) χ2 p N (%) χ2 p Baseline 12 (92.3%) − − 11 (47.8%) − − 1 12 (92.3%) < 0.001 1 10 (43.5%) 0.088 0.767 2 11 (84.6%) < 0.001 1 13 (56.5%) 0.348 0.555 3 8 (61.5%) 1.95 0.163 9 (39.1%) 0.354 0.552 6 6 (46.2%) 4.514 0.034* 8 (34.8%) 0.807 0.369 9 4 (30.8%) 10.4 0.001** 8 (34.8%) 0.807 0.369 12 5 (38.5%) 6.118 0.013* 9 (39.1%) 0.354 0.552 15 5 (38.5%) 6.118 0.013* 11 (47.8%) < 0.001 1 18 2 (15.4%) 15.476 < 0.001*** 8 (34.8%) 0.807 0.369 21 3 (23.1%) 12.764 < 0.001*** 6 (26.1%) 2.333 0.127 24 3 (23.1%) 12.764 < 0.001*** 5 (21.7%) 3.45 0.063 *: < 0.05, **: < 0.01, ***: < 0.001. Table 2.
Comparison of the incidence rates of DRIL between the two groups during the follow-up period and at the first diagnosis within each group.
Figures
(5)
Tables
(2)