-
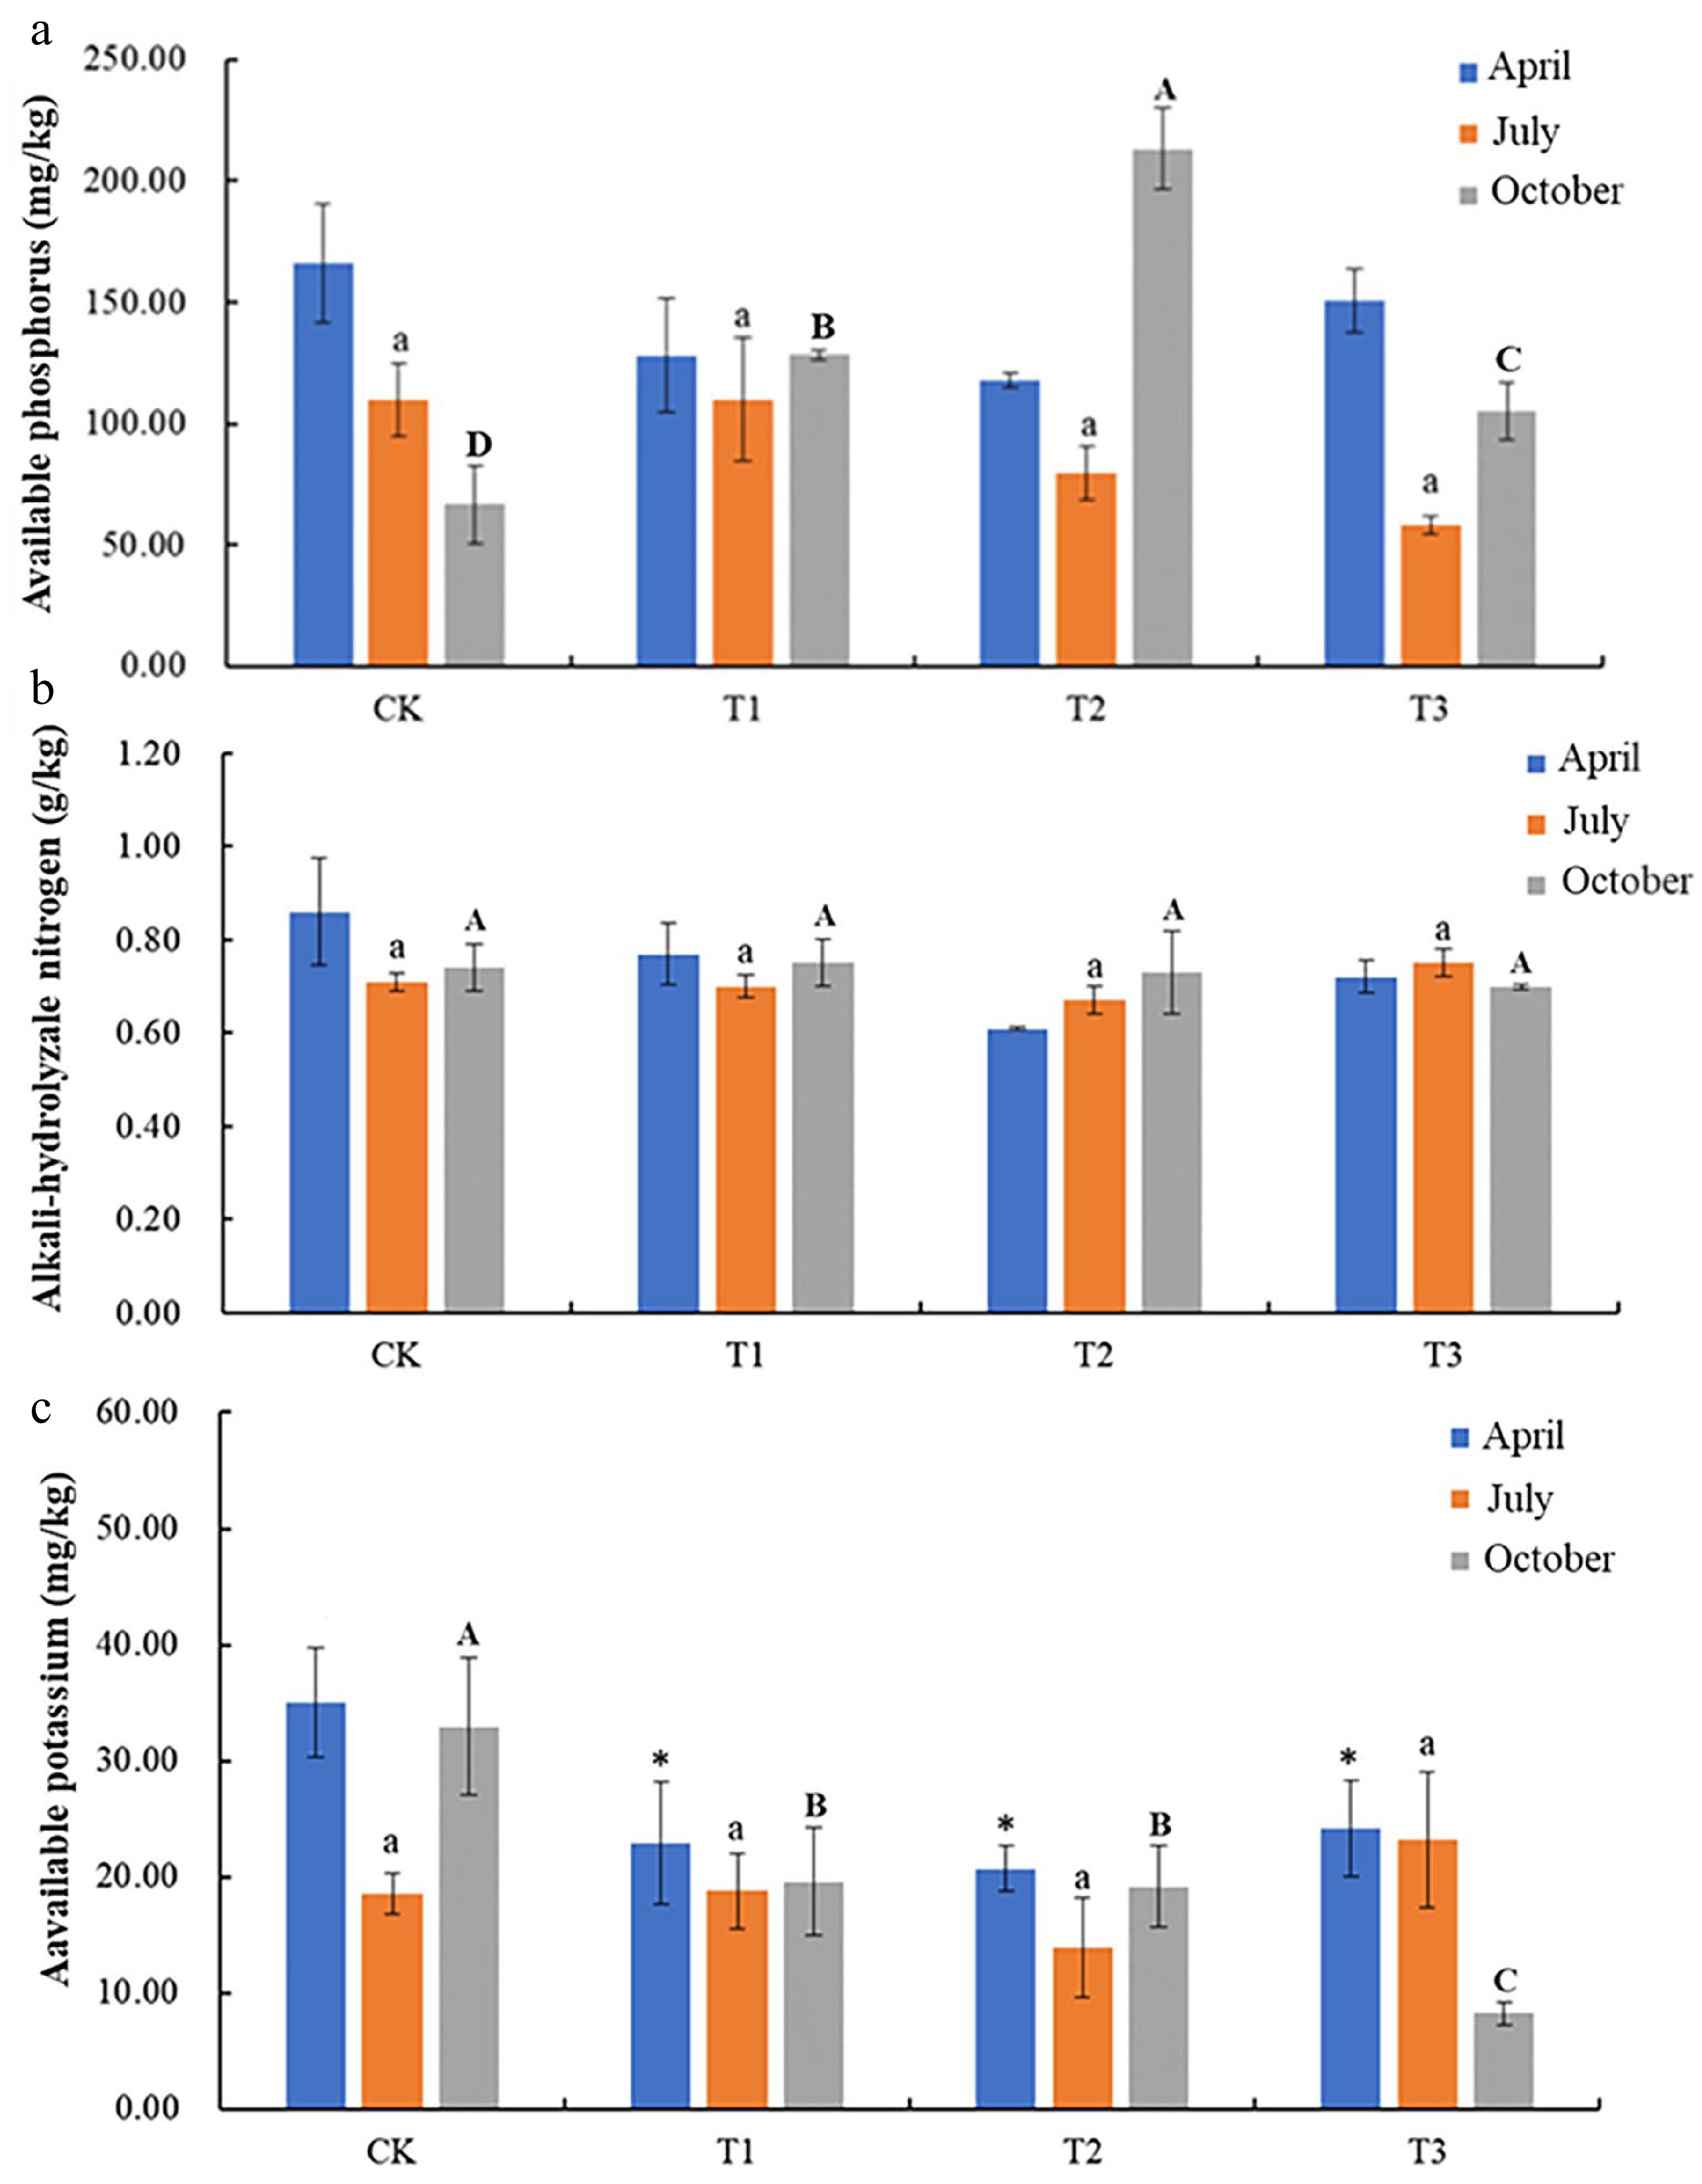
Figure 1.
Changes in soil contents of (a) AP, (b) alkali-hydrolyzable nitrogen, and (c) available K, under intercropping of peanut, stylosanthes, and hyacinth bean. Error bar represents standard deviation (SD). According to Duncan test, '*' represents soil available potassium content of different treatment in April has significant differences (p < 0.05); different lowercase letters represent soil available potassium content of different treatment in July has significant differences (p < 0.05); different capital letters represent soil available potassium content of different treatment in October has significant differences (p < 0.05).
-
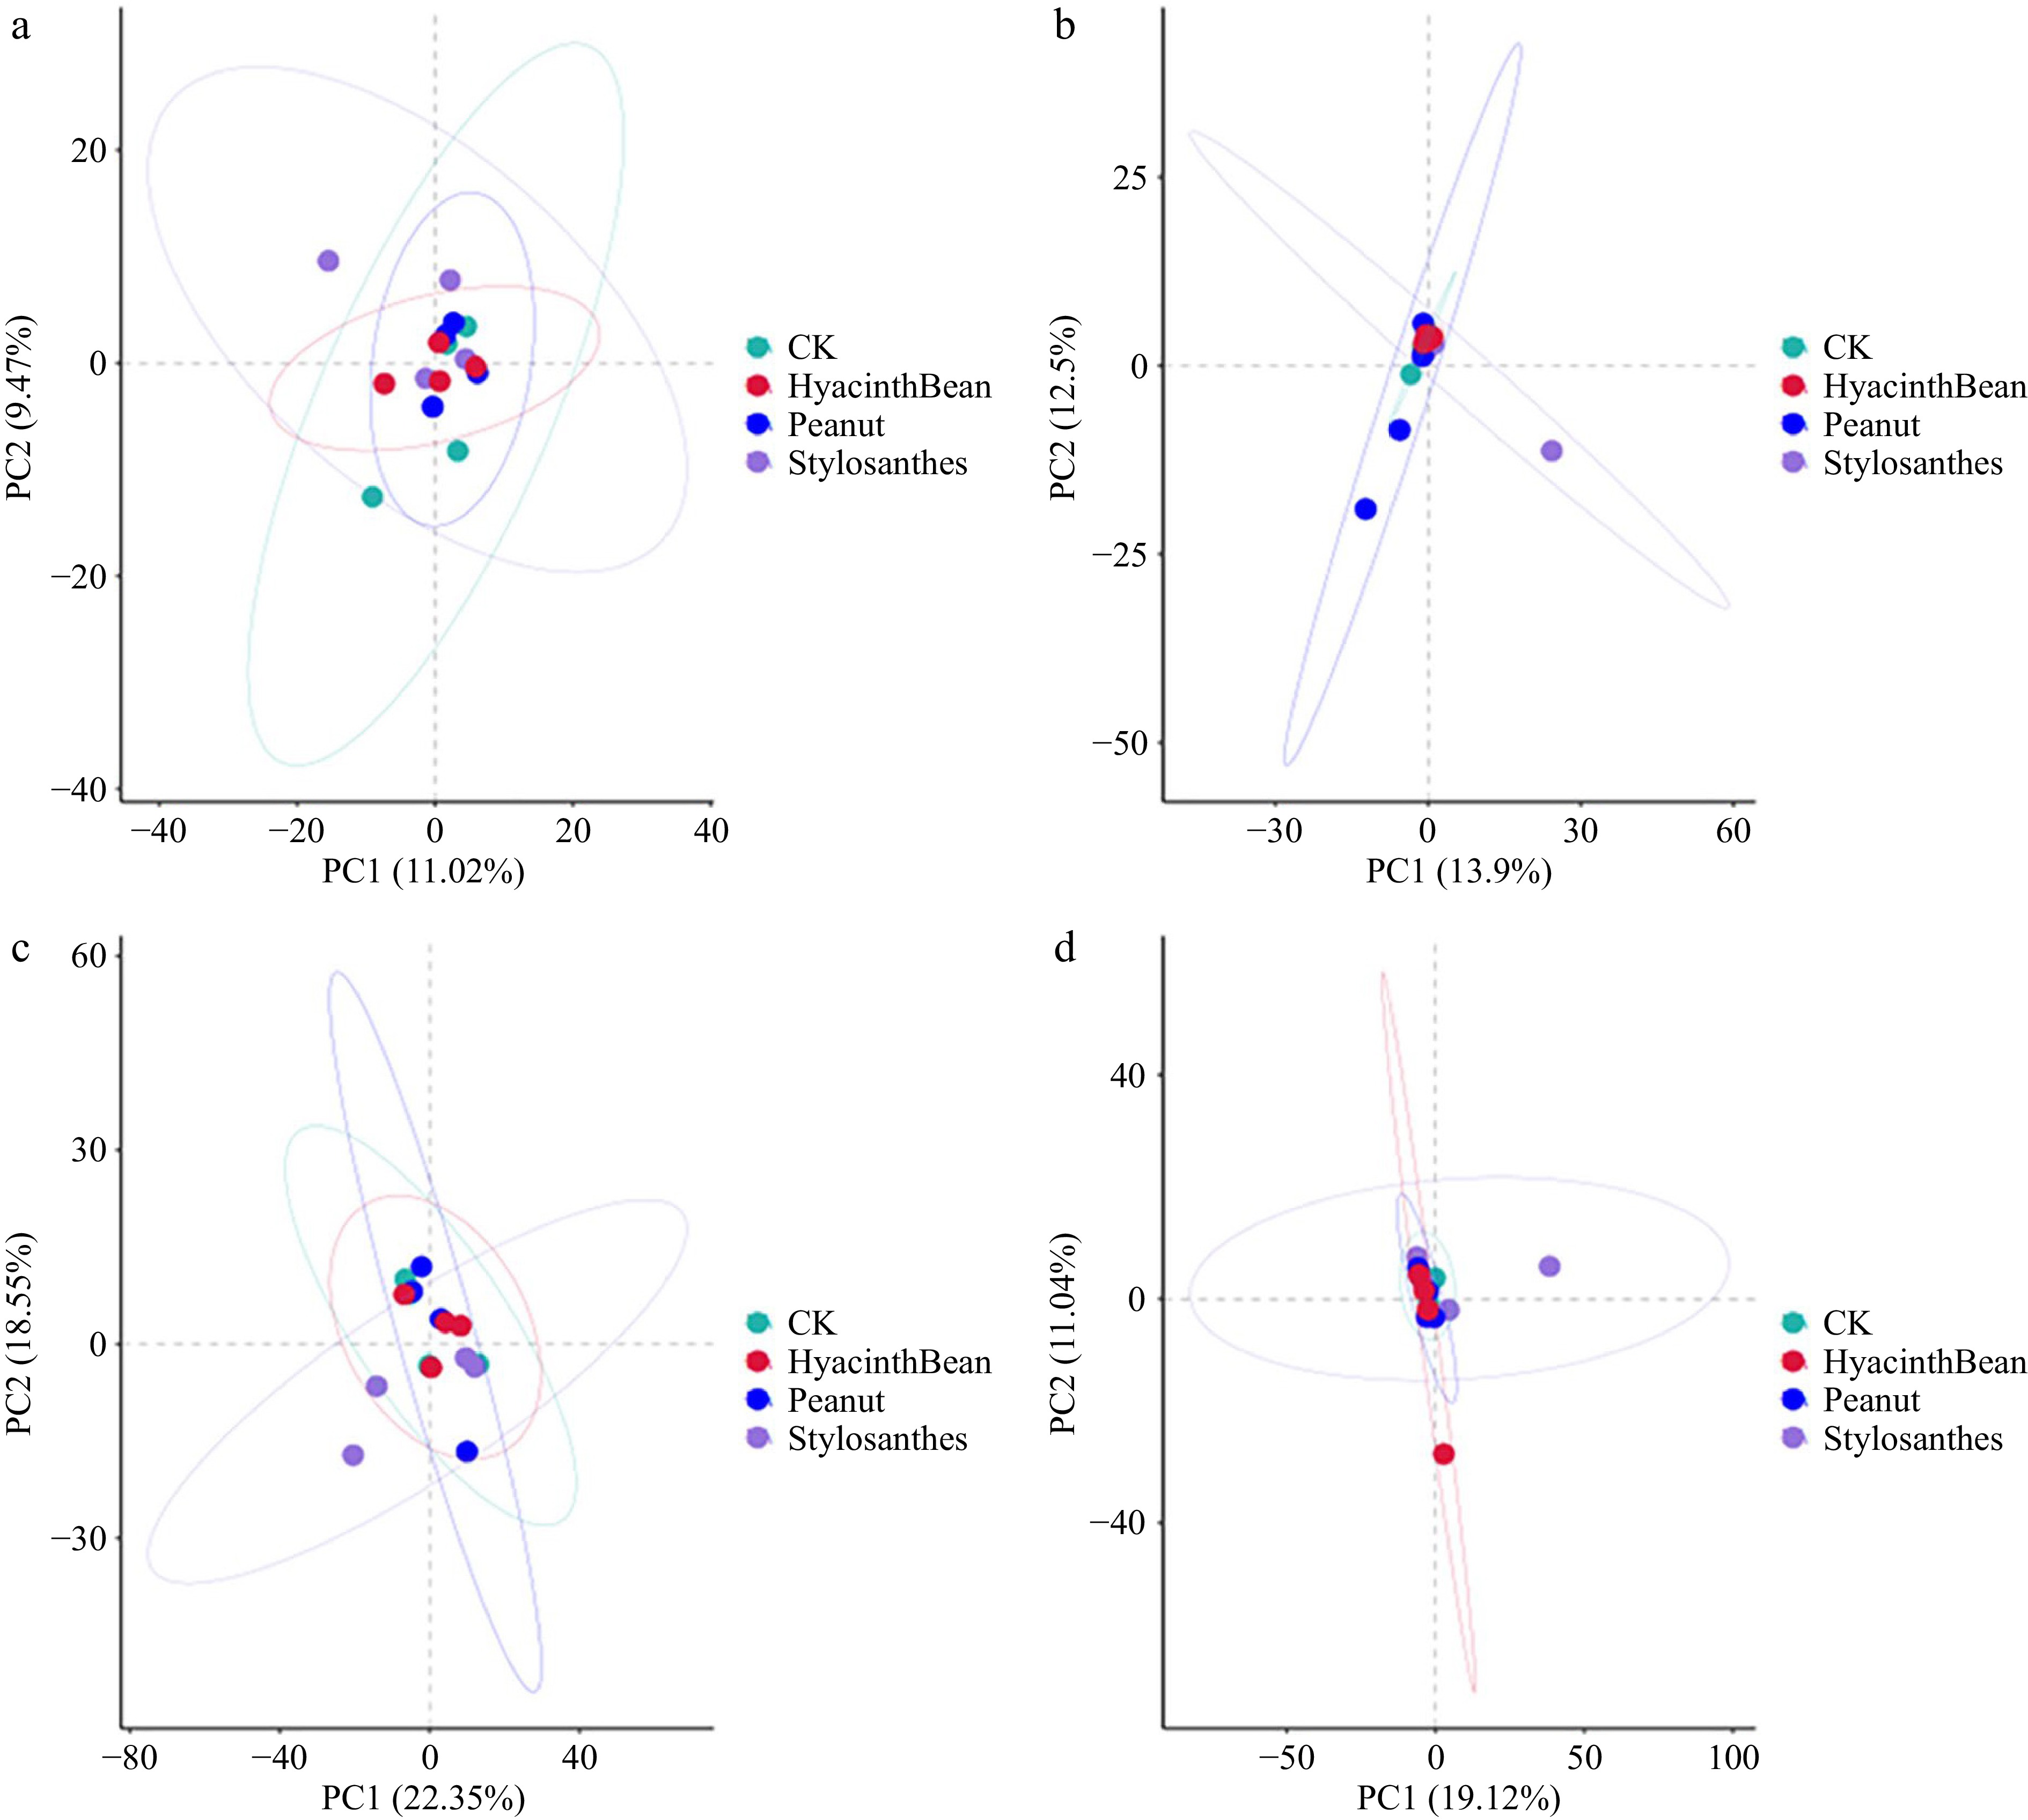
Figure 2.
Principal component analysis (PCA) analysis of microbial community. (a) Bacterial communities in tubers. (b) Fungal communities in tubers. (c) Bacterial communities in the rhizosphere soil. (d) Fungal communities in the rhizosphere soil.
-
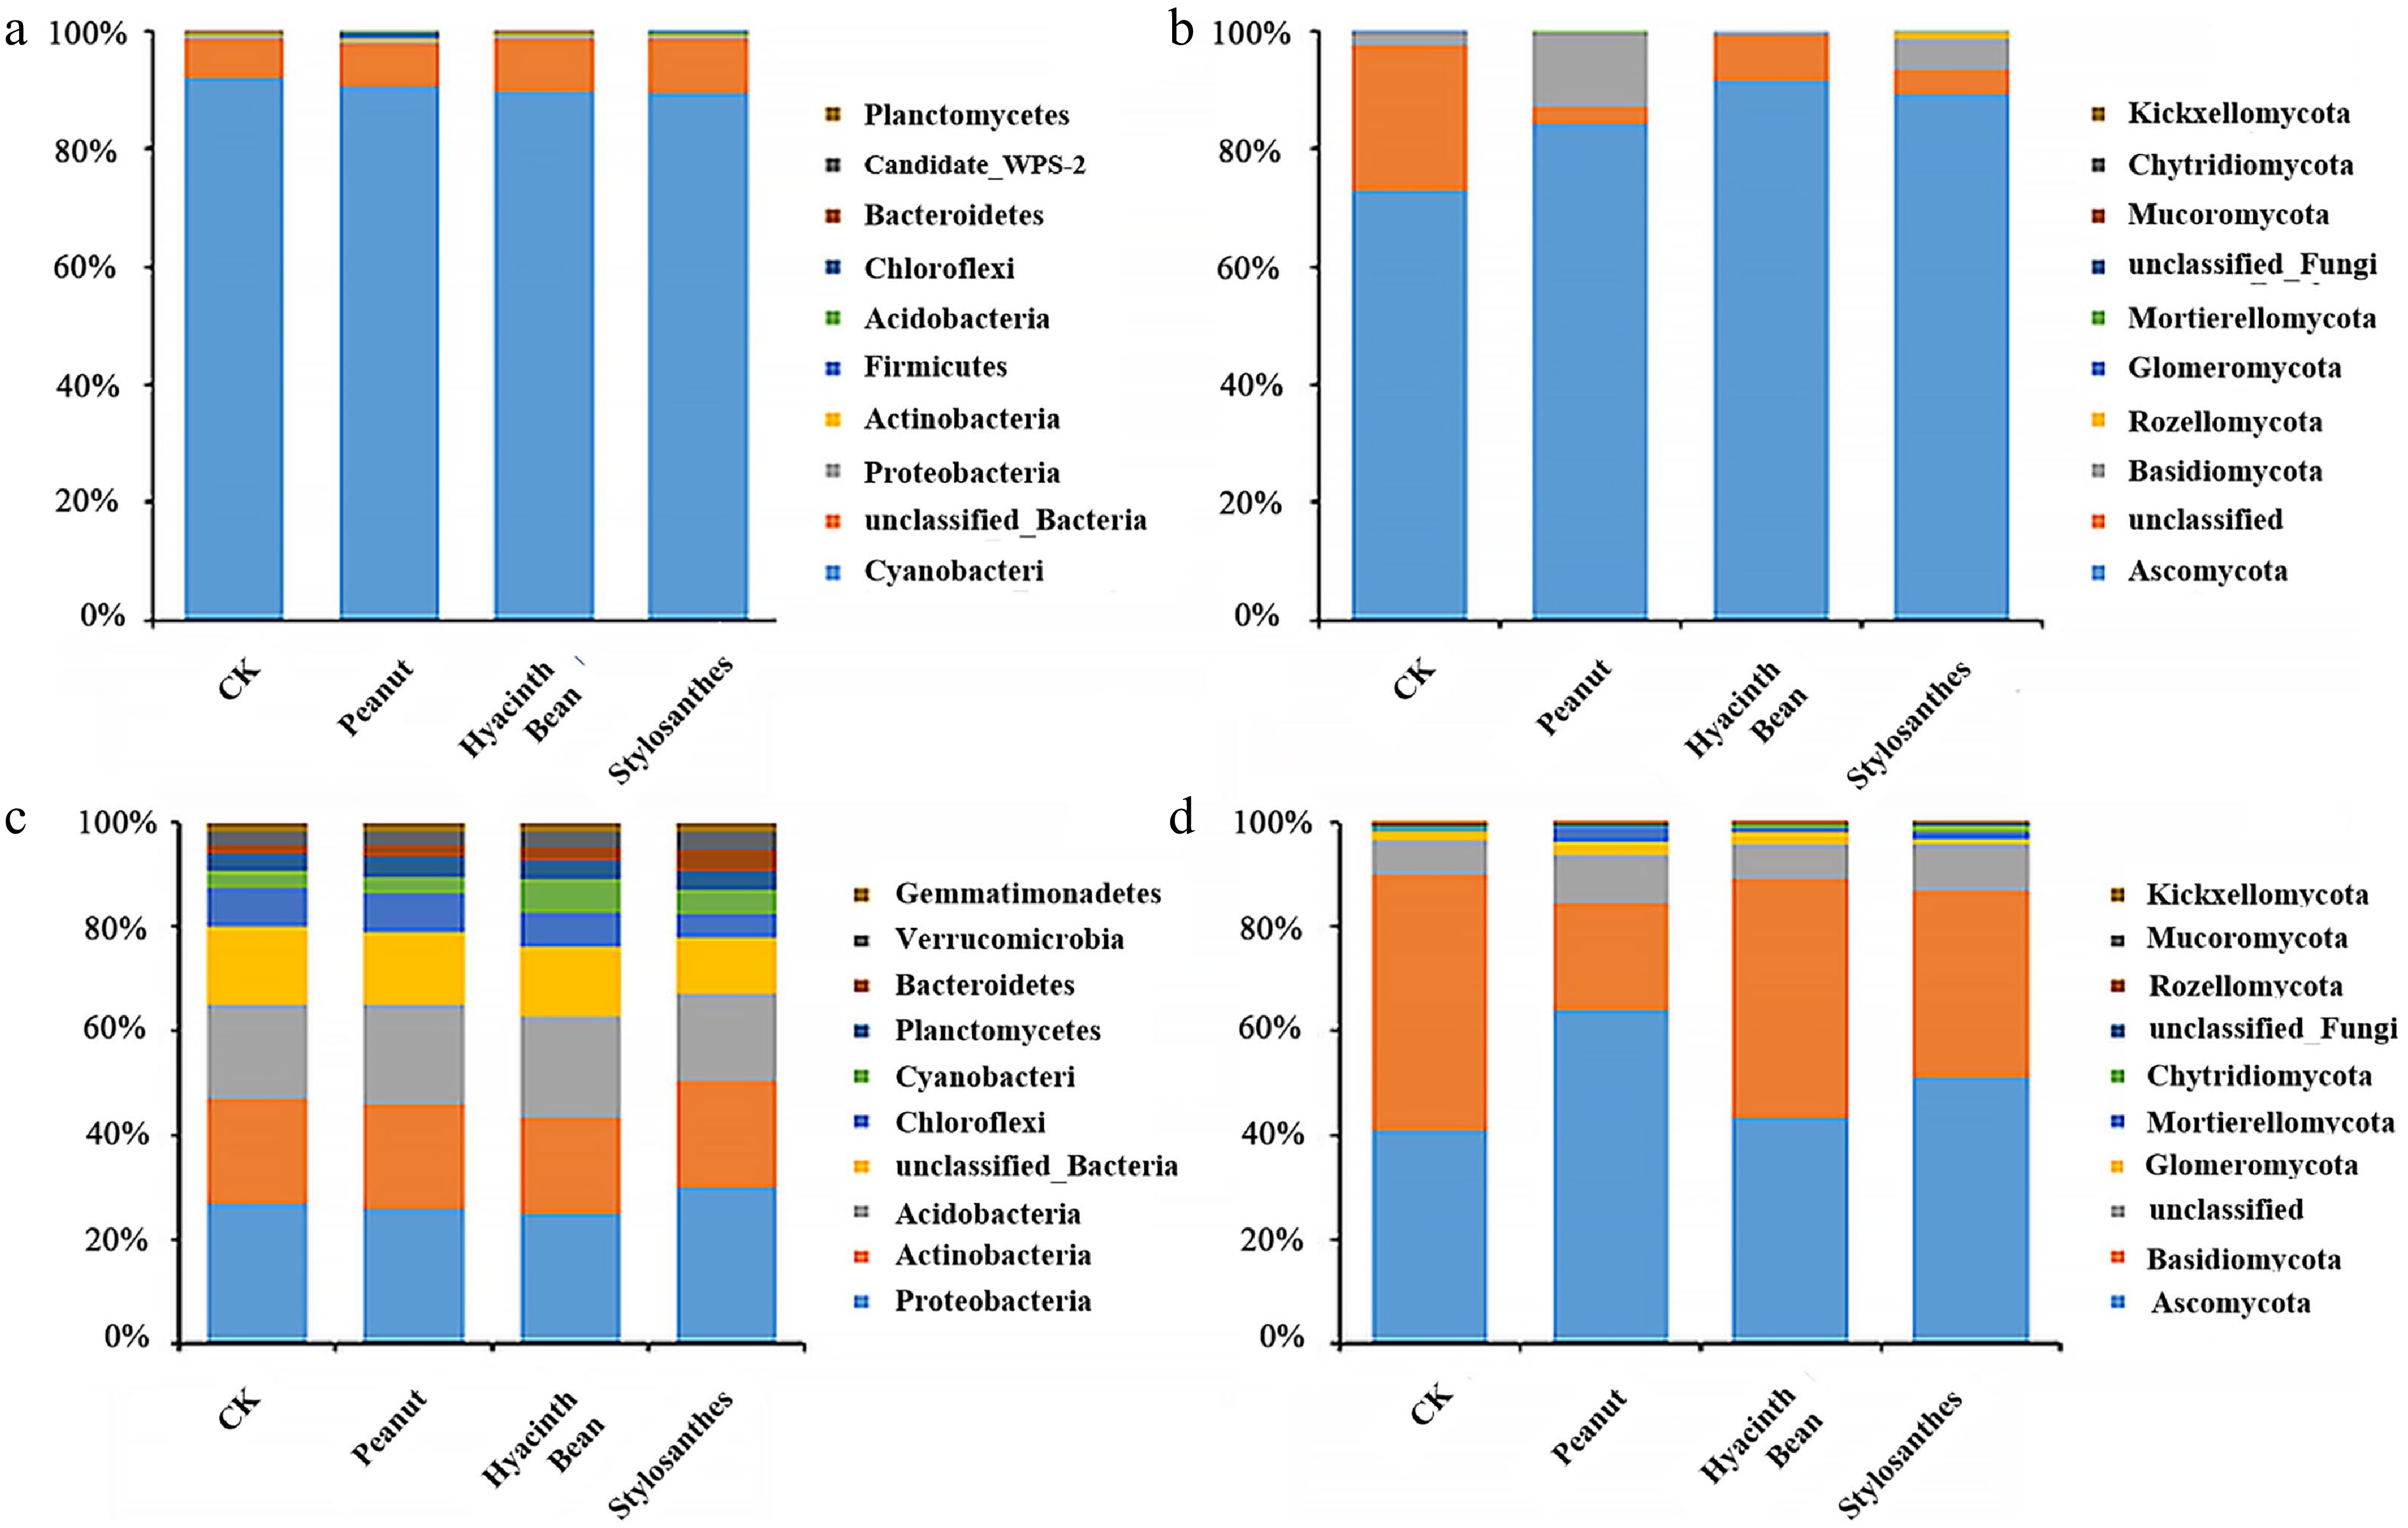
Figure 3.
Histogram of the relative abundances at the phylum level of the top ten bacterial and fungal communities in tubers and the rhizosphere soil of different intercropping modes. (a) Bacterial communities in tubers. (b) Fungal communities in tubers. (c) Bacterial communities in the rhizosphere soil. (d) Fungal communities in the rhizosphere soil.
-
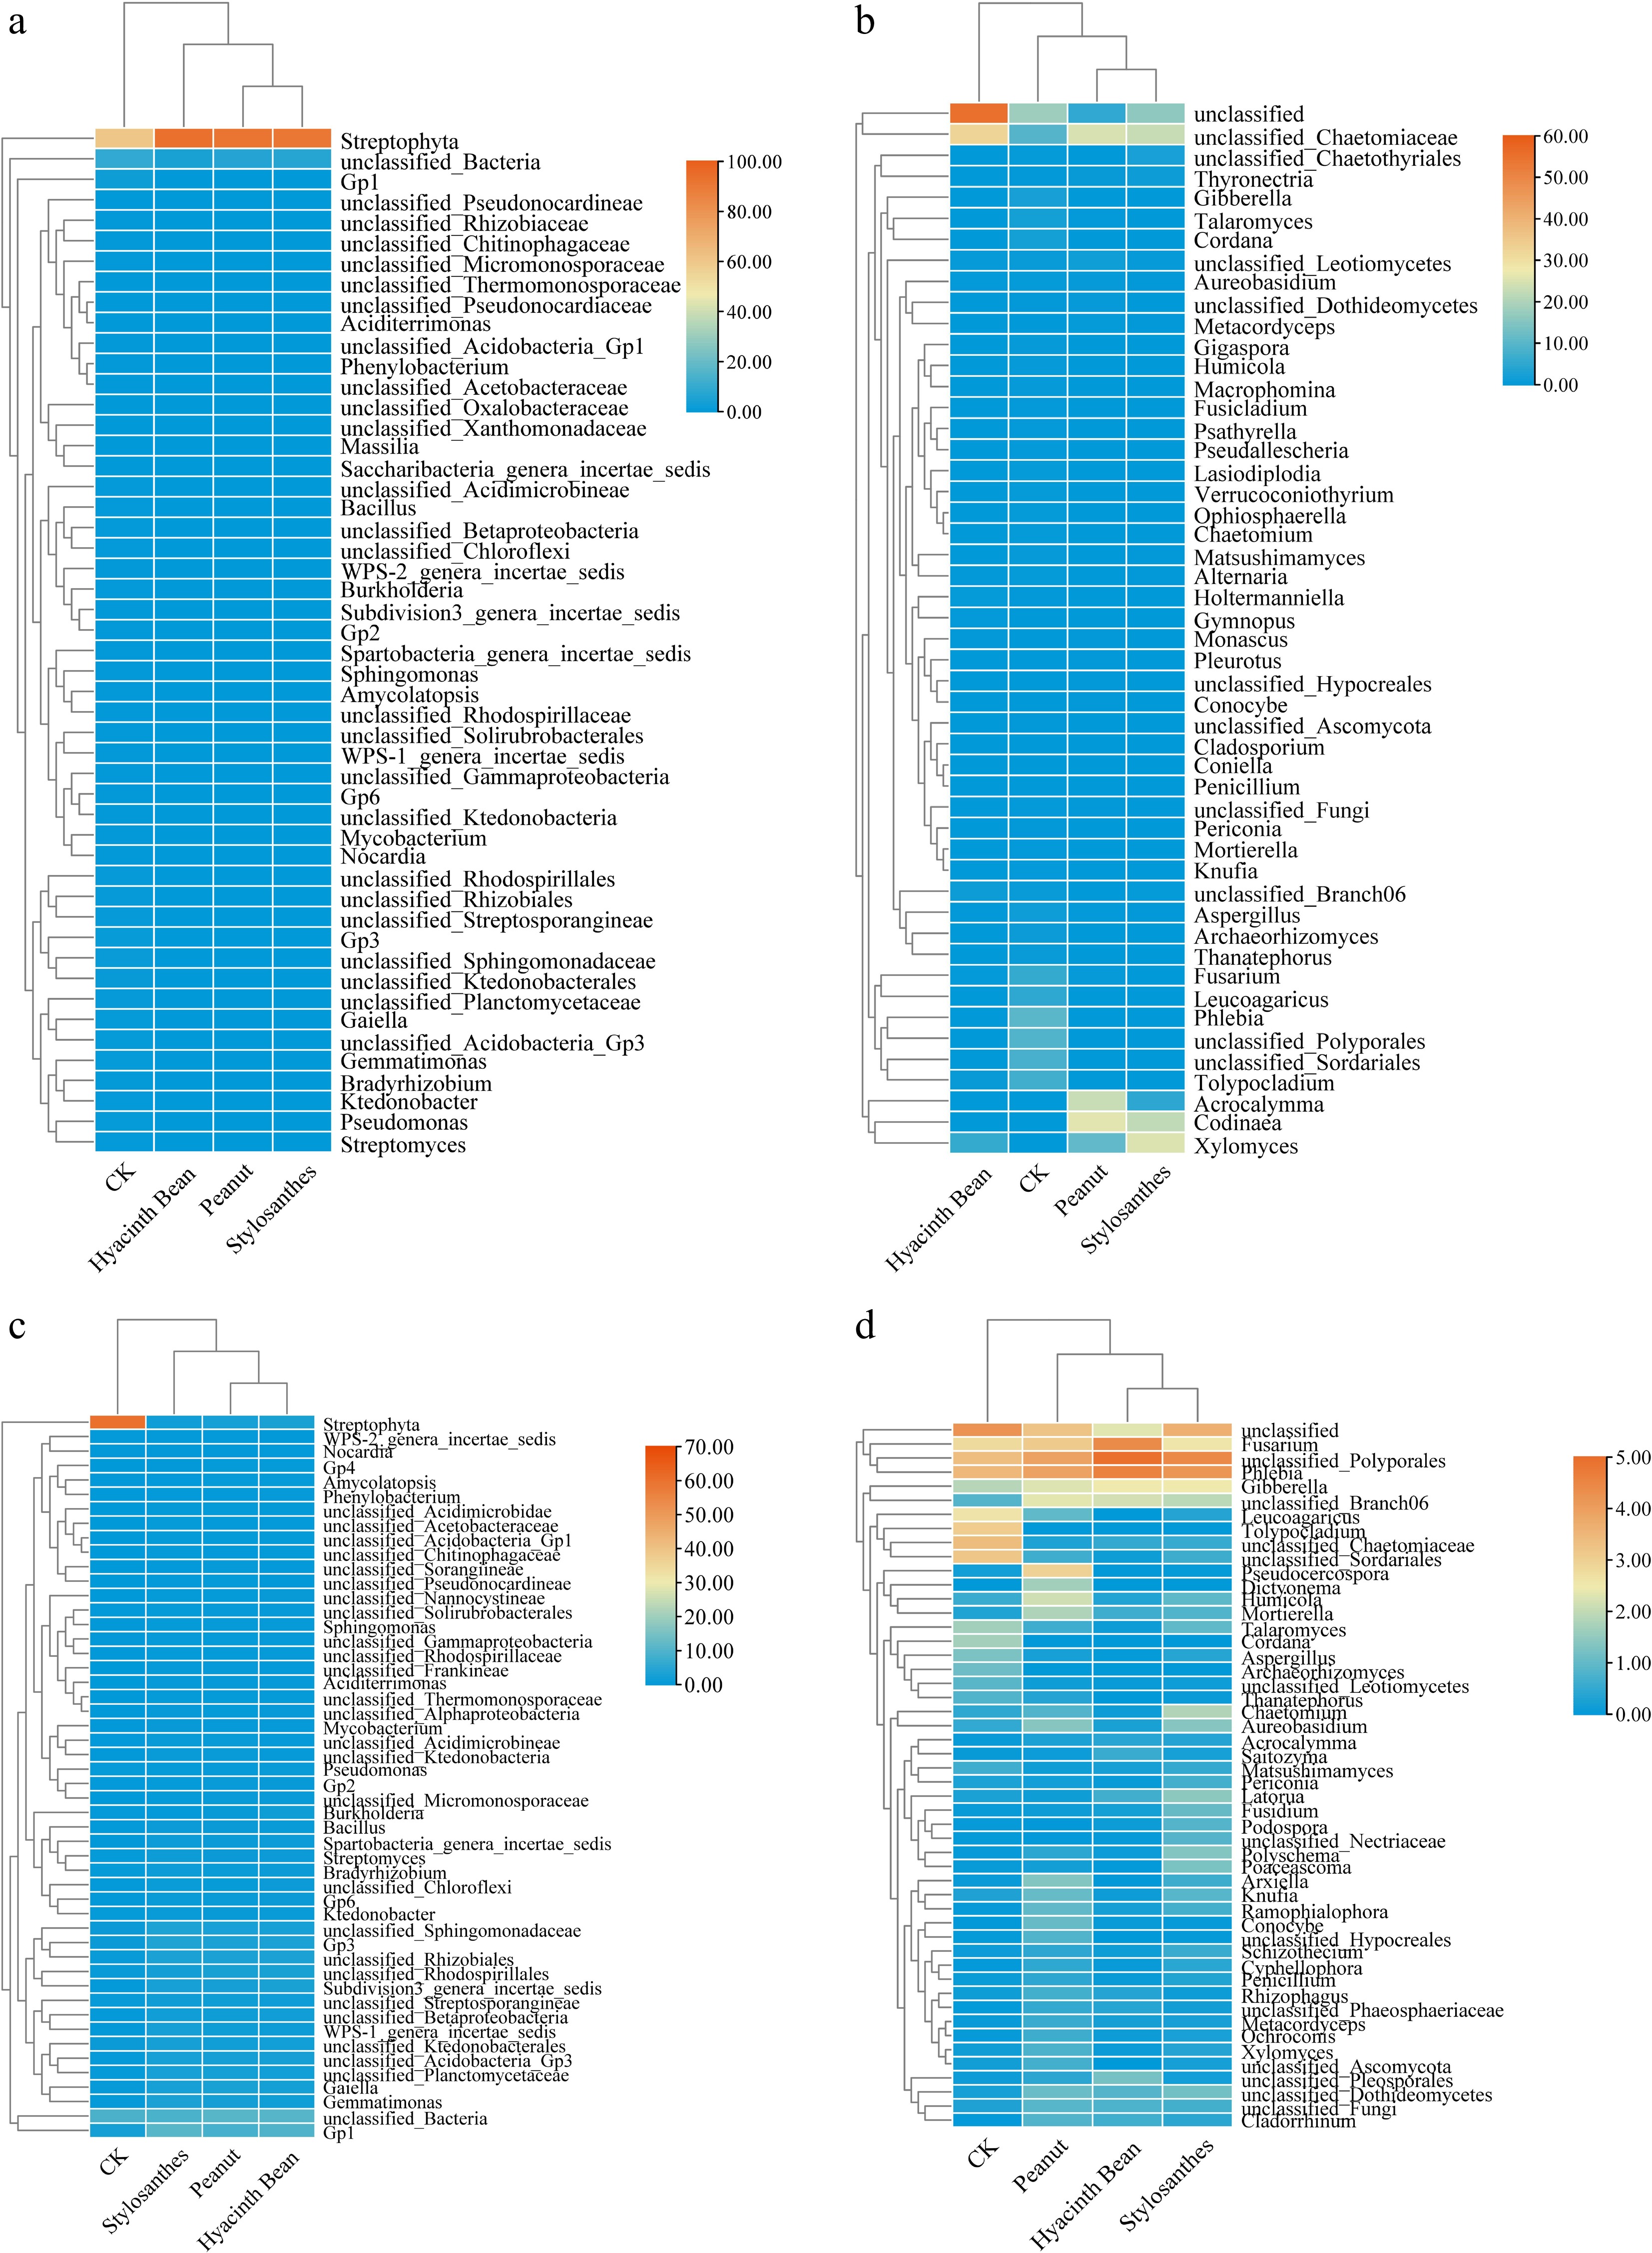
Figure 4.
Heatmap of the relative abundances at the genus level of the top 50 bacterial communities in the tubers and the rhizosphere soil of different intercropping treatments. (a) Bacterial communities in tubers. (b) Fungal communities in tubers. (c) Bacterial communities in the rhizosphere soil. (d) Fungal communities in the rhizosphere soil.
-
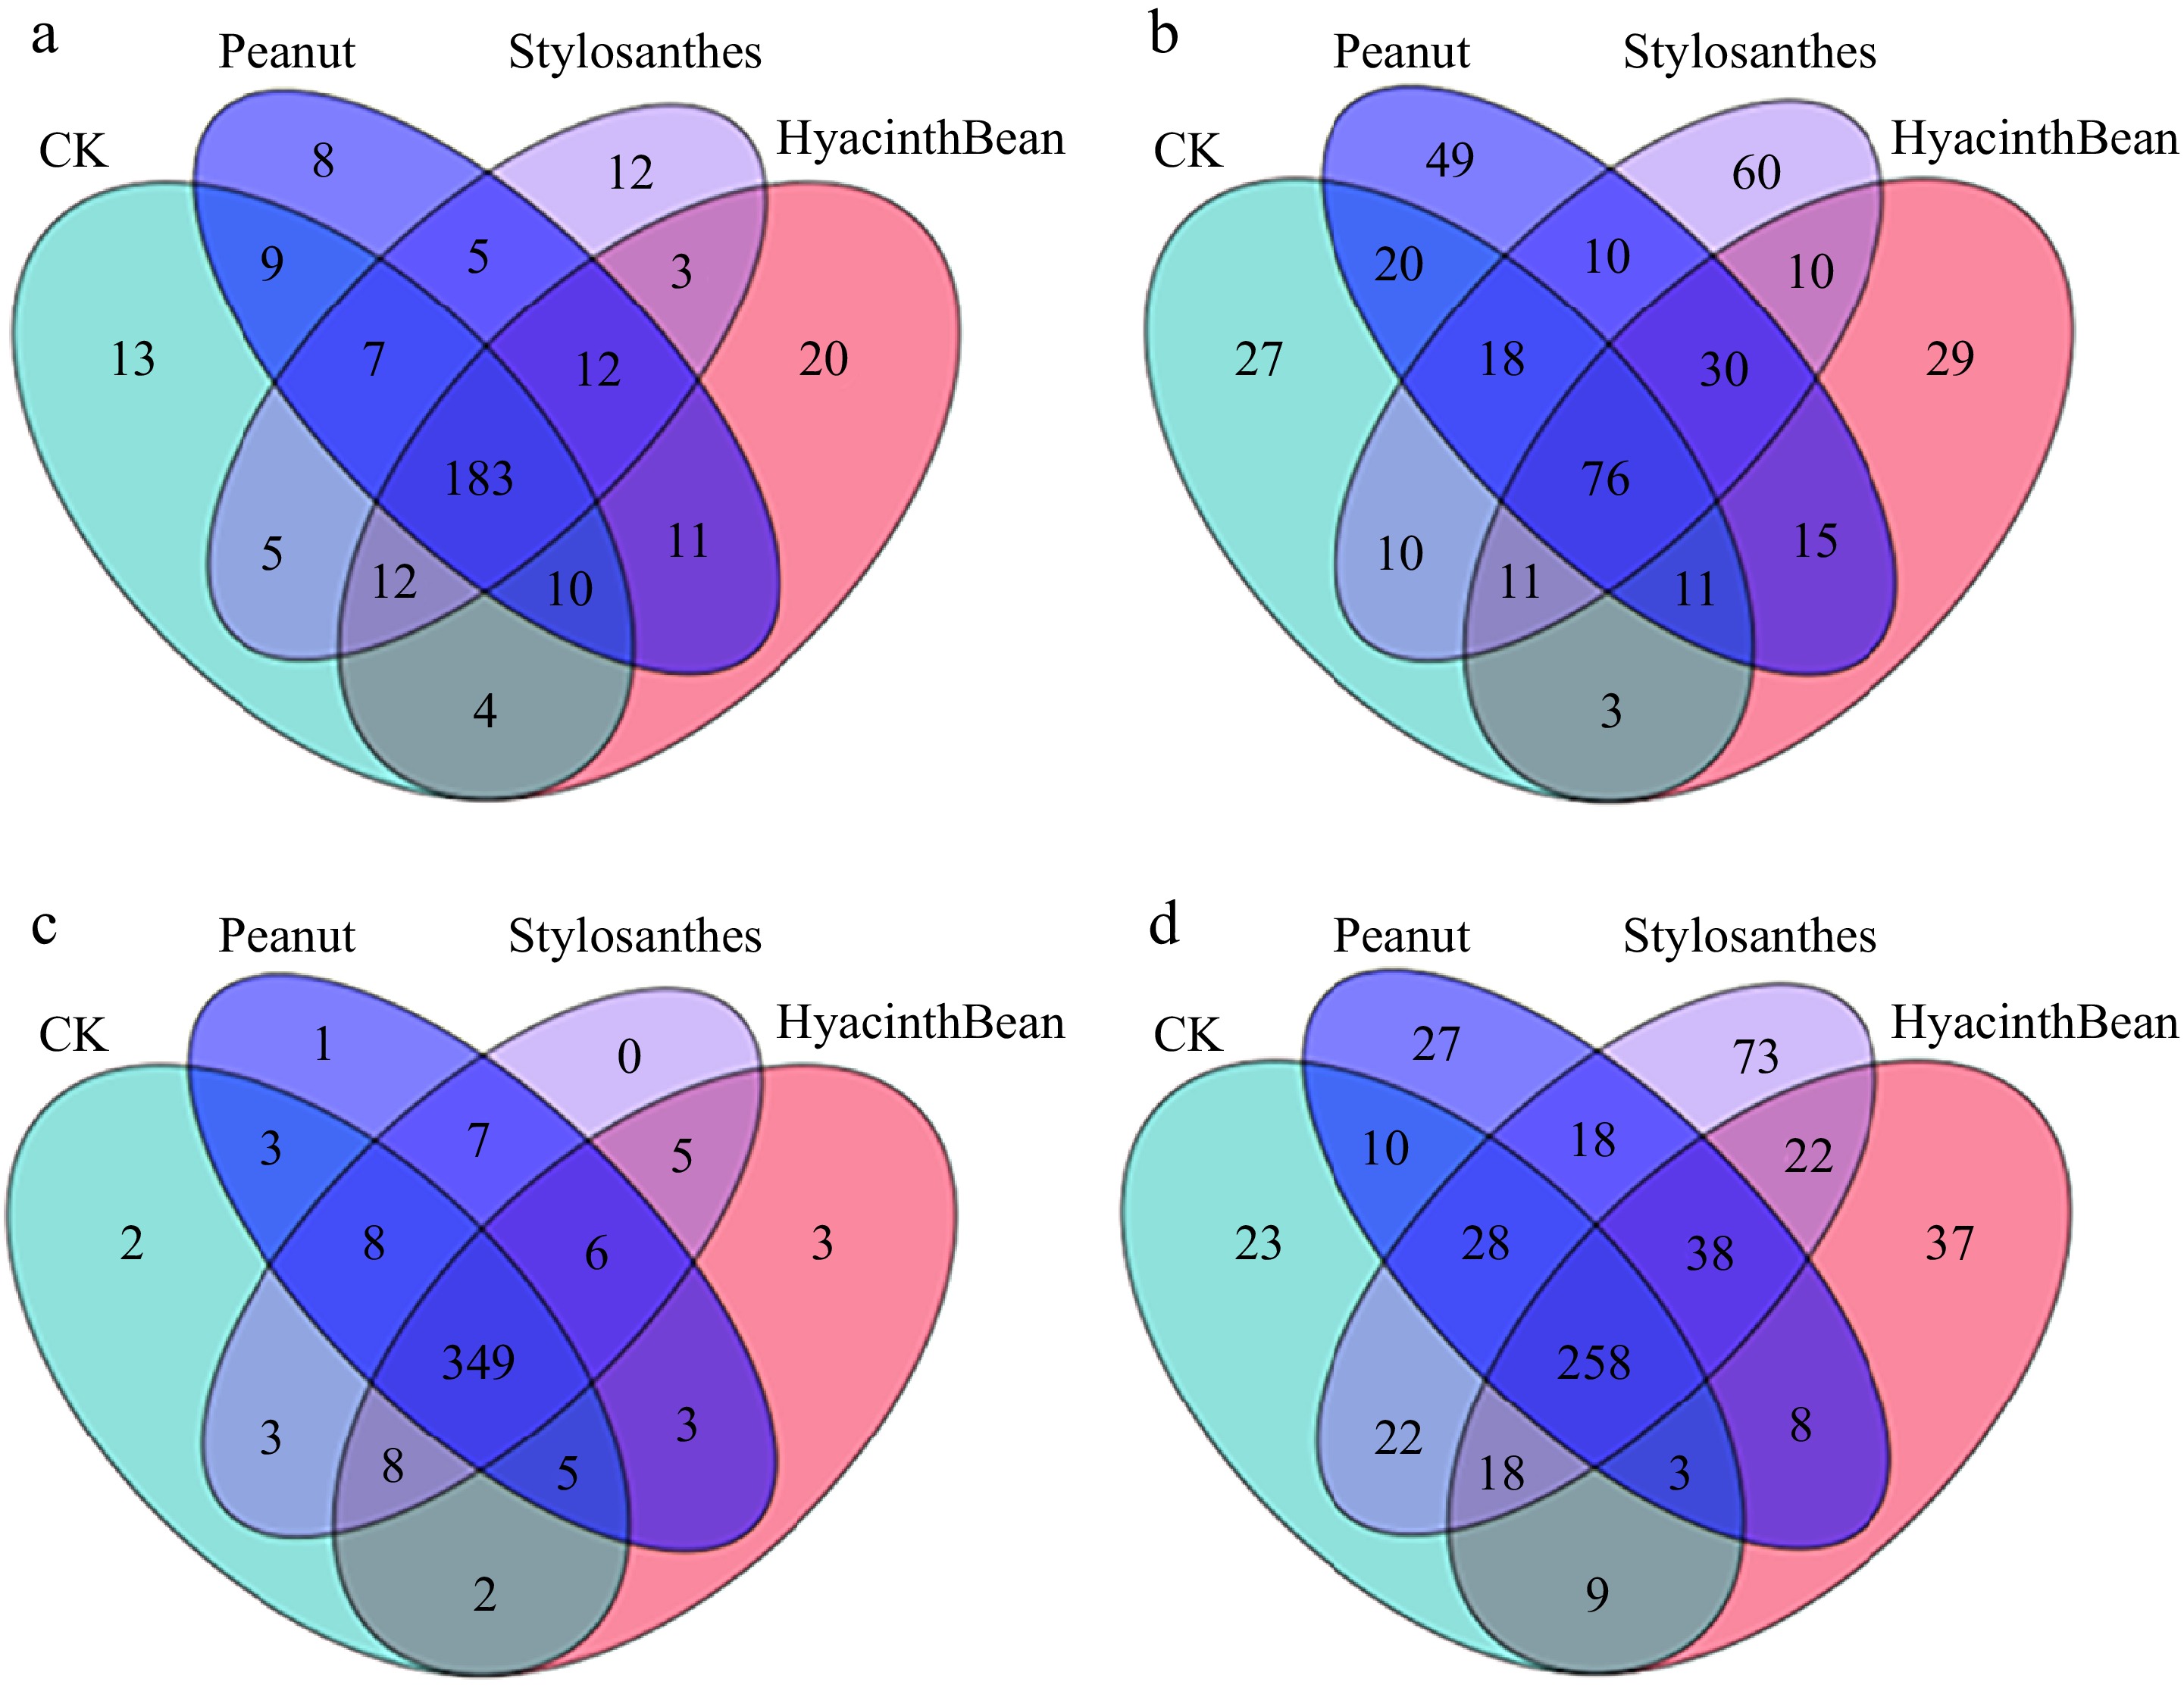
Figure 5.
Number of bacterial and fungal genera in the tuberous roots and the rhizosphere soil of different intercropping modes. (a) Bacterial communities in tubers. (b) Fungal communities in tubers. (c) Bacterial communities in the rhizosphere soil. (d) Fungal communities in the rhizosphere soil.
-
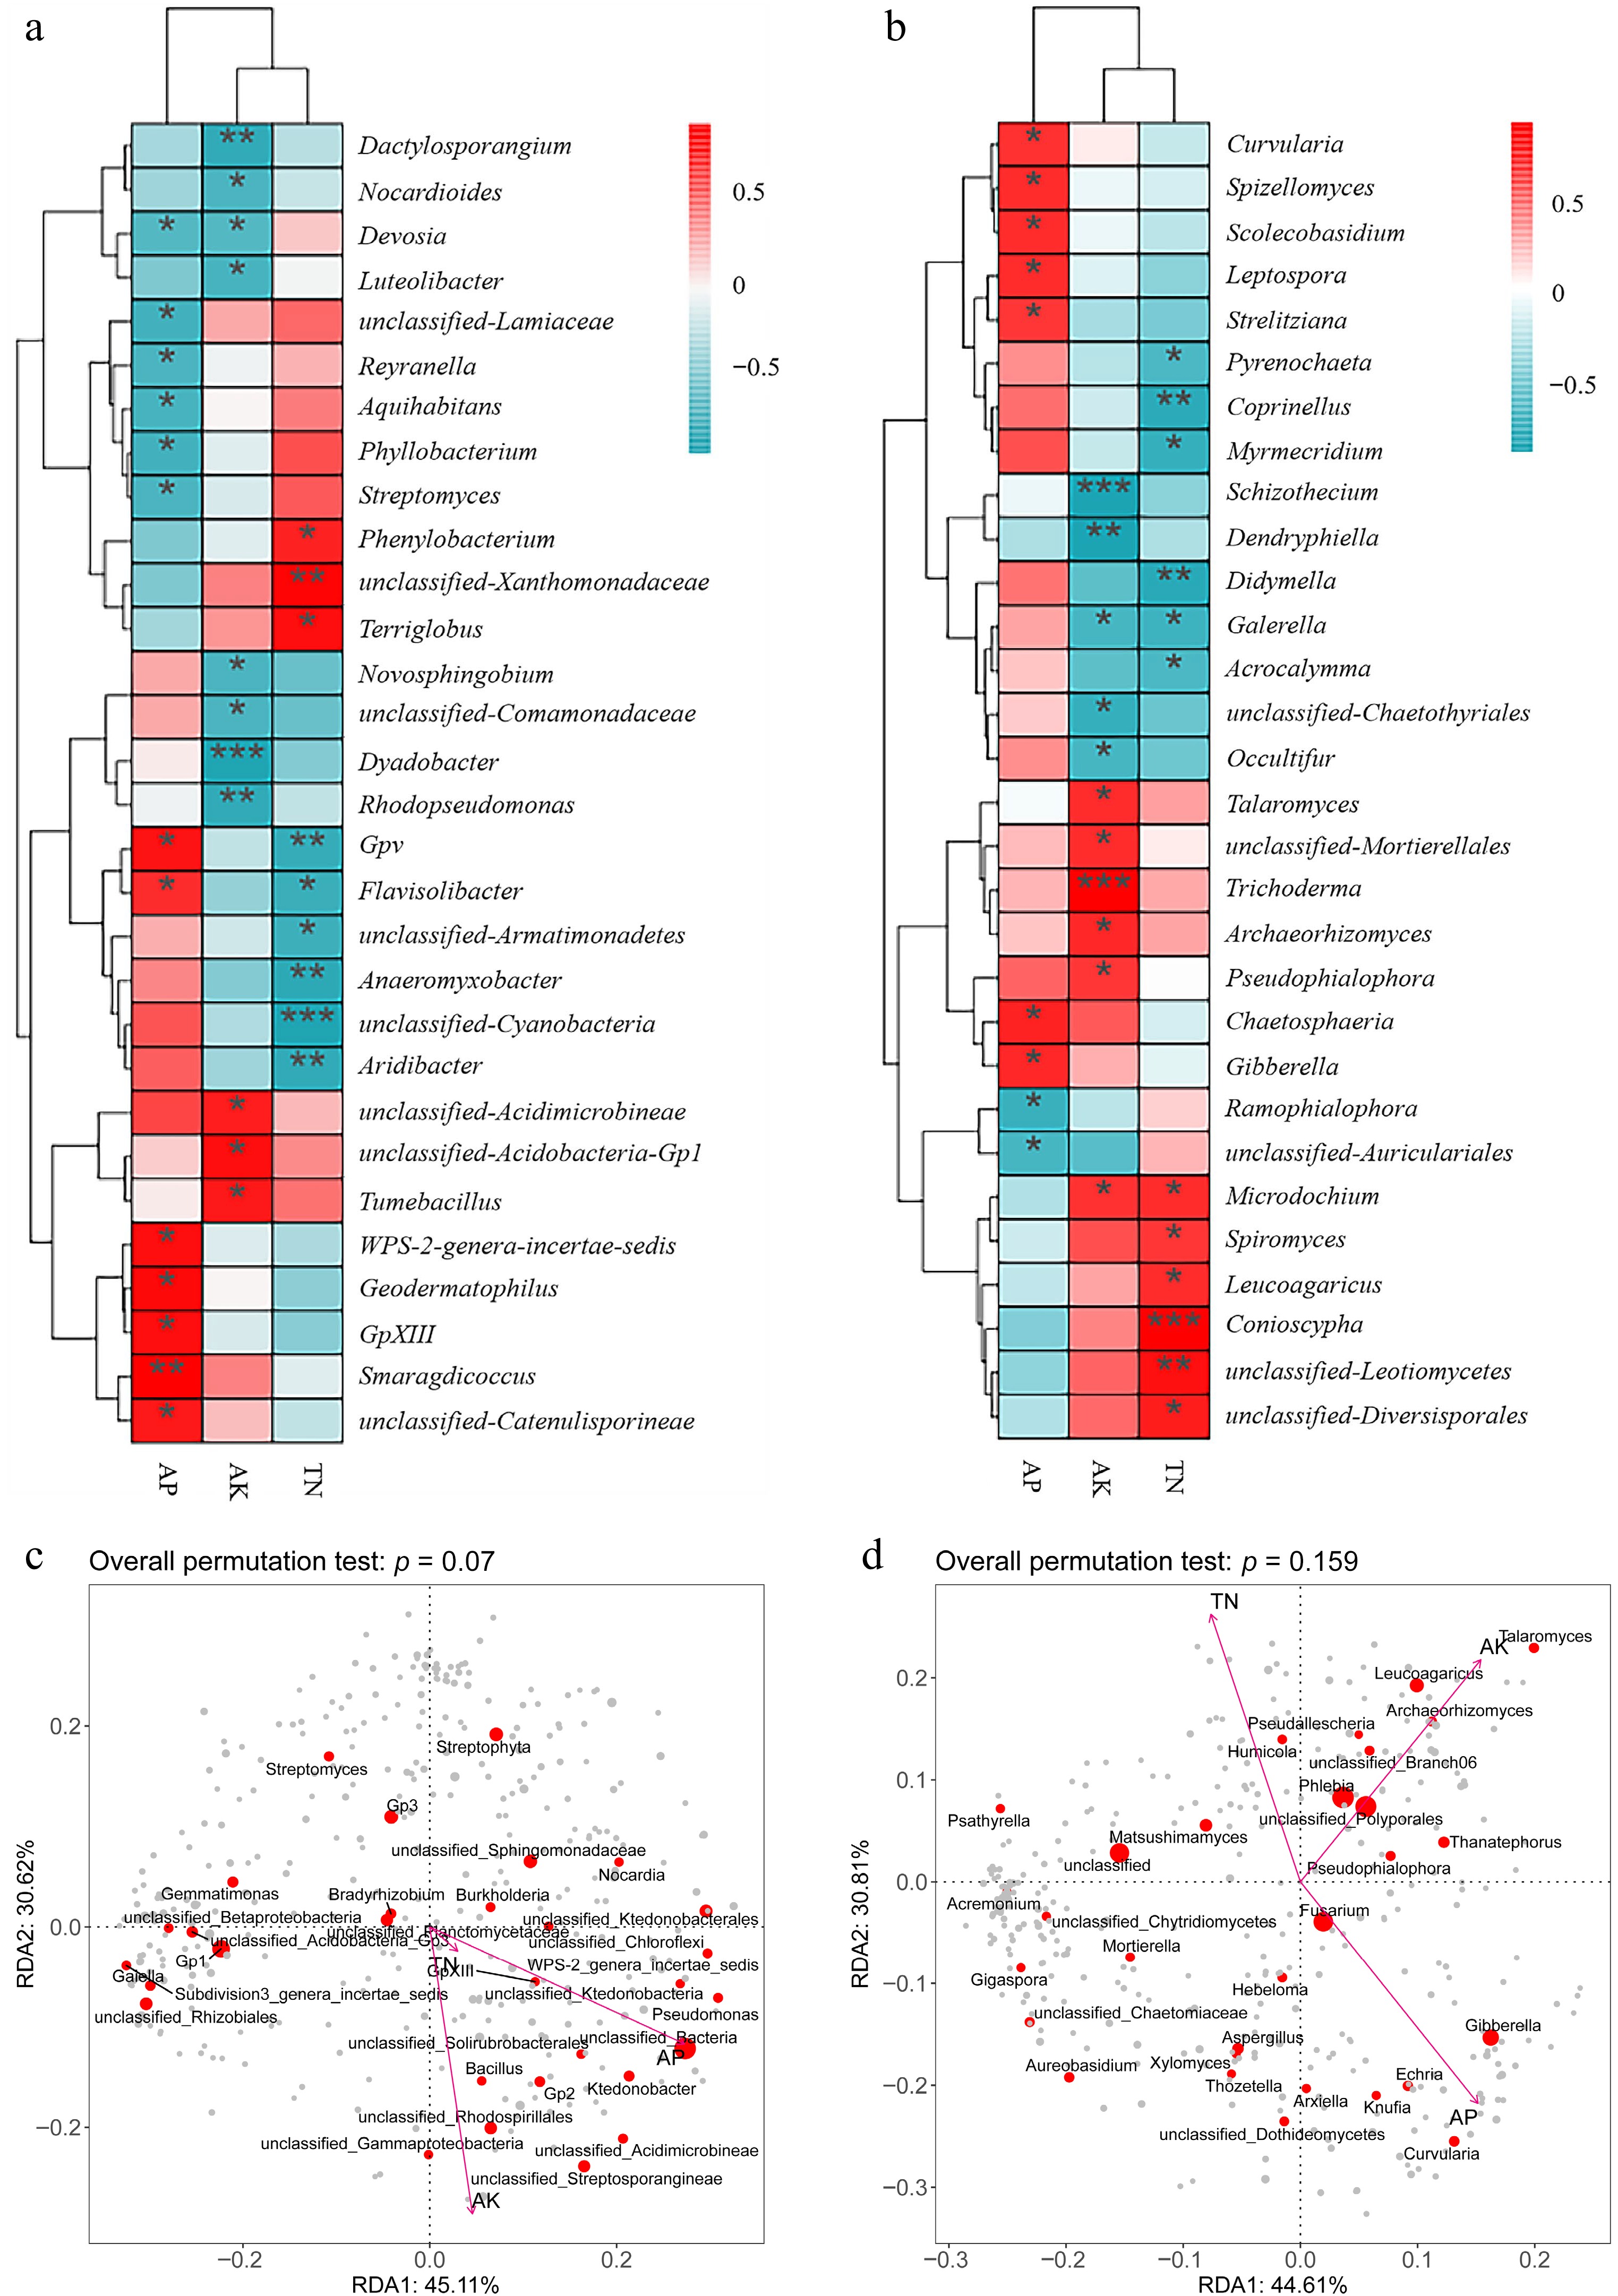
Figure 6.
Correlation analysis. (a) Bacterial communities in the rhizosphere soil. (b) Fungal communities in the rhizosphere soil and RDA redundancy analysis. (c) Bacterial communities in the rhizosphere soil. (d) Fungal communities in the rhizosphere soil of rhizosphere microorganisms and rhizosphere soil fertility in cassava after intercropping with different legumes. Asterisks indicate significant differences in correlation (ANOVA, FDR-corrected LSMeans, *, p < 0.05; **, p < 0.01; ***, p < 0.001).
-
Number Moisture content Ash content Starch content CK 5.32 ± 0.13 a 1.54 ± 0.04 b 69.03 ± 25.54 b T1 4.91 ± 0.33 b 2.30 ± 0.03 a 84.42 ± 13.10 a T2 4.11 ± 0.17 b 2.07 ± 0.04 ab 70.31 ± 15.04 b T3 5.26 ± 0.16 a 2.28 ± 0.02 ab 75.36 ± 17.81 ab CK: Monoculture; T1: cassava-peanuts; T2: cassava-Macrotyloma 'Yazhou'; T3: cassava-Stylosanthes. Different lowercase letters represent contents of solid matter of different treatments has significant differences (p < 0.05). Table 1.
Contents of solid matter in cassava after intercropping with different legumes (%).
Figures
(6)
Tables
(1)