-
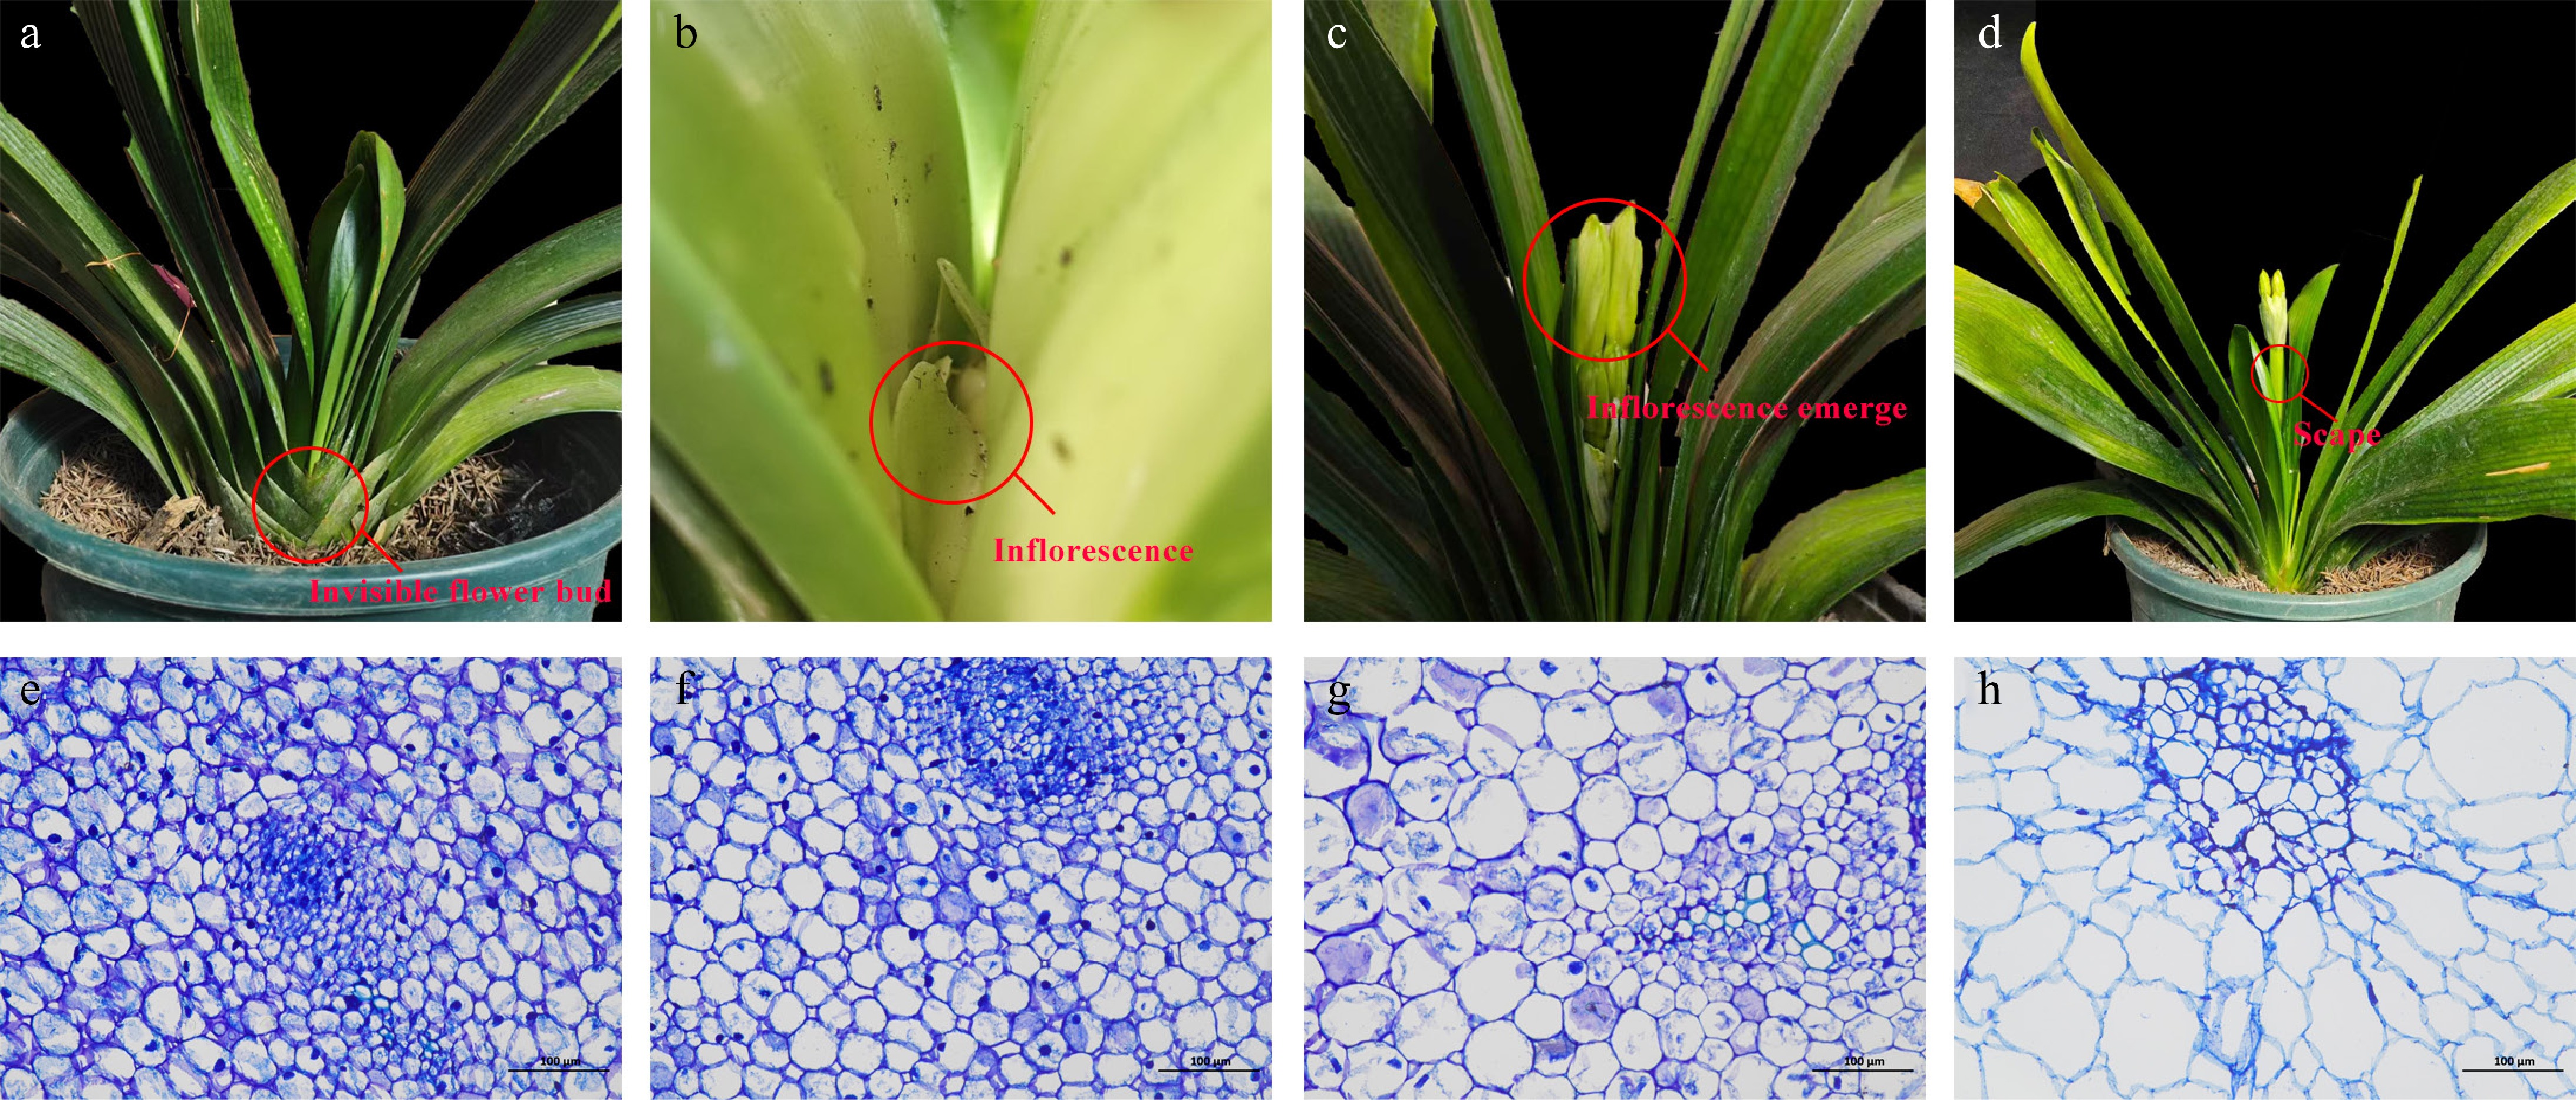
Figure 1.
The four developmental stages before anthesis (a−d) and their corresponding paraffin sections (e−h) of C. miniata. (a), (e) Flower bud stage, CM_F, in which the flower bud is invisible. (b), (f) Inflorescence stage, CM_I, when the flower bud develops into a complete inflorescence but both the flower bud and inflorescence are invisible. (c), (g) Inflorescence emergence stage, CM_E, when the inflorescence is visible but the scape is invisible. (d), (h) Scape stage, CM_S, when the scape elongates and both the inflorescence and scape are visible.
-
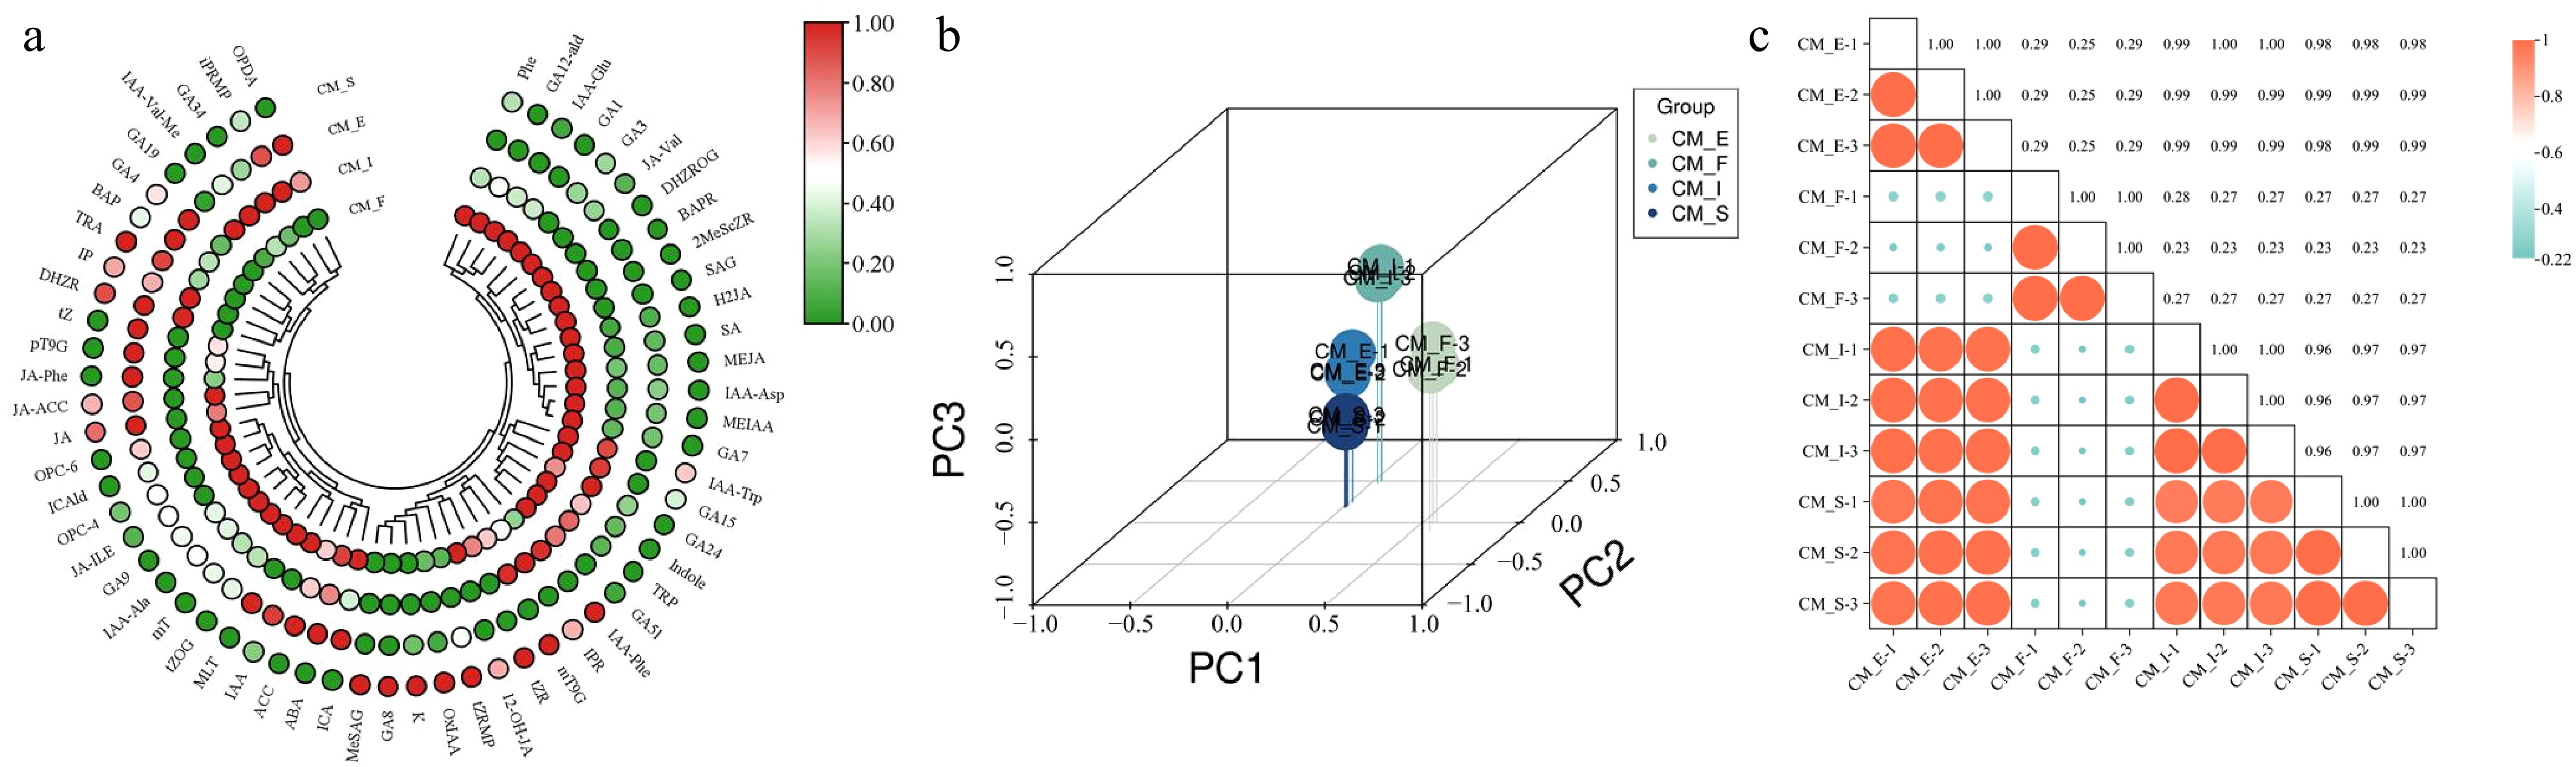
Figure 2.
Quality control analysis of hormone metabolomics in different stages of scape elongation in C. miniata. (a) Heatmap of hormone metabolites. (b) PCA score plot. (c) Pearson correlation matrix of phenotypes.
-
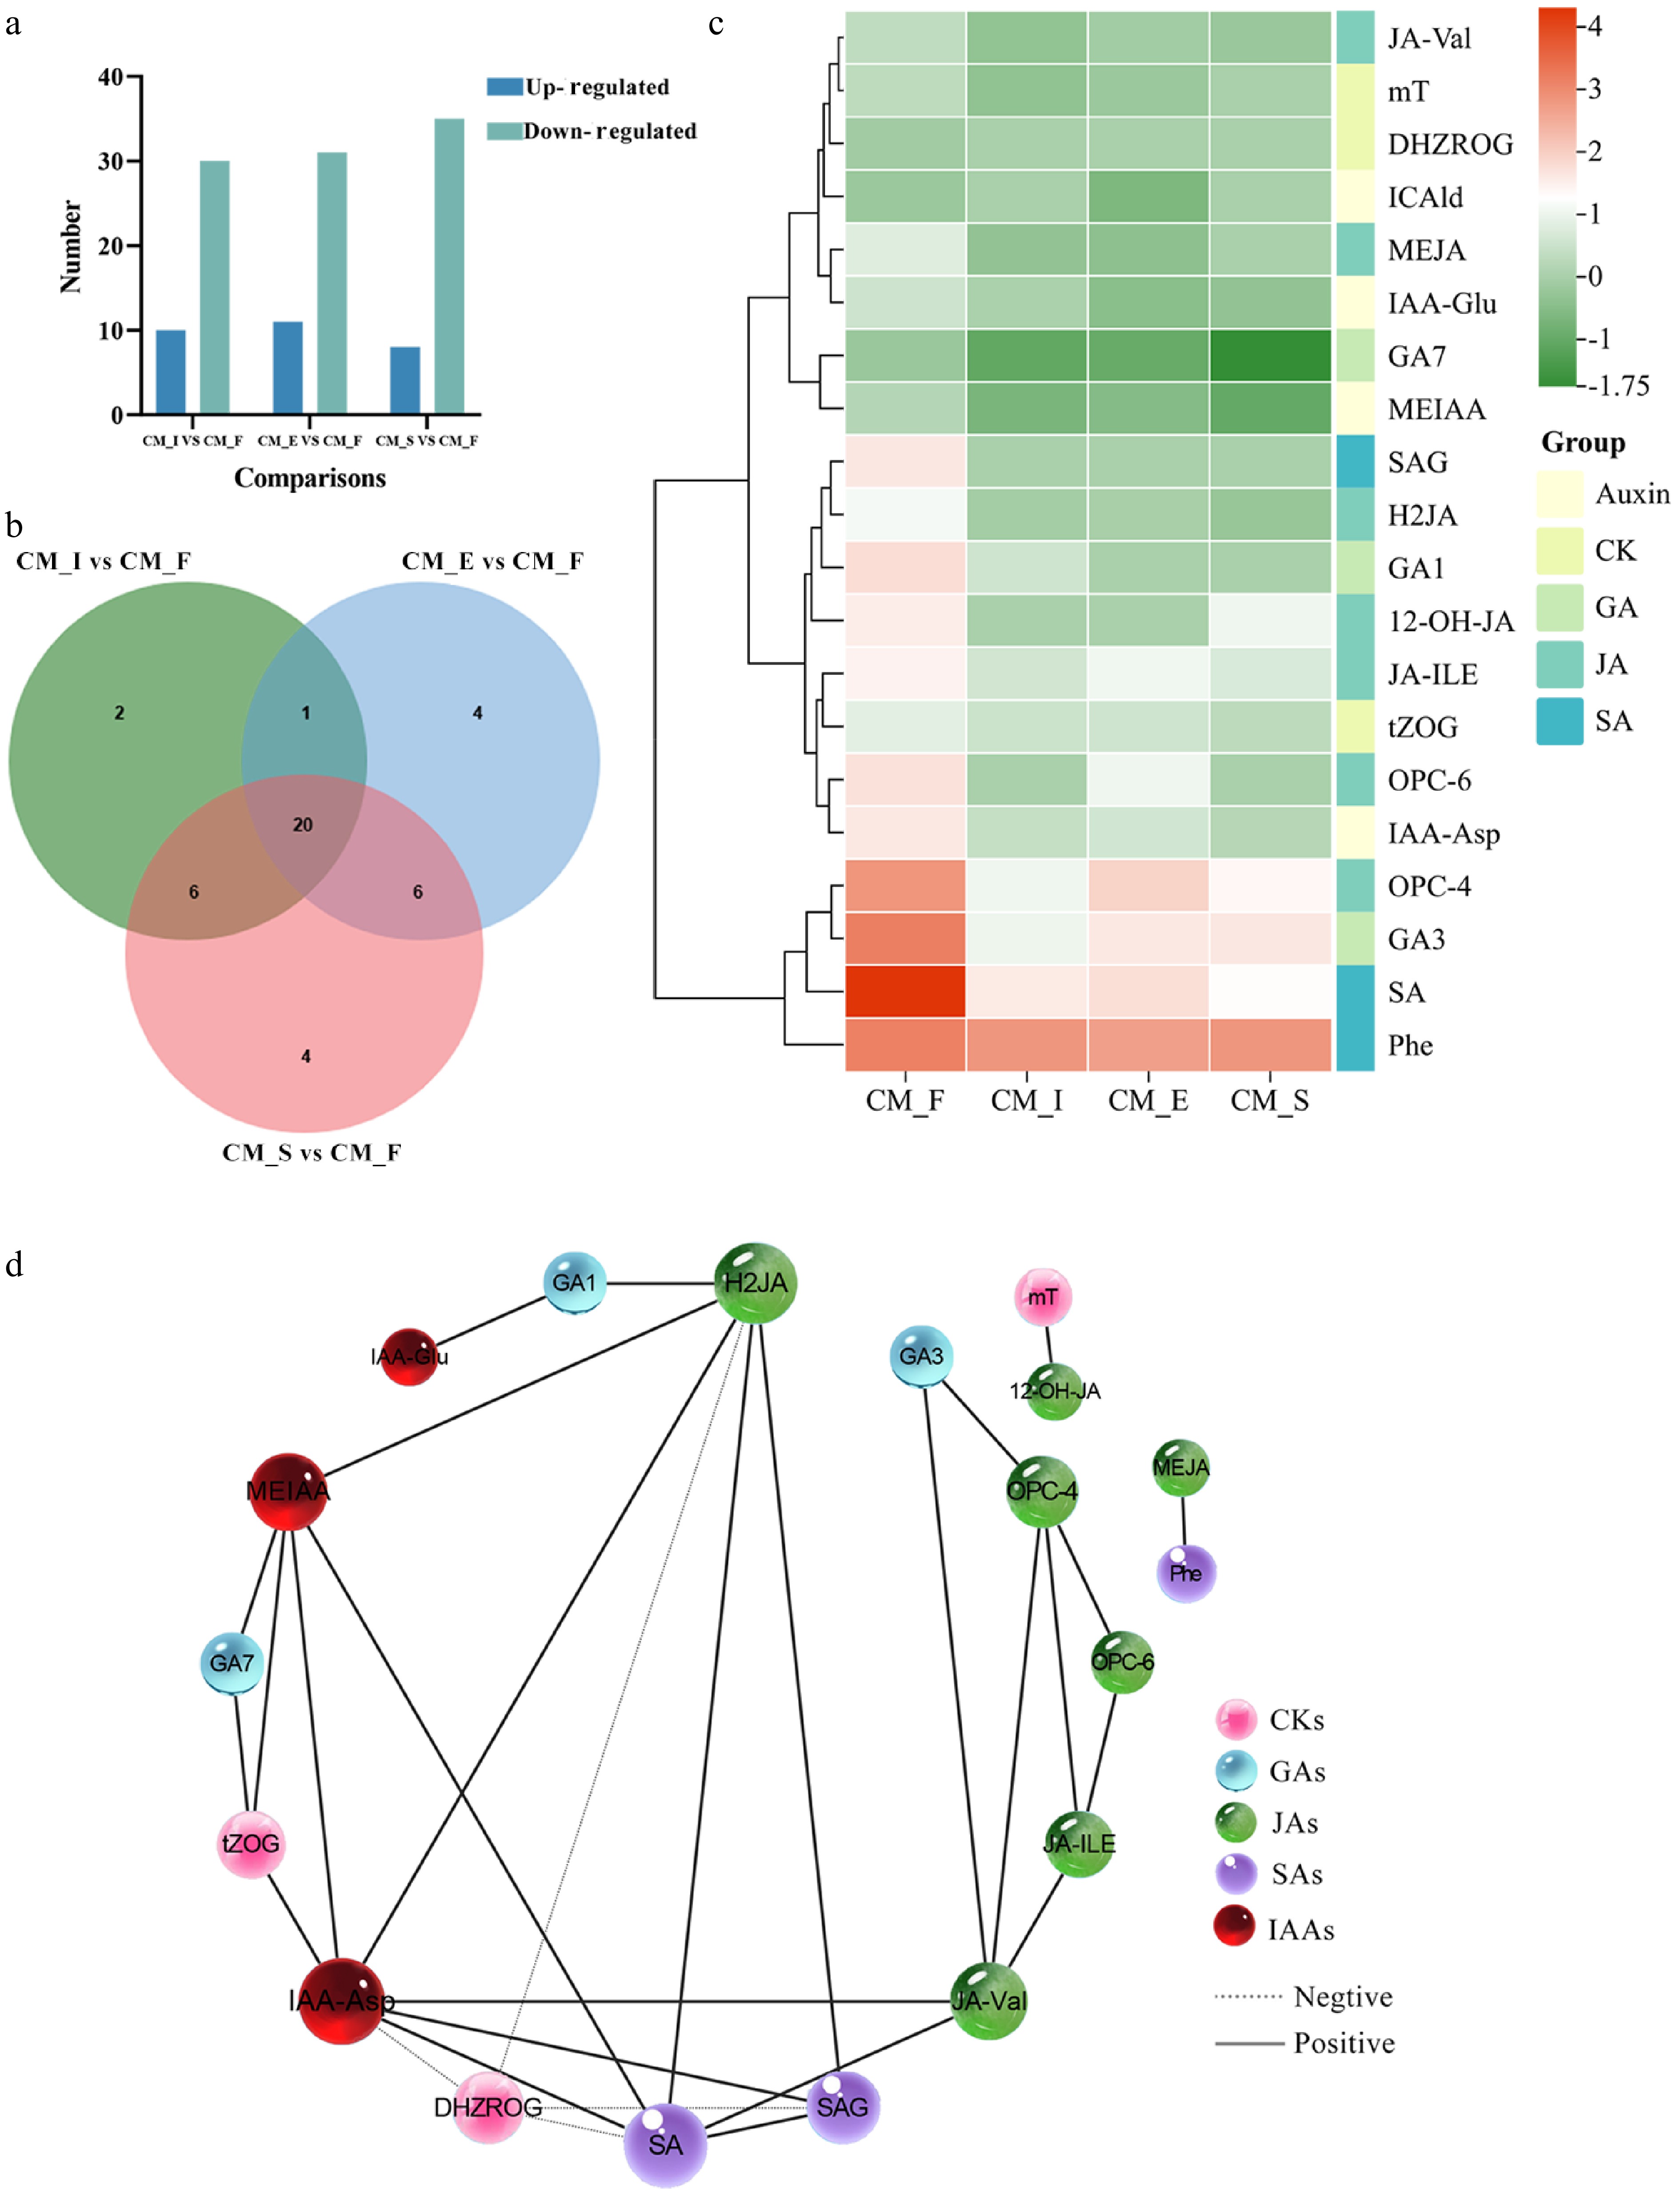
Figure 3.
Overview of differentially expressed metabolites. (a) Pairwise comparisons of different stages. Blue and green bars represent differentially upregulated and downregulated metabolites, respectively. (b) Venn diagrams highlighting different comparisons. (c) A heatmap of 20 differentially expressed hormones. (d) A hormone correlation network analysis of 20 differentially expressed hormones based on Pearson's correlation coefficients (|r| > 0.95, p < 0.05). The dotted lines between two metabolites represent negative correlations, and the solid lines between two metabolites represent positive correlations. The width of the line between two metabolites changes with the size of the correlation r: The thinner the line, the smaller the correlation.
-

Figure 4.
The expression trend charts of five hormone categories. (a) IAA, auxins; (b) GAs, gibberellins; (c) CKs, cytokinins; (d) JAs, jasmonates; (e) SAs, salicylic acids.
-

Figure 5.
Timeline of inflorescence emergence, scape elongation, color onset, and anthesis in C. miniata under different treatments.
-

Figure 6.
Relative expression of scape elongation-related genes after different treatments. Error bars = standard deviation. **** p < 0.01 (Student's t-test).
-
IAA concentration (mg/L) Date of inflorescence emergence (month/day) Date of scape elongation
(month/day)Date of anthesis (month/day) Days of advanced anthesis (days) Rate of scape emergence (%) 0 (control) 2/2 ± 0.5 2/15 ± 0 2/26 ± 0.5 0c 100.0 50 1/17 ± 0.5 1/26 ± 0.5 2/12 ± 0.5 14.21 ± 3.59b 100.0 100 1/16 ± 0.5 1/25 ± 0.5 1/23 ± 0.5 34.19 ± 0.97a 20.0 150 1/1 ± 0.5 1/14 ± 0.5 1/28 ± 0.5 29.81 ± 3.52a 90.0 200 1/6 ± 0.5 1/22 ± 0.5 2/2 ± 0.5 24.15 ± 2.12a 60.0 Different lowercase letters in the column indicate statistically significant differences (p < 0.05) as determined by Duncan's multiple range test. Table 1.
Statistics of critical developmental stages for C. miniata treated with different concentrations of IAA in 2025.
-
GA concentration (mg/L) Date of inflorescence emergence (month/day) Date of scape elongation (month/day) Date of anthesis (month/day) Days of advanced anthesis (days) Rate of scape emergence (%) 0 (control) 2/2 ± 0.5 2/15 ± 0 2/26 ± 0.5 0c 100.0 50 1/5 ± 0.5 1/18 ± 0.5 1/22 ± 0.5 35.15 ± 3.59a 50.0 100 1/3 ± 0.5 1/9 ± 0.5 1/19 ± 0.5 38.31 ± 0.97a 50.0 150 1/9 ± 0.5 1/18 ± 0.5 2/1 ± 0.5 25.33 ± 1.52b 90.0 200 1/4 ± 0.5 1/10 ± 0.5 1/22 ± 0.5 35.81 ± 3.52a 80.0 Different lowercase letters in the column indicate statistically significant differences (p < 0.05) as determined by Duncan's multiple range test. Table 2.
Statistics of critical developmental stages in C. miniata treated with different concentrations of GA3 in 2025.
Figures
(6)
Tables
(2)