-
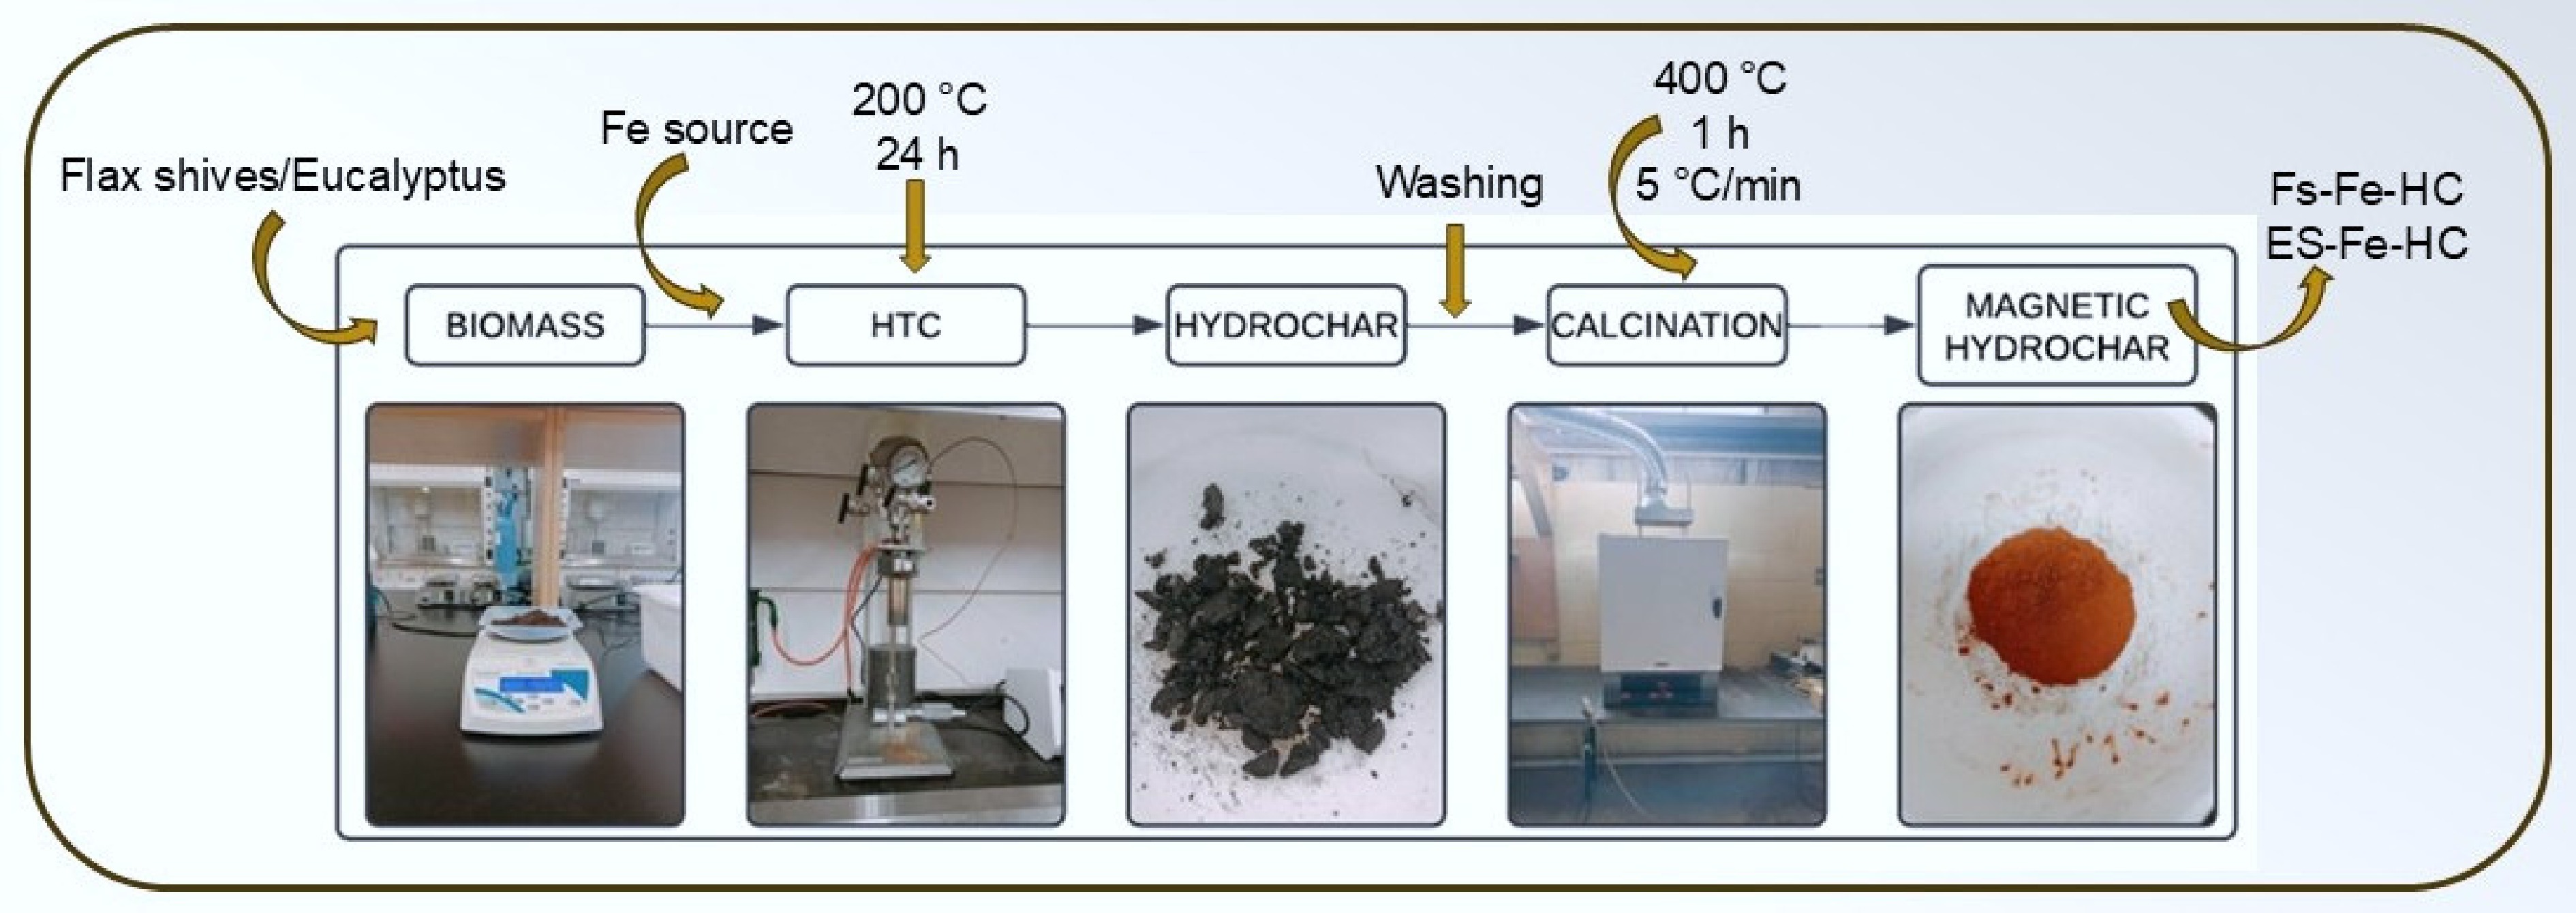
Figure 1.
Synthesis of magnetic hydrochar through hydrothermal carbonization.
-
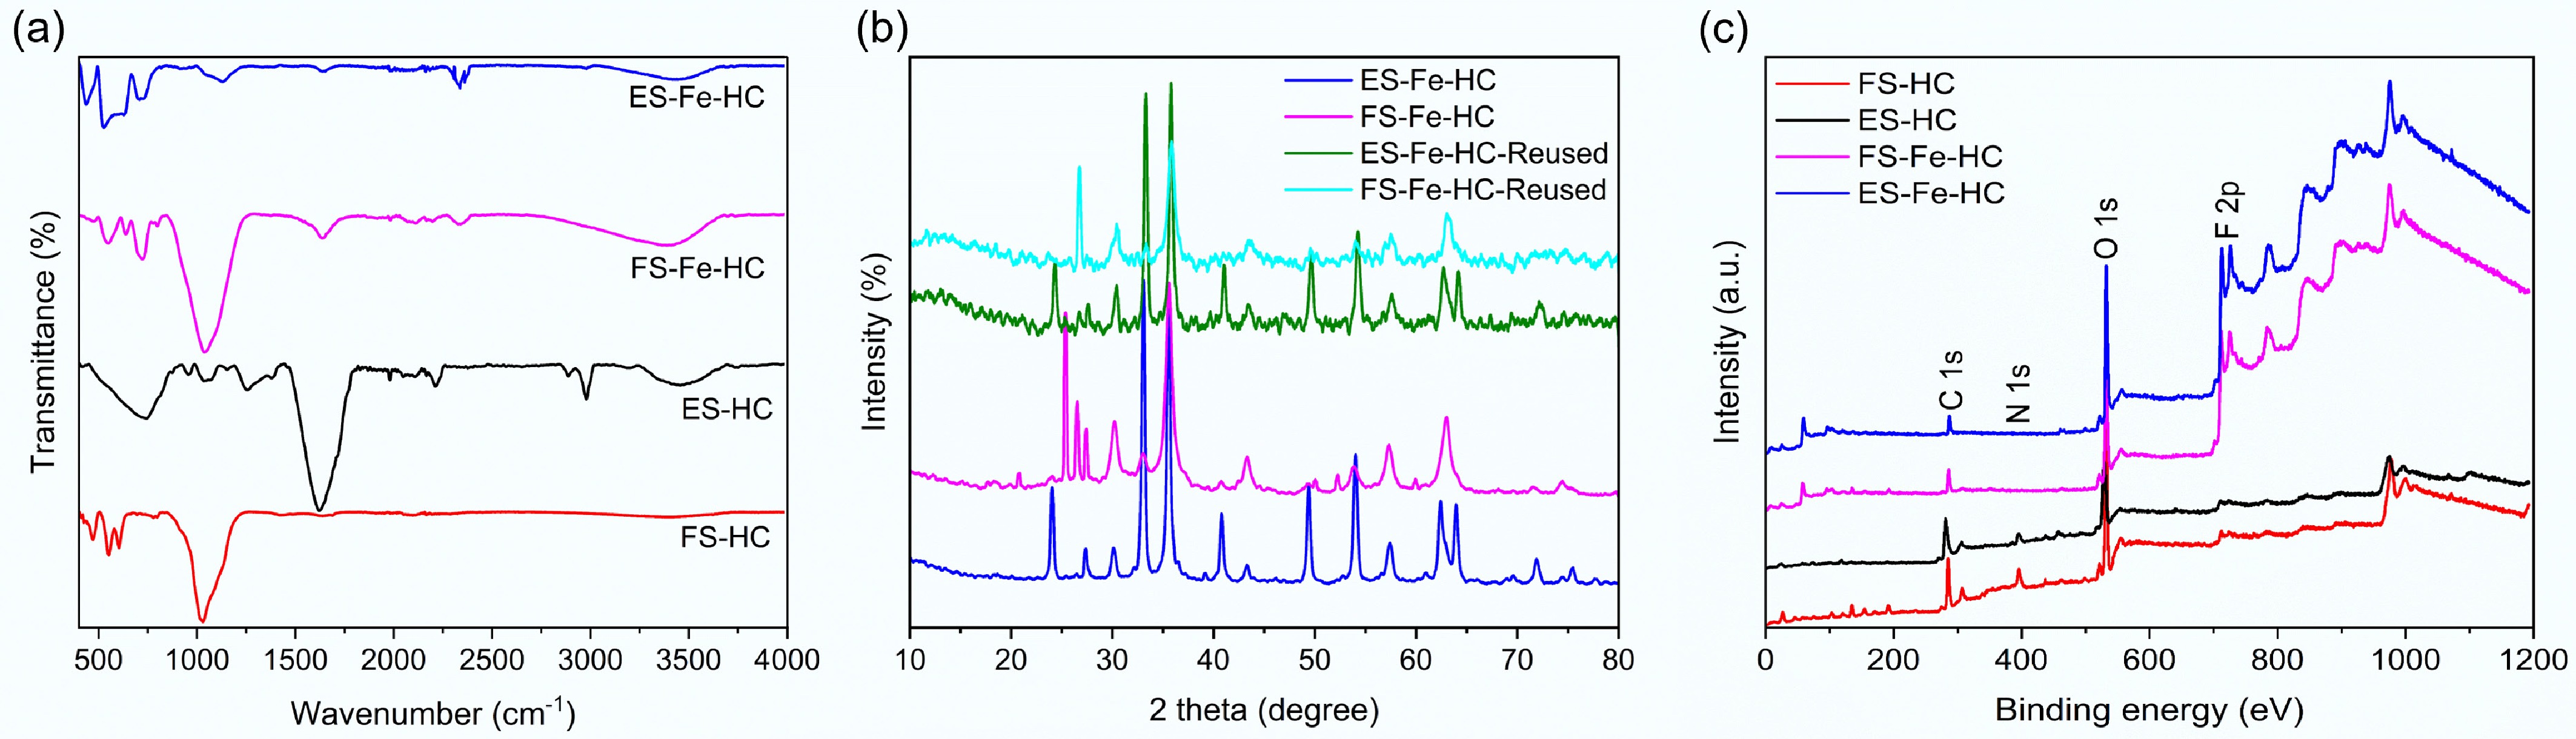
Figure 2.
(a) FTIR, (b) XRD, and (c) XPS analysis of flax shives and eucalyptus sawdust hydrochar.
-
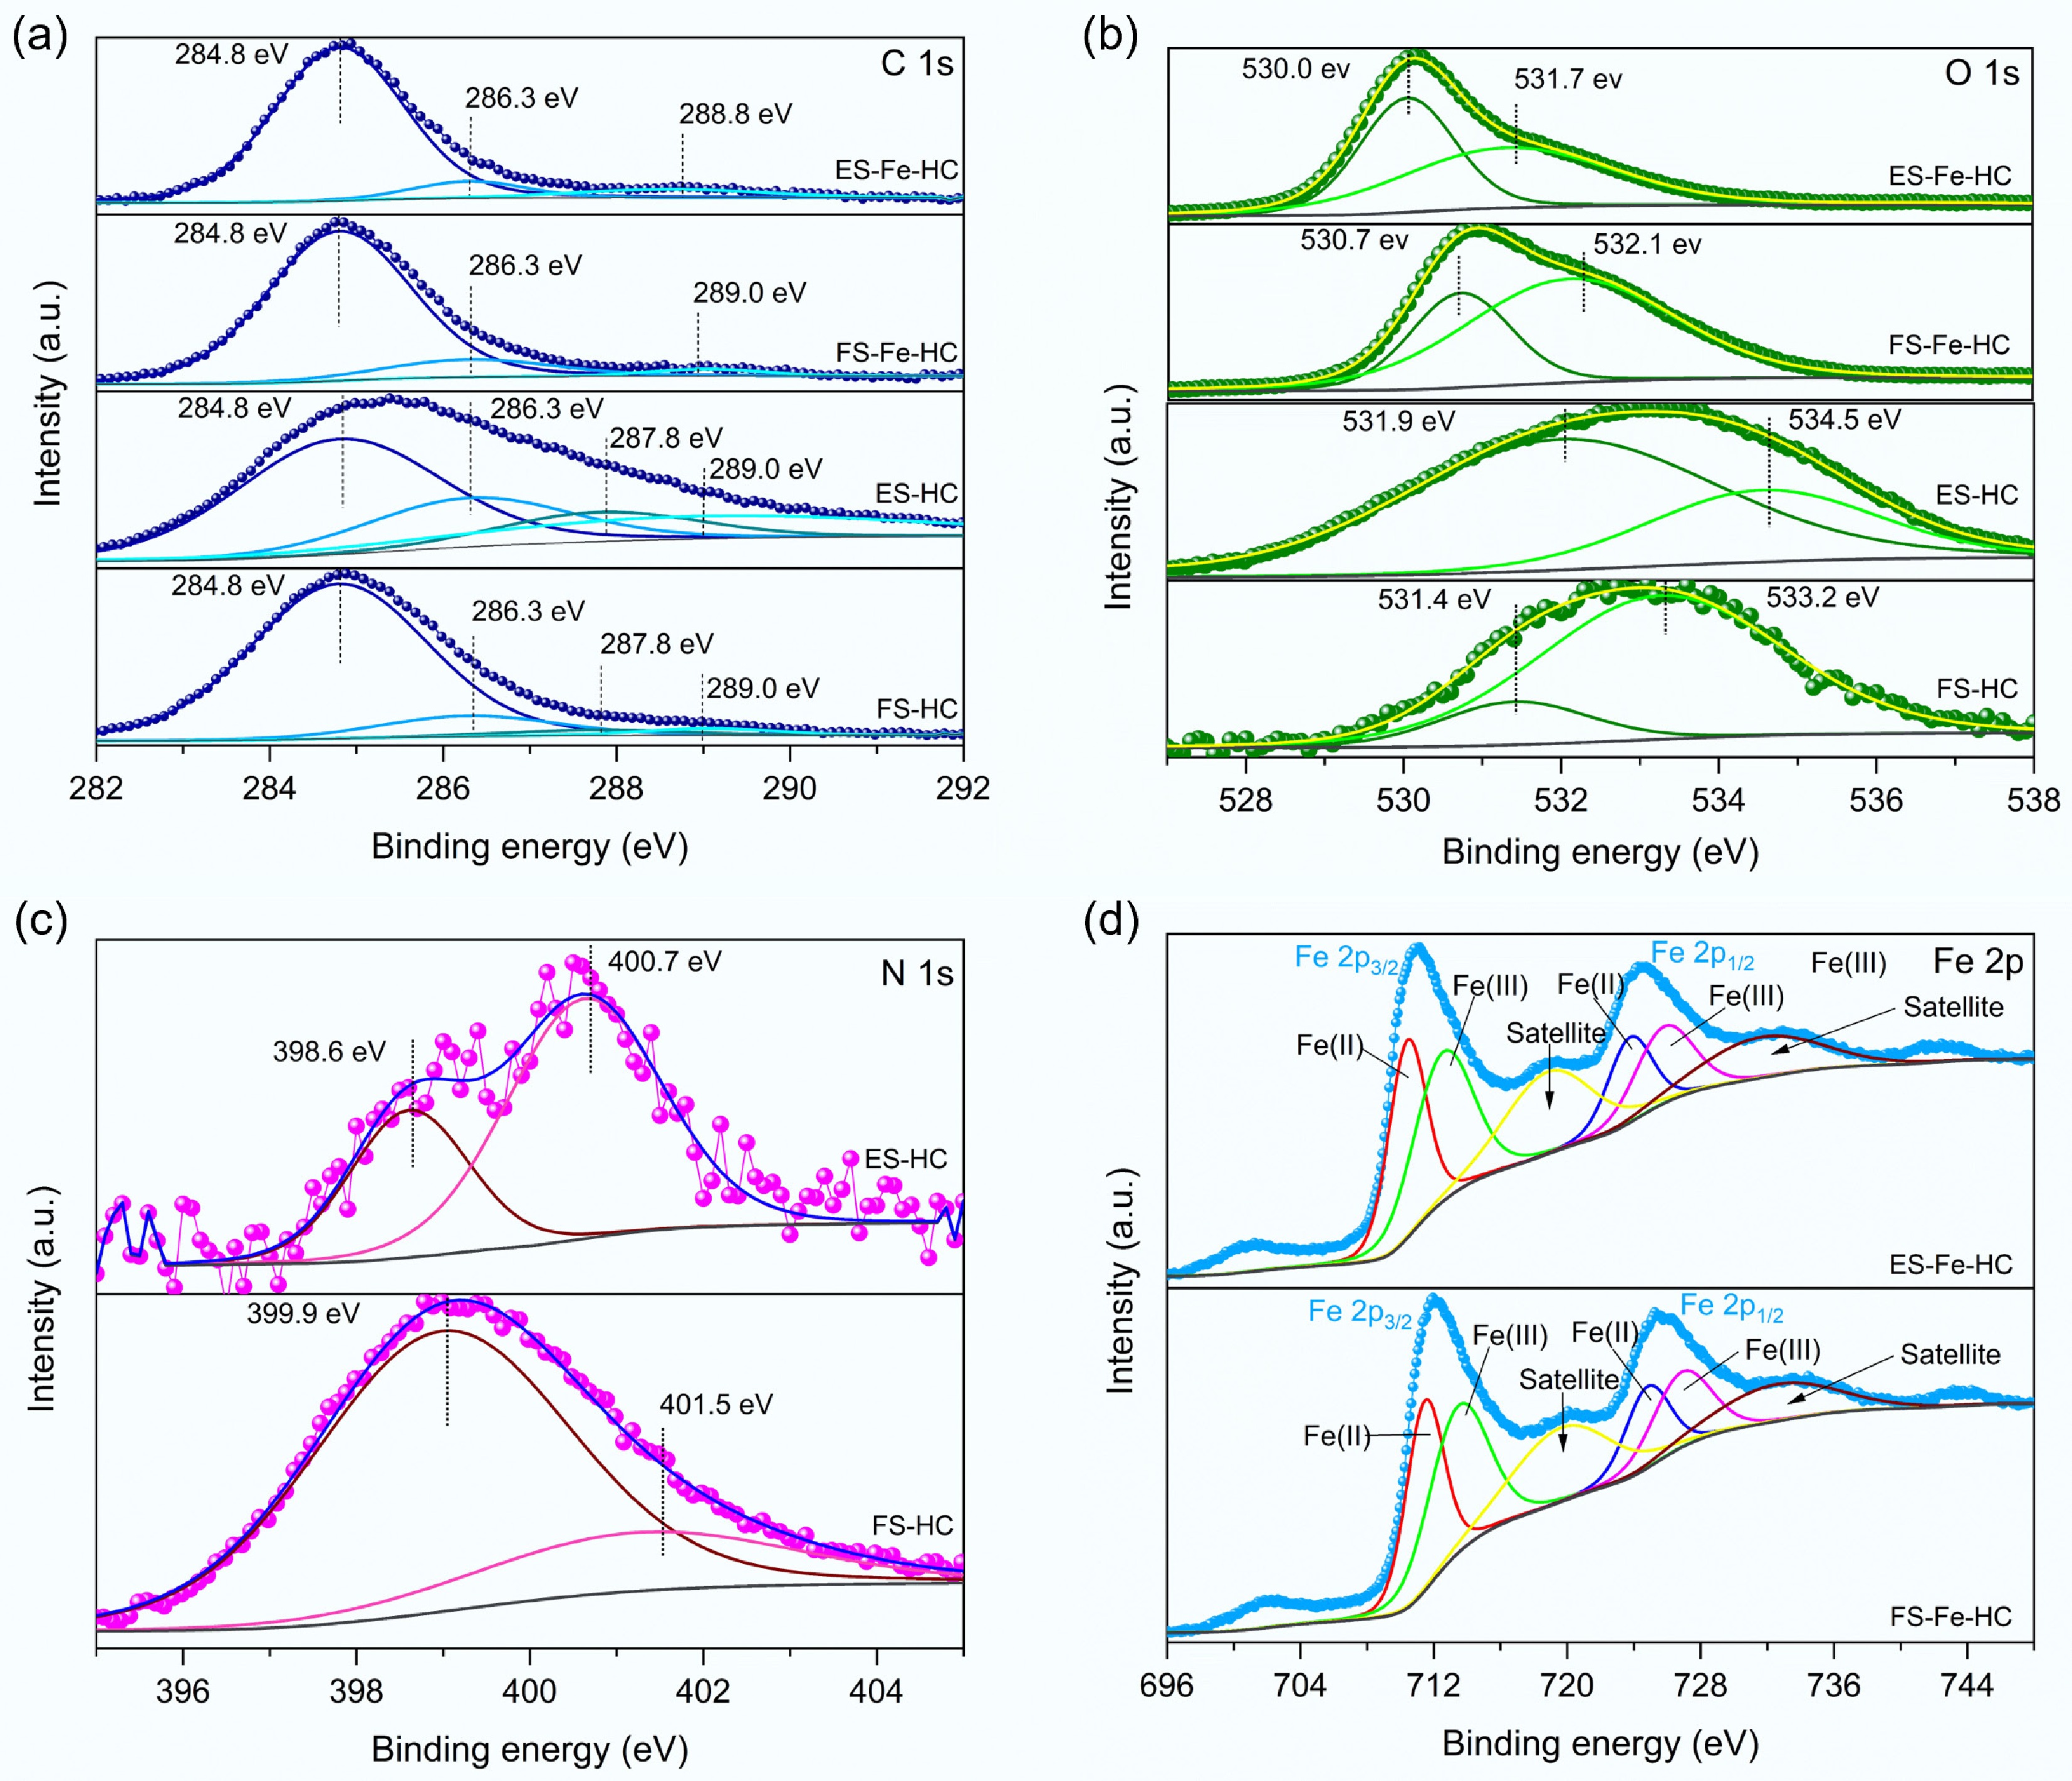
Figure 3.
The high-resolution XPS spectra of (a) C 1s, (b) O 1s, (c) N 1s, and (d) Fe 2p.
-
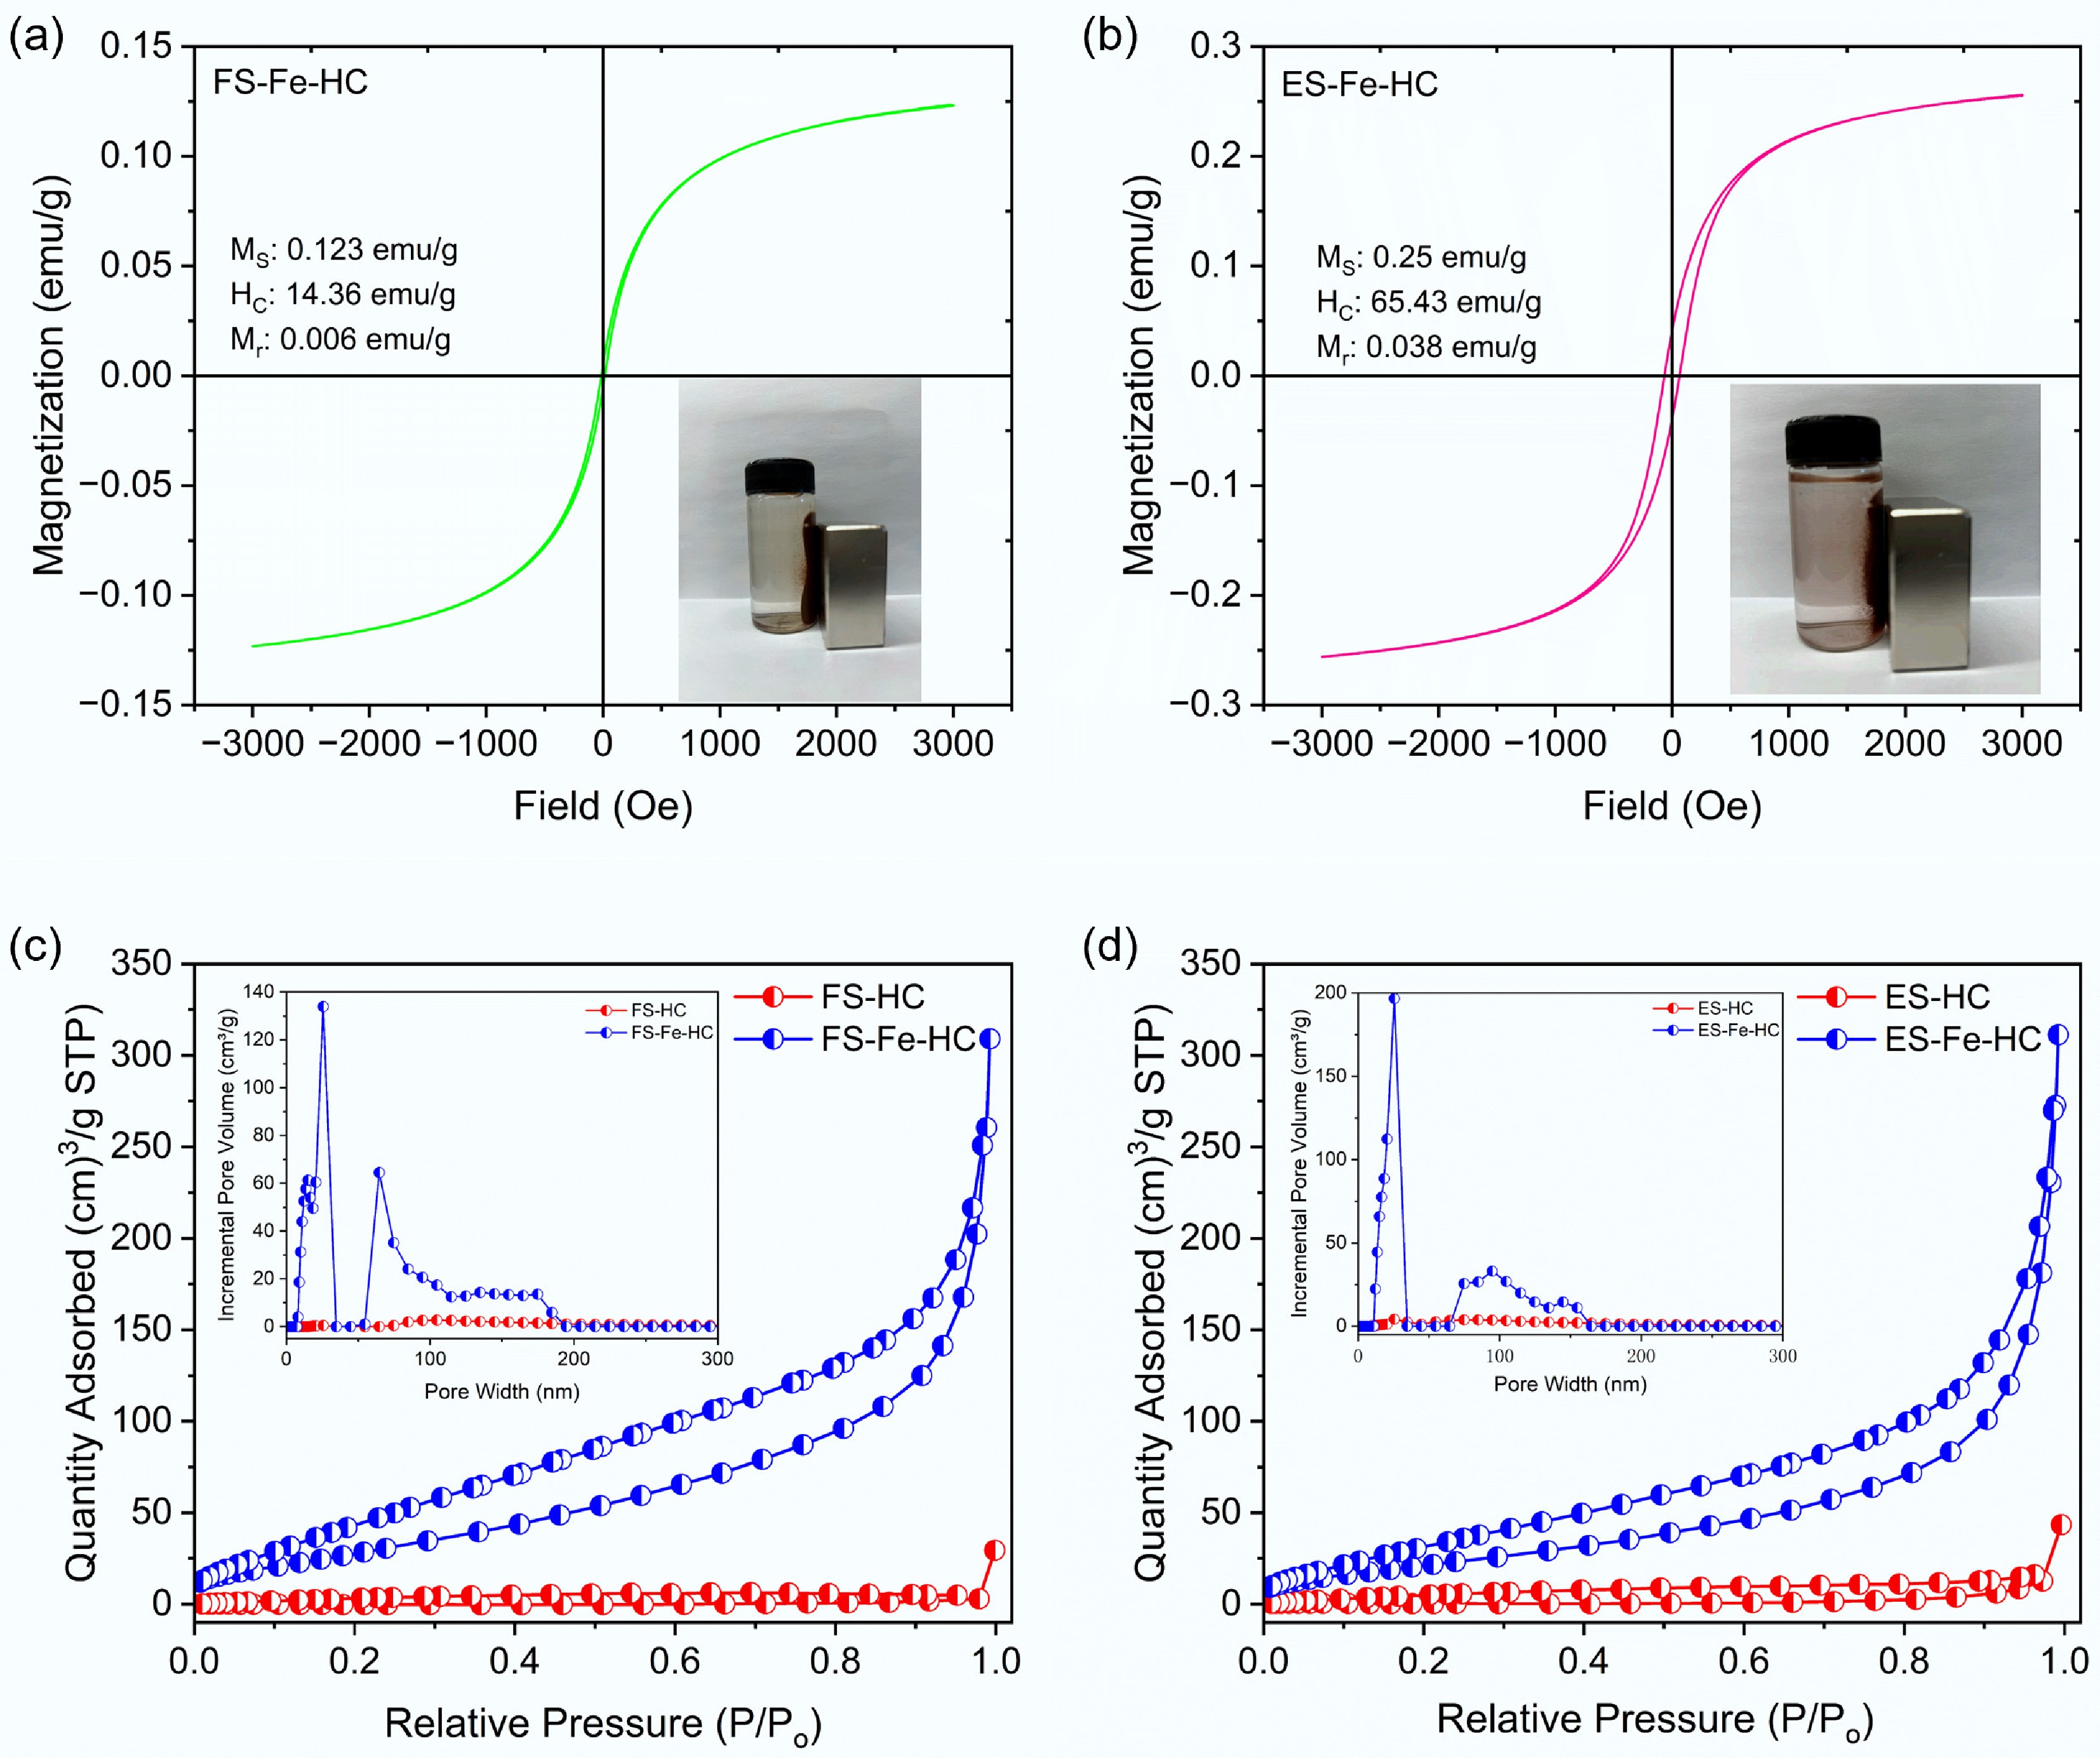
Figure 4.
(a), (b) VSM, and (c), (d) BET analysis of flax shives and eucalyptus sawdust hydrochar.
-
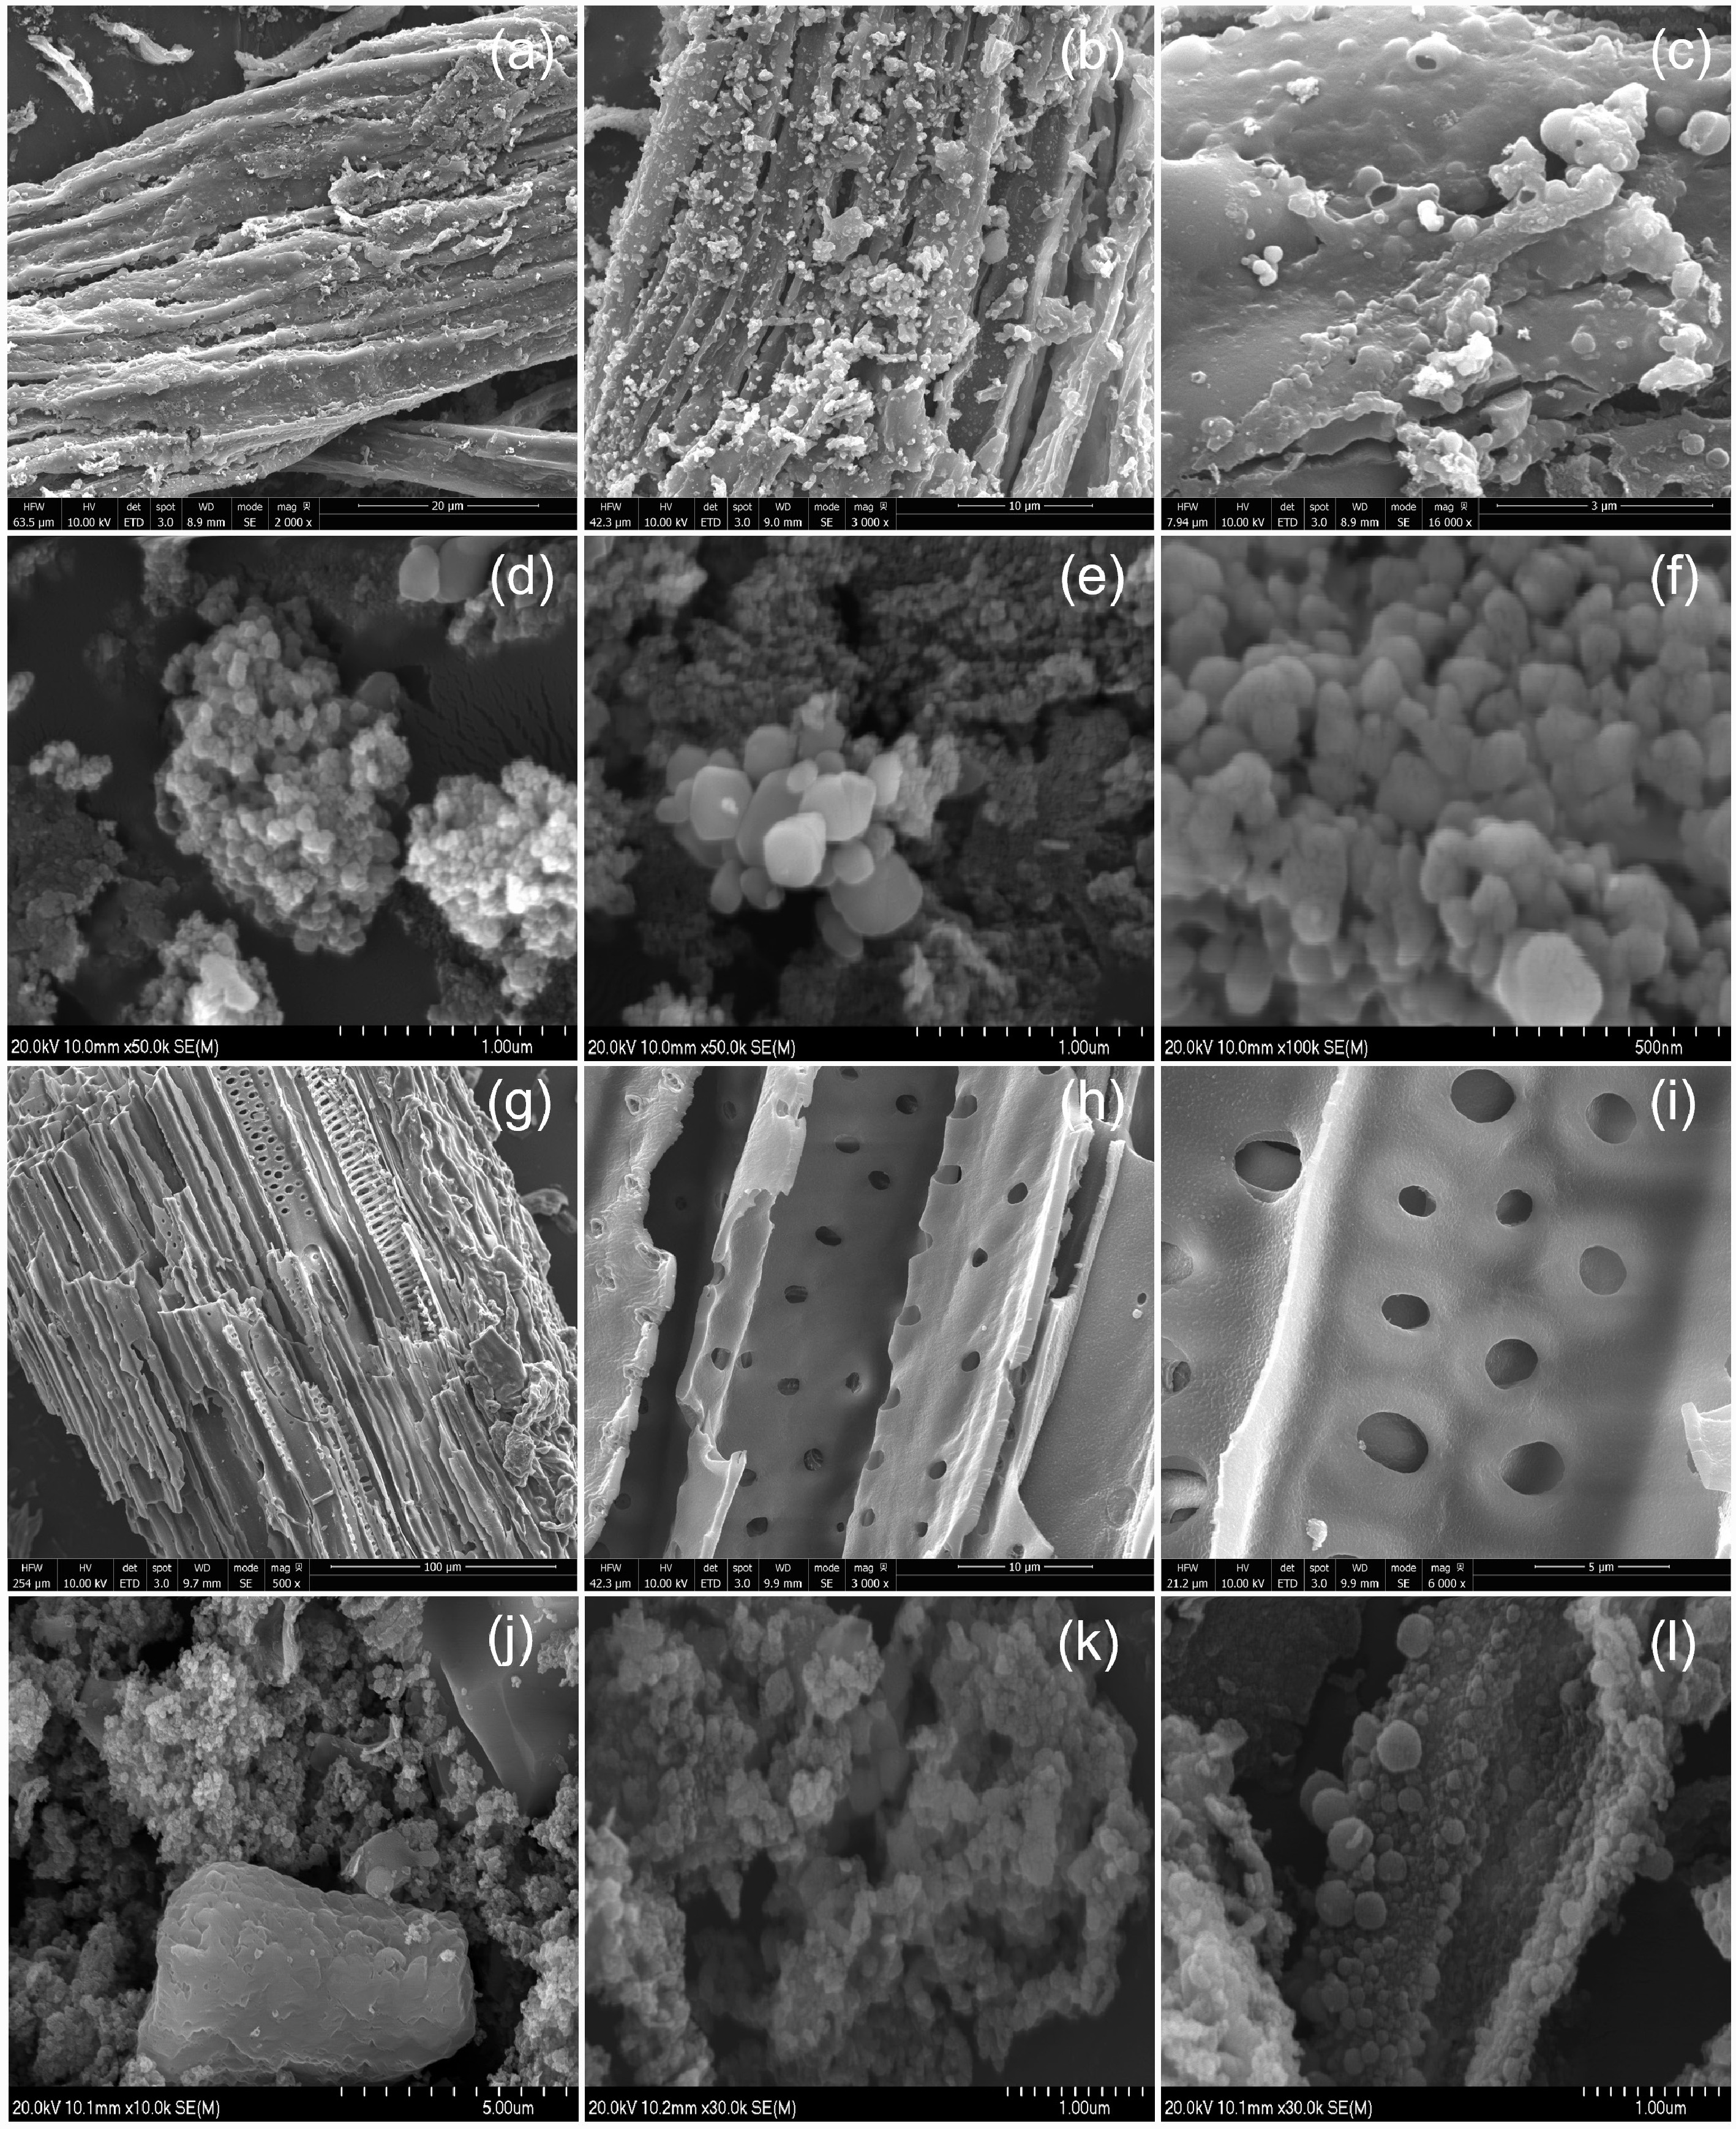
Figure 5.
The surface morphology of (a)–(c) FS-HC, (d)–(f) FS-Fe-HC, (g)–(i) ES-HC, and (j)–(l) ES-Fe-HC.
-
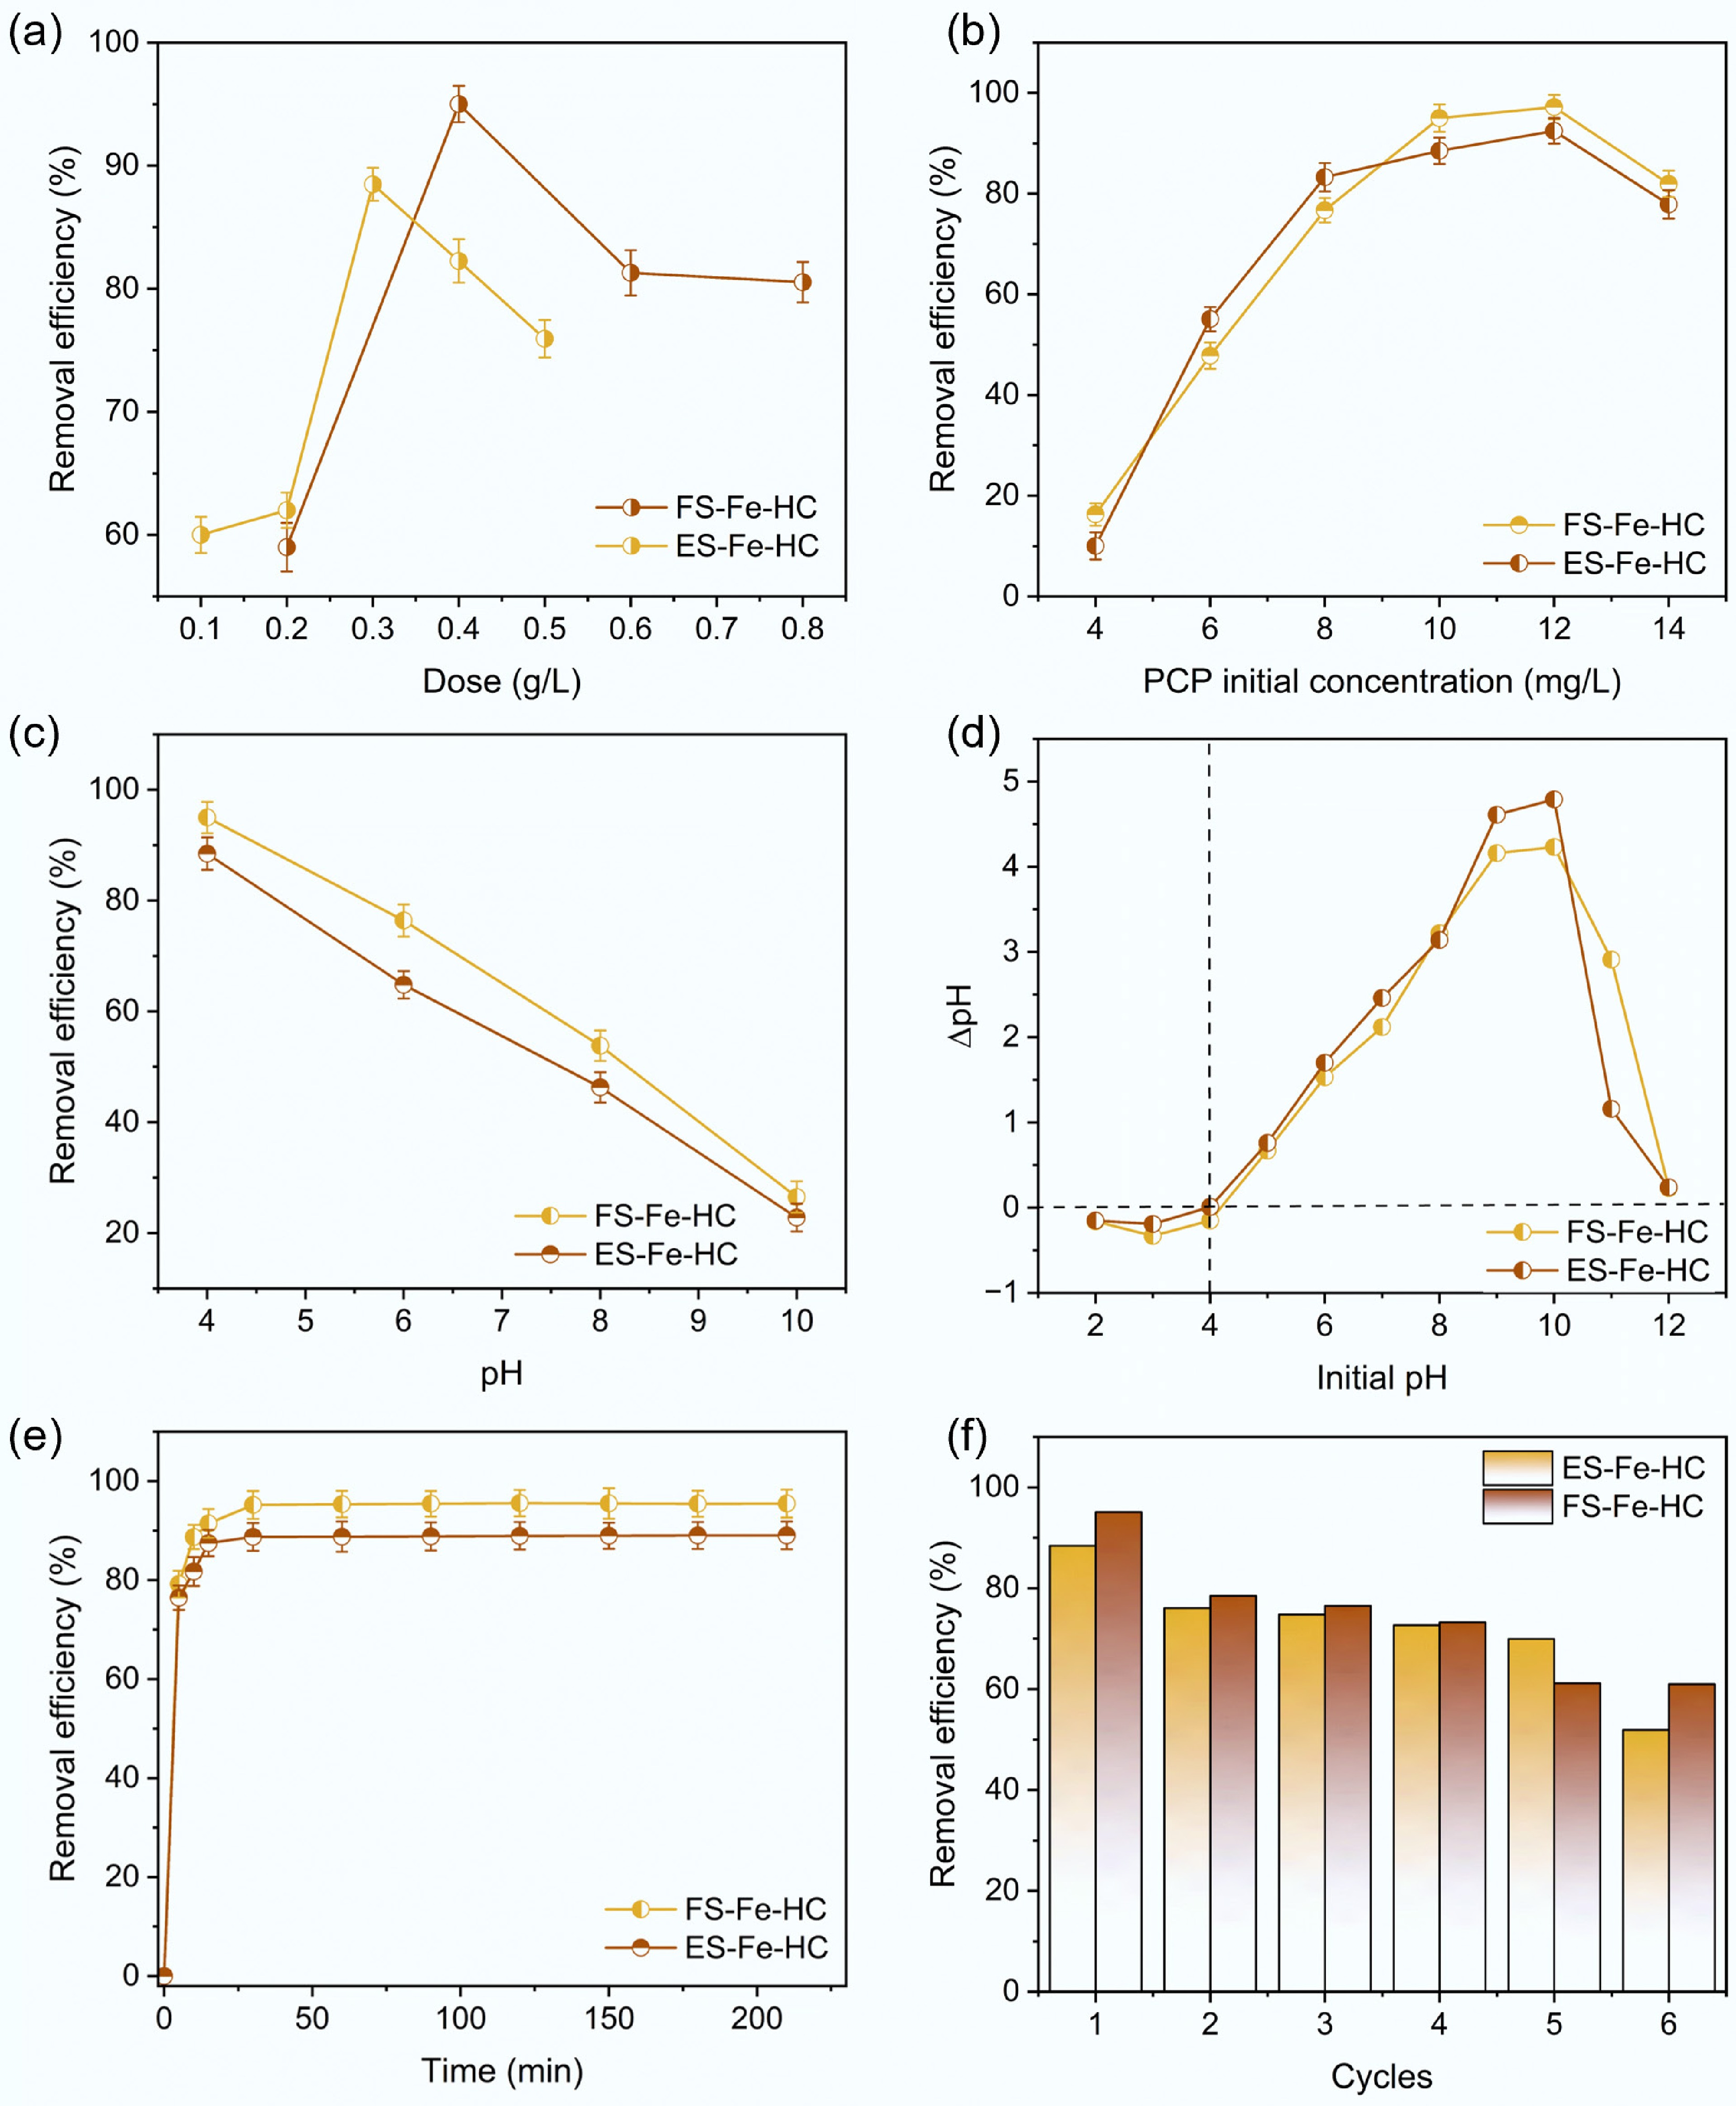
Figure 6.
Removal efficiency influenced by (a) adsorbent dose, (b) initial concentration of PCP, (c) pH, (d) point of zero charge, (e) contact time, and (f) reusability.
-
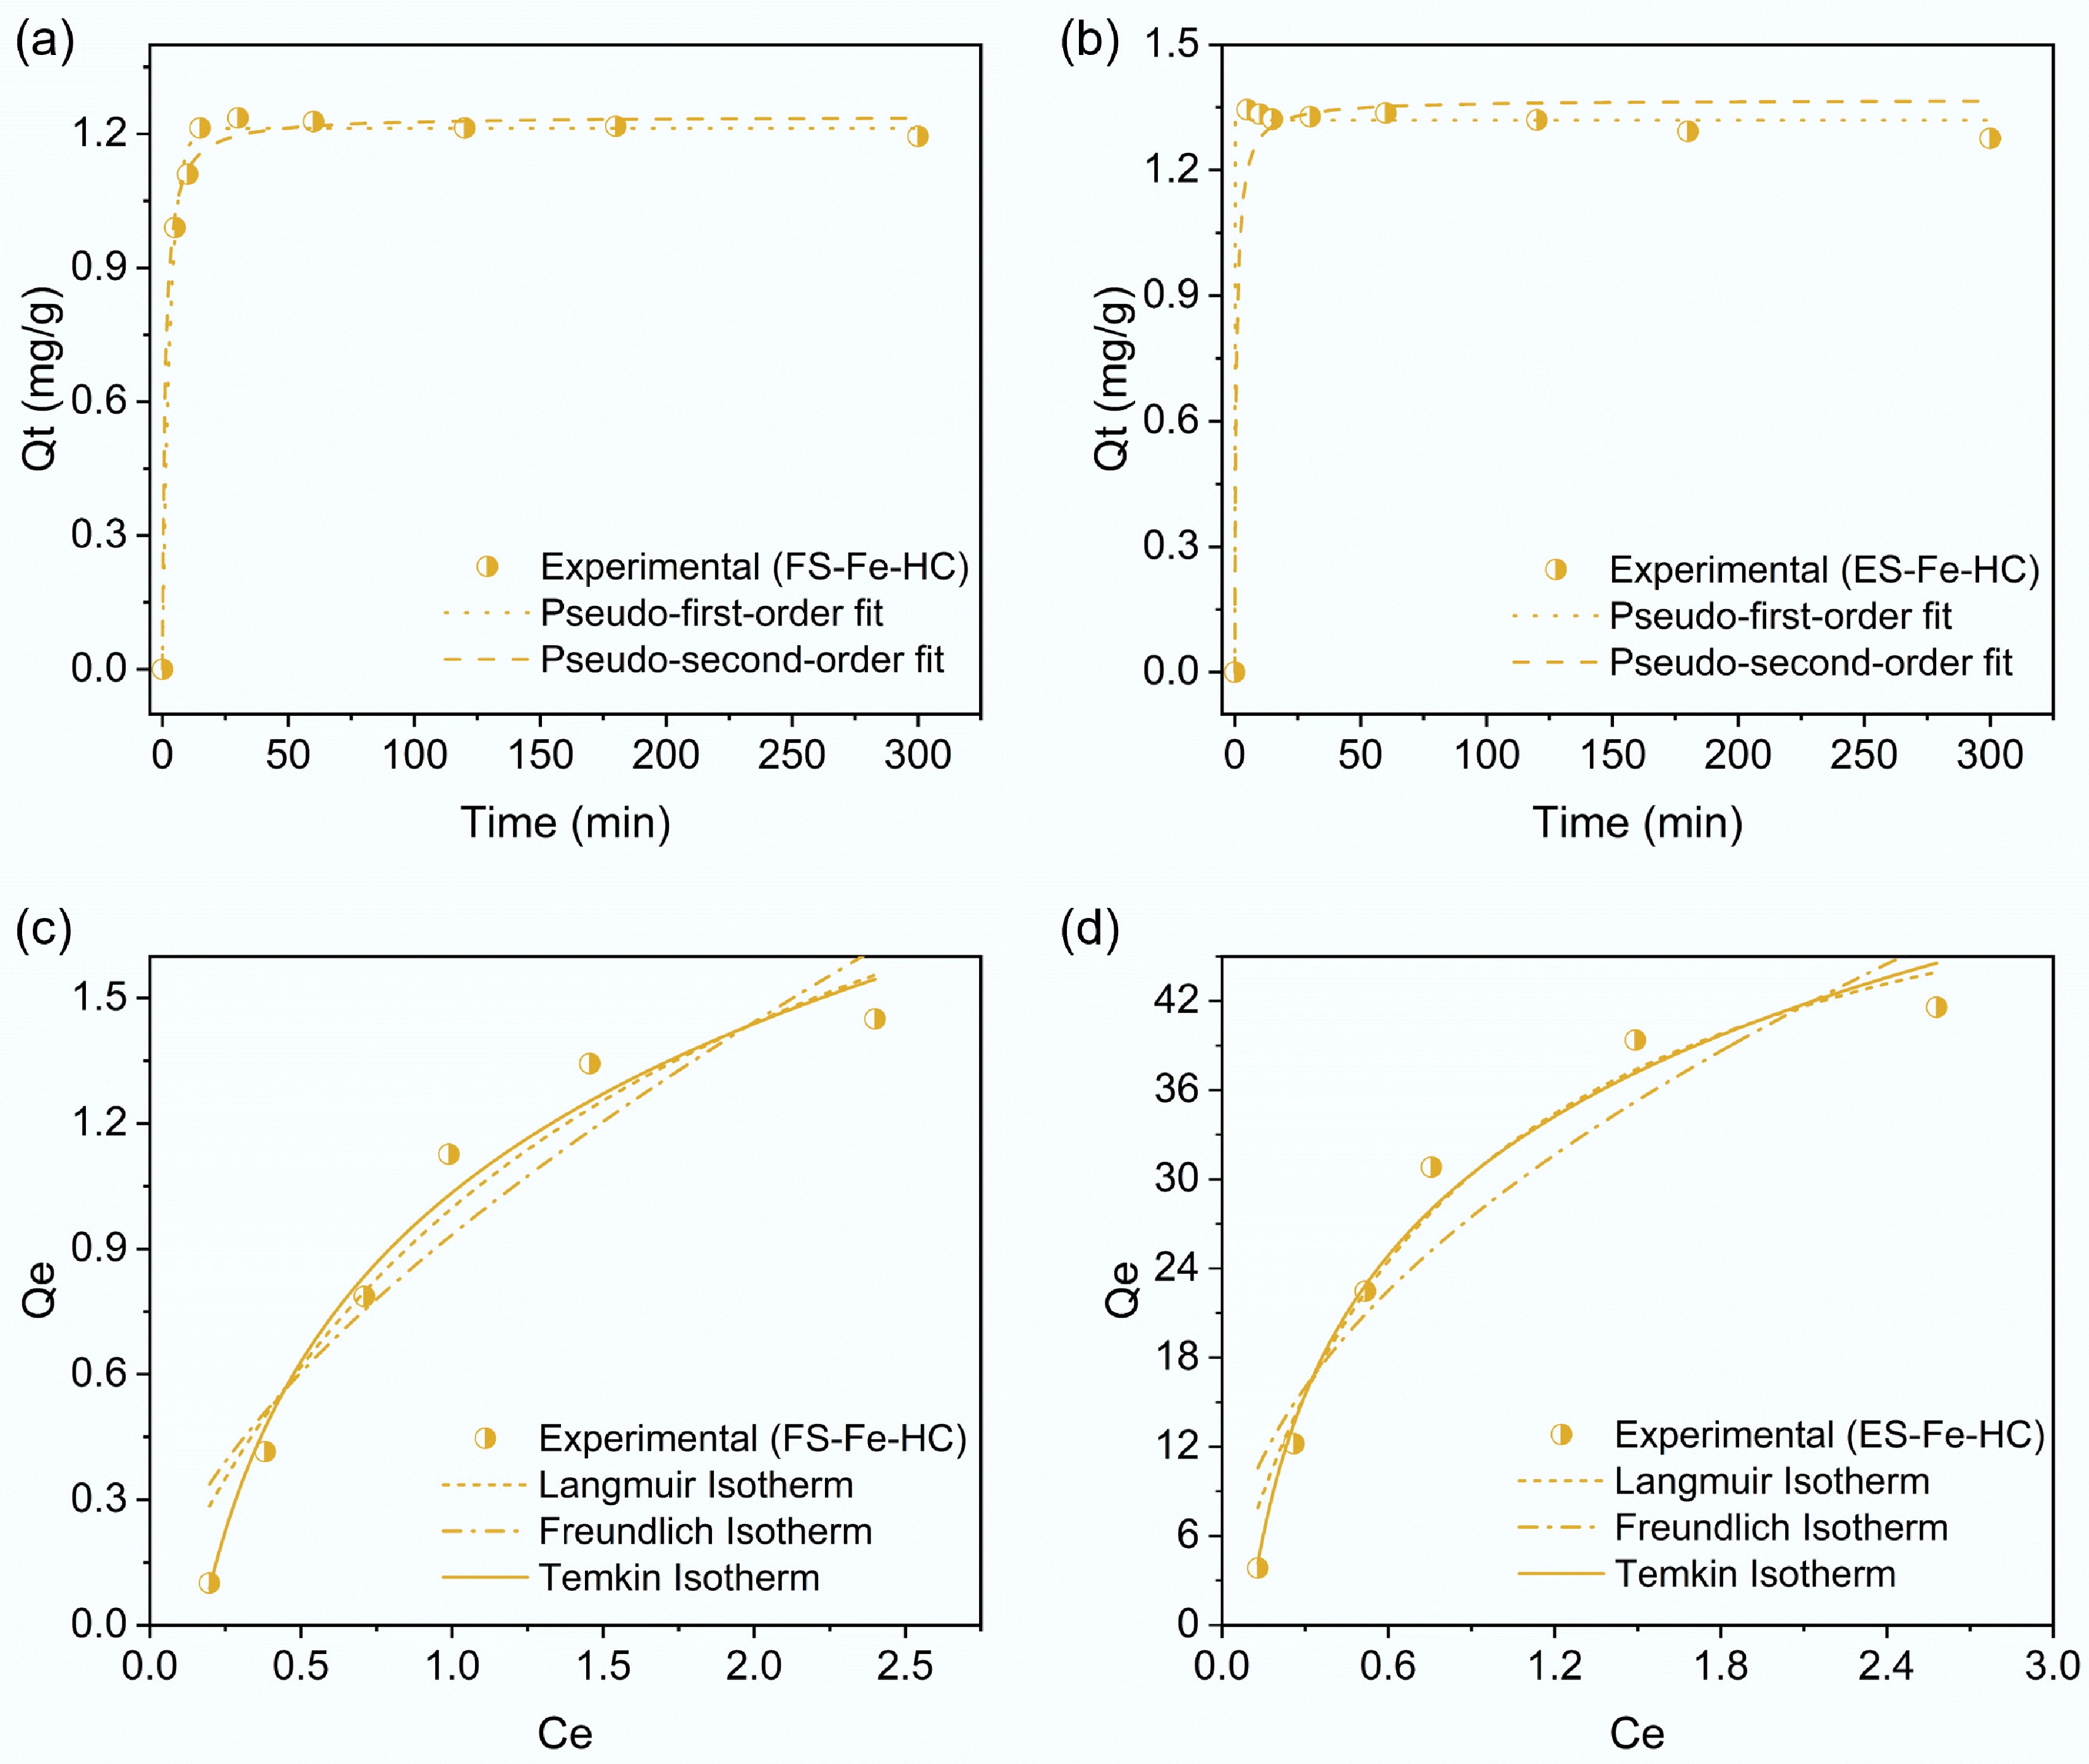
Figure 7.
Kinetic analysis of PCP adsorption using (a) FS-Fe-HC, and (b) ES-Fe-HC, and isotherm model fitting for PCP adsorption using (c) FS-Fe-HC, and (d) ES-Fe-HC.
-
Biomass Flax shives Eucalyptus sawdust Proximate analysis (wt%) Moisture 1.04 ± 0.15 1.36 ± 0.04 Volatile 95.99 97.64 Fixed carbon 2.48 1.91 Ash 1.78 ± 0.25 0.72 ± 0.27 Biochemical analysis (wt%) Cellulose 45 ± 5.92 42 ± 5.38 Hemicellulose 29.67 ± 4.91 27 ± 5.01 Lignin 25 ± 1.82 31 ± 2.45 Table 1.
Proximate and biochemical analysis of flax shives and eucalyptus sawdust
-
Biomass BET surface area (SBET) (m2/g) Total pore volume (cm3/g) Average pore diameter (nm) FS-HC 4.3803 0.0269 12.29 ES-HC 0.8796 0.0548 125.52 FS-Fe-HC 118.49 0.4271 7.21 ES-Fe-HC 87.74 0.4393 10.01 Table 2.
BET analysis of FS-HC, ES-HC, FS-Fe-HC, and ES-Fe-HC
-
Adsorbent Adsorbent dose (g/L) Time (h) PCP (mg/L) pH Removal efficiency (%) Ref. Flax shives hydrochar 0.1 0.33 10 3 81 [25] Fe3O4−SiO2 decorated carbon nanotubes 0.5 2 100 2.5 98 [54] Carbon nanotubes 0.35 1 1 − 88 [59] Fungal biomass 1 6 1 3 100 [53] Sunflower seed waste 40 1 5 2.5 84 [60] FS-Fe-HC 0.4 1 10 4 95 This study ES-Fe-HC 0.3 0.58 10 4 88 This study Table 3.
Summary of different biomass waste-based adsorbents for PCP removal
-
FS-Fe-HC ES-Fe-HC Kinetics Pseudo-first order model Qe(exp) (mg/g) 1.227 1.336 Qe(cal) (mg/g) 1.21 ± 0.01 1.31 ± 0.008 k1 (min−1) 0.32 ± 0.02 0.001 ± 0.01 R2 0.995 0.997 χ2 0.0006 0.0005 Pseudo-second order model Qe(cal) (mg/g) 1.23 ± 0.01 1.36 ± 0.03 k2 (g/mg/min) 0.73 ± 0.14 1.0 ± 0.55 R2 0.992 0.969 χ2 0.001 0.005 Isotherm models Langmuir model Qm (mg/g) 2.58 ± 0.64 57.99 ± 6.71 KL (L/mg) 0.63 ± 0.29 1.22 ± 0.34 RL 0.137 0.075 R2 0.928 0.957 KF 0.93 ± 0.09 28.92 ± 2.5 χ2 0.02 9.56 Freundlich model 1/n 0.628 0.492 n 1.59 ± 0.36 2.03 ± 0.44 R2 0.861 0.860 χ2 0.039 31.08 Temkin model AT (L/g) 5.88 ± 0.76 10.51 ± 1.63 bT 0.583 ± 0.04 13.49 ± 0.98 R2 0.971 0.973 χ2 0.008 5.96 Table 4.
Kinetics and isotherm models for PCP adsorption using FS-Fe-HC and ES-Fe-HC
Figures
(7)
Tables
(4)