-
-
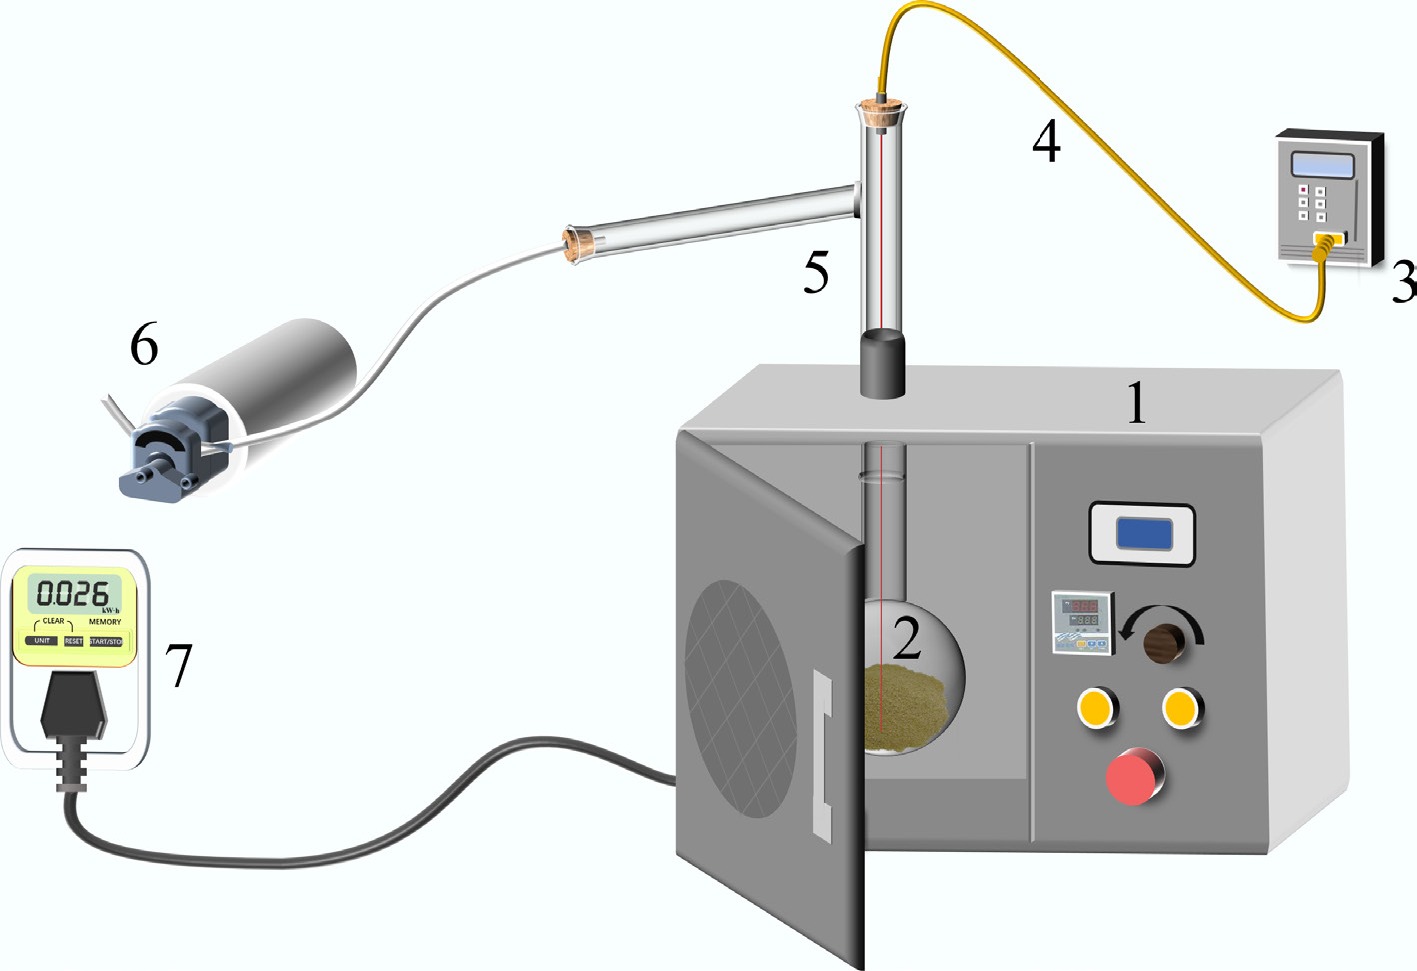
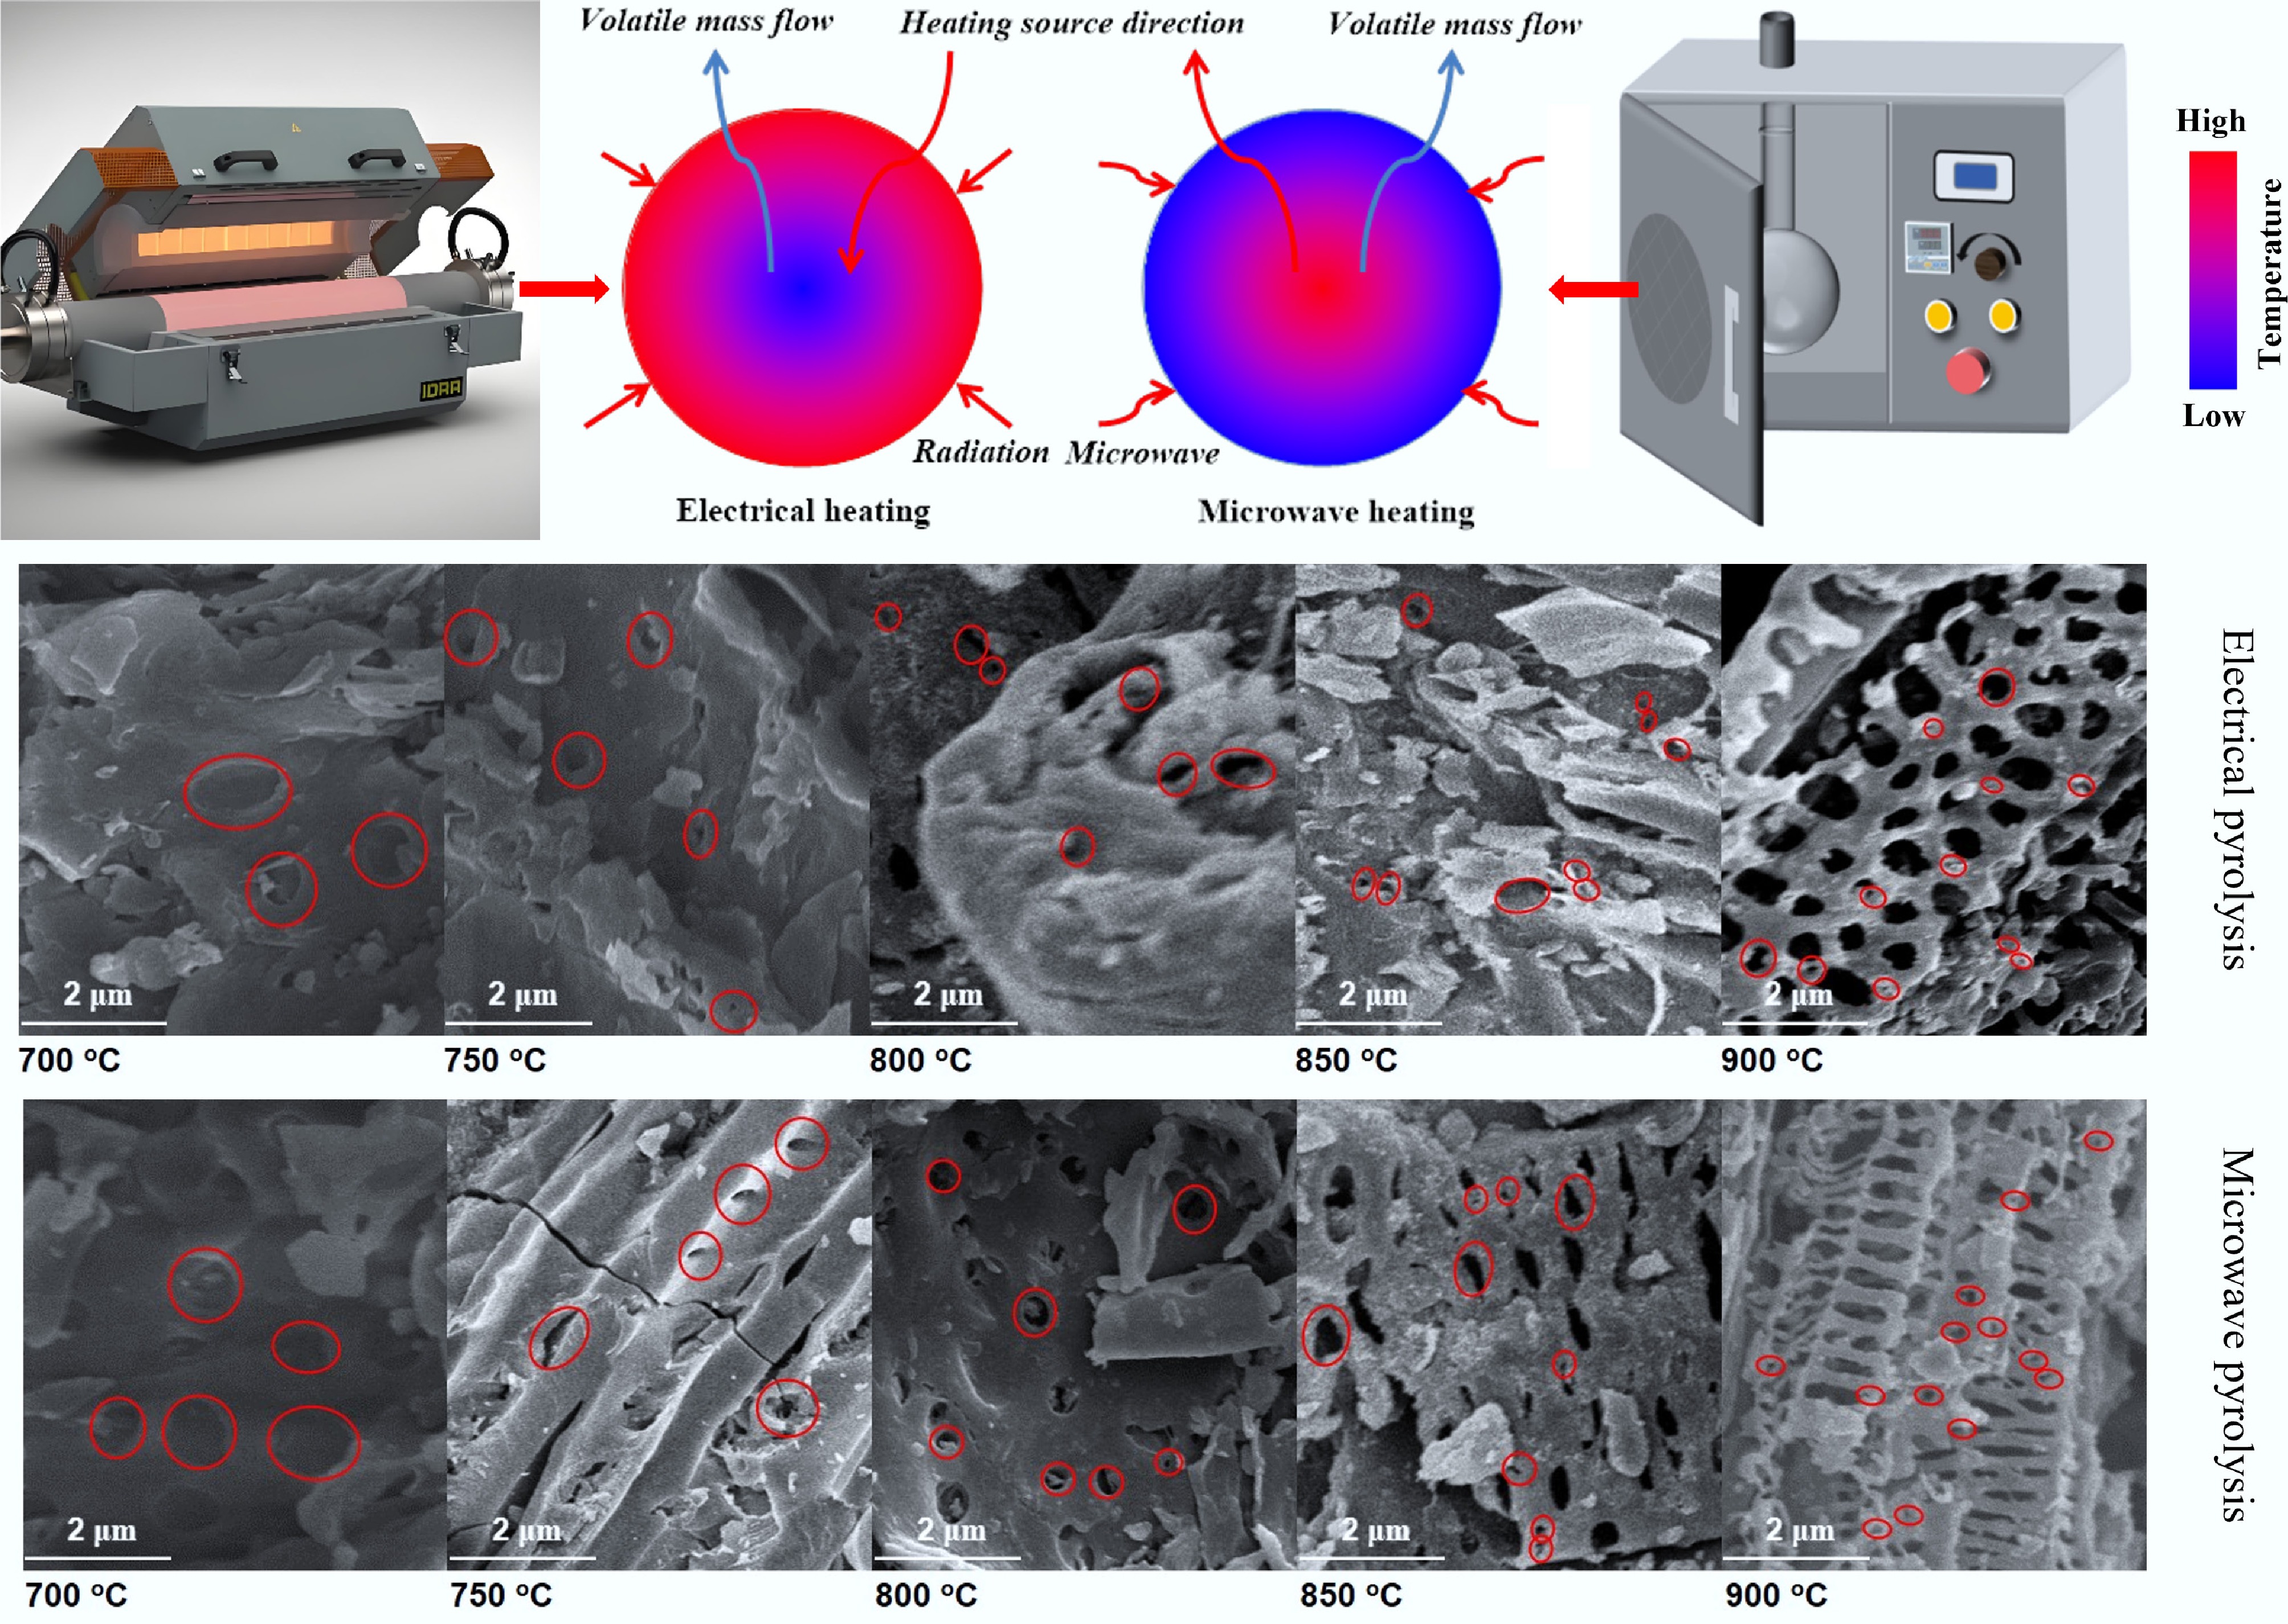
Figure 2.
Diagram of microwave-assisted pyrolysis experimental equipment: (1) microwave oven, (2) quartz reactor, (3) temperature sensor, (4) K-type thermocouple, (5) adapter connecting pipe, (6) vacuum pump, and (7) electric meter.
-
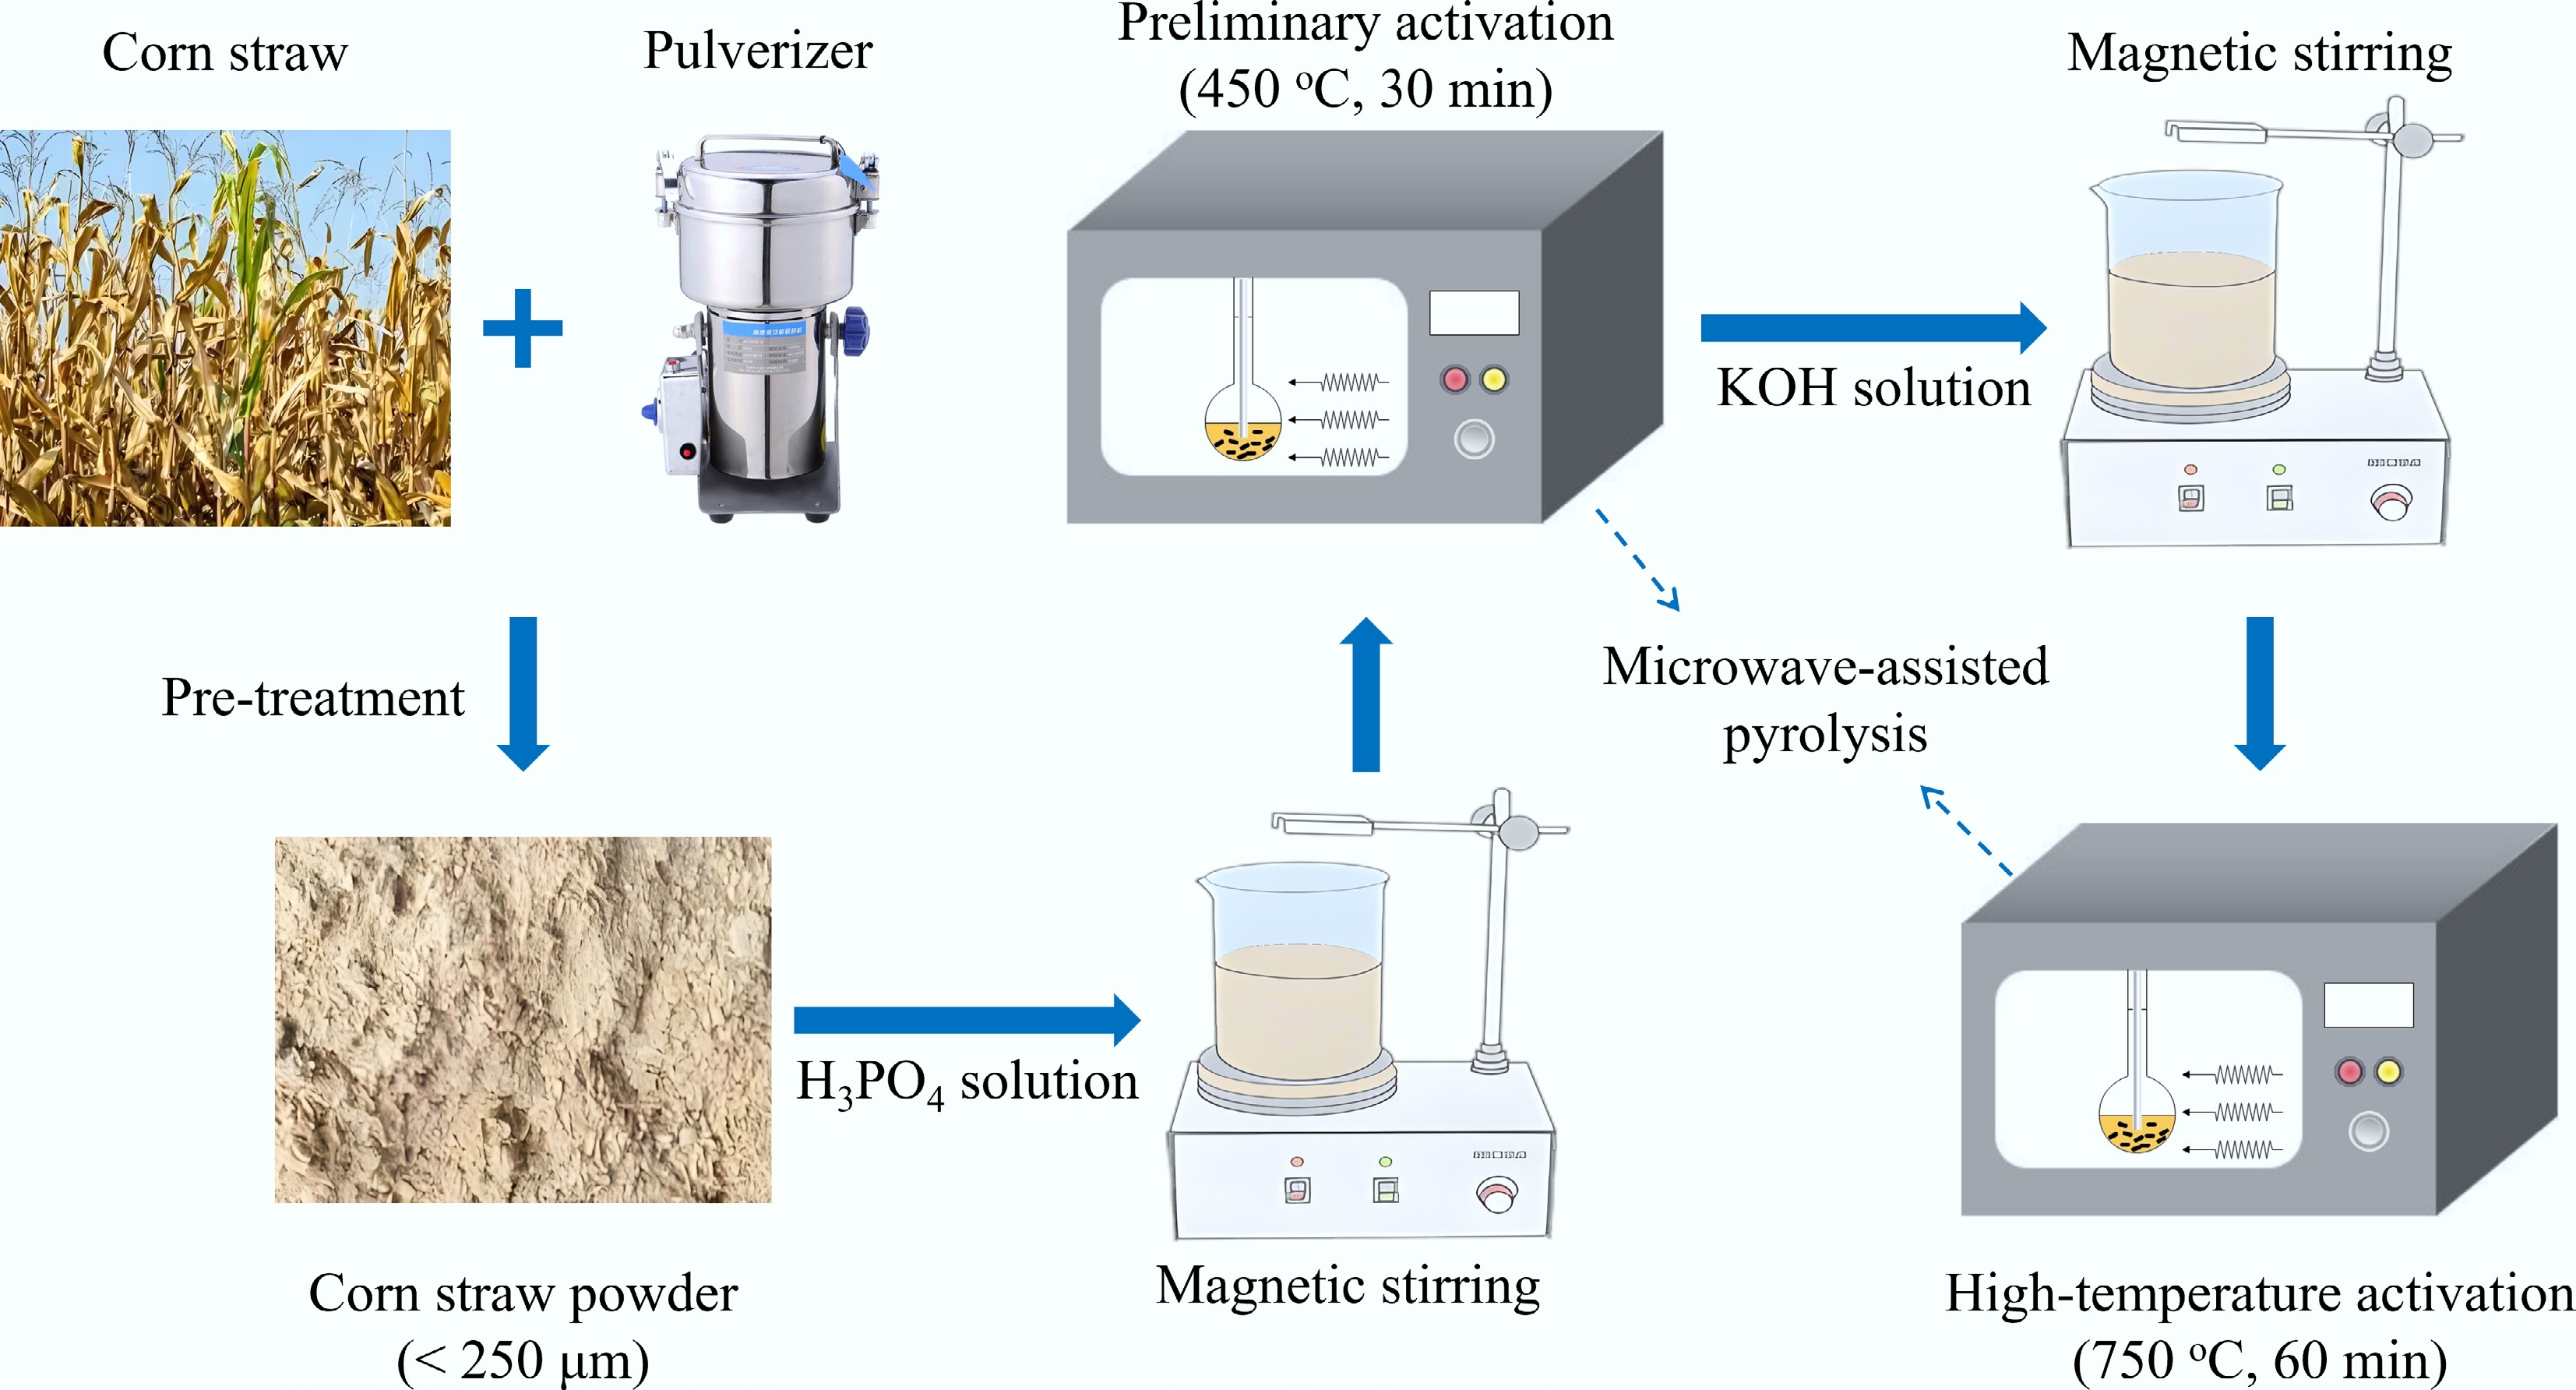
Figure 3.
Two-step activation experimental process.
-
Figure 4.
Nitrogen adsorption and desorption isotherms for different samples.
-
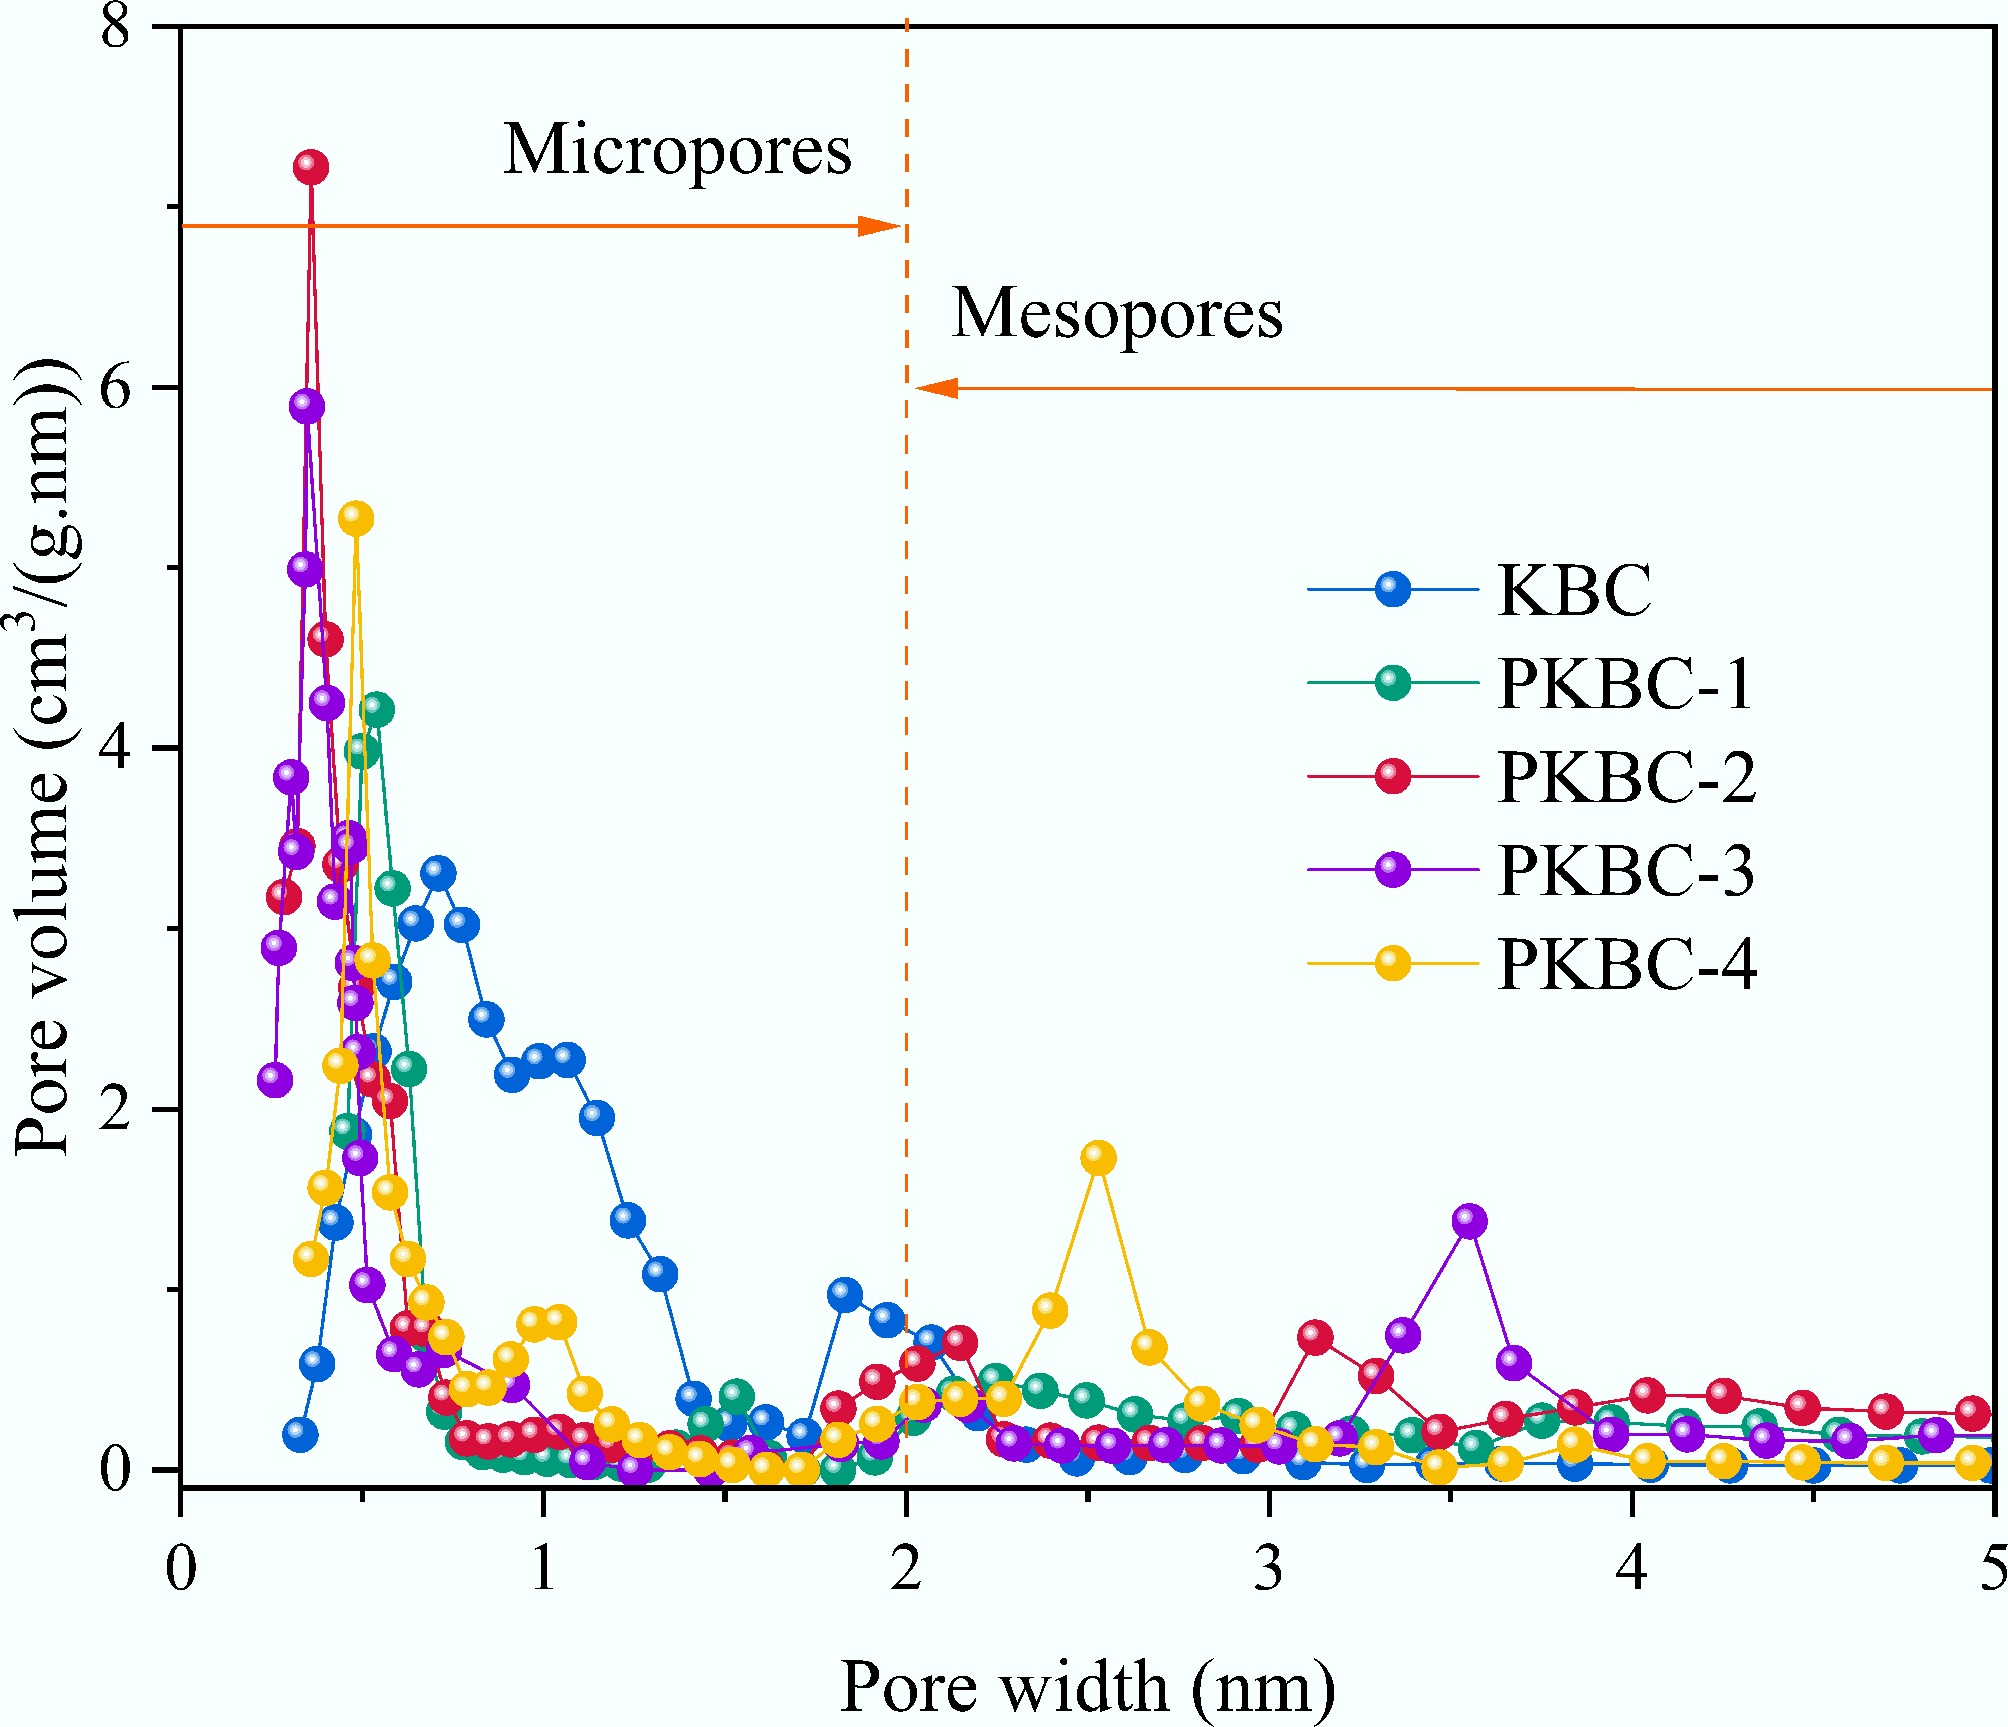
Figure 5.
Pore size distribution of different samples.
-
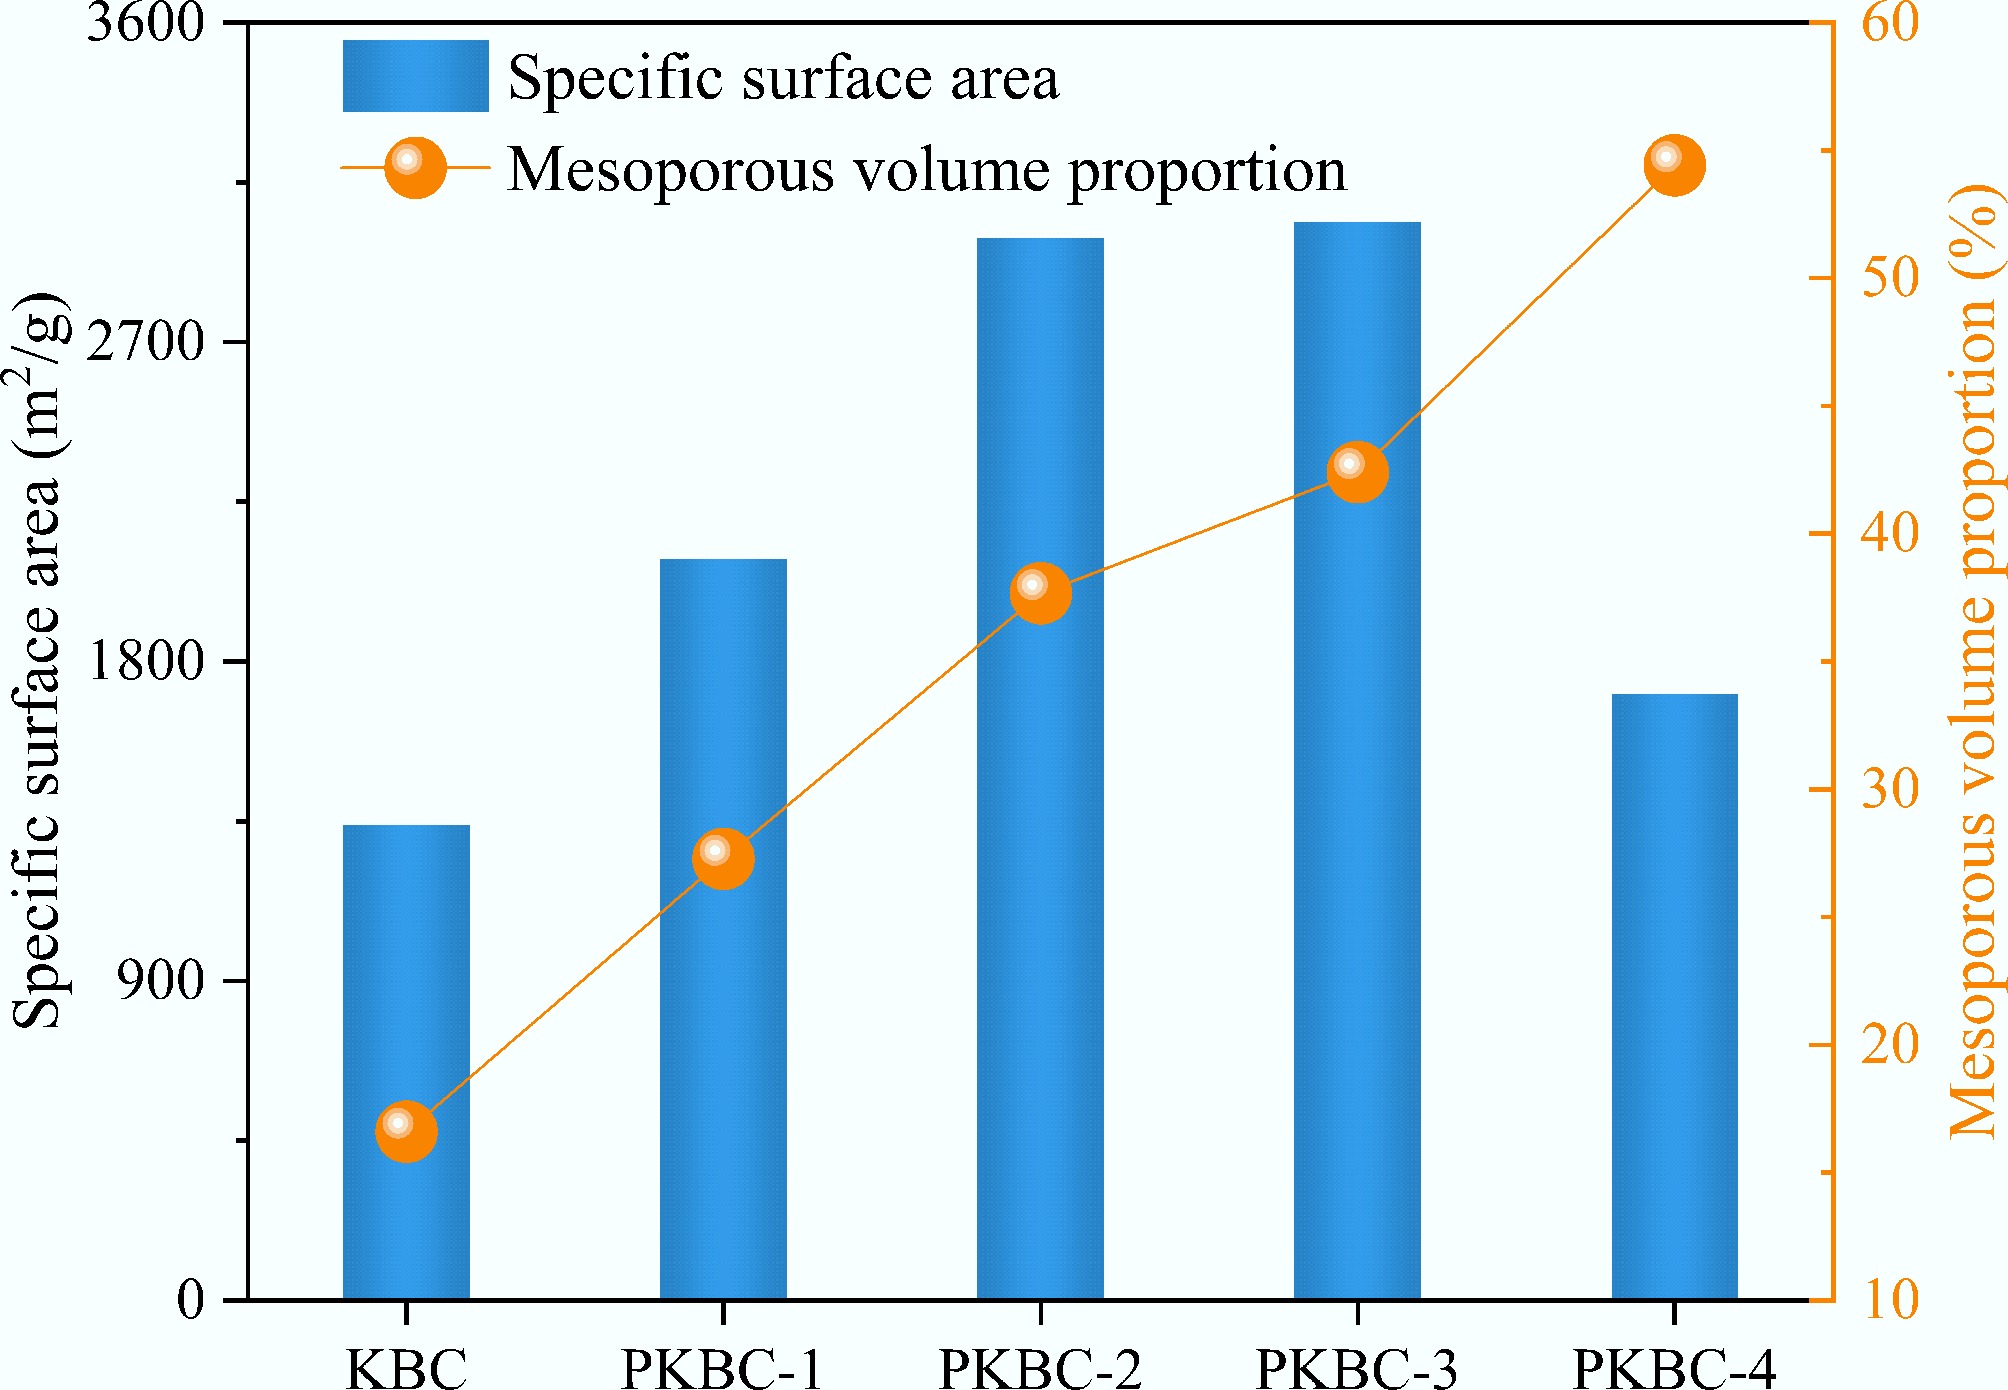
Figure 6.
Mesoporous volume proportion of different samples.
-
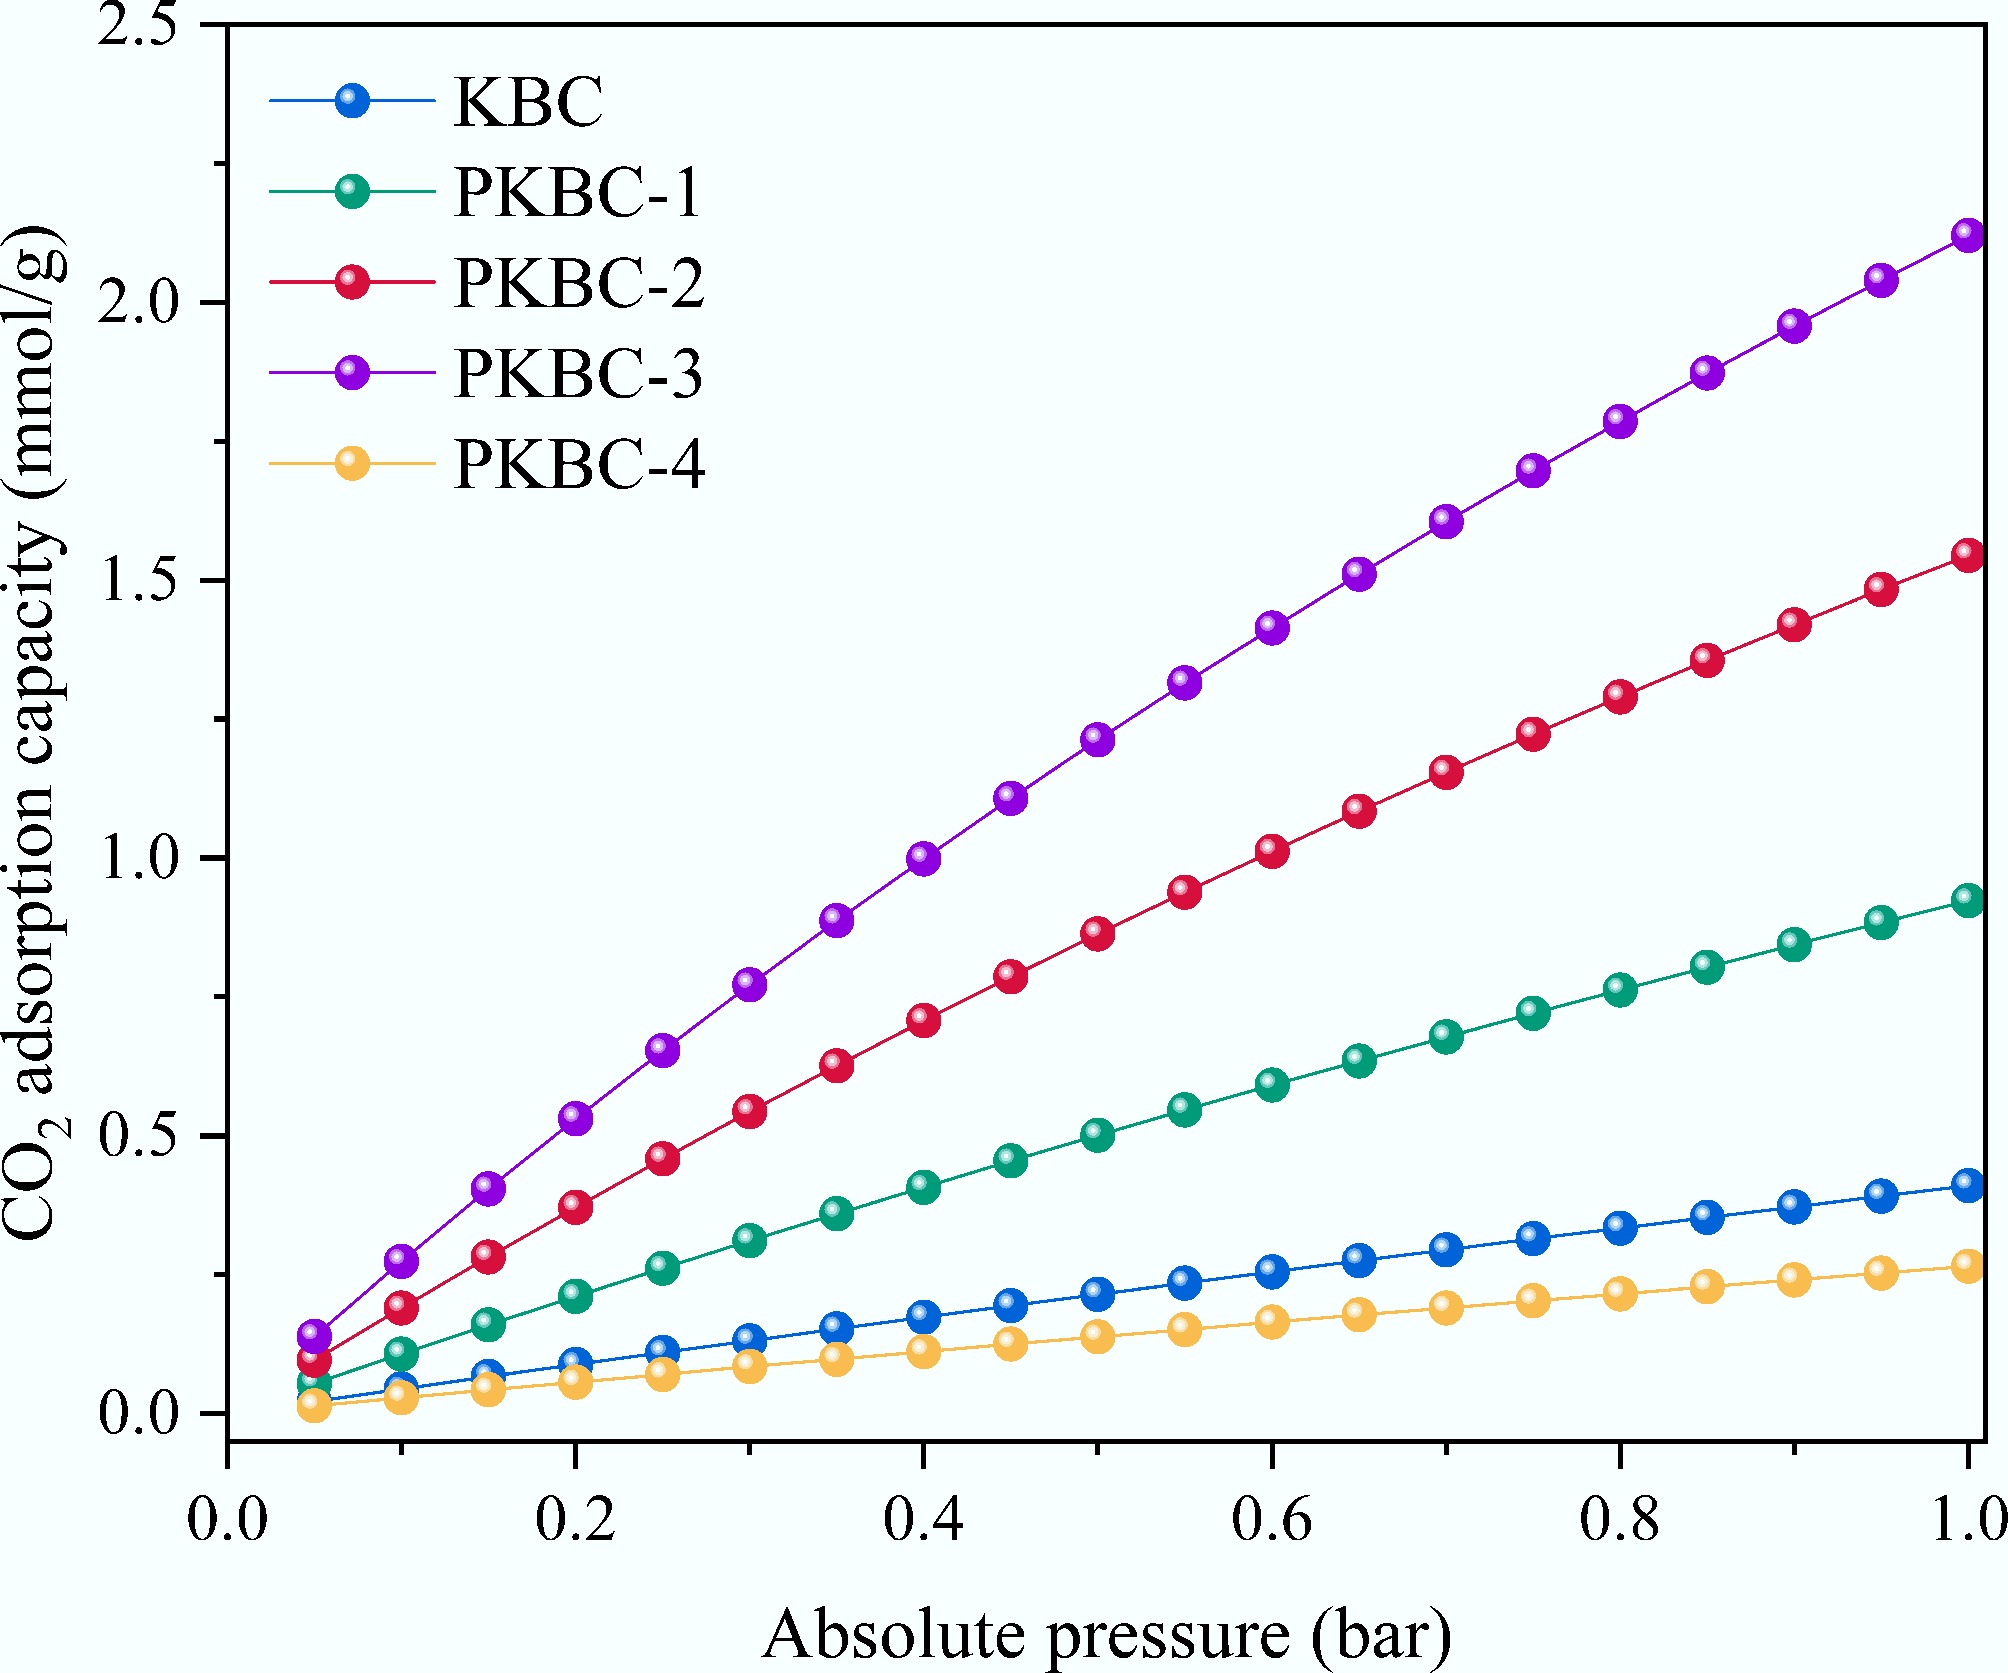
Figure 7.
CO2 adsorption isotherms of different samples at 1 bar and 25 °C.
-
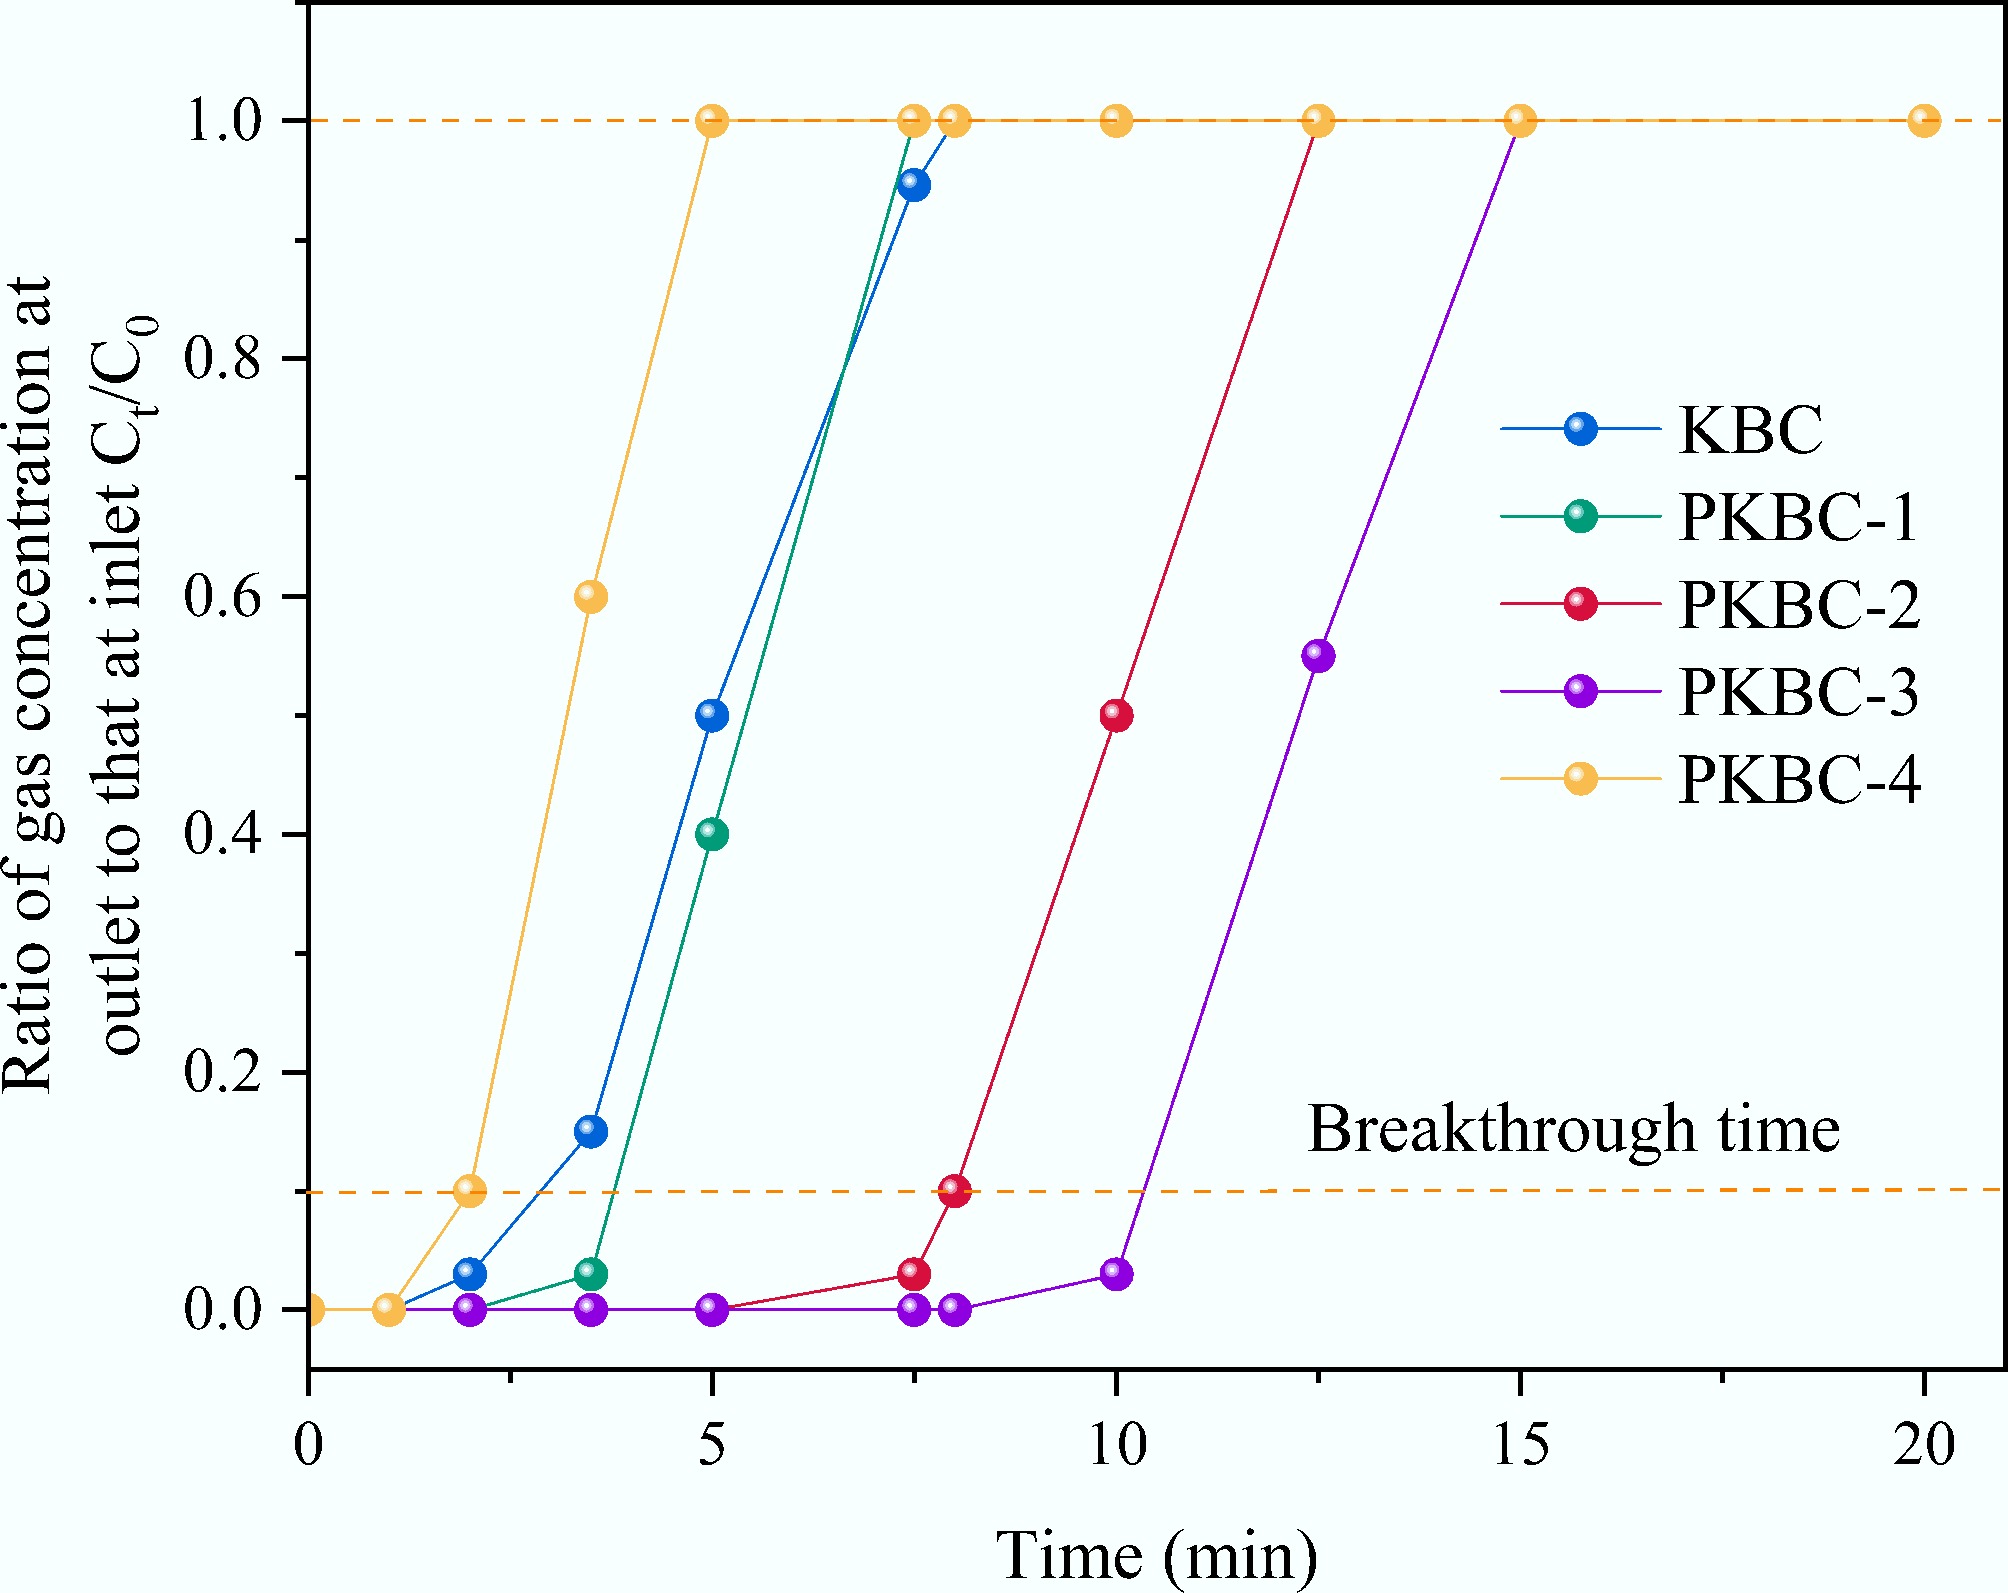
Figure 8.
The breakthrough curves of different samples at 25 °C.
-
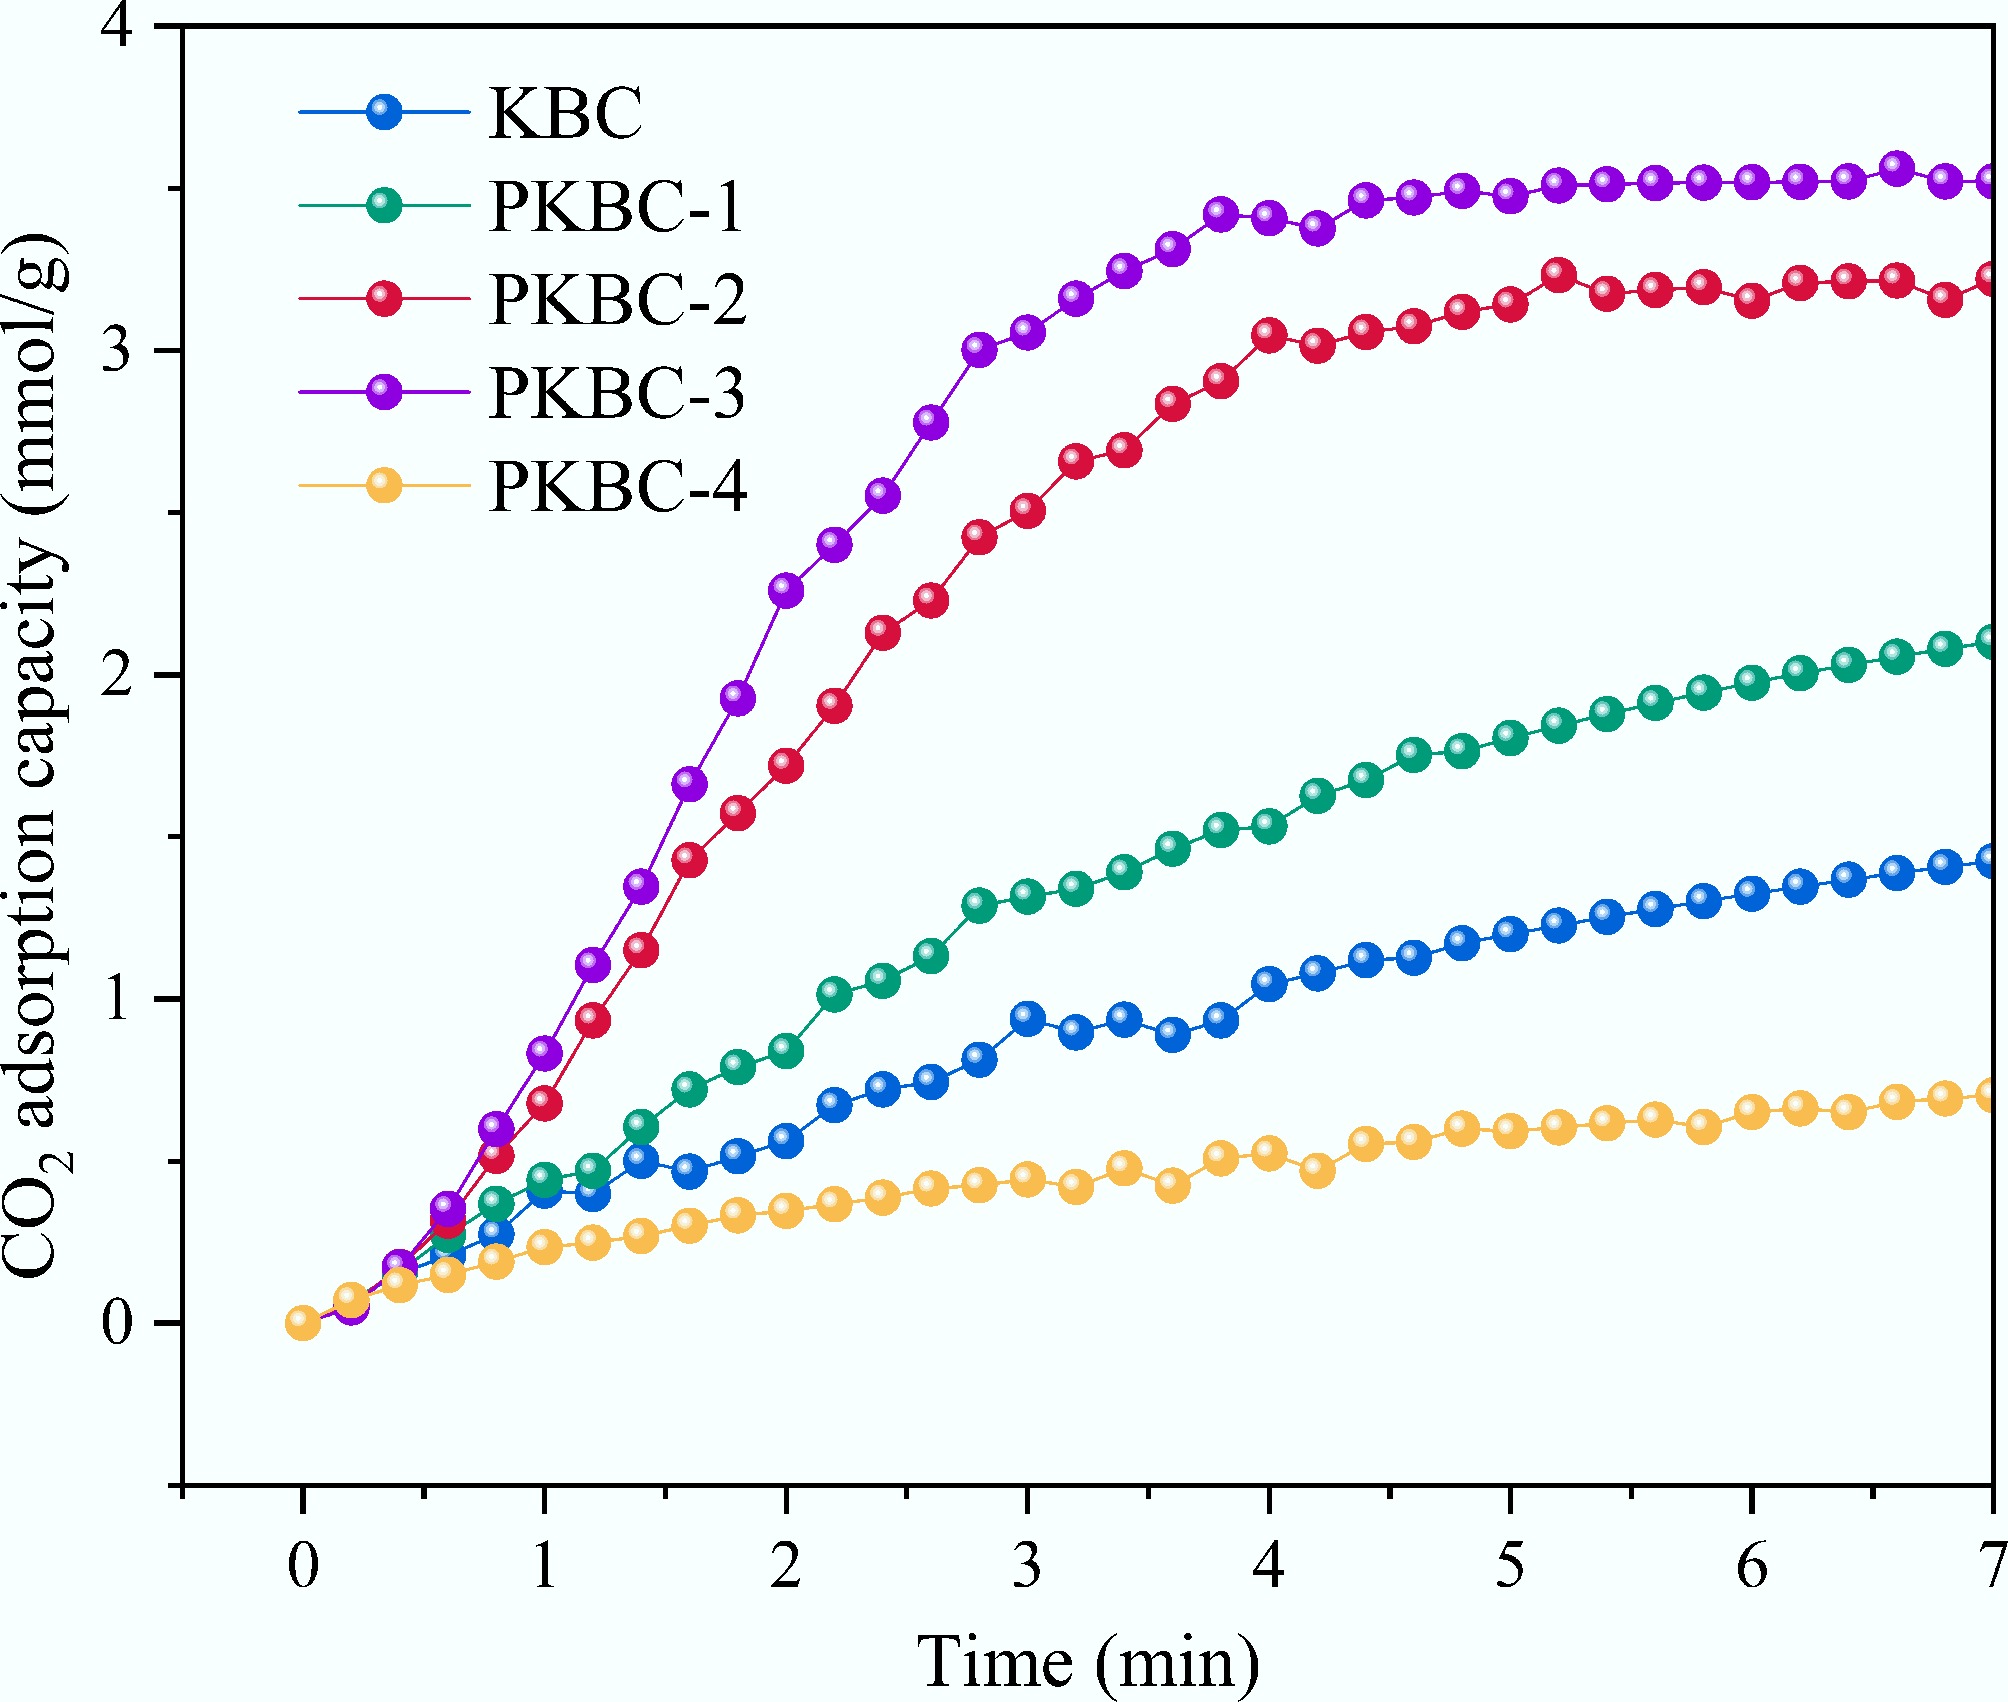
Figure 9.
Adsorption kinetics curves for CO2 adsorption of different samples at 25 °C.
-
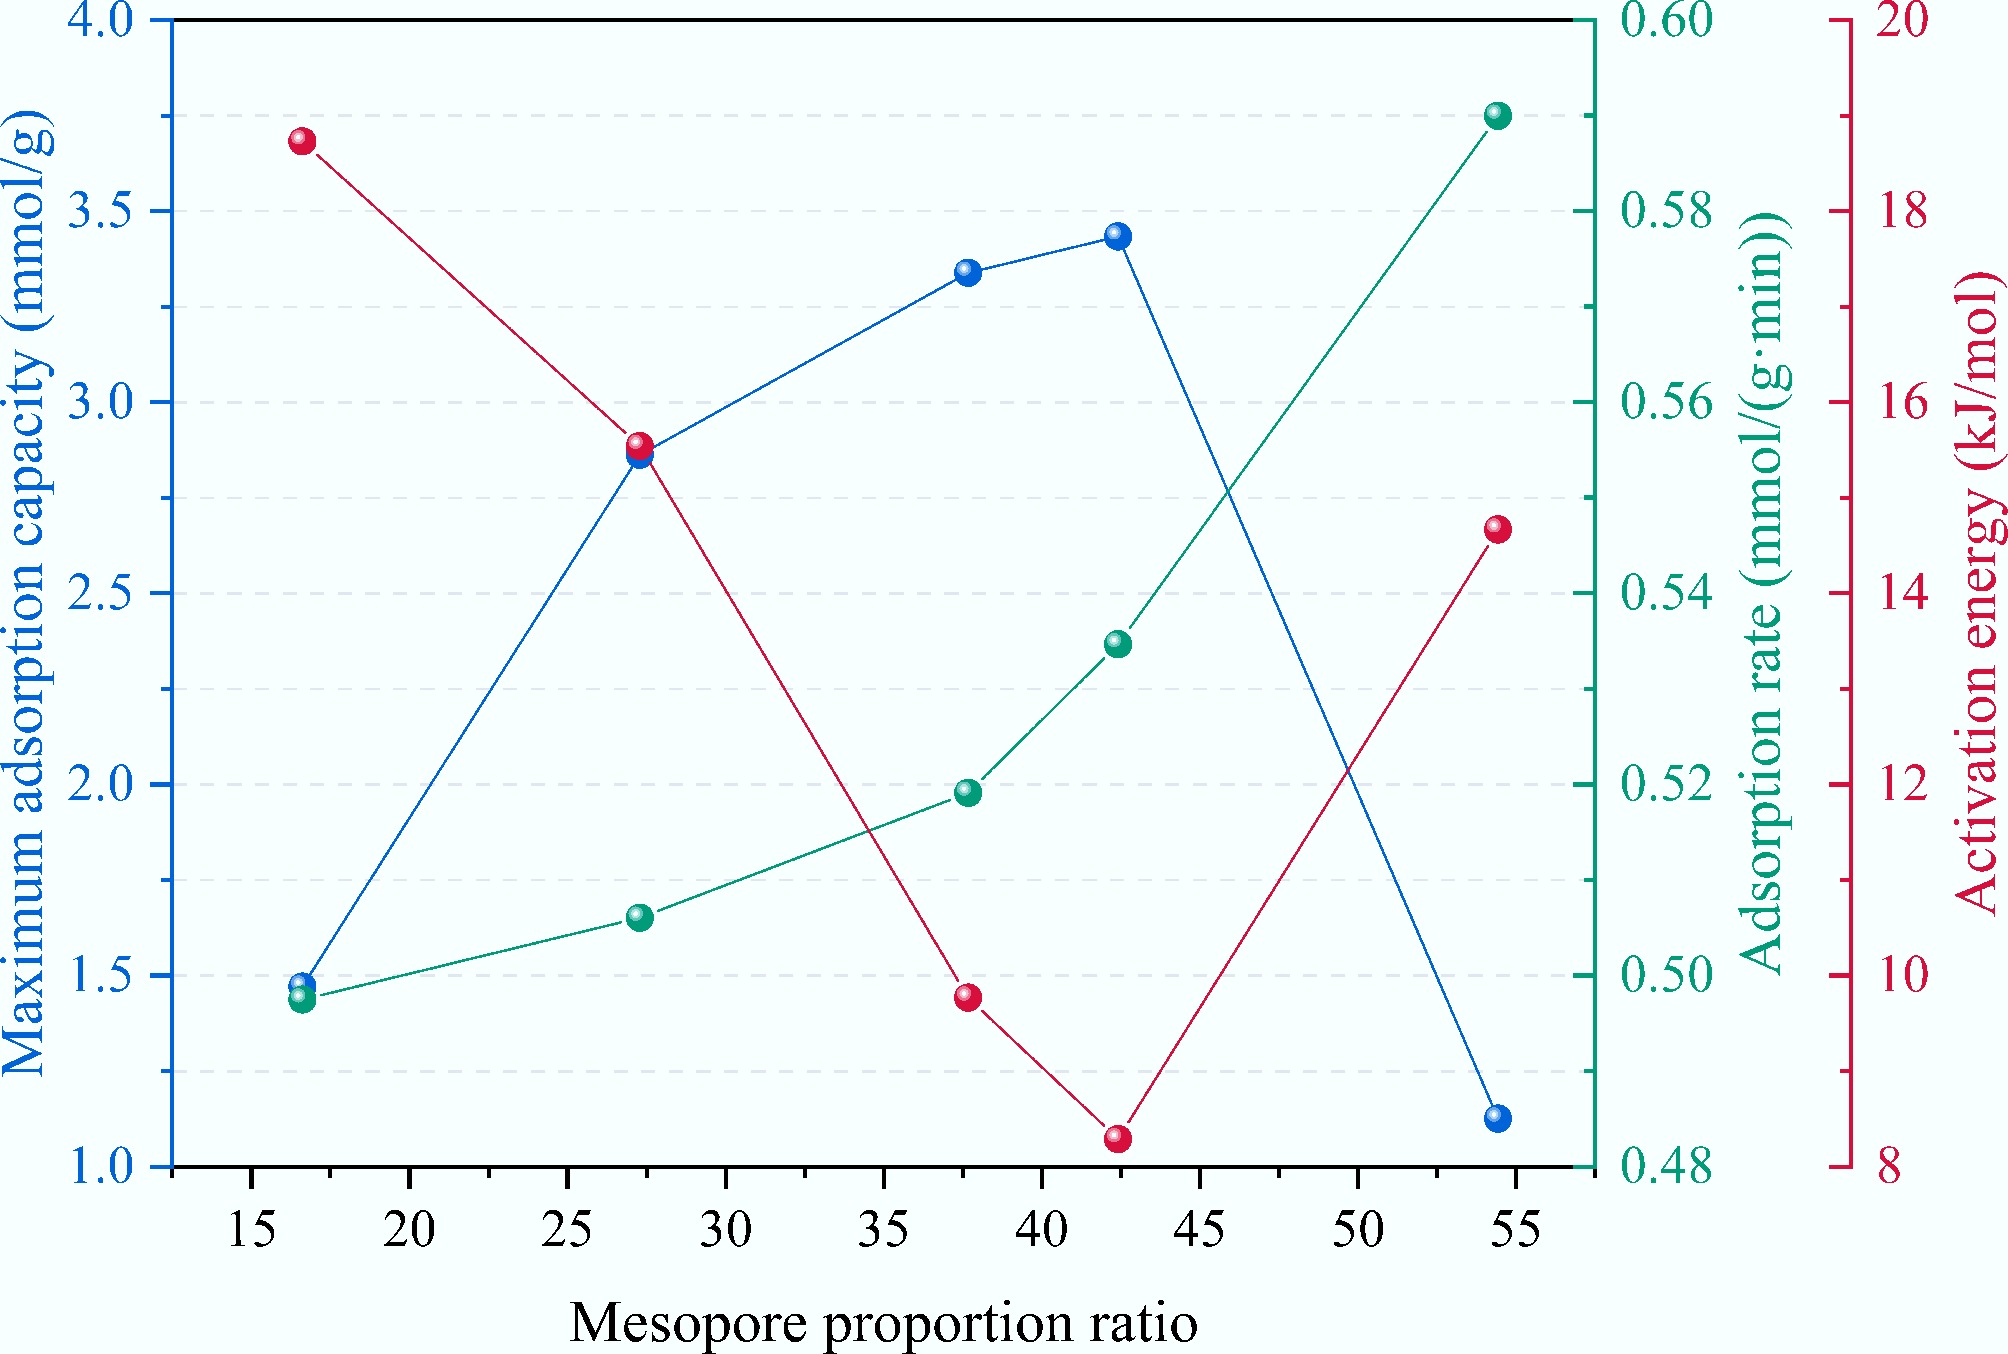
Figure 10.
The maximum adsorption capacity, average adsorption rate, and activation energy for CO2 adsorption of different samples.
-
Item Value Proximate analysis (wt.%) Moisture 5.11 Ash 8.66 Volatile 71.23 Fixed carbon 15.00 Ultimate analysis (wt.%) C 42.24 H 5.78 O 37.78 N 0.39 S 0.04 Table 1.
Proximate analysis and ultimate analysis of corn straw
-
Sample KBC PKBC-1 PKBC-2 PKBC-3 PKBC-4 H3PO4/biomass 0 1:1 2:1 3:1 4:1 Table 2.
Experimental conditions of biochar activation
-
Sample SSA (m2/g) Vtotal (cm3/g) Vmicro (cm3/g) Vmeso (cm3/g) Vmeso/Vtotal (%) Average pore size (nm) KBC 1,338.74 0.614 0.512 0.102 16.61 1.64 PKBC-1 2,088.10 0.898 0.653 0.345 27.28 1.82 PKBC-2 2,993.07 1.638 1.021 0.617 37.67 1.98 PKBC-3 3,038.92 1.891 1.089 0.802 42.41 1.93 PKBC-4 1,709.26 0.699 0.319 0.380 54.42 2.11 Table 3.
Pore structure parameters of biochar
-
Sample Langmuir parameters Freundich parameters qm
(mmol/g)KL
(/bar)R2 n KF
(mmol/(g·bar1/n))R2 KBC 1.4715 0.1018 0.9993 1.0568 0.4121 0.9976 PKBC-1 2.8623 0.1872 0.9998 1.1031 0.9314 0.9967 PKBC-2 3.3387 0.2677 0.9999 1.1448 1.5635 0.9936 PKBC-3 3.4341 0.3363 0.9929 1.1797 2.1513 0.9908 PKBC-4 1.1255 0.0929 0.9981 1.0523 0.2665 0.9927 Table 4.
Isotherms parameters of different samples
-
Sample qe (mmol/g) k1 (1/min) R2 KBC 1.6615 0.1904 0.9946 PKBC-1 2.1262 0.1837 0.9957 PKBC-2 4.2337 0.3188 0.9709 PKBC-3 4.6811 0.3901 0.9581 PKBC-4 1.1883 0.2812 0.9809 Table 5.
Kinetic parameters of CO2 adsorption of different samples fitted by Pseudo-first order model
-
Sample qe (mmol/g) k2 [g/(mmol·min)] R2 KBC 5.3659 0.0172 0.9945 PKBC-1 8.5141 0.0102 0.9946 PKBC-2 11.6545 0.0169 0.9620 PKBC-3 11.7385 0.0219 0.9440 PKBC-4 1.7005 0.0811 0.9856 Table 6.
Kinetic parameters of CO2 adsorption of different samples fitted by Pseudo-second order model
-
Sample qe (mmol/g) kA (1/min) n R2 KBC 2.1881 0.1755 0.9725 0.9946 PKBC-1 2.6693 0.2713 1.2194 0.9986 PKBC-2 3.7394 0.4331 1.6640 0.9991 PKBC-3 4.4478 0.4912 1.8423 0.9995 PKBC-4 1.6798 0.0426 0.6701 0.9909 Table 7.
Kinetic parameters of CO2 adsorption of different samples fitted by Avrami model
-
Feedstocks Conditions SSA (m2/g) Adsorption capacity (mmol/g) Ref. Corn straw KOH : biochar = 2:1, tube furnace, 700 °C, 60 min 1,631.77 3.06 at 25 °C [42] Corn straw KOH : biochar = 0.1:1, biomass gasifier, 450 °C, 120 min 365.11 2.88 [43] Corn straw TEPA, muffle furnace, 700 °C, 120 min 423 2.38 at 60 °C [44] Pine KOH : biochar = 2:1, tube furnace, 800 °C, 60 min 1,709.04 3.79 at 25 °C [42] Sugarcane bagasse TEPA, muffle furnace, 700 °C, 120 min 352 2.22 at 60 °C [44] Miscanthus TEPA, muffle furnace, 700 °C, 120 min 532 2.89 at 60 °C [44] Switchgrass TEPA, muffle furnace, 700 °C, 120 min 520 2.51 at 60 °C [44] Rambutan peel Tube furnace, 900 °C, 90 min 569.64 1.56 at 30 °C [45] Rice husk KOH : biochar = 1:1, 750 °C 1439 3.51 at 25 °C [46] Blue algal KOH : biochar = 0.5:1, tube furnace, 800 °C, 120 min 1,018.55 2.76 at 25 °C [47] Poplar wood chip K2C2O4, 800 °C, 120 min 1,418 3.82 at 25 °C [48] Corn straw H3PO4 + KOH, 750 °C, 60 min 3,038.92 3.43 at 25 °C This study Table 8.
SSAs and CO2 adsorption capacities of biochars
Figures
(10)
Tables
(8)