-
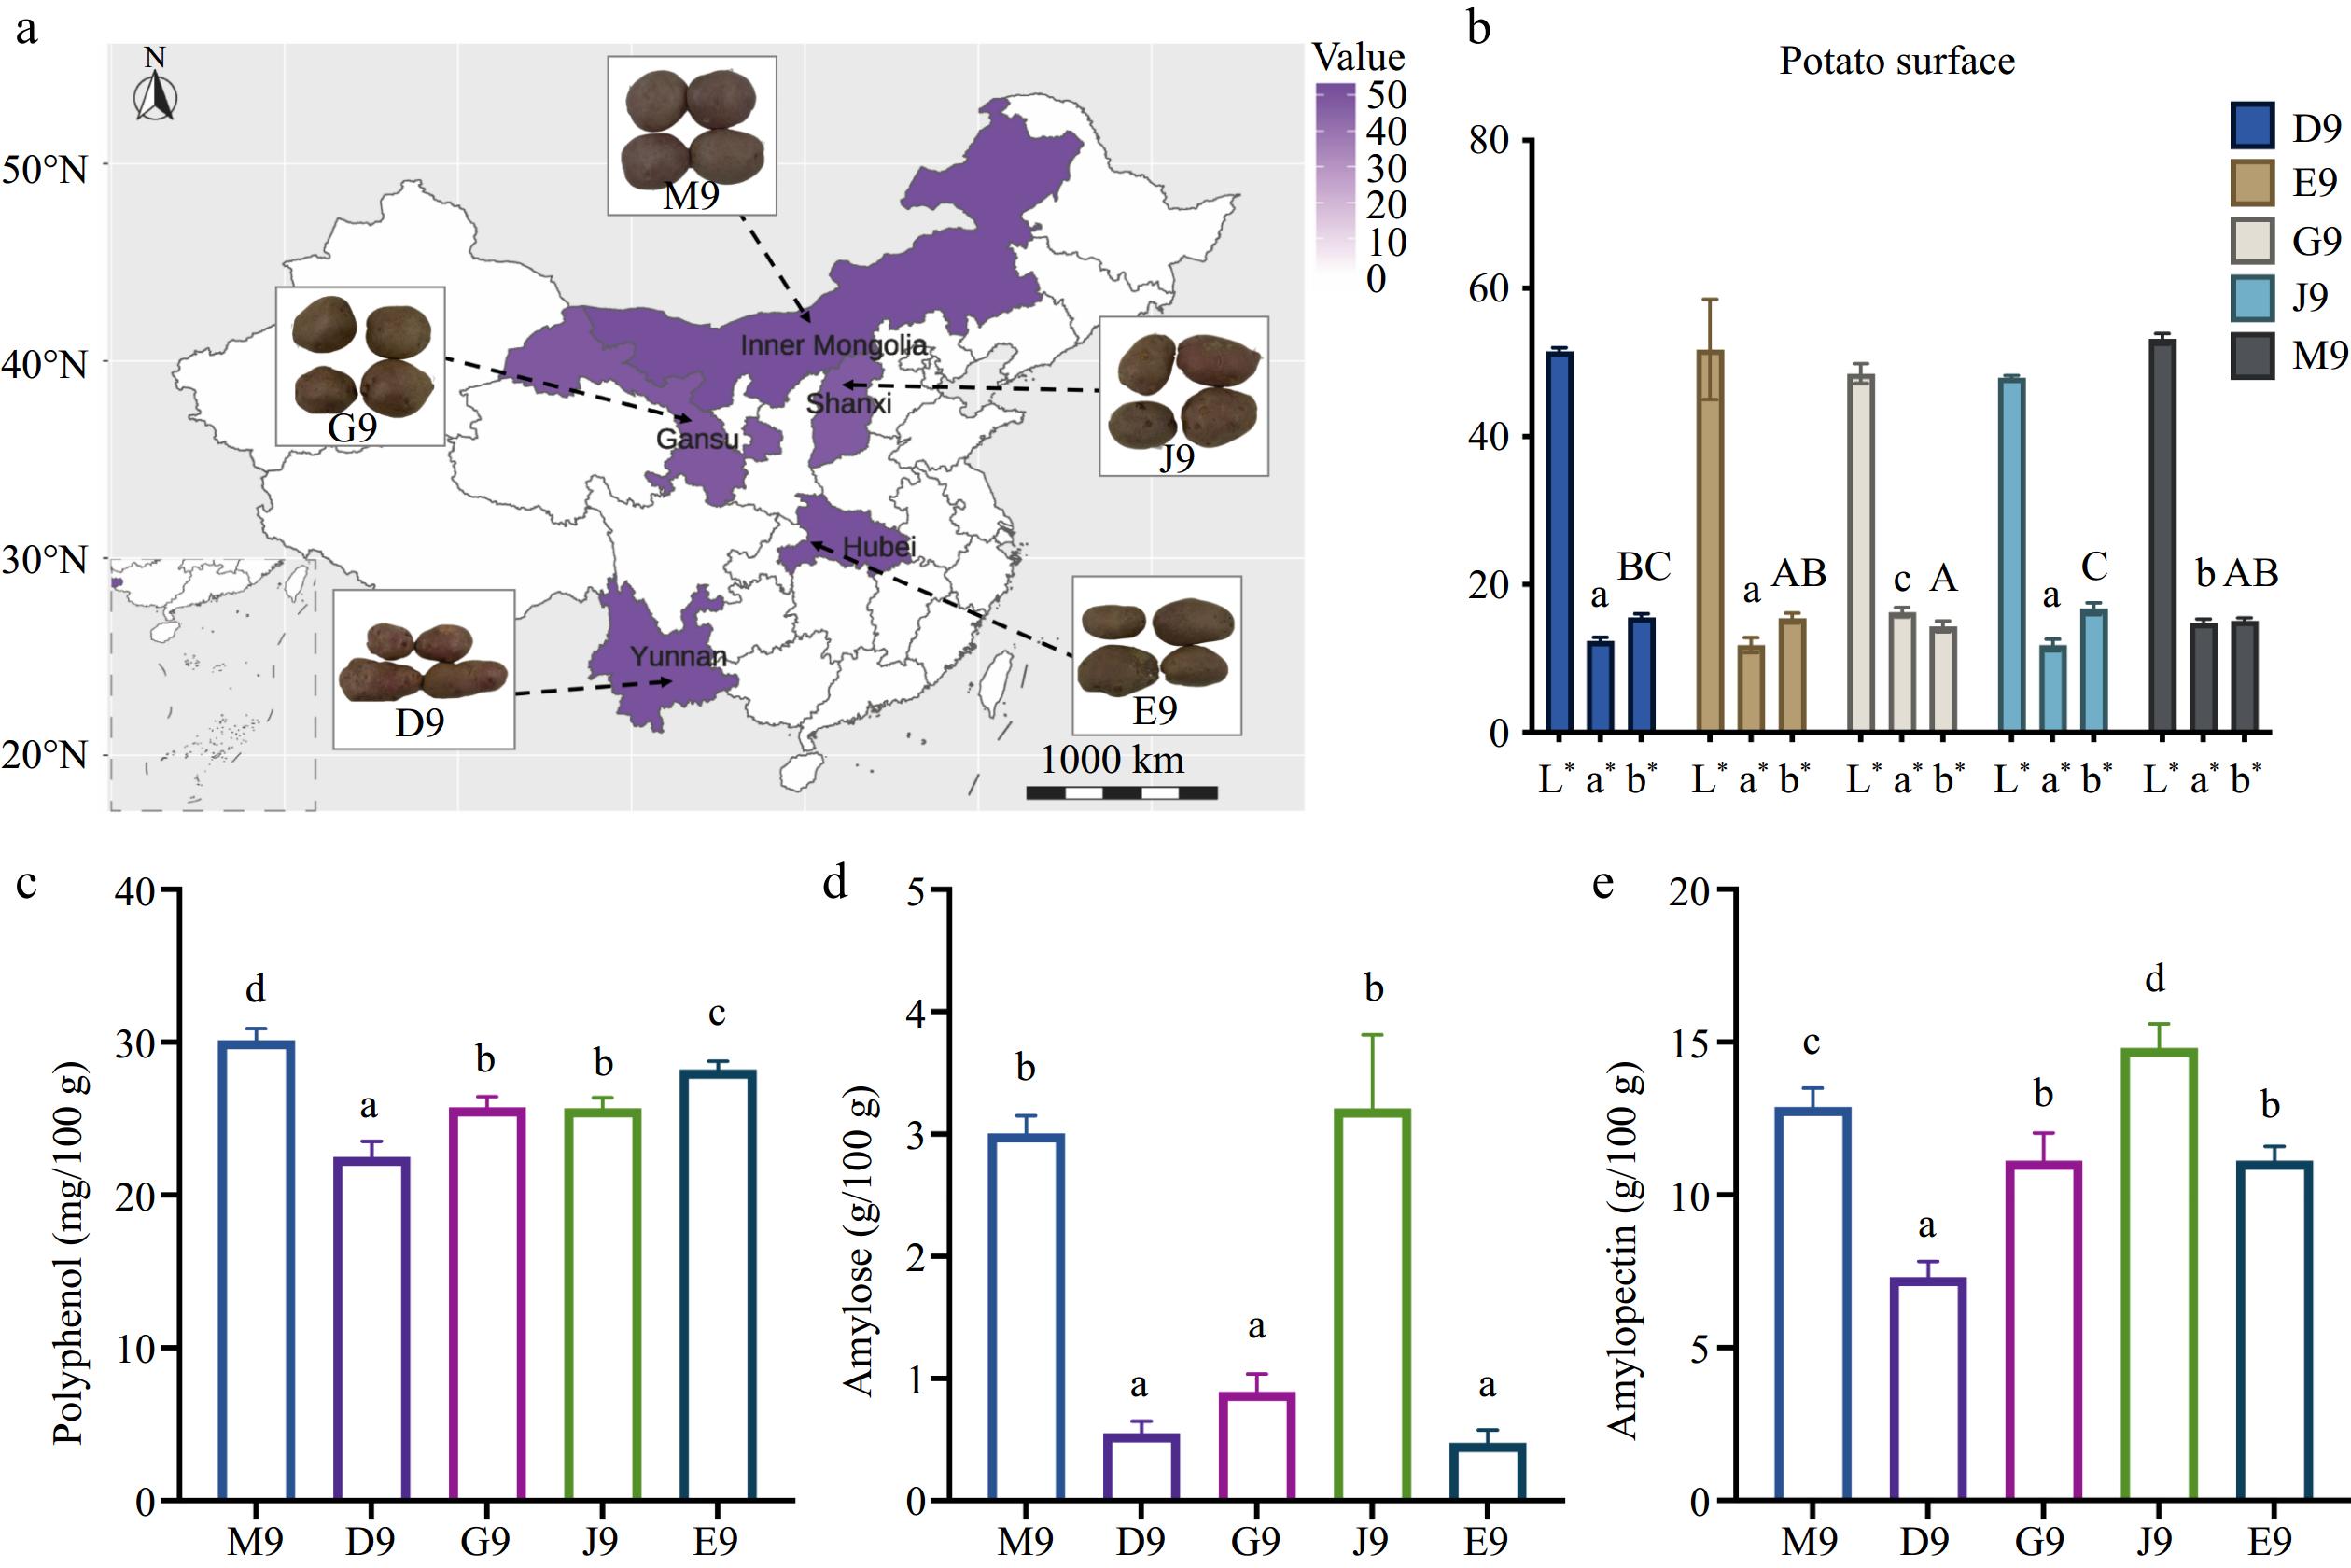
Figure 1.
(a) Geographical locations for cultivation of potato plants in China, the color means the different appearances of the potato surface, the darker the purple means the darker the surface color. (b) Color profile, lowercase letters indicate significant differences in the green-red axis (a*), capital letters indicate significant differences in the blue-yellow axis (b*) by Duncan test (p < 0.05). (c) Total polyphenol content (mg/100 g) in potato. (d) Amylose content (g/100 g). (e) Amylopectin content (g/100 g), lowercase letters indicate significant differences (p < 0.05) of polyphenol, amylose, and amylopectin content among different potatoes.
-
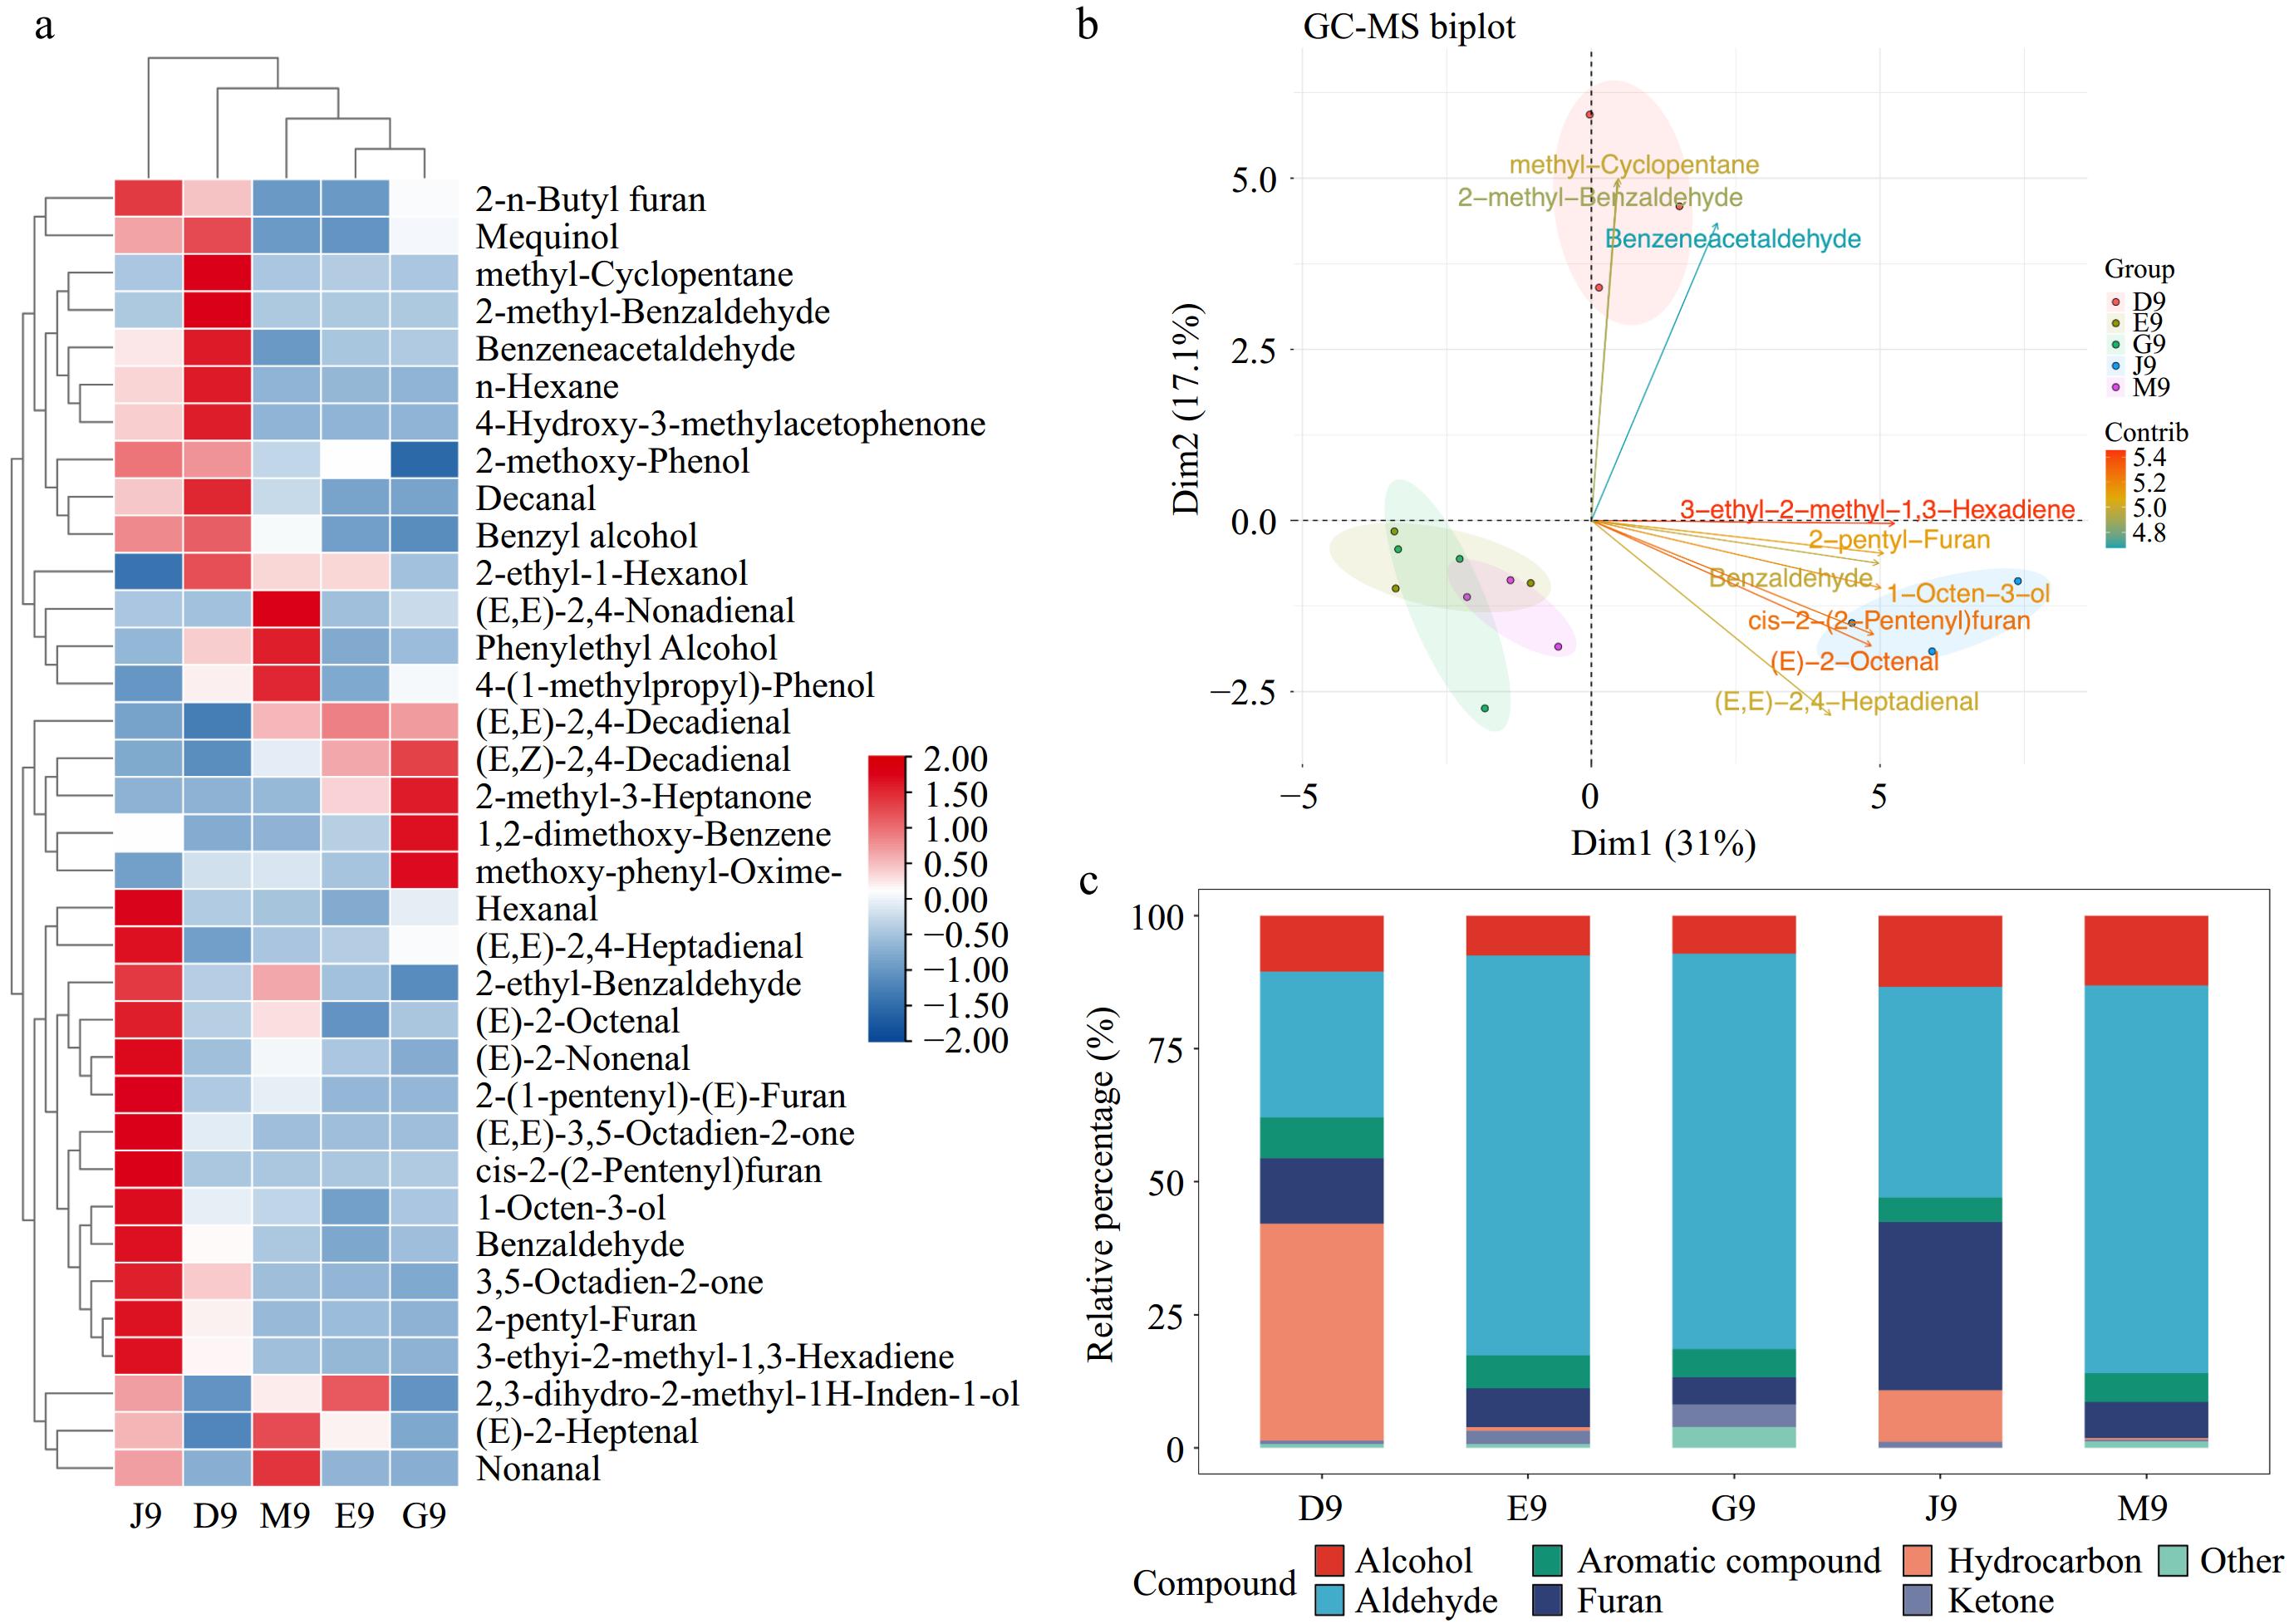
Figure 2.
The analysis of volatile compounds in the potatoes from different areas of China. (a) Heatmap of all volatile compounds. (b) Biplot analysis. (c) Stacked bar chart of volatile compound categories.
-
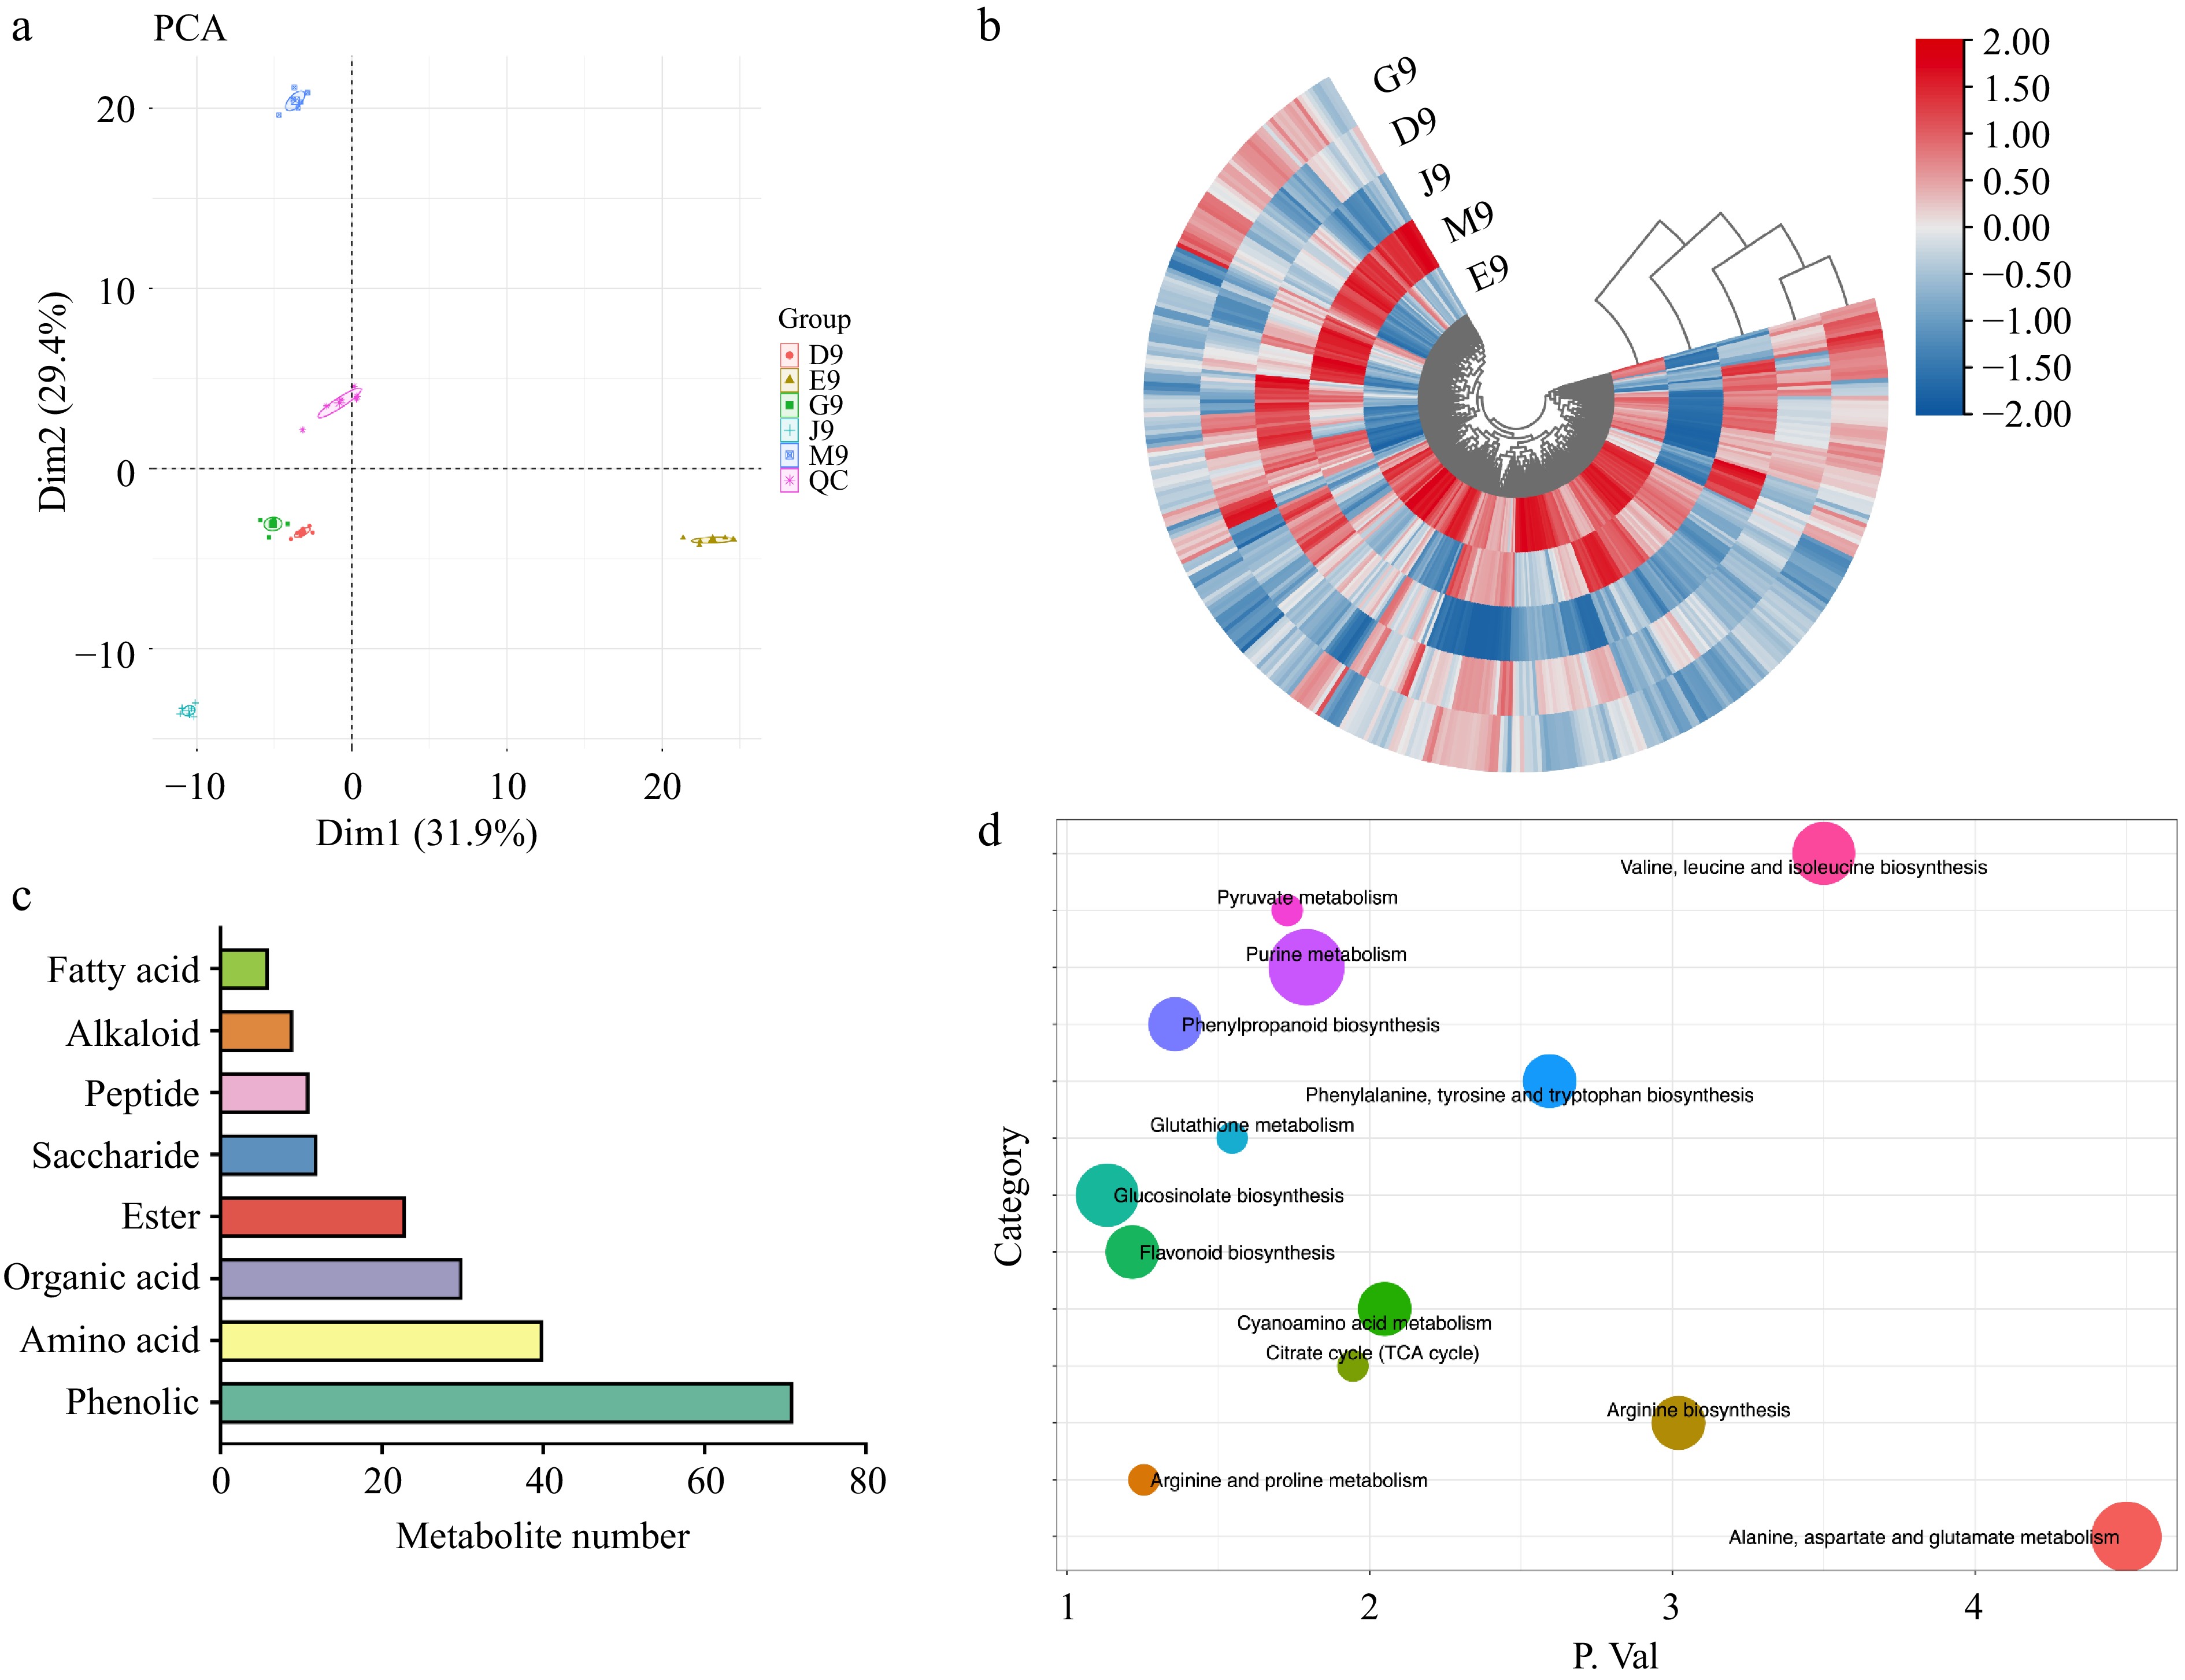
Figure 3.
The analysis of metabolites in the potatoes from different areas of China. (a) PCA analysis. (b) Heatmap of all identified metabolites. (c) Numbers of dominant metabolite categories. (d) KEGG pathways of metabolites.
-
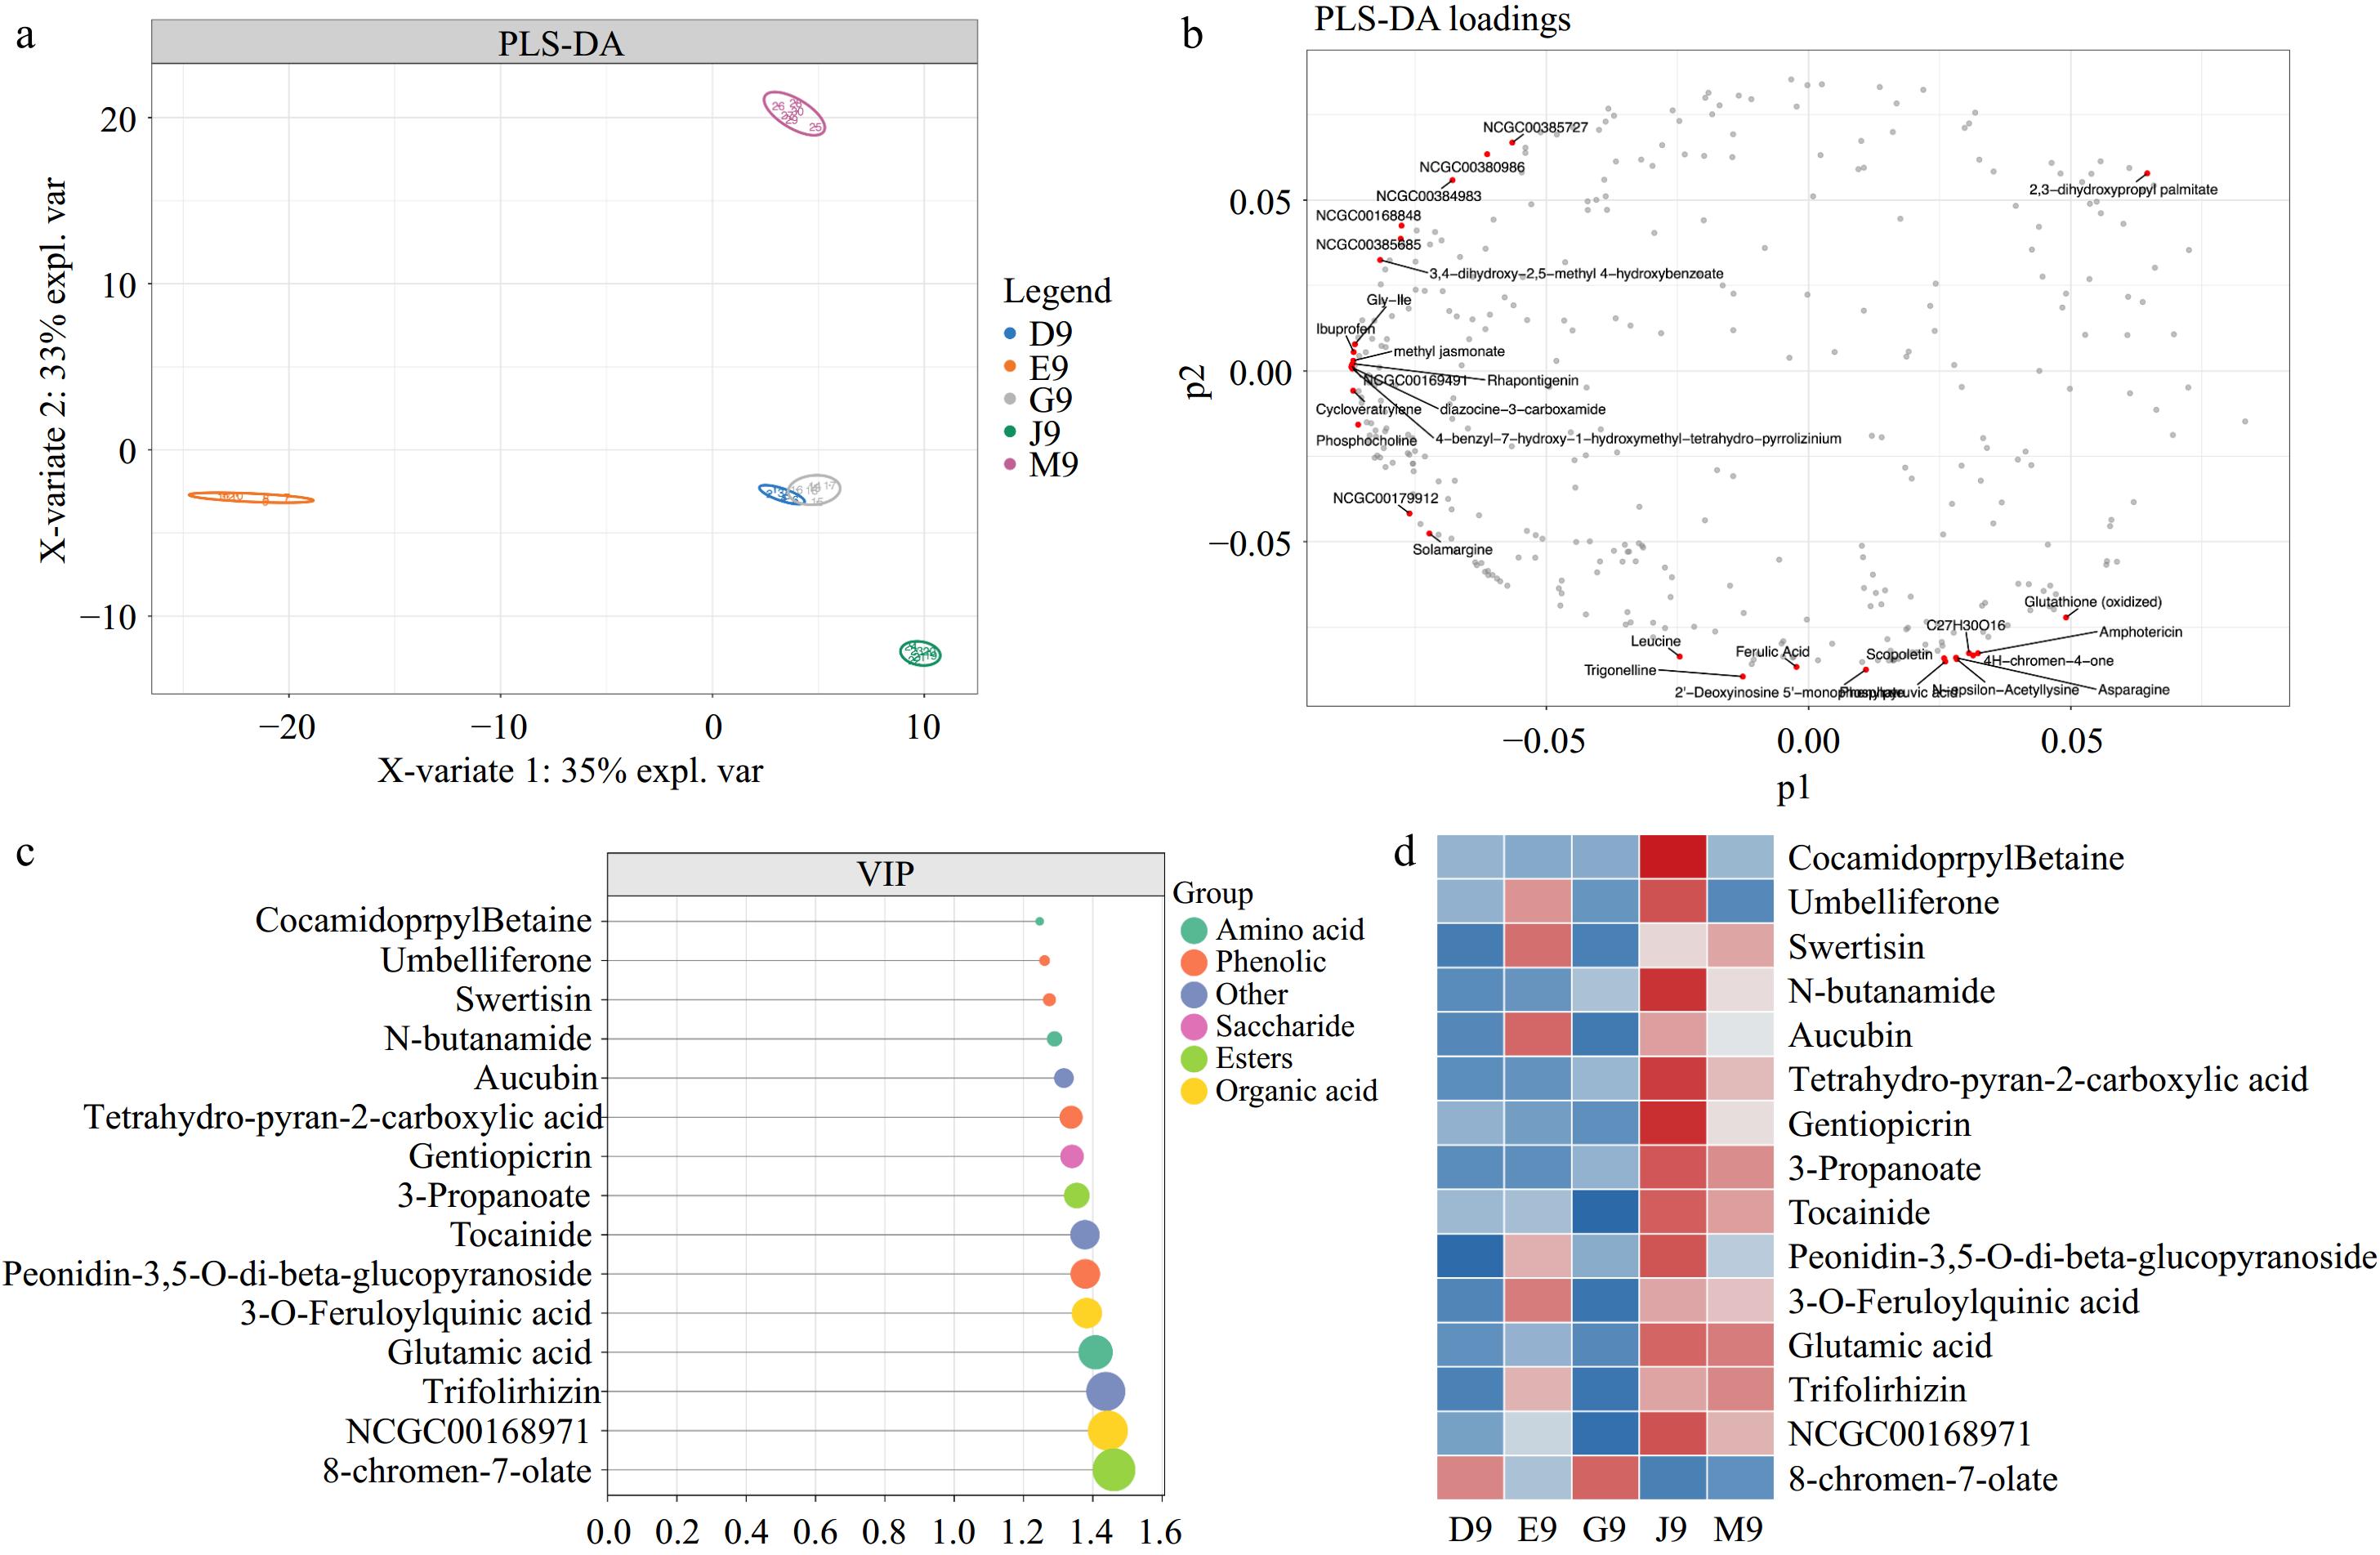
Figure 4.
(a) PLS-DA score plot. (b) PLS-DA loading plot. (c) Metabolites with the top 15 highest VIP values. (d) Heatmap analysis of the intensity of the top 15 VIP metabolites.
-
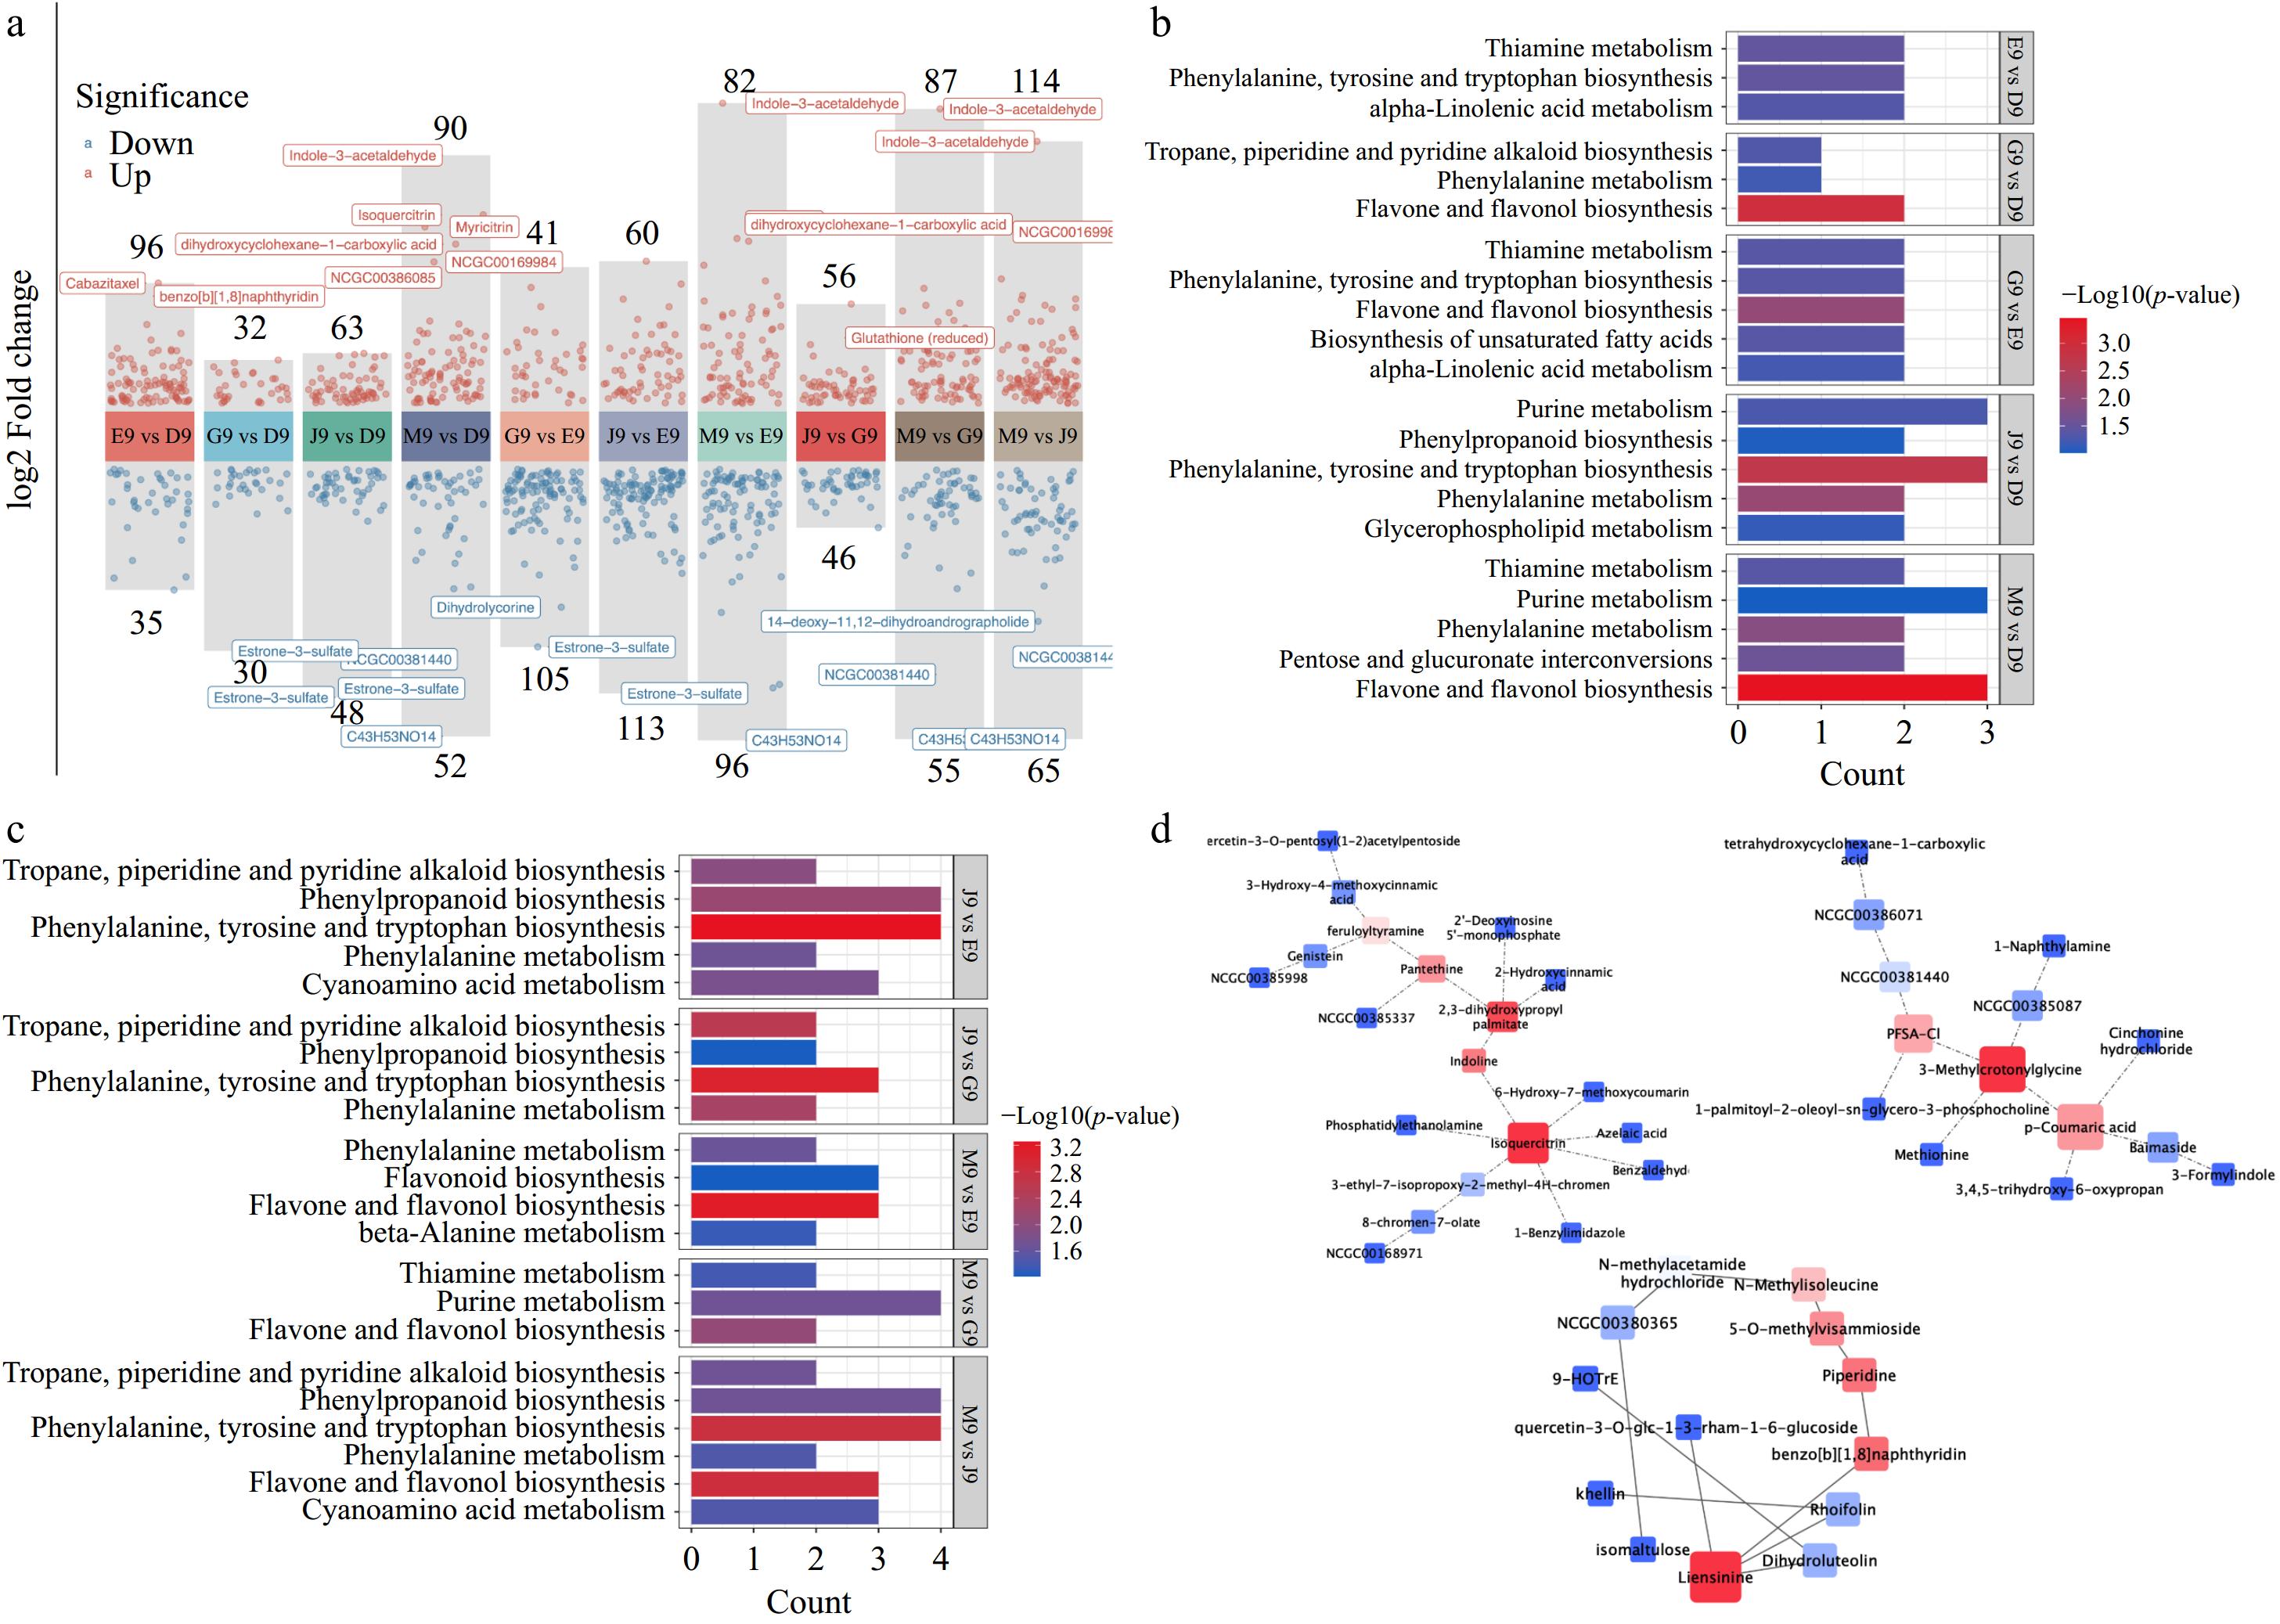
Figure 5.
(a) Volcano plots of metabolites in potatoes from different area of China. (b), (c) KEGG analysis of differently expressed metabolites. (d) Metabolite network analysis of differently expressed metabolites.
-
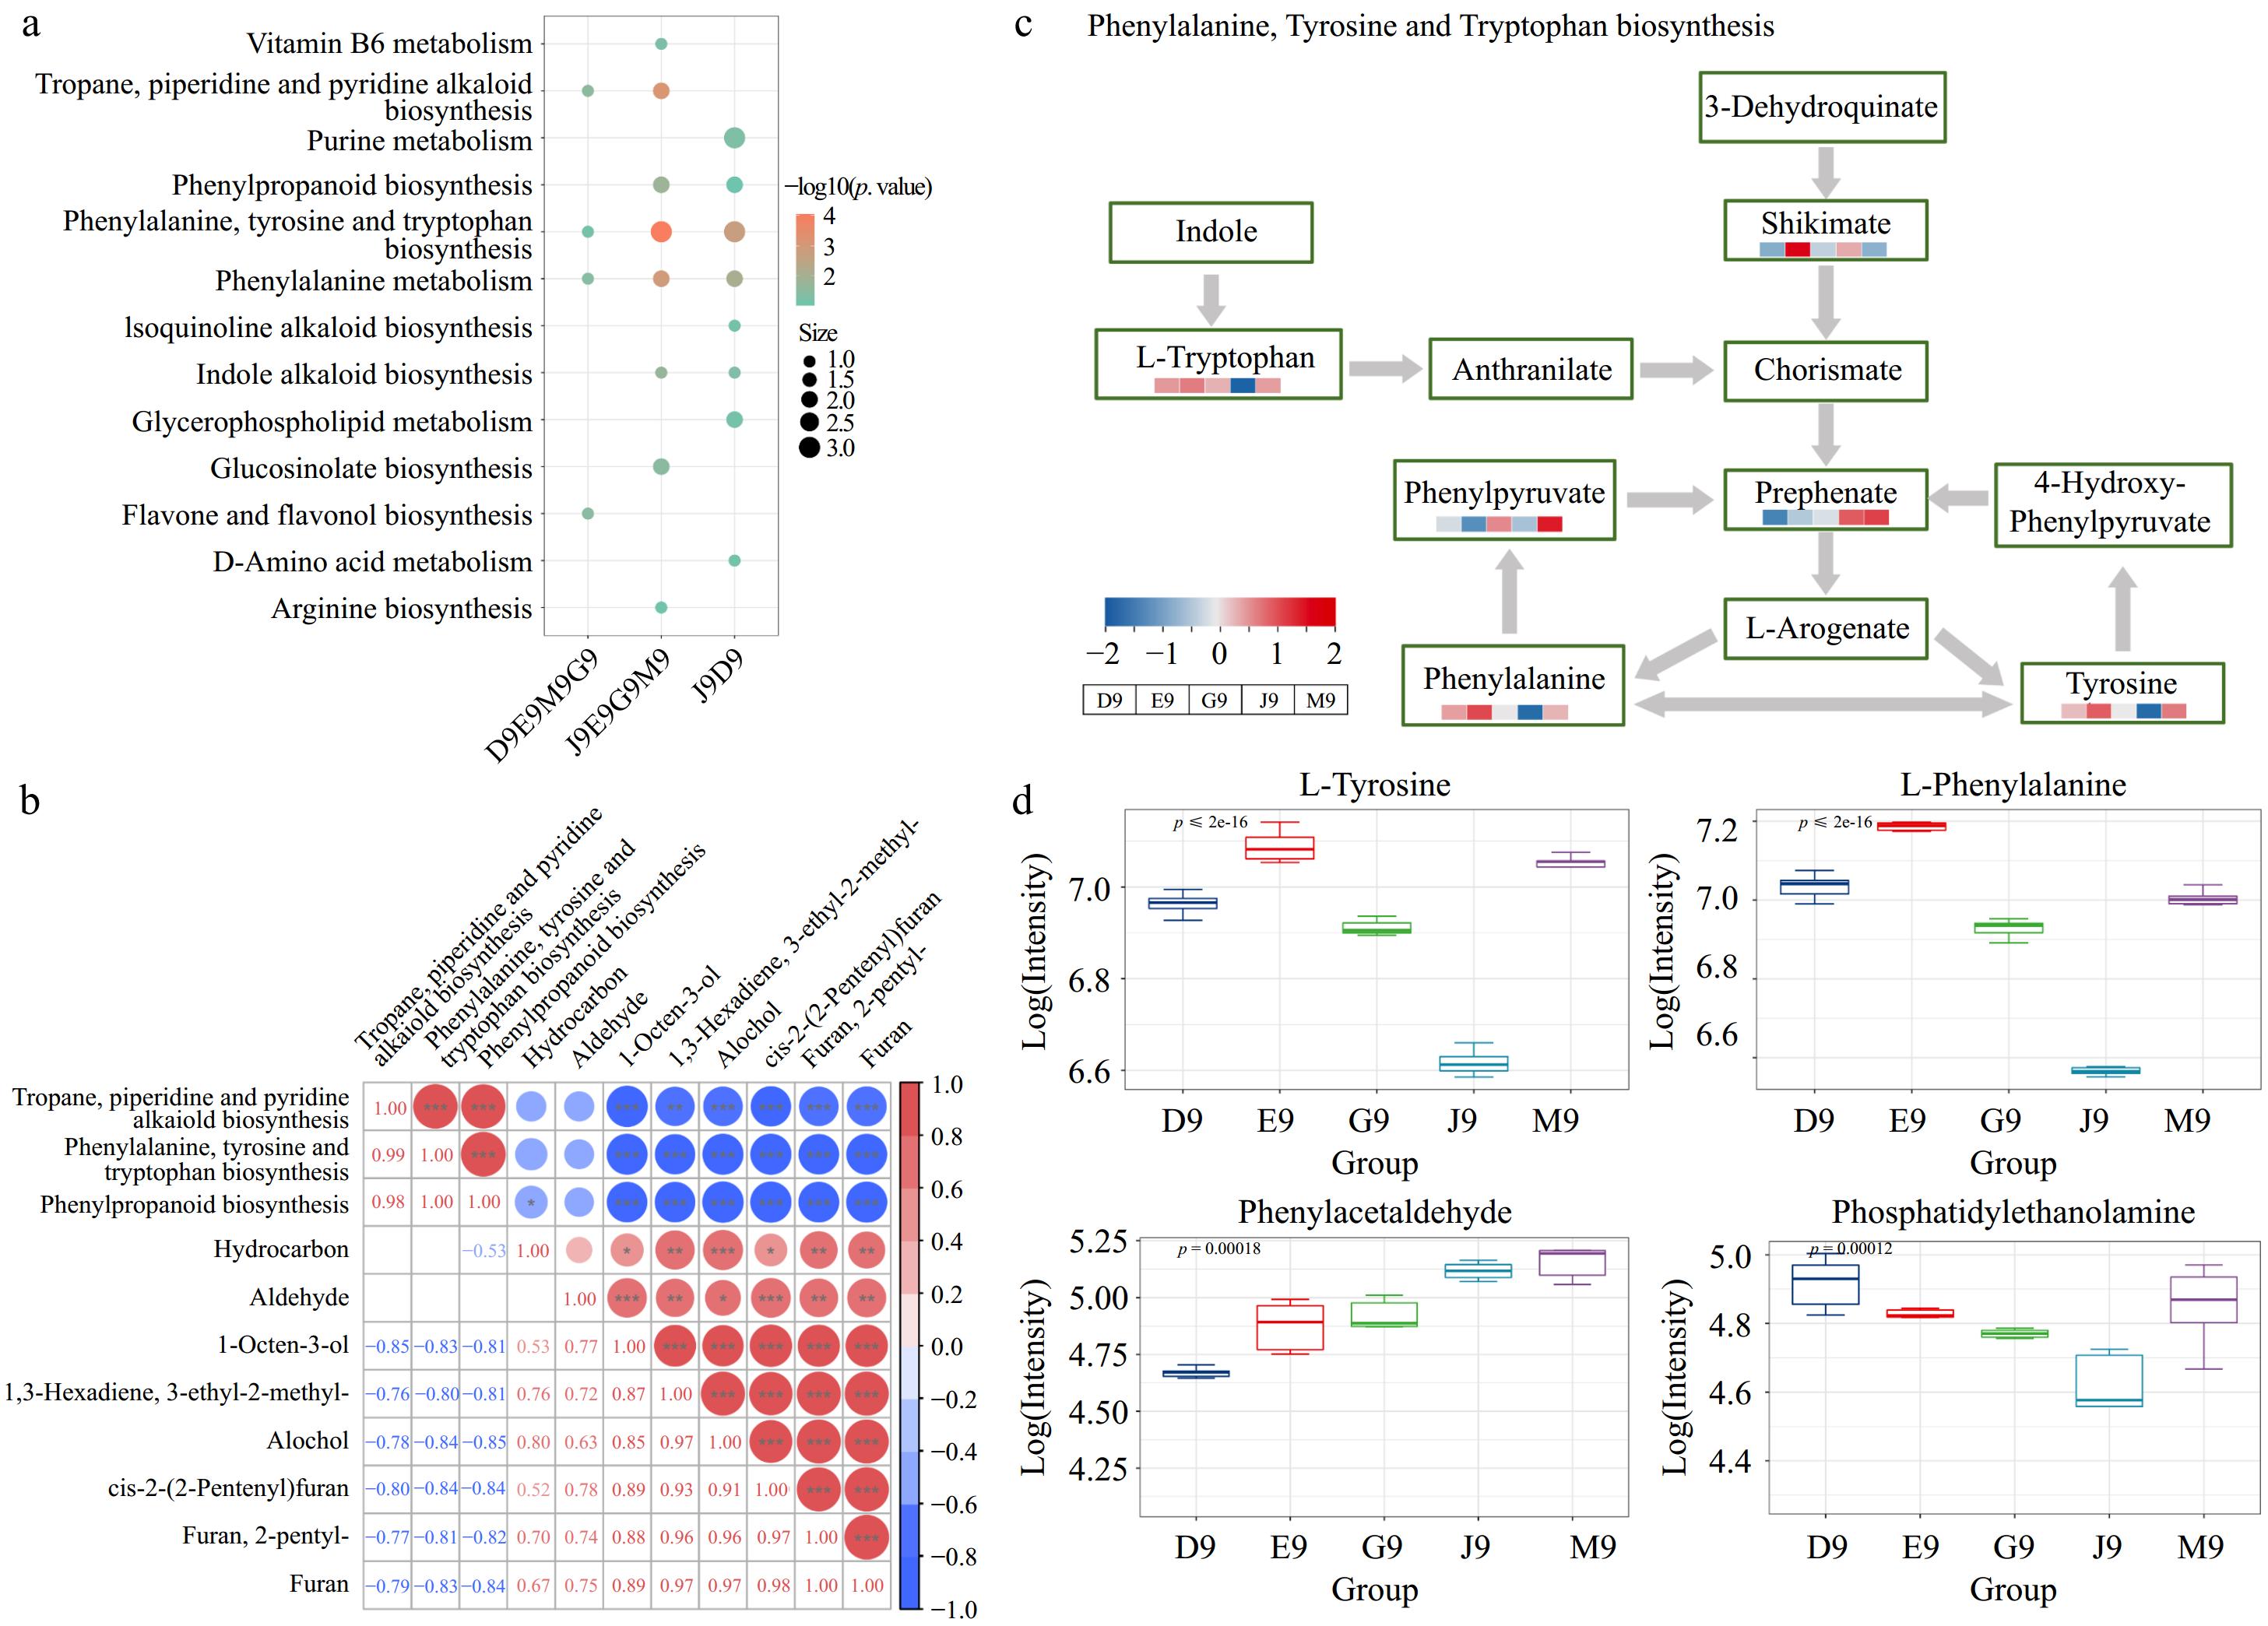
Figure 6.
Correlation analysis of volatile compounds and metabolites in potatoes from different areas of China. (a) Bubble plot of enriched KEGG pathways. (b) Pearson correlation analysis of volatile compounds and identified KEGG pathways. (c) KEGG analysis of identified metabolites in phenylalanine, tyrosine, and tryptophan biosynthesis. (d) Boxplots of several dominant metabolites.
-
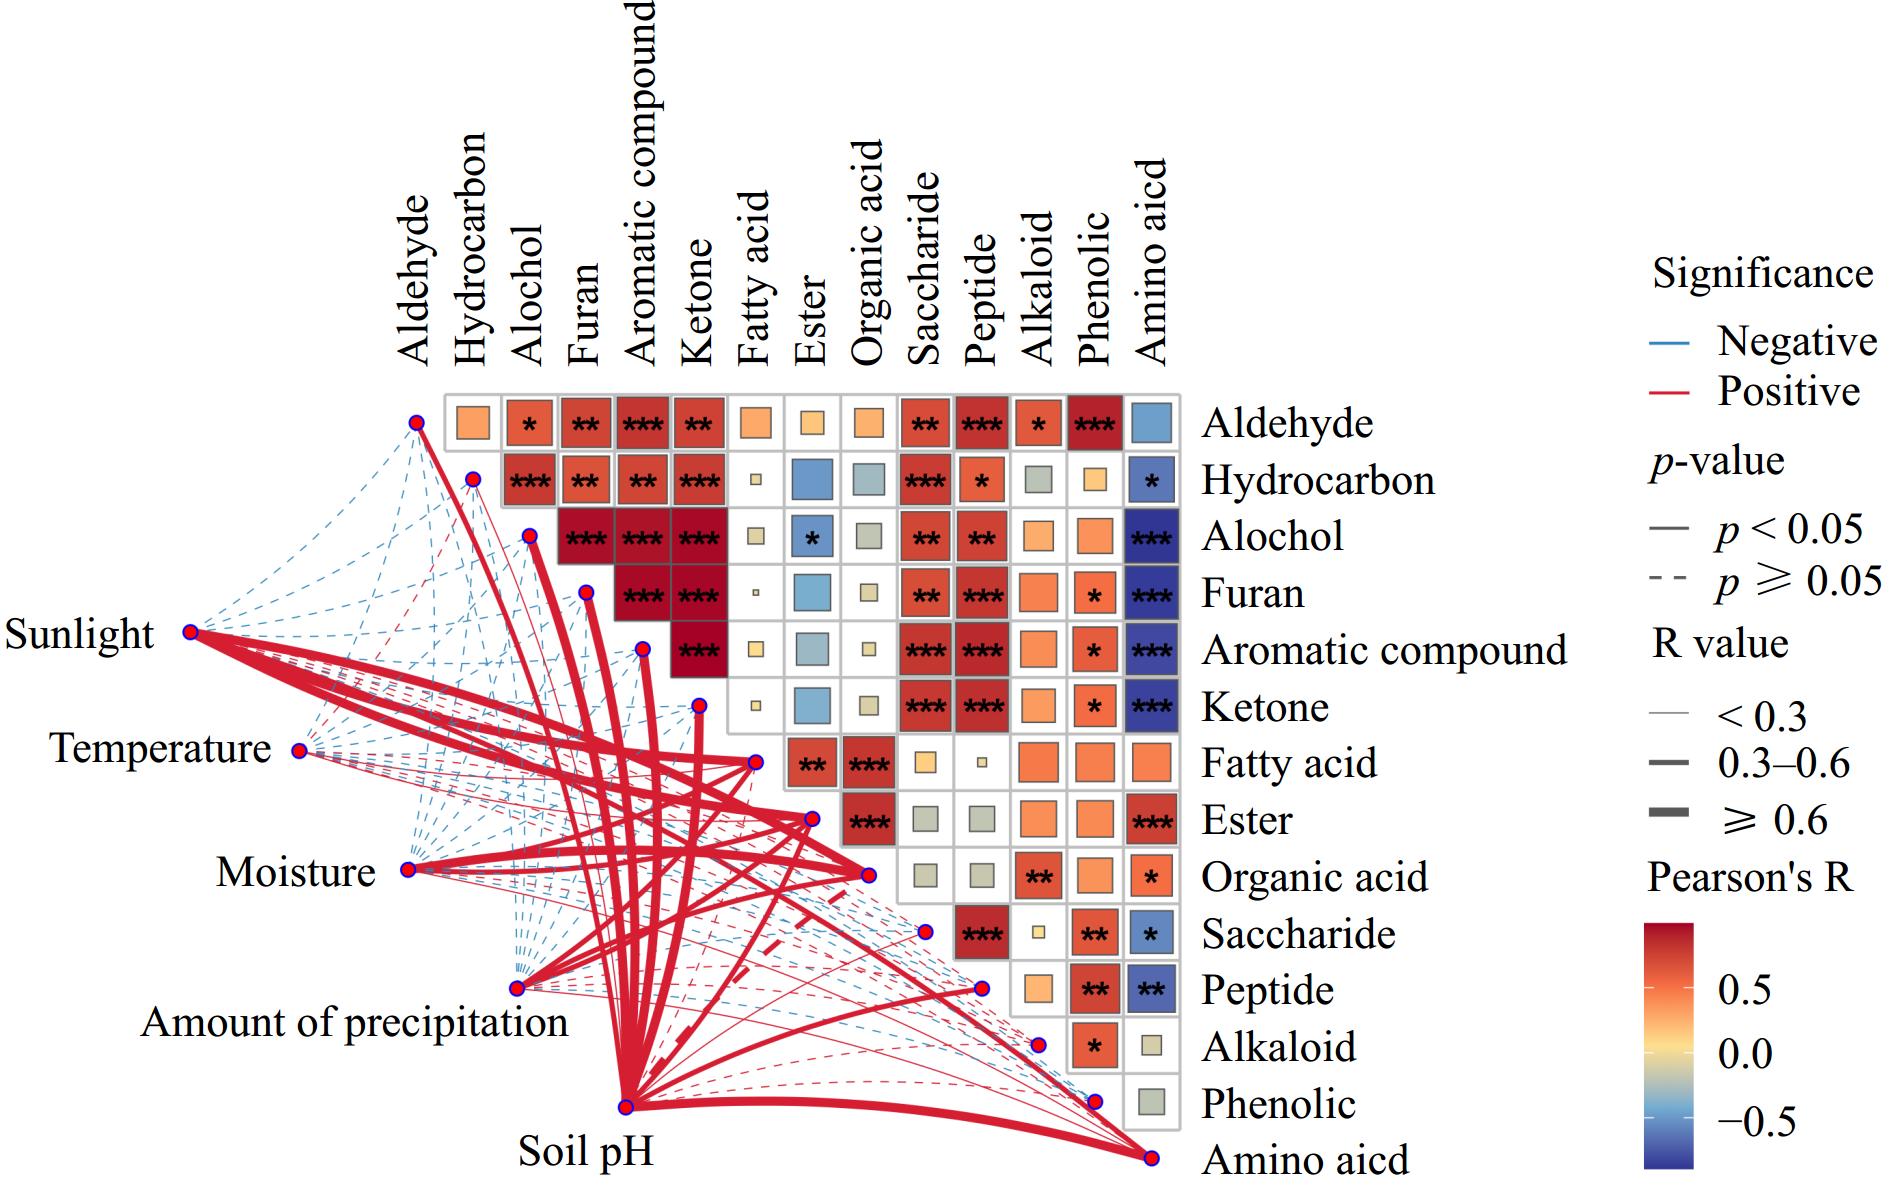
Figure 7.
Correlation analysis between geographical and environmental factors with volatile and metabolite compounds.
Figures
(7)
Tables
(0)