-
-
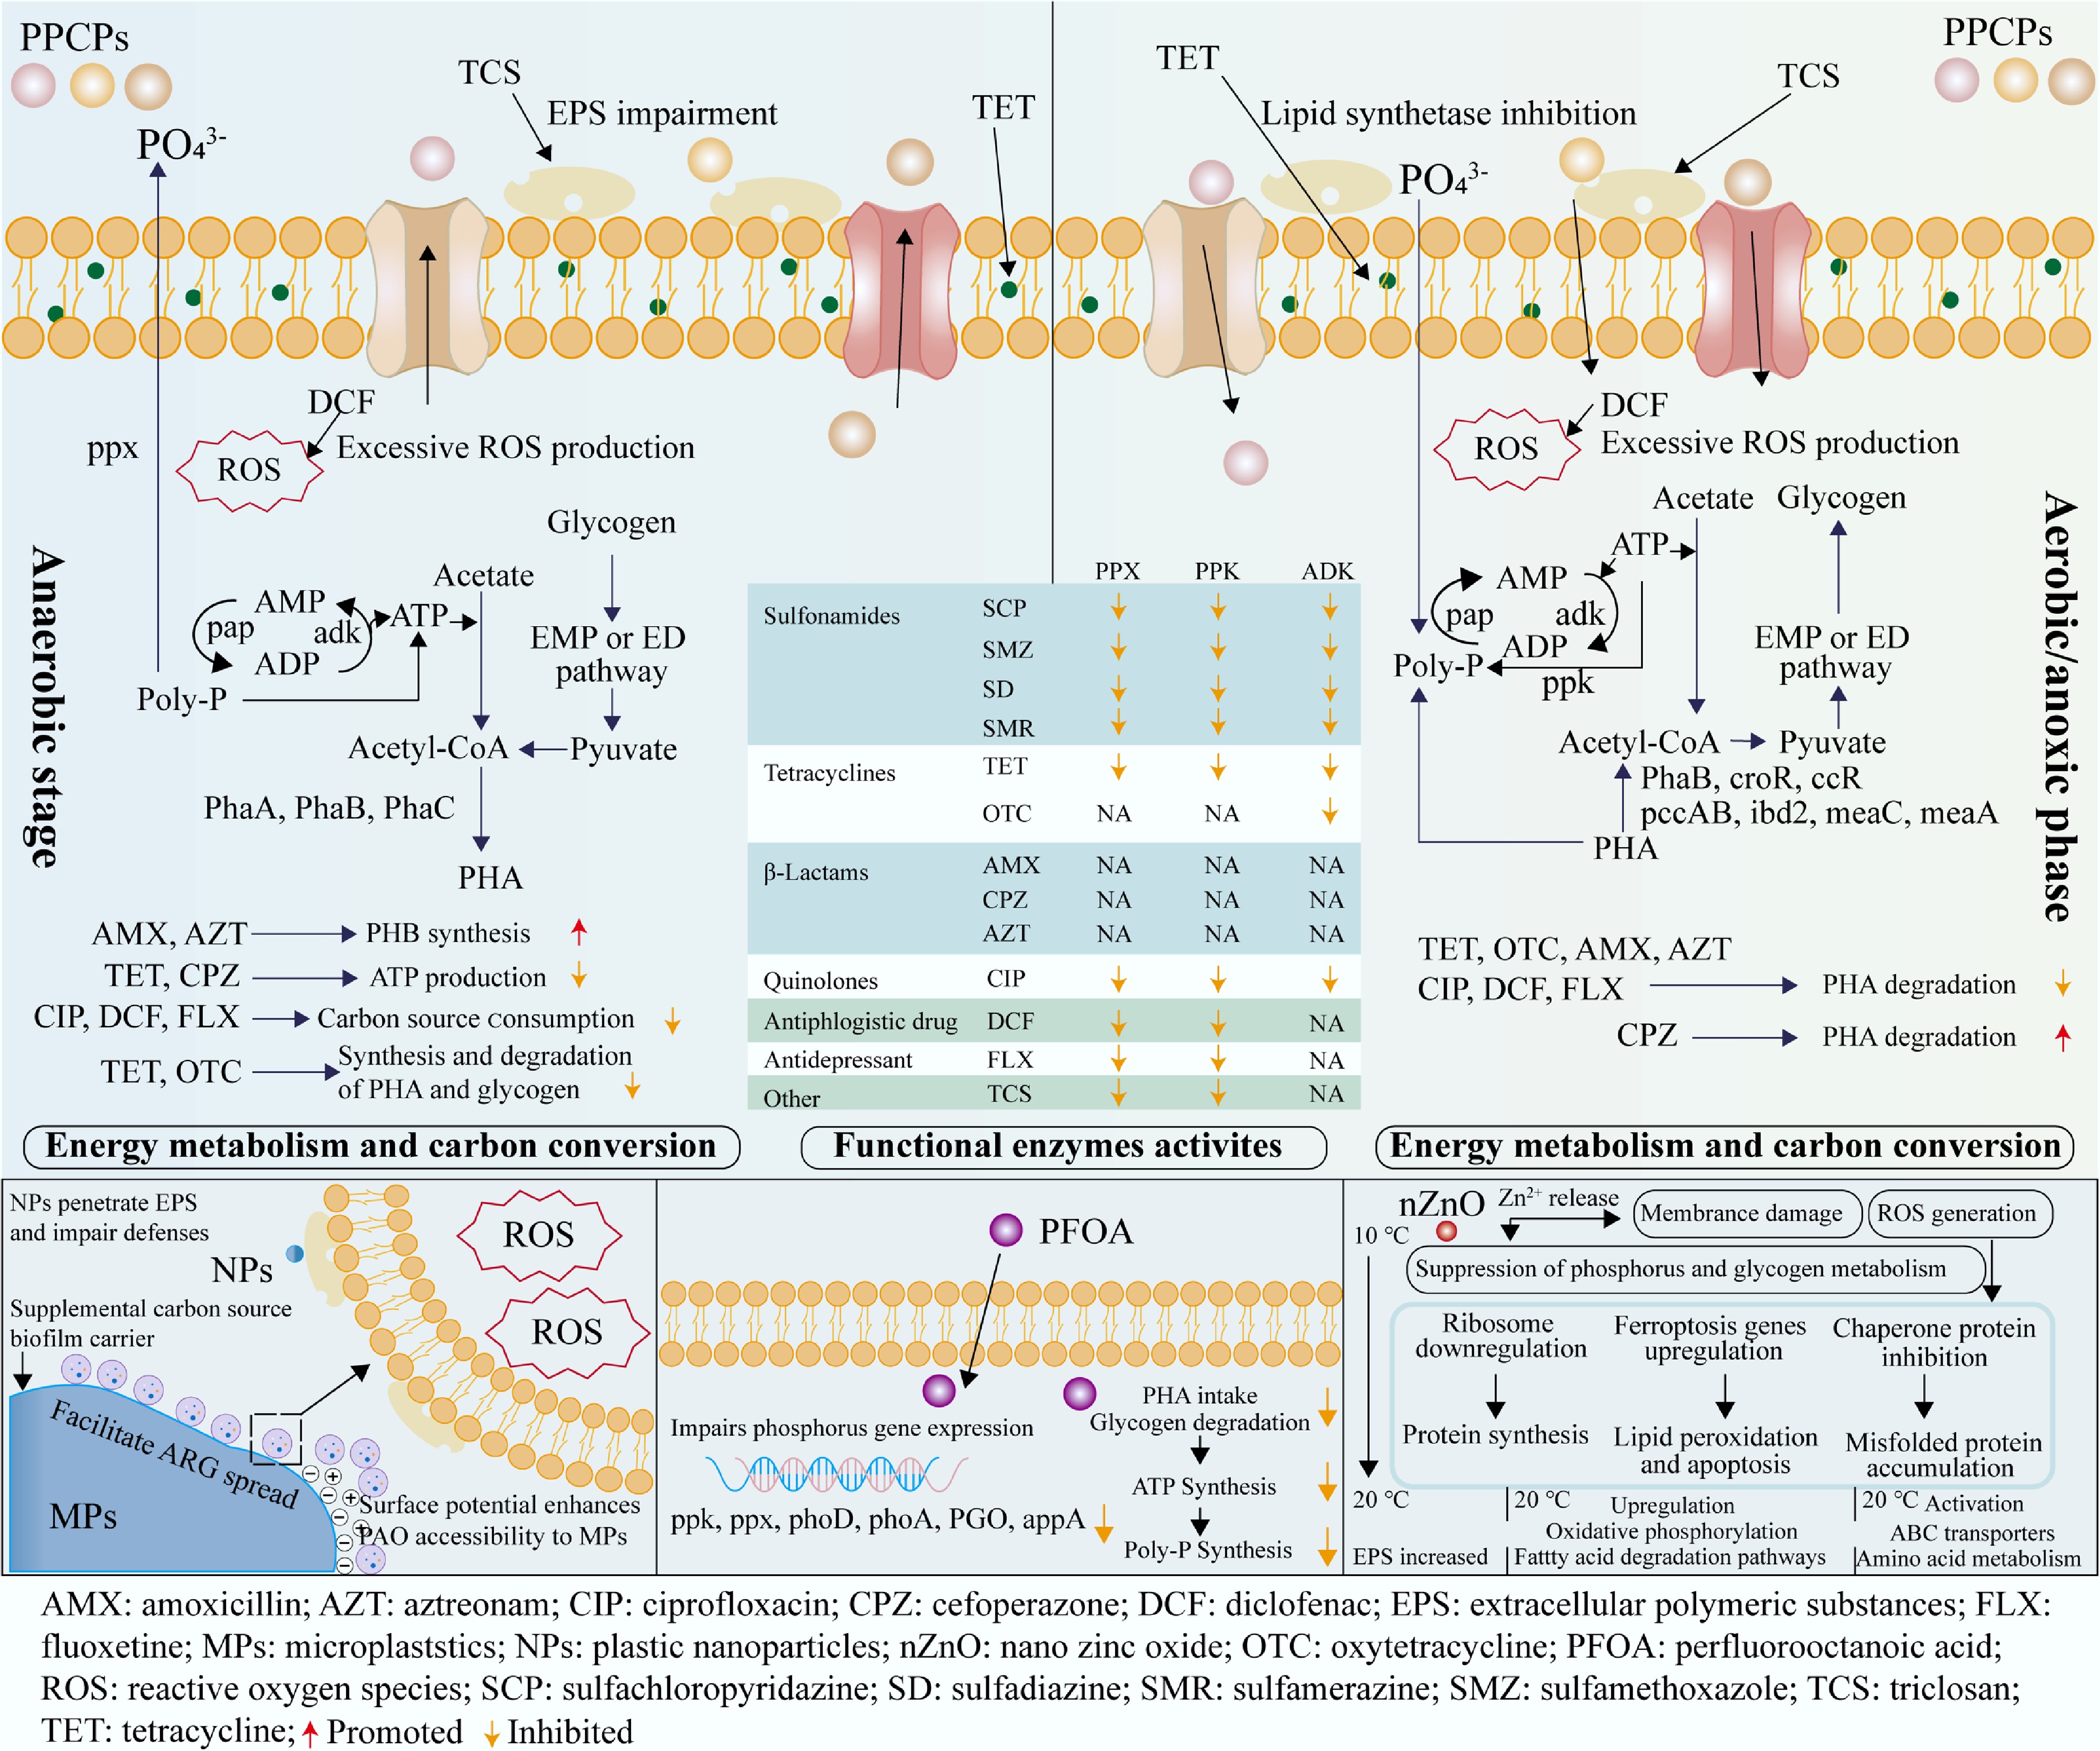
Figure 2.
Effect of individual emerging pollutants on the mechanism of phosphorus removal.
-
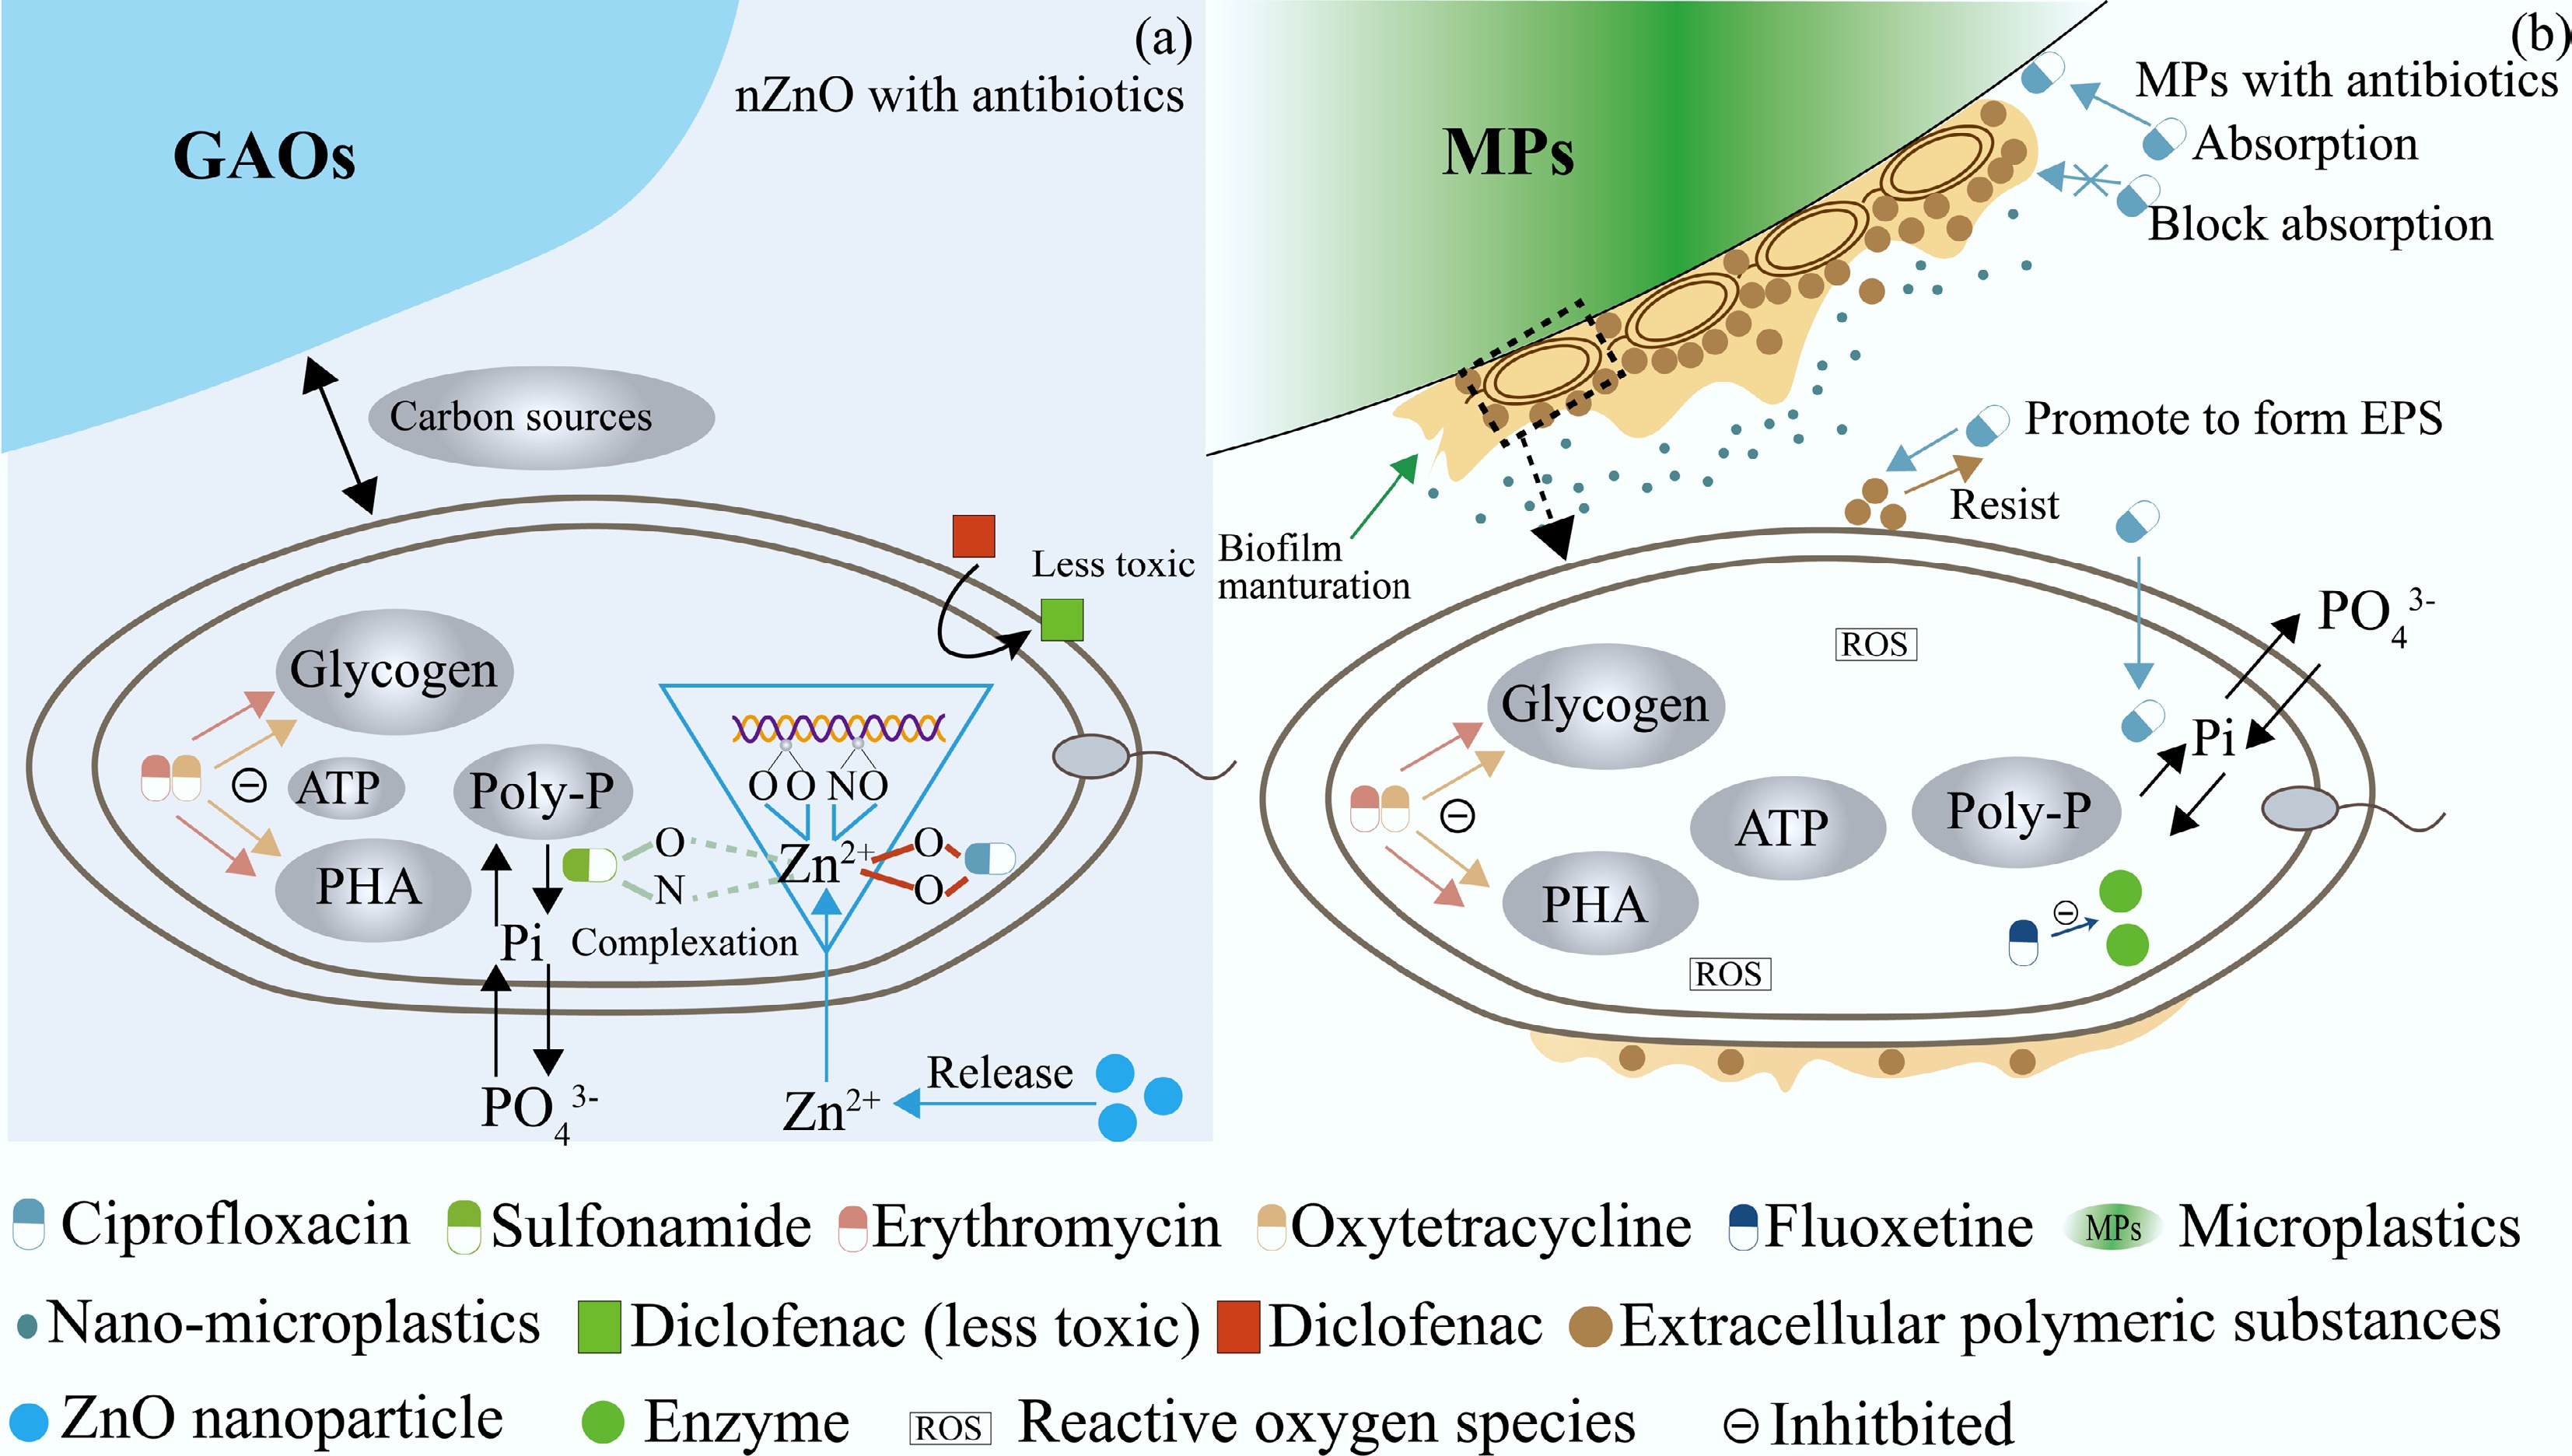
Figure 3.
Relationship between emerging pollutants and polyphosphate-accumulating organisms (PAOs): (a) Effects of nano-zinc oxide (nZnO) with antibiotics, and (b) effects of microplastics (MPs) with antibiotics.
-
Pollutant type Emerging
pollutantLocation of plants Influent (μg/L) Ref. PPCPs (antibiotics) SMZ Southern California (Orange County Sanitation District), Spain (Castellon province, Girona), Europe, Canada, India (eastern), Singapore, Slovakia, China (Guangdong) 1.8600–2.1460, 0.4500, 0.4016–0.4174, 0.0142–0.0280, 0.5700, 0.002–0.0023, 0.8934–1.389, 0.051–0.320 [2−9] CIP Spain (Castellon province, Girona), Europe, Qatar (Doha), China (Guizhou), Canada, Singapore, Slovakia, China (Guangdong) 2.4500, 8.3050–13.7790, 0.0963, 0.2340–2.5430, 0.4895 ± 0.0676, 0.6000, 2.2410–6.4530, 0.4840–2.7100, 15.6000 ± 7.3200 [2−5,8−12] OTC China (Guizhou), Canada, Singapore, Slovakia, China (Guangdong) 0.1963 ± 0.0316, < 0.0260, 1.6290–30.0490,
< 0.0056–0.0091, 57.7000 ± 33.8000[2,3,8,9, 11] TET Qatar (Doha), China (Guizhou), Canada, Singapore, Slovakia, China (Guangdong) 0.1970–0.3190, 0.4786 ± 0.0783, 0.0530, 1.2400–12.3400, 0.0110–0.0240, 39.2000 ± 32.1000 [2,3,8−11] ERY Southern California (Orange County Sanitation District), Qatar (Doha), China (Guizhou), Singapore, Slovakia 0.0167–0.2780, < 0.0100–2.0350, 0.2586 ± 0.0272, 0.1114–0.4033, 0.0790 [2,7,8,10,11] AMX Singapore 1.5370–2.9510 [8] TCS Southern California (Orange County Sanitation District), Europe, Western Greece (Agrinio city), Singapore 0.000–0.4100, 0.0748, 0.0653, 0.3411–0.7439 [5,7,8,13] PPCPs (anti-inflammatory drugs) DCF Spain (Castellon province), Europe, Austria, China, Europe, Finland, South Korea, Spain, America 0.5300, 0.0495, 0.9100–4.1000, 0.1100–0.4400, 0.1500, 0.2300–0.6400, 0.0900–3.6000, 0.0300–0.7400, 0.0900–0.5800 [4,5,14−26] PPCPs (antidepressants) FLX Europe 0.0021 [5] Microplastics Microplastics Thailand, South Korea, America, France, UK 12.2 × 10³, 4.2 × 10³, 133 × 103, 2.9 × 10⁵,
15.7 × 10³ (m−3)[27−31] Polyfluoroalkyl substances PFOS China, China (Taiwan), Japan, Korea, Singapore, America 0.0018–0.1760, 0.1750–0.2167, 0.0140–0.3360,
< 0.0005–0.0681, 0.0079–0.3745, 0.0069–0.0330[32−37] PFOA China, China (Taiwan), Japan, Korea, Singapore, America 0.0026–66.0000, 0.0176–0.0236, 0.0140–0.0410, 0.0023–0.6150, 0.2141–0.6382, 0.0090–0.0240 [32−37] AMX: amoxicillin; CIP: ciprofloxacin; DCF: diclofenac; ERY: erythromycin; FLX: fluoxetine; OTC: oxytetracycline; PFOA: perfluorooctanoic acid; PFOS: perfluorooctane sulfonic acid; PPCPs: pharmaceuticals and personal care products; SMZ: sulfamethoxazole; TCS: triclosan; TET: tetracycline; NA: not available. Table 1.
Concentrations of emerging pollutants in influent of WWTPs
-
Pollutant type Emerging pollutant Concentration in laboratorial studies (mg/L) Concentrations in real wastewater (ng/L) Predicted no-effect concentration (ng/L) Ref. PPCPs (antibiotics) SMZ 253.28 5,600.00 94,000.00 [38−44] SCP 285.72 5,600.00 94,000.00 [38−44] SD 250.28 5,600.00 94,000.00 [38−44] SMR 264.30 5,600.00 94,000.00 [38−44] CIP 0.20, 0.50, 1.00, 1.50, 2.00, 3.00, 5.00, 10.00, 15.00 396.90 64.00 [39,41−43,45] TET 0.02, 0.05, 1.00, 2.00, 5.00, 10.00 167.00 1,000.00 [40−44] OTC 1.00, 5.00, 10.00 54.30 500.00 [40,43,44,46] AMX 1.00, 5.00, 10.00 509,640.00–2,134,820.00 250.00 [47,48] AZT 1.00, 5.00, 10.00 NA NA [47] CPZ 1.00, 5.00, 10.00 NA NA [47] FF 0.01, 2.00 900.00–3,300.00 4,000.00–26,200.00 [49,50] TCS 0.50–10.00 50.00–107.00 NA [51] PPCPs (anti-inflammatory drugs) DCF 0.01, 0.20, 1.00, 2.00 30.00–7,100.00 5.00 [52−54] PPCPs (antidepressant) FLX 0.01, 0.10, 0.20 1.00–596.00 12.00 [52,55,56] Microplastics PS 80.00, 150.00, 300.00, 500.00, 800.00 510.00–240,000.00 particles/kg NA [57−60] PE 80.00, 150.00, 300.00, 500.00, 800.00 510.00–240,000.00 particles/kg NA [57−60] PVC 80.00, 150.00, 300.00, 500.00, 800.00 510.00–240,000.00 particles/kg NA [57−60] PLA 80.00, 150.00, 300.00, 500.00, 800.00 510.00–240,000.00 particles/kg NA [57−60] Polyfluoroalkyl substances PFOA 10.00 2.20–150.00 30.00–2,220.00 [61−63] PFOS 0.10, 0.50, 5.00 1.00–220.00 NA [62−64] Metal oxide nanoparticles nZnO 1.00, 1.20, 1.60, 2.00, 5.00, 20.00, 50.00, 100.00 212,000.00 ± 53,000.00 NA [39,65,66] AMX: amoxicillin; AZT: aztreonam; CIP: ciprofloxacin; CPZ: cefoperazone; DCF: diclofenac; FF: florfenicol; FLX: fluoxetine; nZnO: nano-zinc oxide; OTC: oxytetracycline; PE: polyethylene; PFOA: perfluorooctanoic acid; PFOS: perfluorooctane sulfonic acid; PLA: polylactic acid; PPCPs: pharmaceuticals and personal care products; PS: polystyrene; PVC: polyvinyl chloride; SCP: sulfachloropyridazine; SD: sulfadiazine; SMR: sulfamerazine; SMZ: sulfamethoxazole; TET: tetracycline; NA: not available. Table 2.
The concentration of emerging pollutants in laboratory studies, real wastewater, and the toxicity threshold
-
PPCP type Emerging pollutant Laboratory concentration
(mg/L)Toxicity PHA degradation
(C-mmol Cg/VSS)Control
group (%)Phosphorus removal efficiency (%) Phosphorus removal inhibition
rate (%)Ref. Sulfonamide SCP 0.05, 1.00 SCP > SD >
SMR > SMZ3.63 ± 0.12, 83.40 ± 1.12
(15 d, 8 h)93.47 88.98, 29.41 48.20 ± 0.79, 68.79 ± 3.46 [38] SMZ 0.05, 1.00 3.01 ± 0.24, 100.99 ± 2.52
(15 d, 8 h)93.47 90.61, 98.82 3.22 ± 1.53, –5.25 ± 0.88 [38] SD 0.05, 1.00 3.38 ± 0.12, 98.62 ± 0.28
(15 d, 8 h)93.47 83.06, 94.51 11.23 ± 0.83, –0.68 ± 4.61 [38] SMR 0.05, 1.00 2.82 ± 0.08, 81.62 ± 1.95
(15 d, 8 h)93.47 88.57, 98.82 5.36 ± 1.55, –5.24 ± 1.70 [38] Tetracycline OTC 1.00, 5.00, 10.00 NA 0.35 ± 0.16, 2.30 ± 0.07 100.00 89.73, 5.50, 0.00 10.27, 94.50, 100.00 [97] TET 0.02, 0.05,
2.00, 5.00NA 0.91 ± 0.05 (0 mg/L, 37 d),
1.02 ± 0.14 (0 mg/L, 146 d),
–0.95 ± 0.12 (5 mg/L, 154 d),
0.79 ± 0.04 (5 mg/L, 232 d),
0.92 ± 0.04 (0.02 mg/L, 37 d),
1.05 ± 0.09 (0.02 mg/L, 146 d),
1.09 ± 0.08 (2 mg/L, 154 d),
0.81 ± 0.05 (2 mg/L, 154 d),
0.84 ± 0.05 (0.05 mg/L, 37 d),
1.68 ± 0.03 (0.05 mg/L, 146 d),
0.11 ± 0.03 (5 mg/L, 154 d),
0.86 ± 0.03 (5 mg/L, 232 d)90.76 95.62, 93.19, 52.70, 28.60 –5.35, –2.68,
41.98, 68.50[42] β-lactam AMX 1.00,
5.00,
10.00CPZ > AZT > AMZ 9.08 ± 0.01,
8.93 ± 0.02,
7.77 ± 0.02–13.66 ± 0.02, –13.29 ± 0.03, –10.33 ± 0.02 43.99 50.55,
47.38,
63.22–14.92,
–7.70,
–43.69[47] CPZ 1.00,
5.00,
10.0010.89 ± 0.03,
10.27 ± 0.02,
12.92 ± 0.03–15.50 ± 0.03, –14.96 ± 0.04, –13.09 ± 0.02 43.99 43.61,
40.44,
39.480.86,
8.07,
10.24[47] AZT 1.00,
5.00,
10.0011.15 ± 0.01,
11.45 ± 0.01,
12.45 ± 0.02–19.06 ± 0.03, –20.00 ± 0.03, –23.38 ± 0.02 43.99 50.14,
49.37,
59.74–13.98,
–12.22,
–35.77[47] Quinolone CIP 0.20, 2.00 With the increase in concentration, the toxicity becomes greater PHA synthesis: 3.31, 3.89, 4.07 (control, 0.2, 2.0 mg/L, anaerobic stages)
PHA utilization: 0.84, 1.06, 1.46 (control, 0.2, 2.0 mg/L, anoxic stages)
0.20, 2.00 mg/L CIP decreased PHA consumption96.80 ± 0.80 91.70 ± 0.60, 84.90 ± 1.30 5.27, 12.30 [45] Anti-inflammatory drugs DCF 0.01, 0.20,
1.00, 2.00With the increase in concentration, the toxicity becomes greater 3.40 ± 0.60 (0 mg/L)
NA, NA, NA, 1.40 ± 0.3092.30 ± 5.40 91.50 ± 4.90, 84.60 ± 3.80, 72.30 ± 3.20, 64.30 ± 4.20 0.87, 8.35
21.68, 30.33[98] Antidepressant FLX 0.01, 0.10, 0.20 NA No difference in the changes in PHA under the 0.00 and 0.01 mg/L FLX treatments
With the increase in concentration, the synthesis of PHA decreases92.30 ± 2.30
(2–3 d)92.10 ± 3.10, 92.70 ± 2.30, 92.40 ± 2.70 23.46 (0.2 mg/L,
100 d)[52] 93.15 ± 1.80
(100 d)93.15 ± 1.80, 79.10 ± 1.30, 71.30 ± 2.10 AMX: amoxicillin; AZT: aztreonam; CIP: ciprofloxacin; CPZ: cefoperazone; FLX: fluoxetine; PPCPs: pharmaceuticals and personal care products; SCP: sulfachloropyridazine; SD: sulfadiazine; SMR: sulfamerazine; SMZ: sulfamethoxazole; TET: tetracycline; VSS: volatile suspended solids; NA: not available. Table 3.
Impact of PPCPs on PHA metabolism and the phosphorus removal efficiency of PAOs
-
Pollutant type Emerging pollutant Laboratory concentration
(mg/L)Carbon source pH Temperature (°C) Phosphorus removal efficiency
control (%)Phosphorus removal efficiency
(%)Phosphorus removal inhibition rate (%) Ref. PPCPs (antibiotics) SCP 0.05, 1.00 mmol/L Acetate 7.0 21 ± 1 93.47 88.98, 29.41 48.20 ± 0.79,
68.79 ± 3.46[38] SMZ 0.05, 1.00 mmol/L Acetate 7.0 21 ± 1 93.47 90.61, 98.82 3.22 ± 1.53,
–5.25 ± 0.88[38] SD 0.05, 1.00 mmol/L Acetate 7.0 21 ± 1 93.47 83.06, 94.51 11.23 ± 0.83,
–0.68 ± 4.61[38] SMR 0.05, 1.00 mmol/L Acetate 7.0 21 ± 1 93.47 88.57, 98.82 5.36 ± 1.55,
–5.24 ± 1.70[38] CIP 3.00, 5.00, 10.00, 15.00 Acetate 7.0 30 73.93 56.67, 52.21,
49.51, 48.3723.34, 29.39,
33.05, 34.59[39] TET 0.02, 0.05, 2.00, 5.00 Acetate NA NA 90.76 95.62, 93.19,
52.70, 28.60–5.35, –2.68,
41.98, 68.50[42] OTC 1.00, 5.00, 10.00 Acetate, propionate 7.0–7.5 21 ± 1 100.00 89.73, 5.50, 0.00 10.27, 94.50, 100.00 [97] ERY 1.00, 5.00, 10.00 Acetate, propionate 7.0–7.5 21 ± 1 100.00 100, 86.70, 34.60 0.00, 13.30, 65.40 [97] AMX 1.00, 5.00, 10.00 Tryptone, yeast extract 7.0 30–35 43.99 50.55, 47.38, 63.22 –14.92, –7.70, –43.69 [47] CPZ 1.00, 5.00, 10.00 Tryptone, yeast extract 7.0 30–35 43.99 43.61, 40.44, 39.48 0.86, 8.07, 10.24 [47] AZT 1.00, 5.00, 10.00 Tryptone, yeast extract 7.0 30–35 43.99 50.14, 49.37, 59.74 –13.98, –12.22, –35.77 [47] TCS 0.10, 0.15 Sodium acetate, glucose 7.0–7.5 30 90.52 74.53, NA 17.68, NA [78] PPCPs (anti-inflammatory drugs) DCF 0.01, 0.20, 1.00, 2.00 NaAC 7.0 30 ± 1 92.30 ± 5.40 91.50 ± 4.90,
84.60 ± 3.80,
72.30 ± 3.20,
64.30 ± 4.200.87, 8.35, 21.68, 30.33 [98] PPCPs (antidepressants) FLX 0.01, 0.10, 0.20 Acetate 7.0–8.0 25–30 92.30 ± 2.30 92.10 ± 3.10,
92.70 ± 2.30,
92.40 ± 2.700.22, –0.43, –0.11 (2–3 d) [52] FLX 0.01, 0.10, 0.20 Acetate 7.0–8.0 25–30 93.15 ± 1.80 93.15 ± 1.80,
79.10 ± 1.30,
71.30 ± 2.100.00, 15.08, 23.46 (100 d) [52] Microplastics PES, PE, PVC 50.00–10,000.00 particles/L NaAC 7.5 25–30 PAOs activity without MPs: 29.20 ± 0.90 mg PO43–P/g MLVSS/h;
PAOs activity with MPs: 29.70 ± 2.40 mg PO43–P/g MLVSS/h;
No significant difference (p > 0.05)[92] PS 80.00, 150.00, 300.00, 500.00, 800.00 Acetate 7.0 20–40 NA NA 4.80, 15.77, 18.51, 19.20, 20.57 (8 h) [57] PE 80.00, 150.00, 300.00, 500.00, 800.00 Acetate 7.0 20–40 NA NA 2.74, 6.63, 14.40, 15.77, 18.74 (8 h) [57] PVC 80.00, 150.00, 300.00, 500.00, 800.00 Acetate 7.0 20–40 NA NA 3.20, 8.46, 11.66, 12.80, 16.00 (8 h) [57] PLA 80.00, 150.00, 300.00, 500.00, 800.00 Acetate 7.0 20–40 NA NA 6.17, 11.20, 15.77, 27.66, 41.37 (8 h) [57] NPS 0.05, 0.10, 1.00 NA 7.0–8.5 20 ± 5 75.52 60.69, 71.58, 49.48 19.64, 5.22, 34.51 [101] PLA 50.00, 200.00 particles/g TS Acetate NA NA Pup/Prel: 0.26 Pup/Prel: 0.20, 0.27 NA [93] Polyfluoroalkyl substances PFOS 0.10, 0.50, 5.00 Acetate NA 21 ± 1 98.27 ± 0.17 93.15 ± 0.19,
97.10 ± 0.12,
96.83 ± 0.305.21, 1.19, 1.47 [64] PFOA 10.00 Acetate NA NA NA 3.11–10.15% decline in TP removal (0–60 d) NA [61] Metal oxides nanoparticles nZnO 1.00, 1.20, 1.60, 2.00 Acetate 7.0 30 73.90 51.20, 31.80, 5.39, 0.21 30.72, 56.99, 92.90, 99.72 [39] nZnO 100.00 NA 7.3 10 24.60 6.80 72.30 [65] nZnO 100.00 NA 7.3 20 10.50 24.50 –133.33 [65] AMX: amoxicillin; AZT: aztreonam; CIP: ciprofloxacin; CPZ: cefoperazone; DCF: diclofenac; ERY: erythromycin; FLX: fluoxetine; NPS: nanopolystyrene; nZnO: nano-zinc oxide; OTC: oxytetracycline; PE: polyethylene; PFOA: perfluorooctanoic acid; PFOS: perfluorooctane sulfonic acid; PPCPs: pharmaceuticals and personal care products; PLA: polylactic acid; Pup/Prel: phosphorus uptake/release; PS: polystyrene; PVC: polyvinyl chloride; SCP: sulfachloropyridazine; SD: sulfadiazine; SMR: sulfamerazine; SMZ: sulfamethoxazole; TCS: triclosan; TET: tetracycline; NA: not available. Table 4.
Impact of emerging pollutants on EBPRs' efficiency
-
Pollutant type Emerging pollutant Bacteria type Bacteria change Laboratory concentration (mg/L) Control group (%) Experimental
group (%)Ref. PPCPs (antibiotics) ERY Proteobacteria ↓ 10.00 77.20 62.60 [68] Candidatus accumulibacter ↓ 1.00, 5.00, 10.00 57.00 37.90, 32.20, 28.70 Betaproteobacteria ↓ 10.00 45.10 29.10 Candidatus competibacter ↑ 1.00, 5.00, 10.00 17.60 23.70, 27.70, 28.80 Gammaproteobacteria ↑ 1.00, 5.00, 10.00 NA Slight increase Bacteroidetes ↑ 10.00 13.30 24.40 OTC Proteobacteria ↓ 10.00 77.20 56.90 [68] Candidatus accumulibacter ↓ 1.00, 5.00, 10.00 57.00 50.40, 39.30, 36.10 Betaproteobacteria ↓ 10.00 45.10 29.80 Candidatus competibacter ↑ 1.00, 5.00, 10.00 17.60 27.10, 28.60, 30.30 Gammaproteobacteria ↑ 1.00, 5.00, 10.00 NA Slight increase Bacteroidetes ↑ 10.00 13.30 31.90 ERY + OTC Proteobacteria ↓ 5.00 + 5.00 77.20 69.50 [68] Candidatus accumulibacter ↓ 5.00 + 5.00 57.00 11.30 Betaproteobacteria ↓ 5.00 + 5.00 45.10 11.80 Candidatus competibacter ↑ 5.00 + 5.00 17.60 25.80 Gammaproteobacteria ↑ 5.00 + 5.00 NA almost tripled Bacteroidetes ↑ 5.00 + 5.00 13.30 20.10 CIP Proteobacteria ↓ 0.20, 2.00 46.70 37.50, 33.50 [45] Candidatus accumulibacter ↓ 0.20, 2.00 30.60 20.50, 15.20 Candidatus competibacter ↑ 0.20, 2.00 6.99 7.48, 7.58 Chloroflexi ↑ 0.20, 2.00 NA NA Defluviicoccus — 0.20, 2.00 11.00 11.00, 11.00 TCS Proteobacteria ↓ 0.10, 0.15 24.47 45.52, Decrease [78] Candidatus accumulibacter ↓ 0.10, 0.15 Medium abundance Decrease, significant decrease Candidatus competibacter ↓ 0.10, 0.15 Medium abundance Decreased Dechloromonas ↑ 0.10, 0.15 NA Increase Bacteroidetes ↑ 0.10, 0.15 21.73 27.19, 20.35–37.46 Zoogloea — 0.10, 0.15 NA NA FF Chloroflexi ↓ 0.01, 2.00 8.15 12.66, 3.06 [49] Proteobacteria ↑ 0.01, 2.00 34.71 33.78, 43.38 Candidatus competibacter ↑ 0.01, 2.00 12.49 9.26, 19.00 Terrimonas ↑ 0.01, 2.00 9.22 5.70, 16.28 PPCPs (antidepressants) FLX Betaproteobacteria ↓ 0.02 Less than 56.80 26.60 [101] Candidatus accumulibacter ↓ 0.02 NA Fell to 33.60 Candidatus competibacter ↑ 0.02 NA Up to 45.00 Microplastic (polystyrene) MP Proteobacteria ↓ 0.01, 1.00 79.21 68.91, NA [116] Bacteroidetes ↓ 0.01, 1.00 11.48 8.34, NA Acinetobacter ↓ 0.01, 1.00 57.12 0.94, 1.18 Chryseobacterium ↓ 0.01, 1.00 9.65 0.23, 0.10 Unclassified_Gammaproteobacteria ↑ 0.01, 1.00 7.33 33.30, 39.08 NP Proteobacteria ↓ 0.01, 1.00 79.21 64.35, NA [116] Bacteroidetes ↓ 0.01, 1.00 11.48 5.55, NA Acinetobacte ↓ 0.01, 1.00 57.12 0.71, 1.59 Chryseobacterium ↓ 0.01, 1.00 9.65 0.17, 0.32 Unclassified_Gammaproteobacteria ↑ 0.01, 1.00 7.33 34.38, 49.63 Metal oxide nanoparticles nZnO Proteobacteria ↓ 2.00, 6.00, 10.00 61.50 71.40, 72.60, 60.60 (43 d) [132] Candidatus accumulibacter ↓ 2.00, 6.00, 10.00 31.32 9.62, 0.00, 0.00 (23 d) Candidatus competibacter ↓ 2.00, 6.00, 10.00 15.46 2.36, 0.24, 0.12 (23 d) Alphaproteobacteria ↓ 2.00, 6.00, 10.00 10.98 2.44, 3.66, 3.05 (43 d) Betaproteobacteria ↑ 2.00, 6.00, 10.00 35.06 63.41, 65.55, 53.66 (43 d) Bacteroidetes ↑ 2.00, 6.00, 10.00 8.60 19.00, 19.40, 30.00 (43 d) CIP: ciprofloxacin; ERY: erythromycin; FF: florfenicol; FLX: fluoxetine; MP: microplastic; NP: plastic nanoparticles; nZnO: nano-zinc oxide; OTC: oxytetracycline; PPCPs: pharmaceuticals and personal care products; ↑: Increased; ↓: decreased; —: invariance; NA: not available. Table 5.
Effect of changes in EBPR systems on the microbial community structure under emerging pollutants
Figures
(3)
Tables
(5)