-
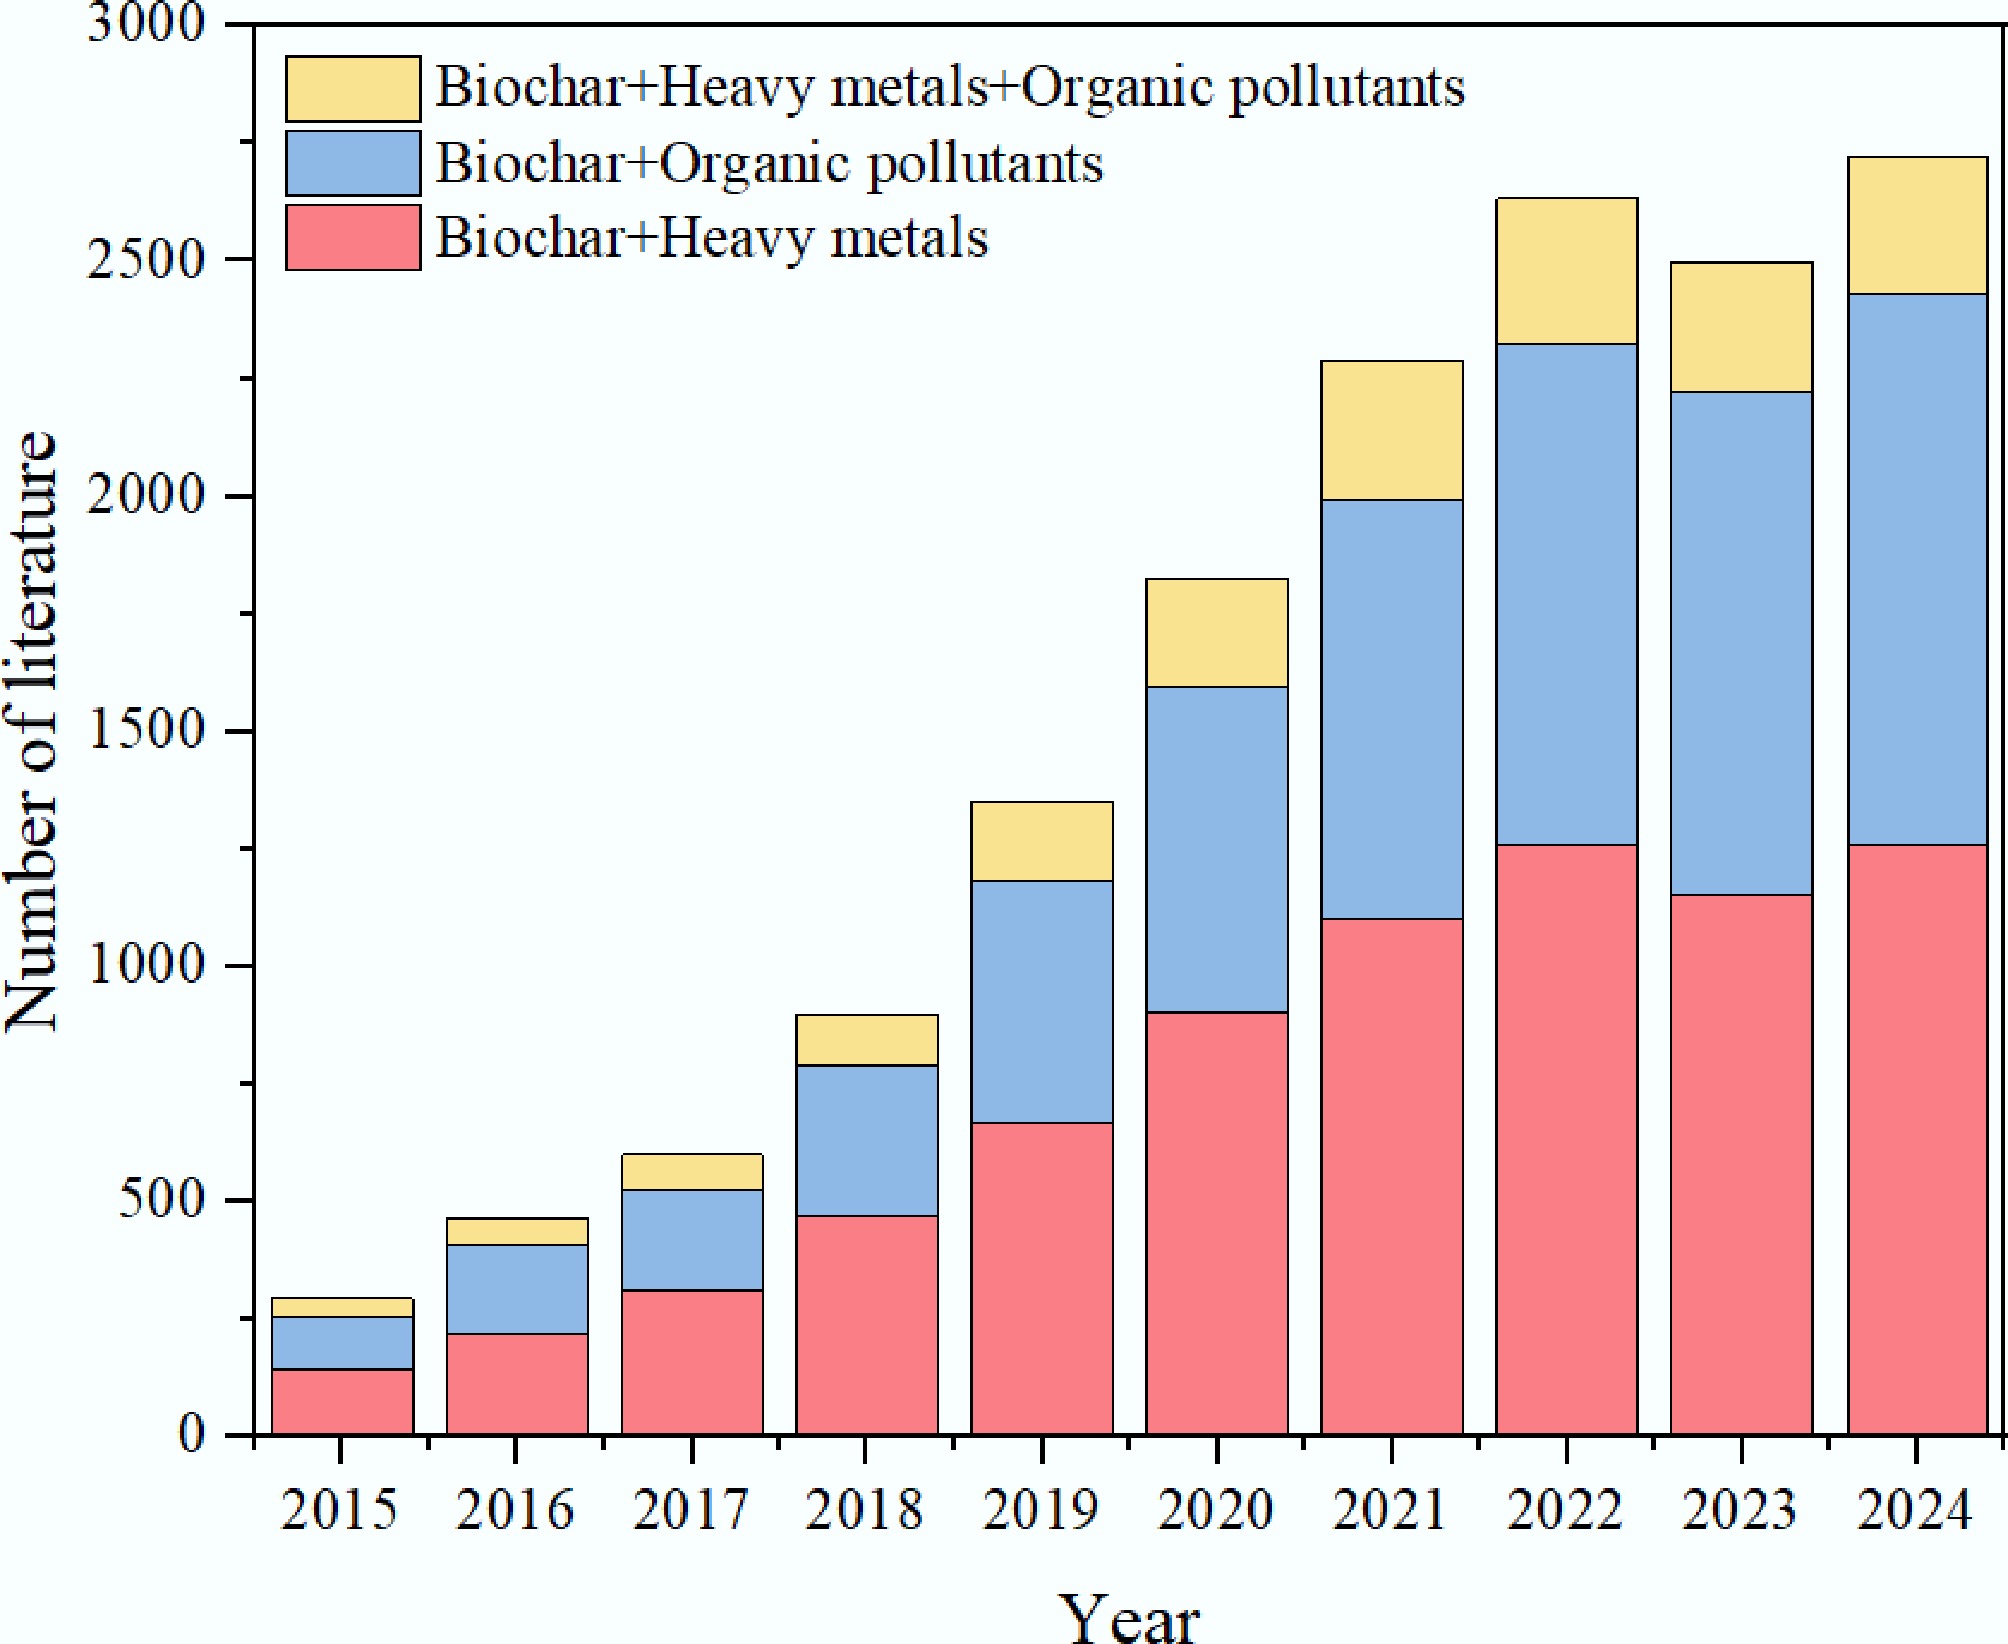
Figure 1.
The number of literature on the application of biochar in water from 2015 to 2024 (Data come from Web of Science).
-
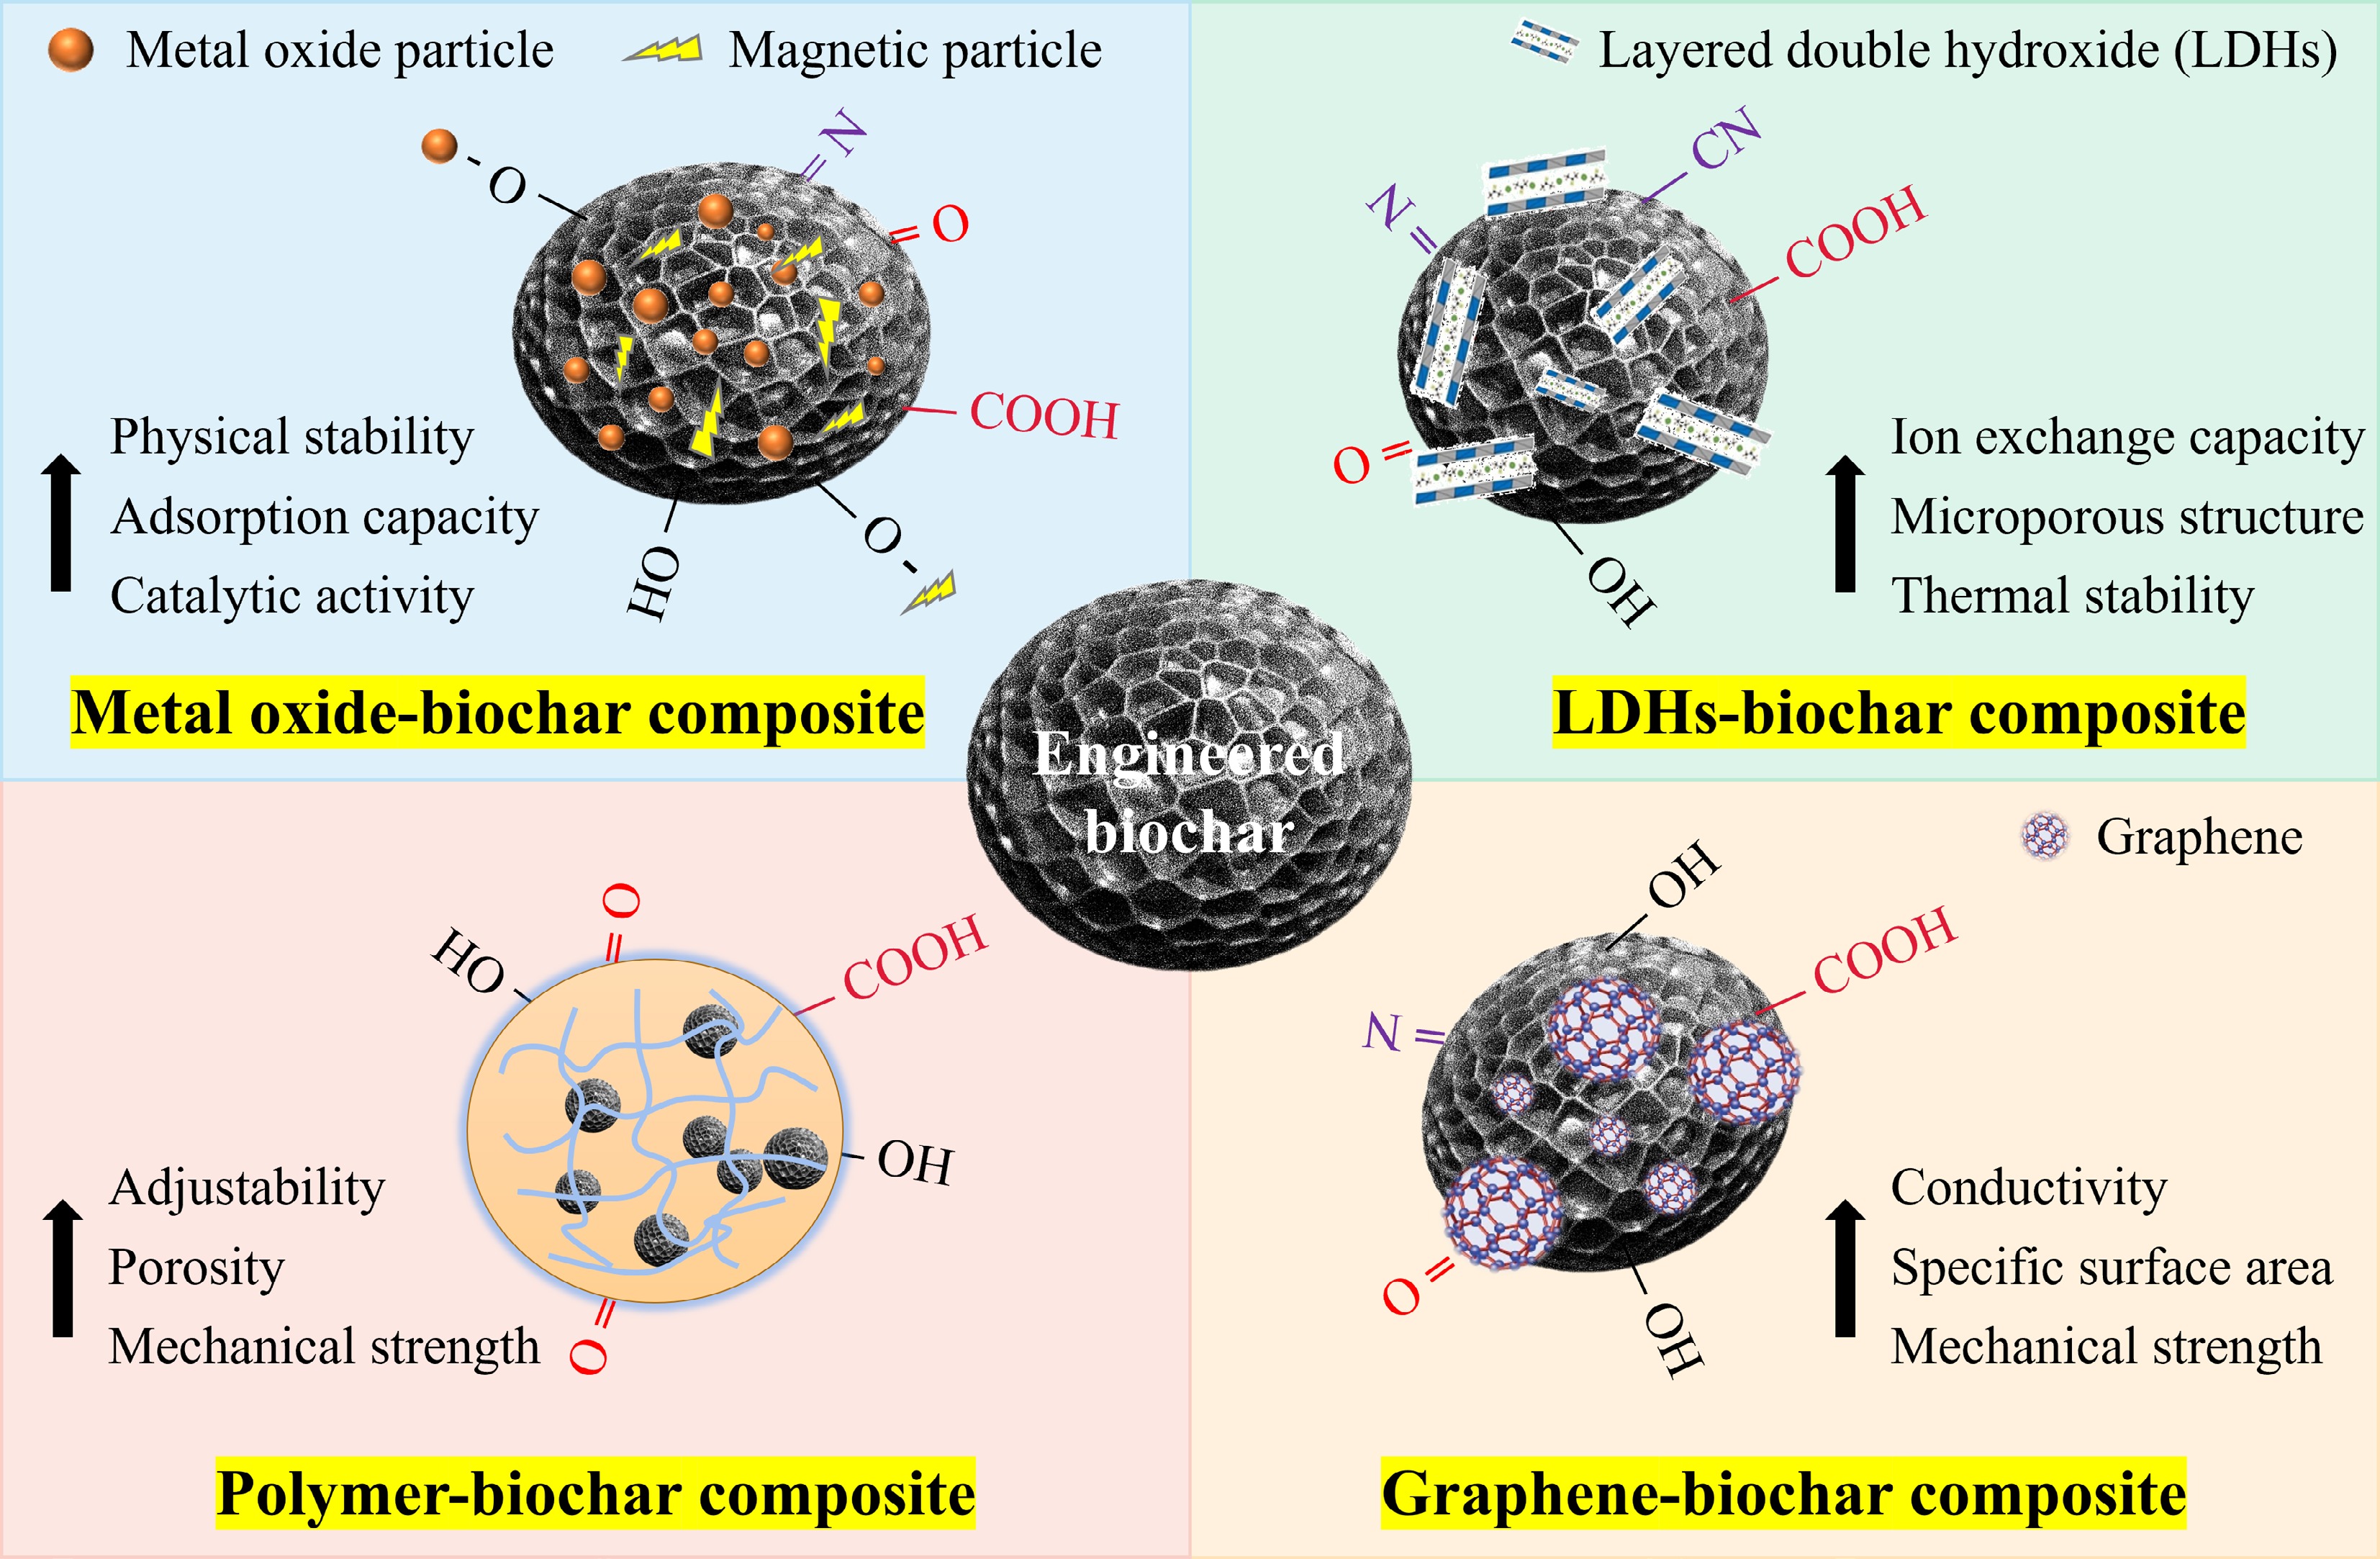
Figure 2.
Different engineered biochars for the co-removal of heavy metals and organic pollutants.
-
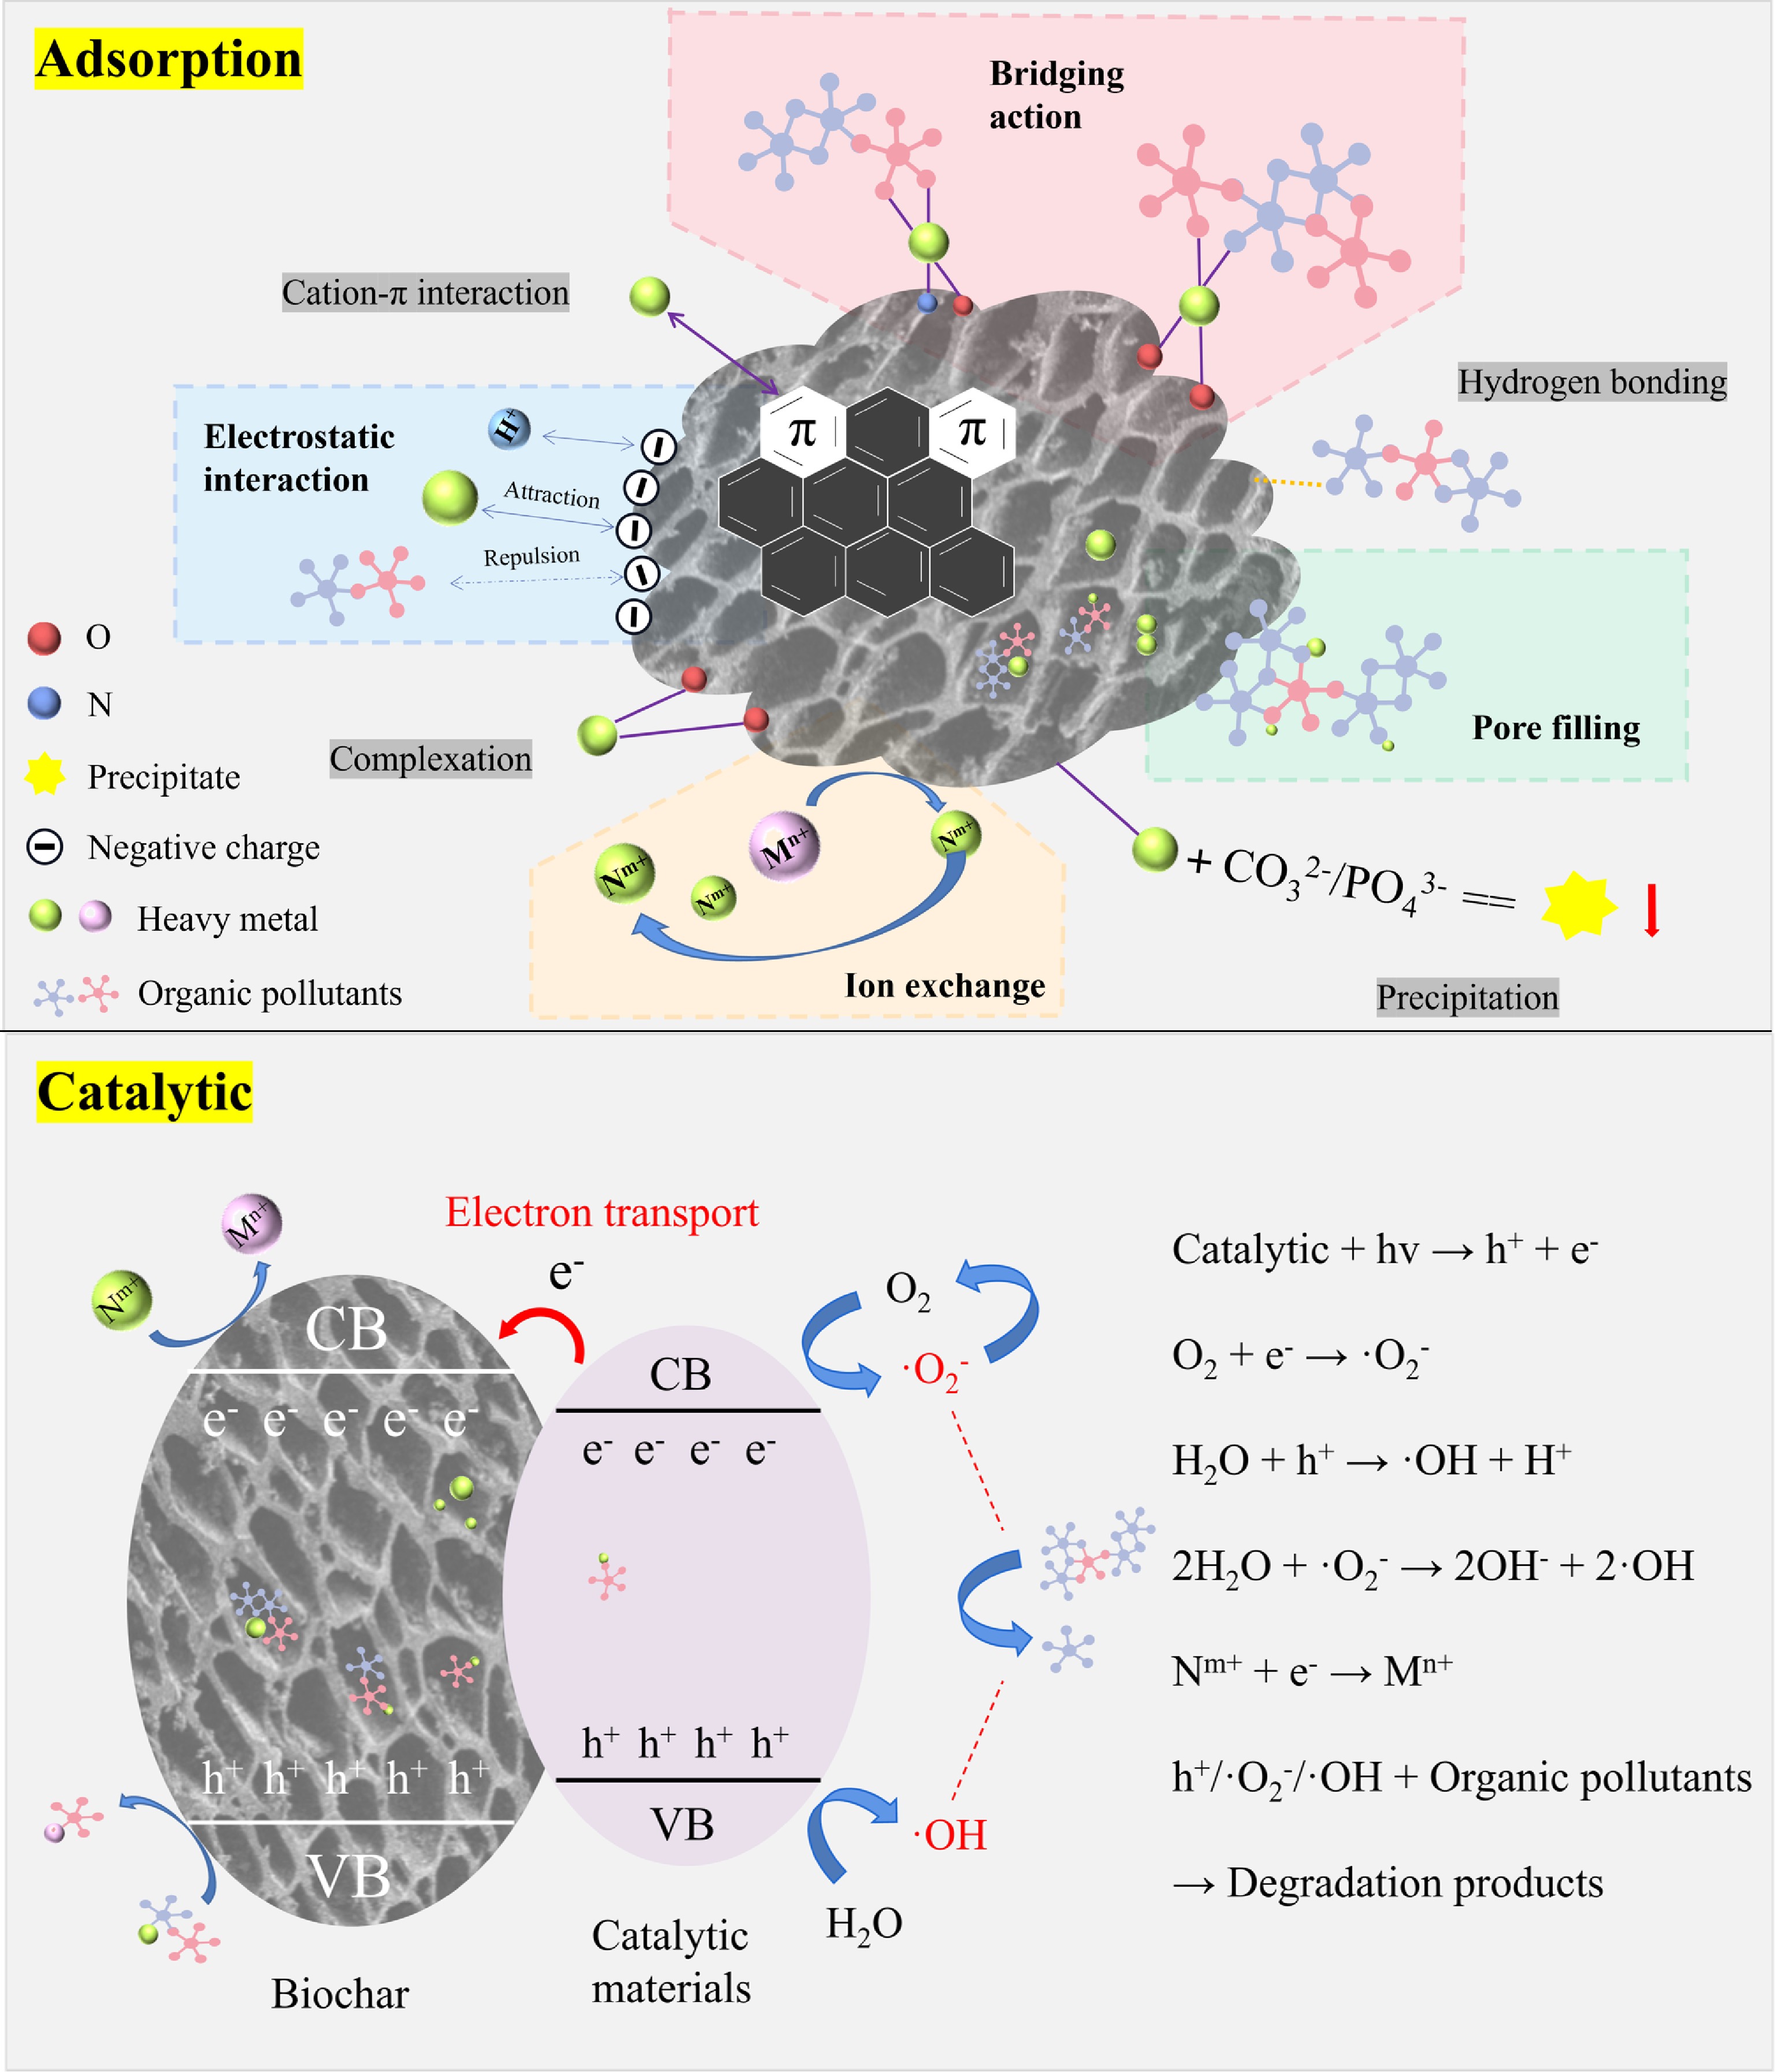
Figure 3.
Multiple mechanisms of engineered biochar for co-removing heavy metals and organic pollutants.
-
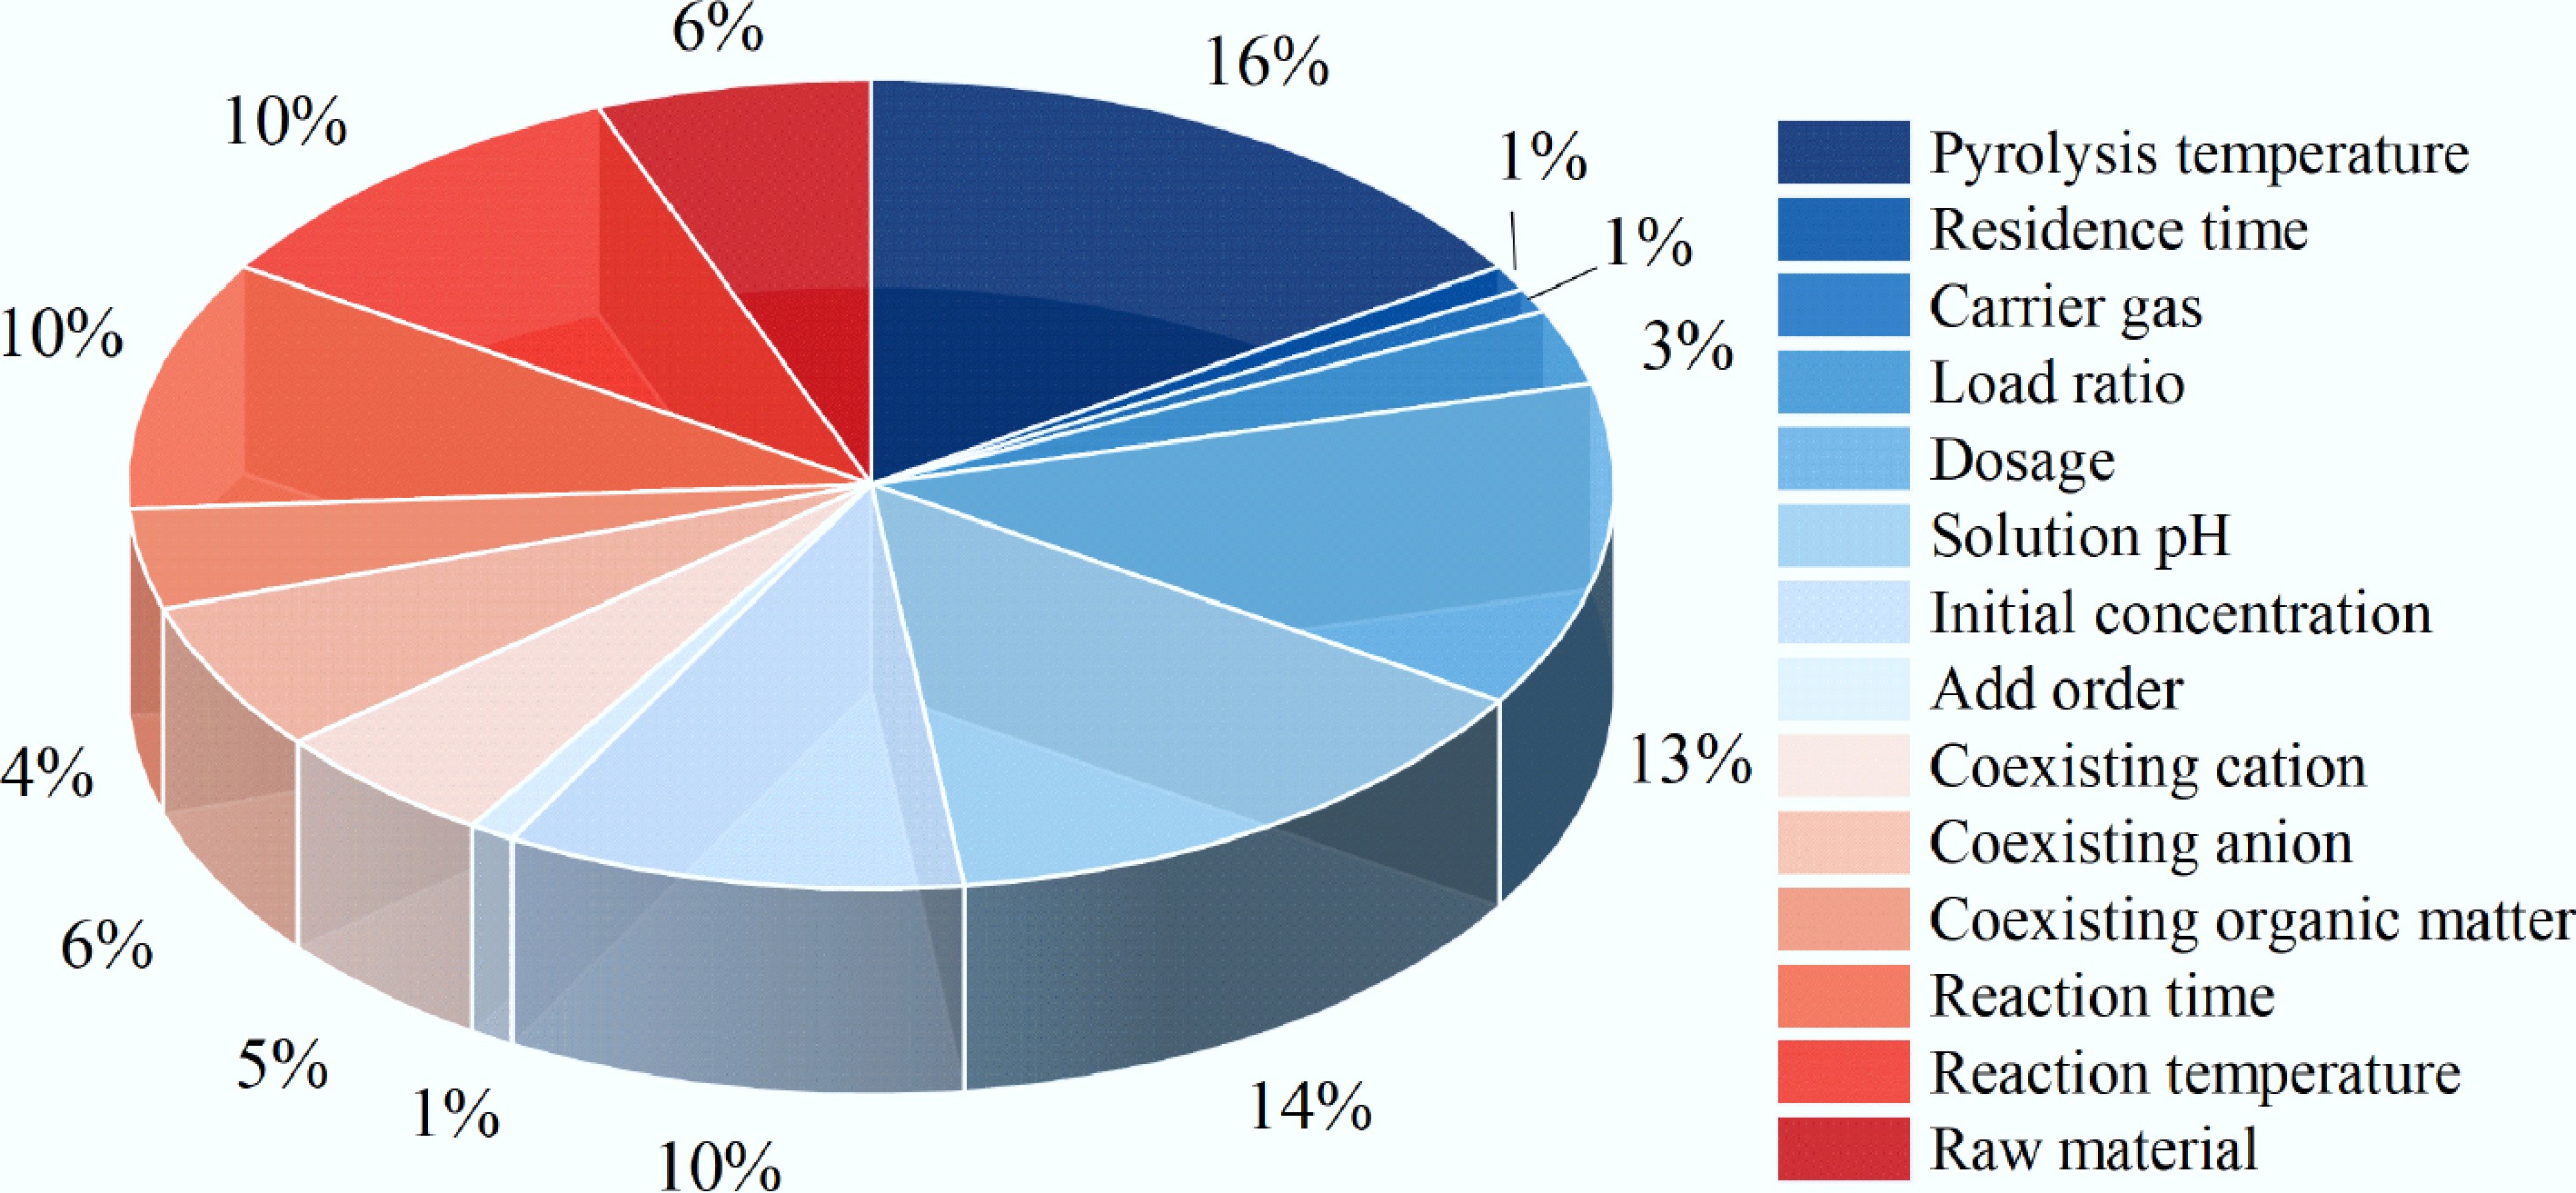
Figure 4.
The proportion of influencing factors on the removal performance of engineered biochar in co-removing heavy metals and organic pollutants.
-
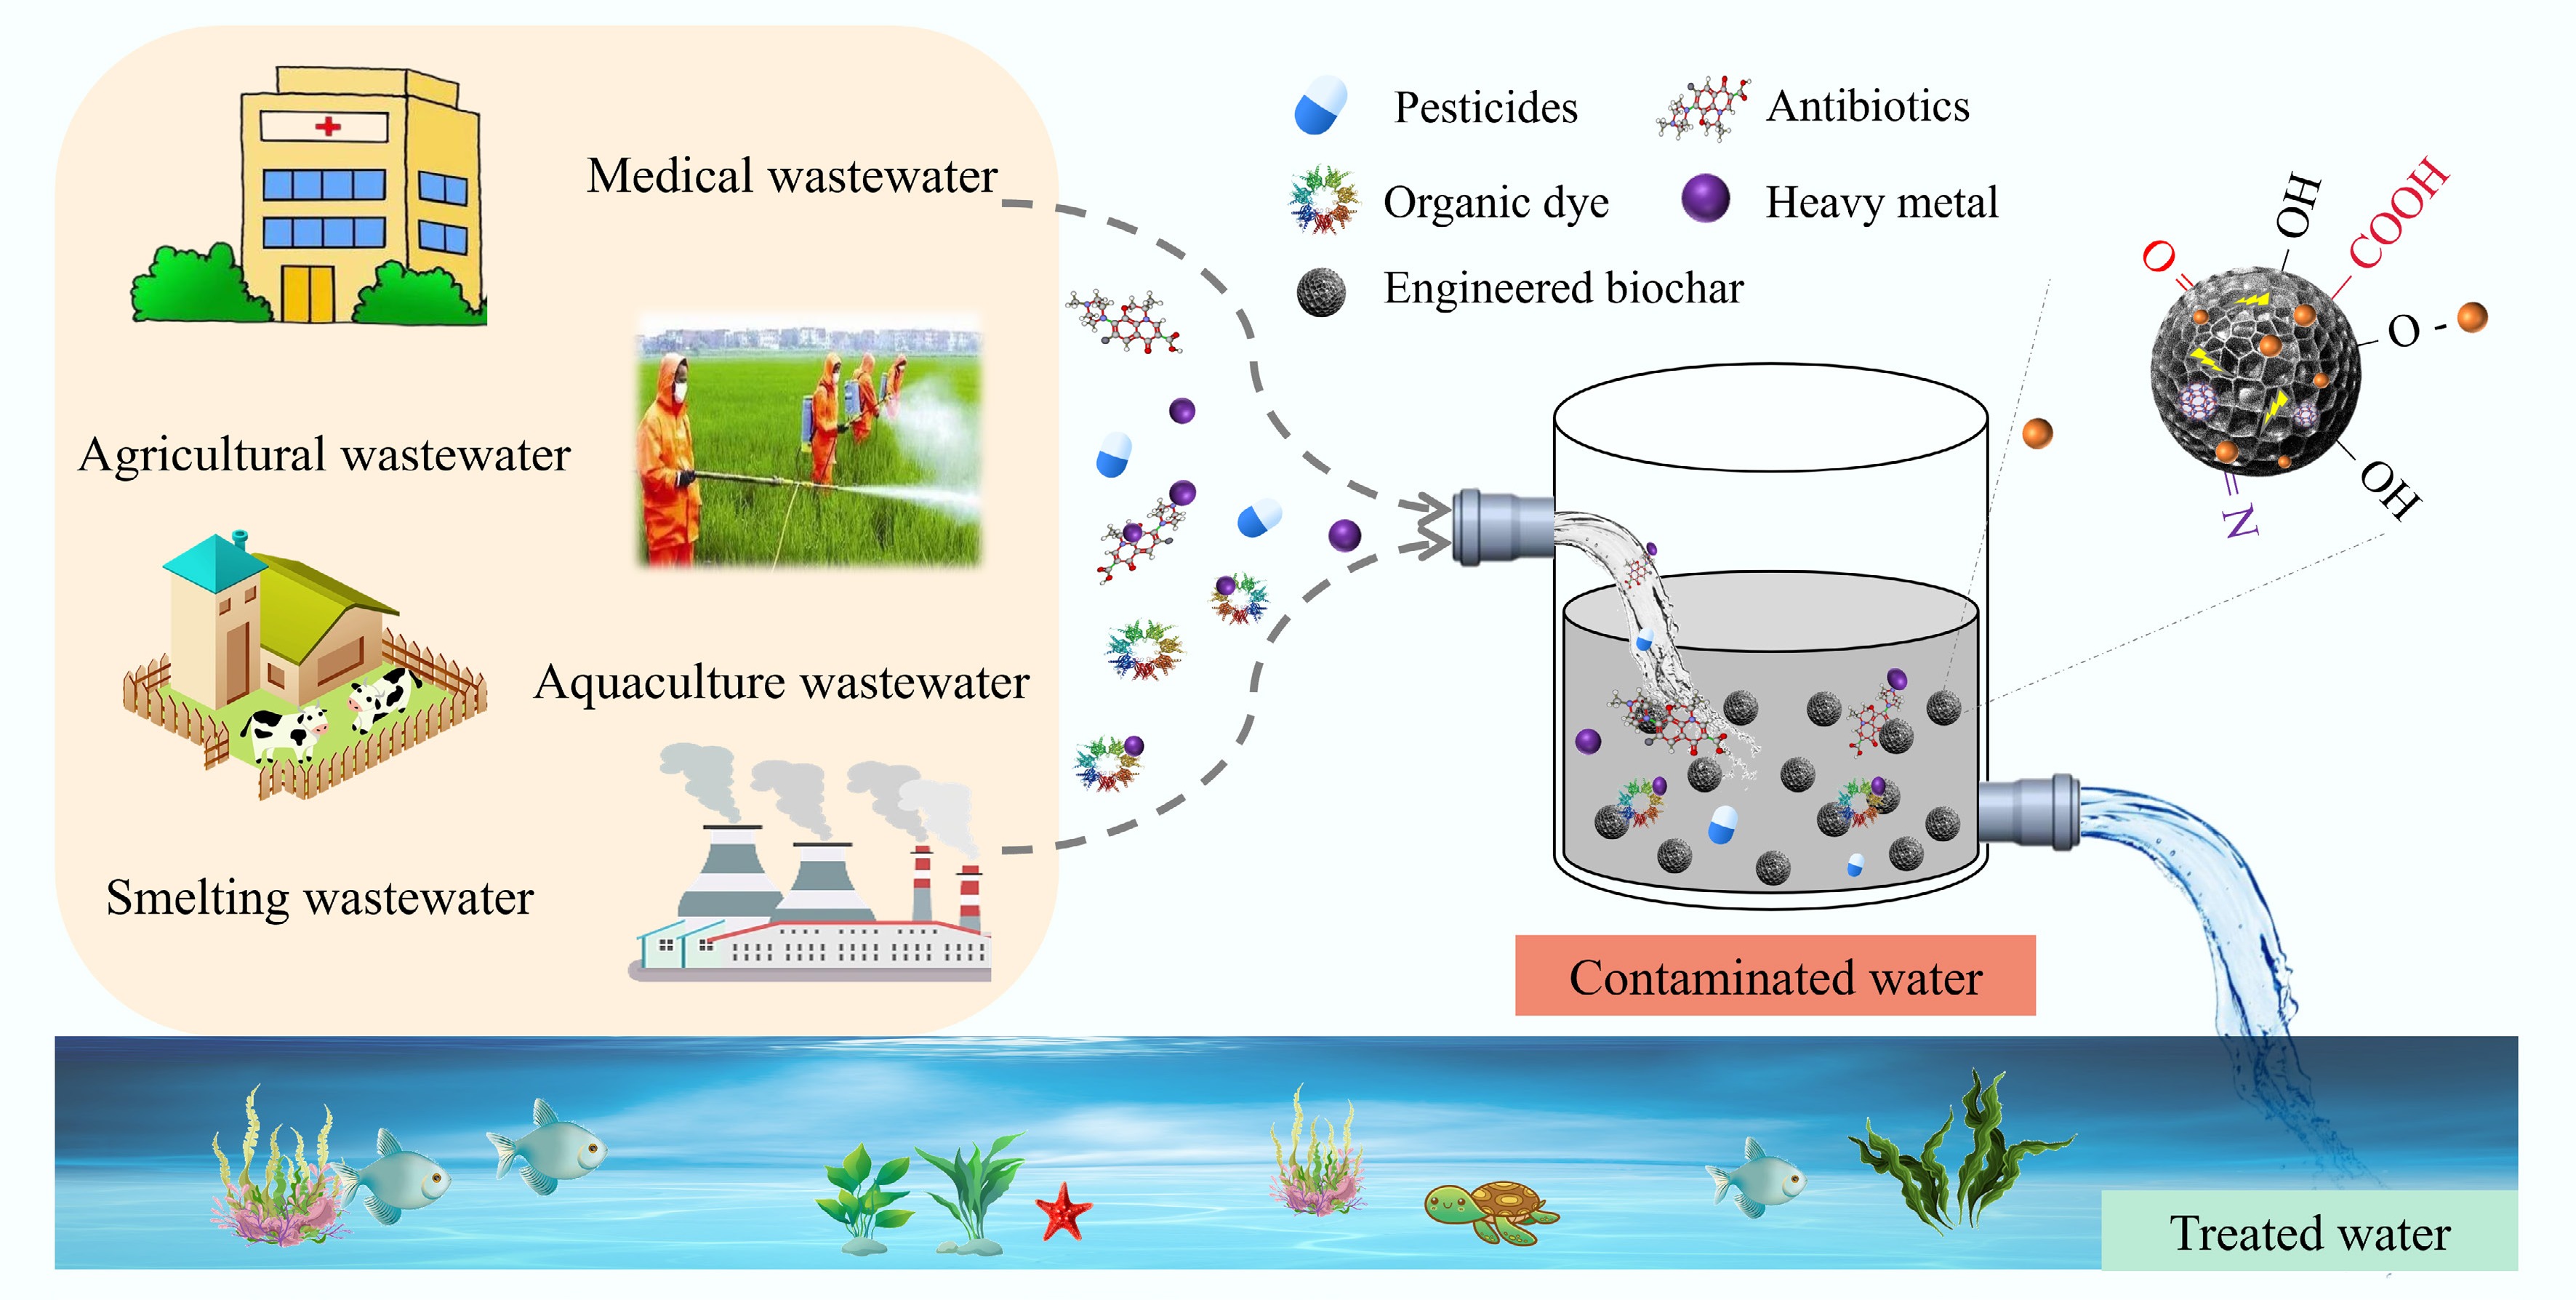
Figure 5.
Applications of engineered biochar in wastewater environment remediation.
-
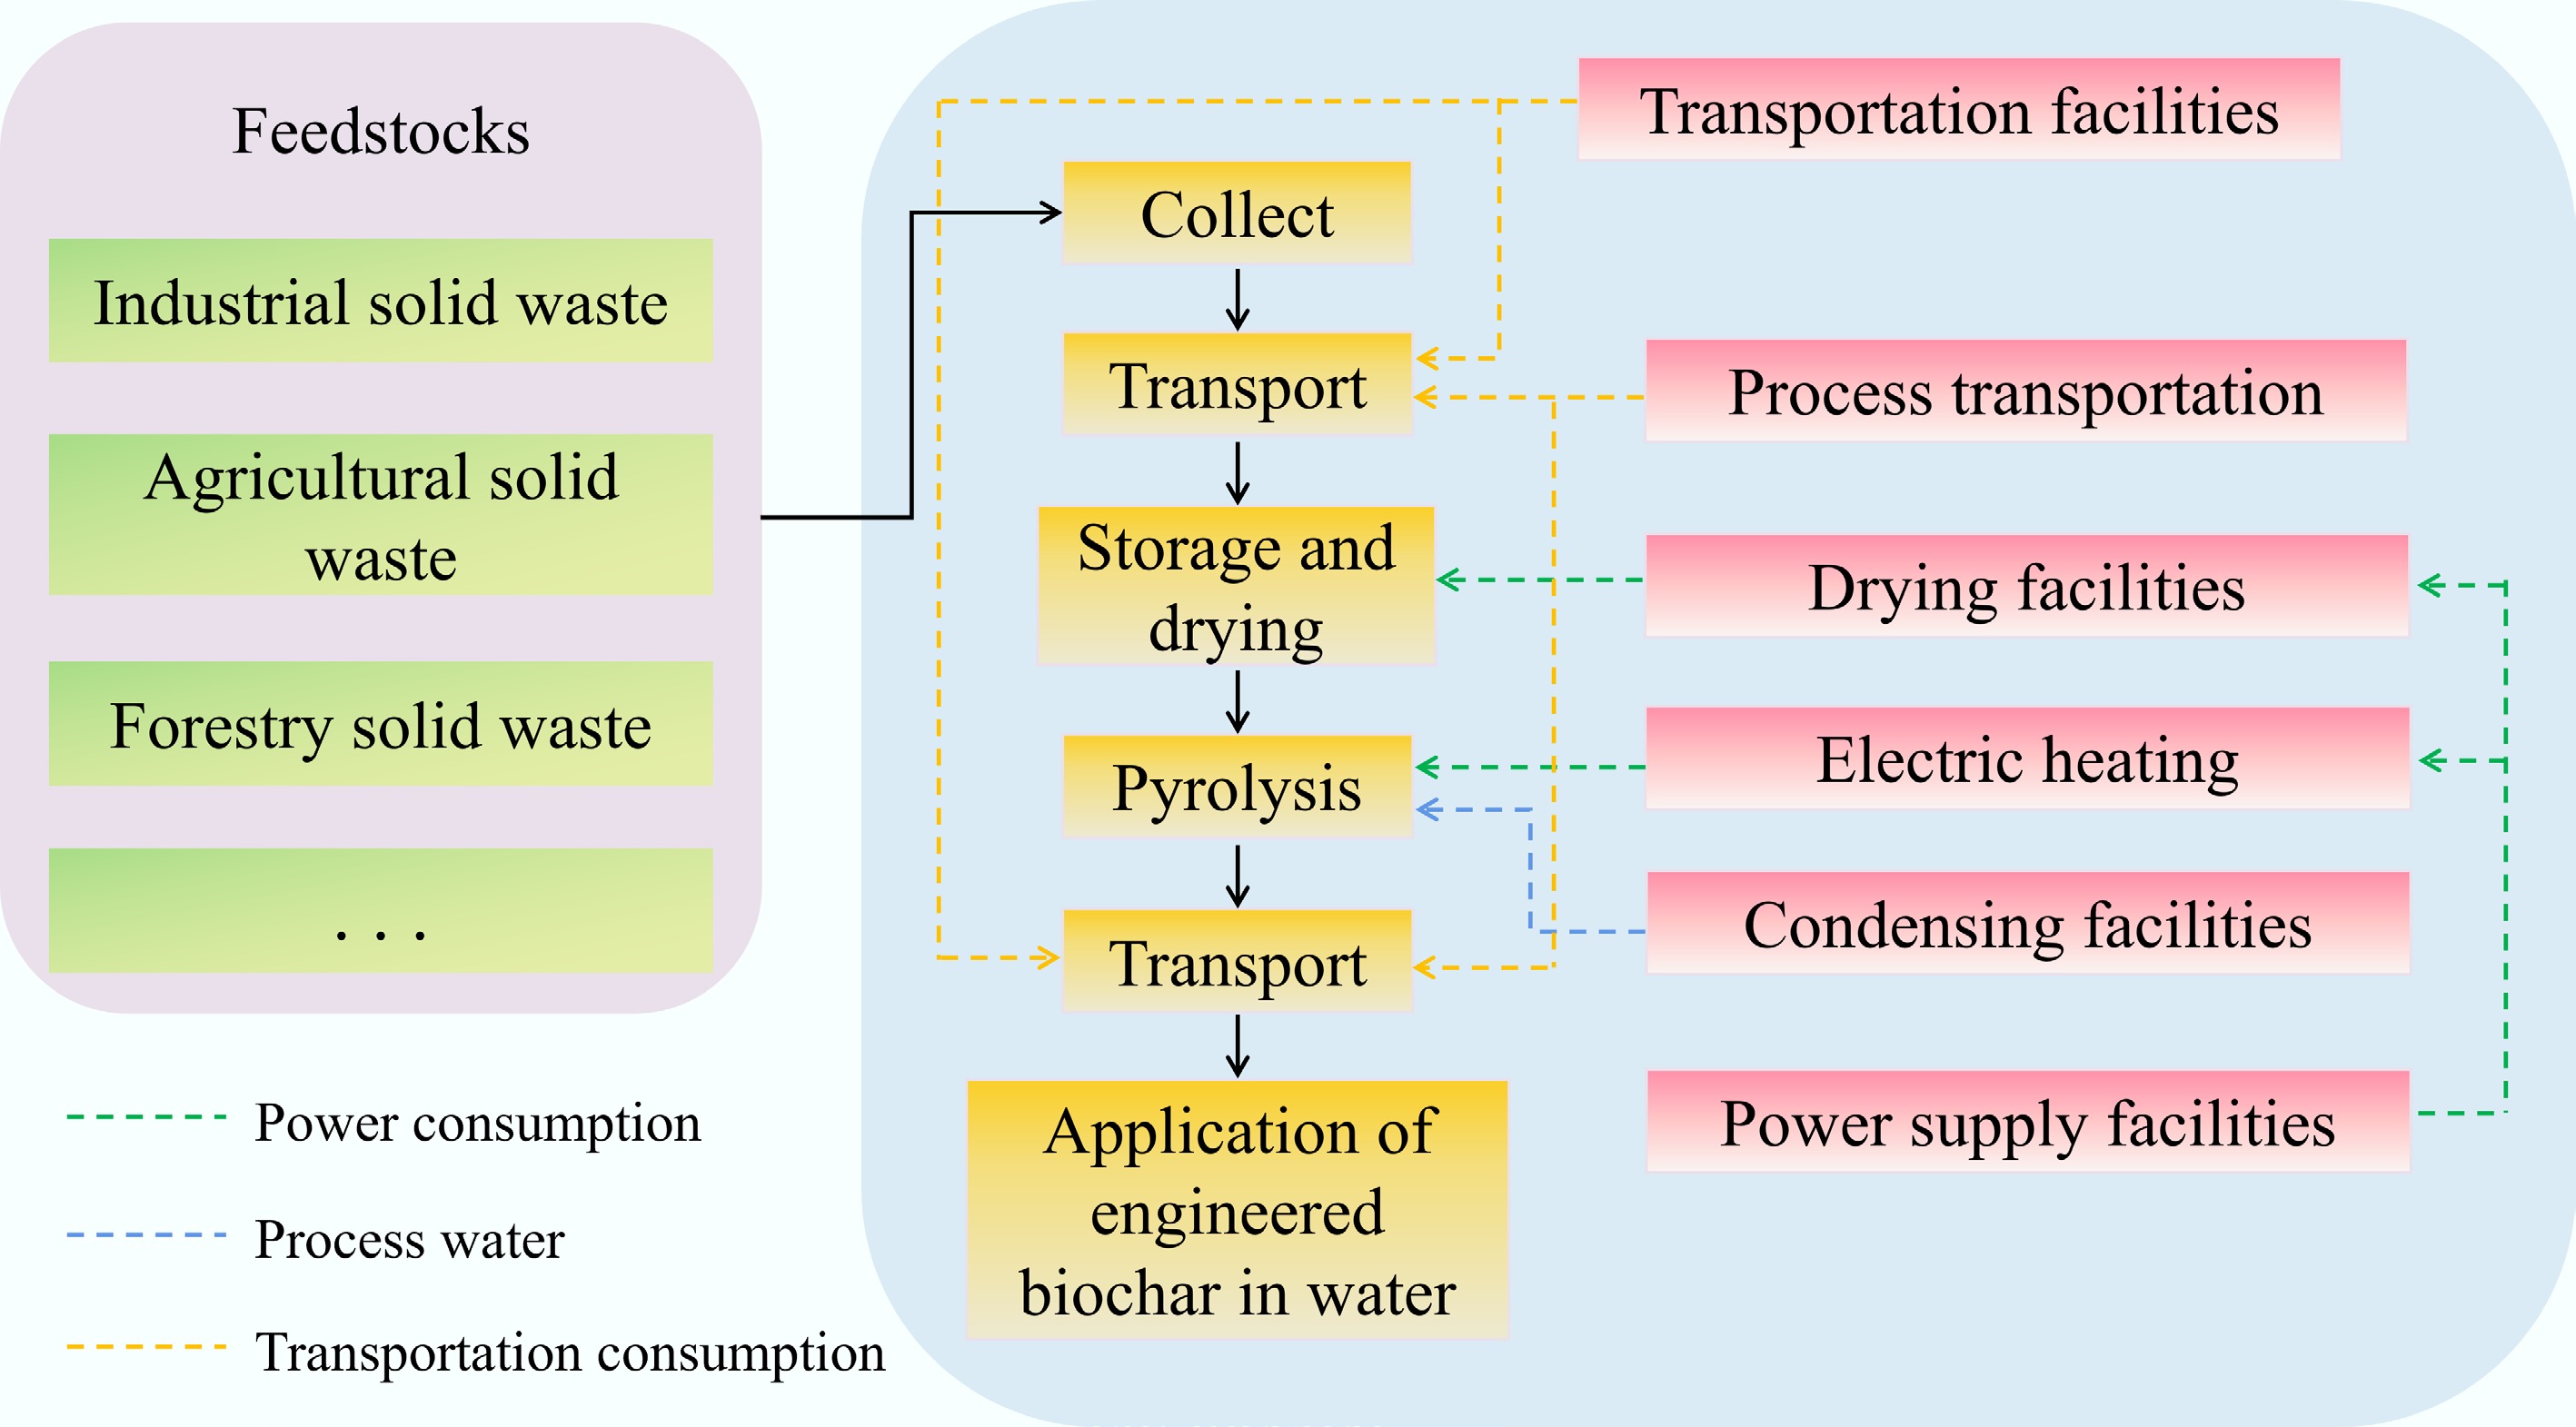
Figure 6.
System boundary of engineered biochar production process.
-
Engineered biochars Pollutants Removal performance (mg/g) pH Dosage
(g)Initial concentrations (mg/L) Reaction
time (min)Reaction temperature (°C) Ref. Hydroxyapatite-modified cod bone biochar Diclofenac 43.29 8.0 0.01 100 300 − [172] Fluoxetine 12.53 100 Pb2+ 714.24 2,100 Silicon dioxide/biochar (corn cob) nanocomposite U6+ 255.10 5.0 0.6 10–100 − 25 [173] Cr6+ 90.01 2.0 0.2 MB 1,614.04 7.0 0.4 Potassium ferrate-activated wheat straw biochar Cu2+ 48.75 − 0.2 10 720 25 [127] SMZ 51.72 Magnesium oxide/rice husk biochar composite BPA 18.10 5.0 0.1 20–160 240 25 [174] Cu2+ 64.90 Mixed silicate/hydrocarbon (pine sawdust) composites Cu2+ 214.70 − 0.5 10–300 − − [175] Zn2+ 227.30 TC 361.70 Iron/nitrogen co-doped rapeseed straw biochar CIP 46.45 2.0−6.0 0.2 50 − 25 [176] Cu2+ 30.77 EDTA/chitosan bifunctionalized magnetic biochar MO 305.4 5.0 0.5 200 − 25–45 [116] Cd2+ 63.20 100 Zn2+ 50.80 100 Eagnetically-modified Enteromorpha prolifera−based biochar hydrogels MO 47.65% 3.0 0.01 80 − [177] Cr6+ 42.50% 80 Polymethyl methacrylate/(rice husk ash)/polypyrrole composite film Cr6+ 360.50 2.0 0.006 0−80 150 25 [178] Tartrazine (E102) 165.70 60 Polyacrylic acid modified tobacco stem biochar Quinclorac 80.74% − 0.008 10 240 25 [179] Pb2+ 73.20% Iron/zinc activated rice straw biochar 17β-estradiol 123.00 − 0.006 6 − 25 [180] Cu2+ 76.00 140 Nano zero valent iron loaded biochar Cr6+ 30.87 3.0 0.3 50 2,880 25 [181] TCE 32.32 10 Table 1.
Performance and optimal conditions of engineered biochar for simultaneous removal of organic pollutants and heavy metals
-
Engineered biochars Pollutants Regeneration methods Regeneration performance Cycle
numberRef. NaOH-modified cactus biochar Peacock stone green 0.1 M NaOH The removal rate of peacock stone green decreased by 15%, and the removal rates of Cu2+ and Ni2+ both decreased by 16%. 6 [109] Cu2+ Ni2+ Iron/Zinc modified wood chip biochar TC 0.1 M NaOH The removal rates of TC and Cu2+ both exceed 89%. 3 [98] Cu2+ Polyacrylic acid-modified tobacco stem biochar Quinclorac − The removal rate of quinclorac was 53.8%, and the removal rate of Pb2+ was 45.5%. 5 [179] Pb2+ Hydroxyapatite-modified cod bone biochar Diclofenac Deionized water The adsorption capacity of diclofenac decreased by 11%−13%, the adsorption capacity of fluoxetine decreased by 15%−16%, and the adsorption capacity of Pb2+ decreased by 1.99%. 1 [172] Fluoxetine Pb2+ EDTA/Chitosan bifunctionalized magnetic biochar MO 1 M NaOH The removal rate of MO decreased by 16.8%, the removal rate of Cd2+ decreased by 1.5%, and the removal rate of Zn2+ decreased by 8.9%. 8 [116] Cd2+ 0.01 M EDTA-2Na Zn2+ Potassium ferrate-activated wheat straw biochar Cu2+ 0.01 M NaOH − 3 [127] SMZ Ball-milled magnetic nano biochar TC 0.2 M NaOH The adsorption capacities of TC and Hg2+ were approximately 90.55 and 87.36 mg/g. 5 [182] Hg2+ 0.5 M Na2S Iron/zinc-activated rice straw biochar 17β-estradiol Ethanol The removal rate of 17β-estradiol and Cu2+ decreased by 13.79% and 12.16%. 5 [180] Cu2+ Deionized water Iron/nitrogen co-doped rapeseed straw biochar CIP − The adsorption capacities of CIP and Cu2+ were approximately 3.67 and 3.89 mg/g. 5 [176] Cu2+ Table 2.
Regeneration performance of engineered biochar
Figures
(6)
Tables
(2)