-
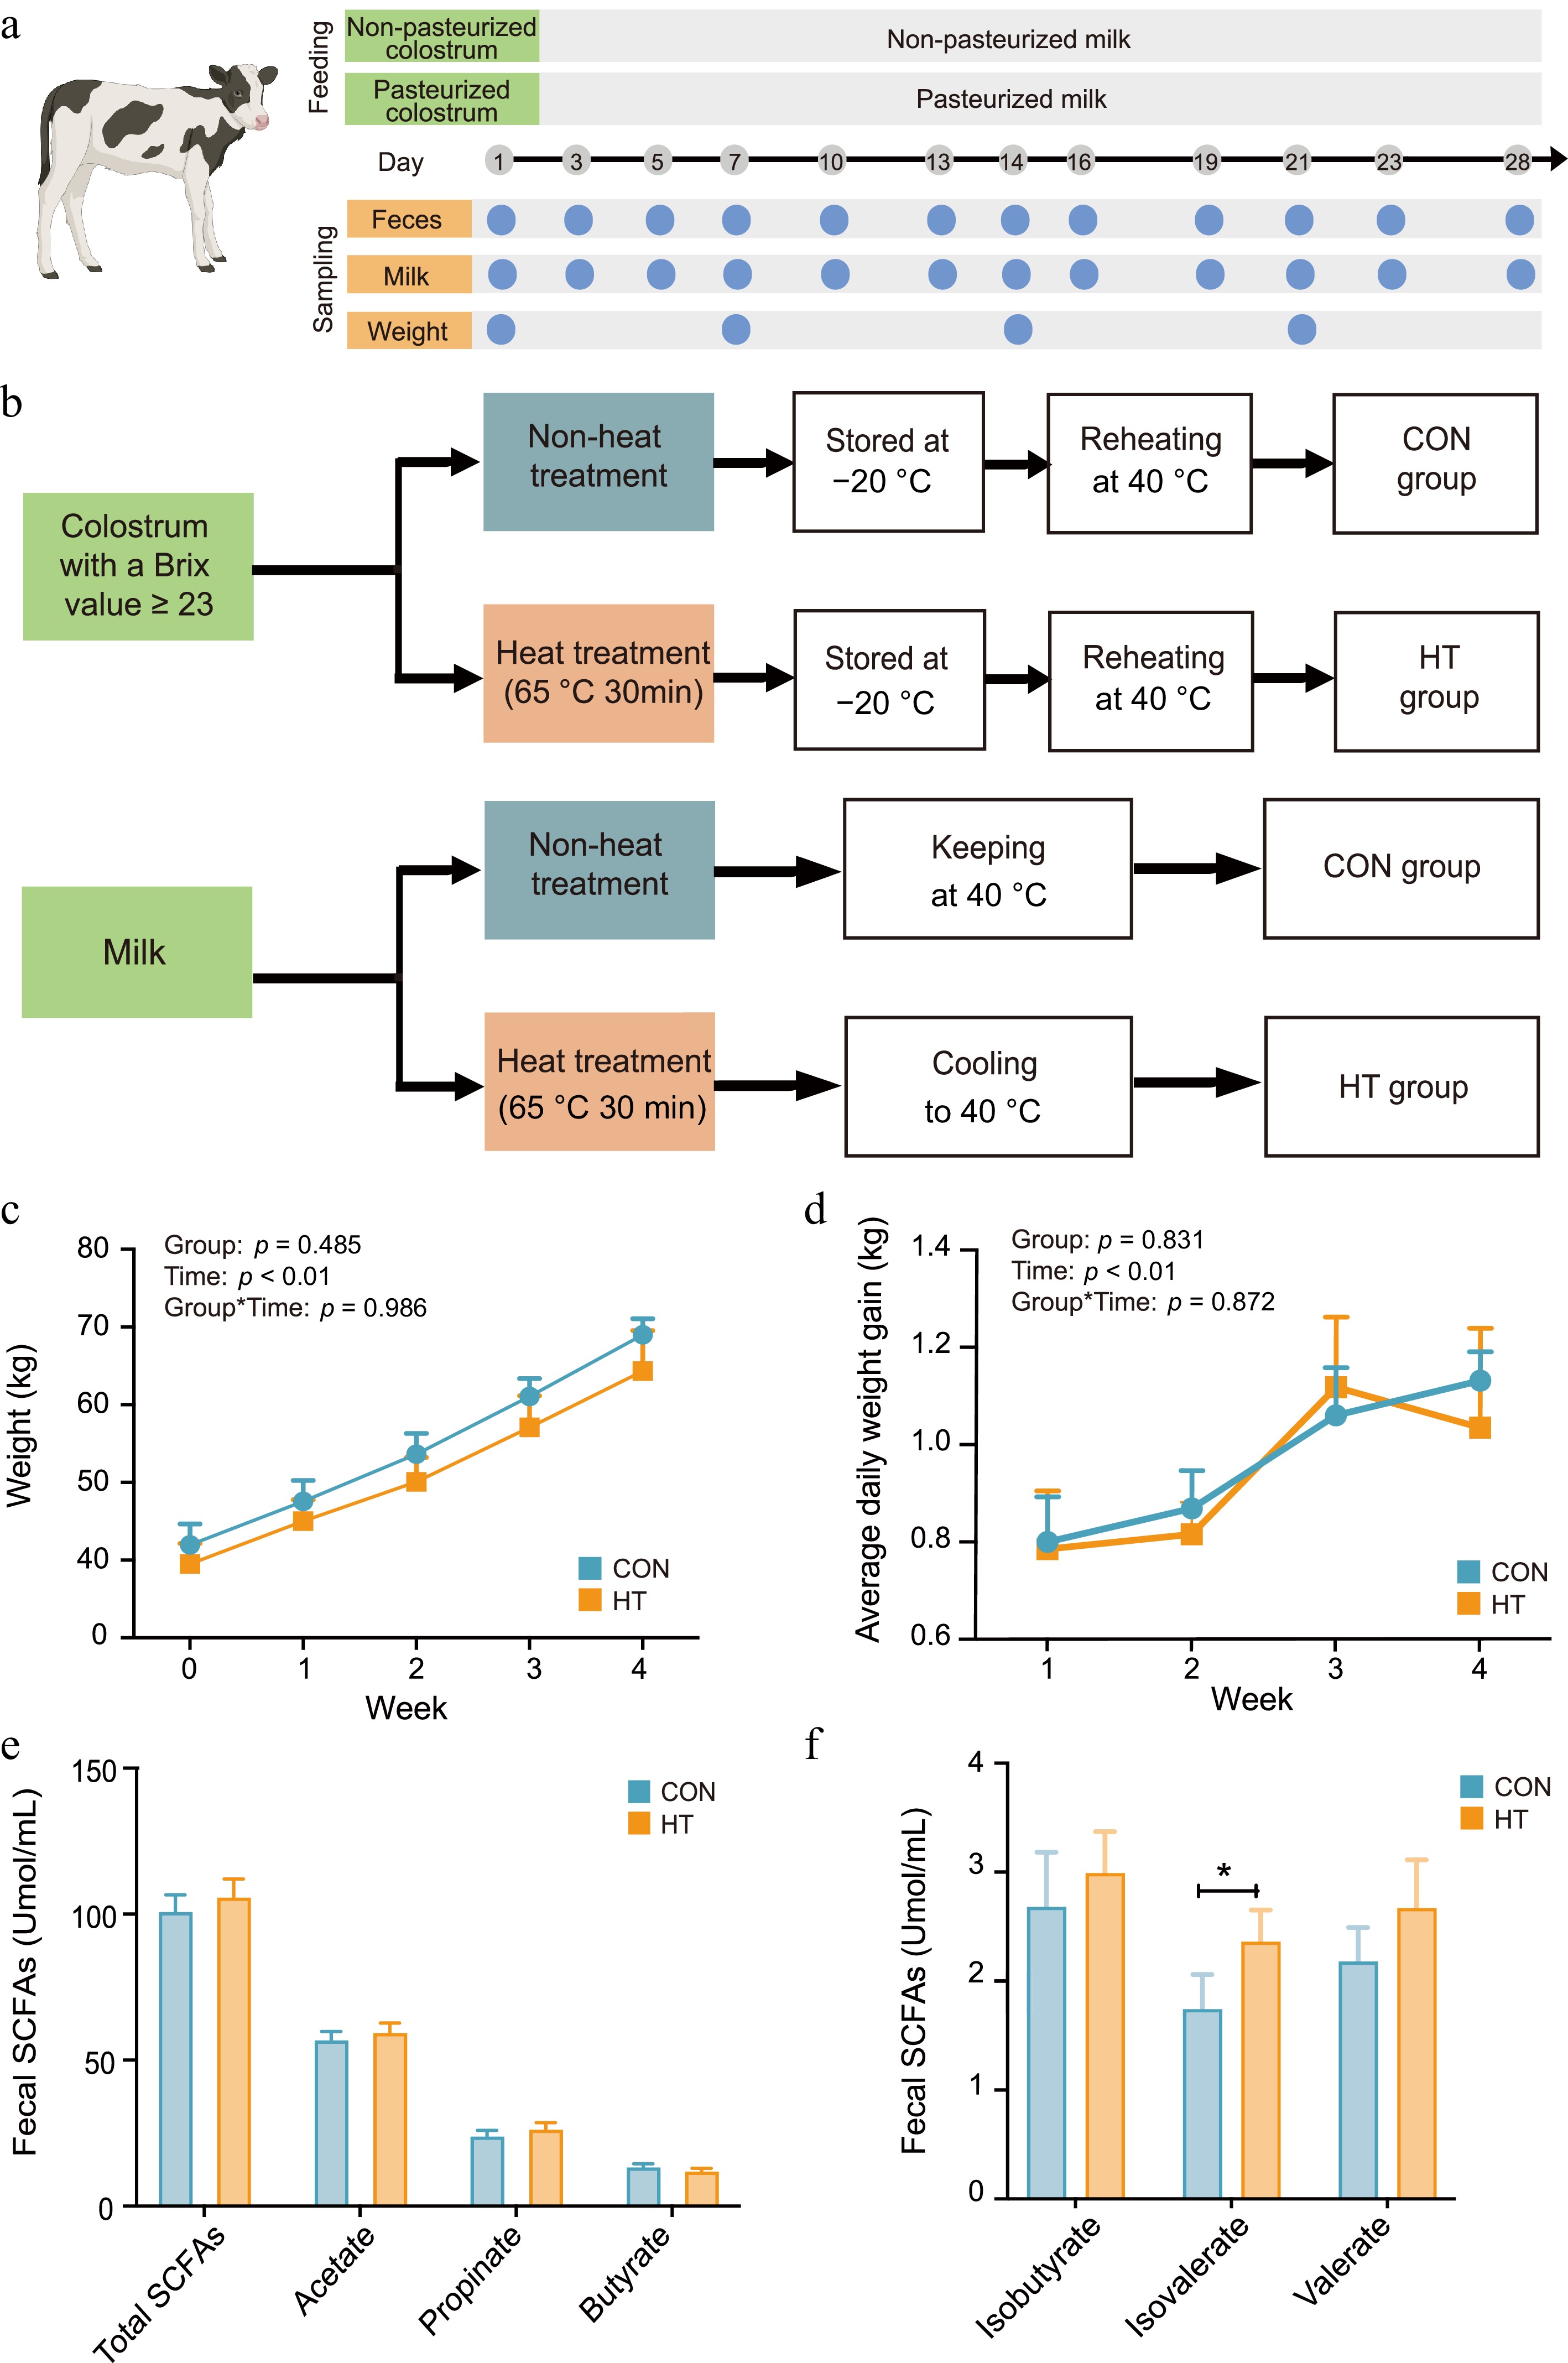
Figure 1.
Effect of feeding pasteurized milk on dairy calf growth performance. (a) Schedule of feeding and sampling throughout the whole experiment period. (b) The pasteurization flow process. (c), (d) Weekly weight and weekly ADG of calves. (e), (f) Changes in fecal total SCFAs in both groups throughout the test period. CON, control group; HT, pasteurization group.
-
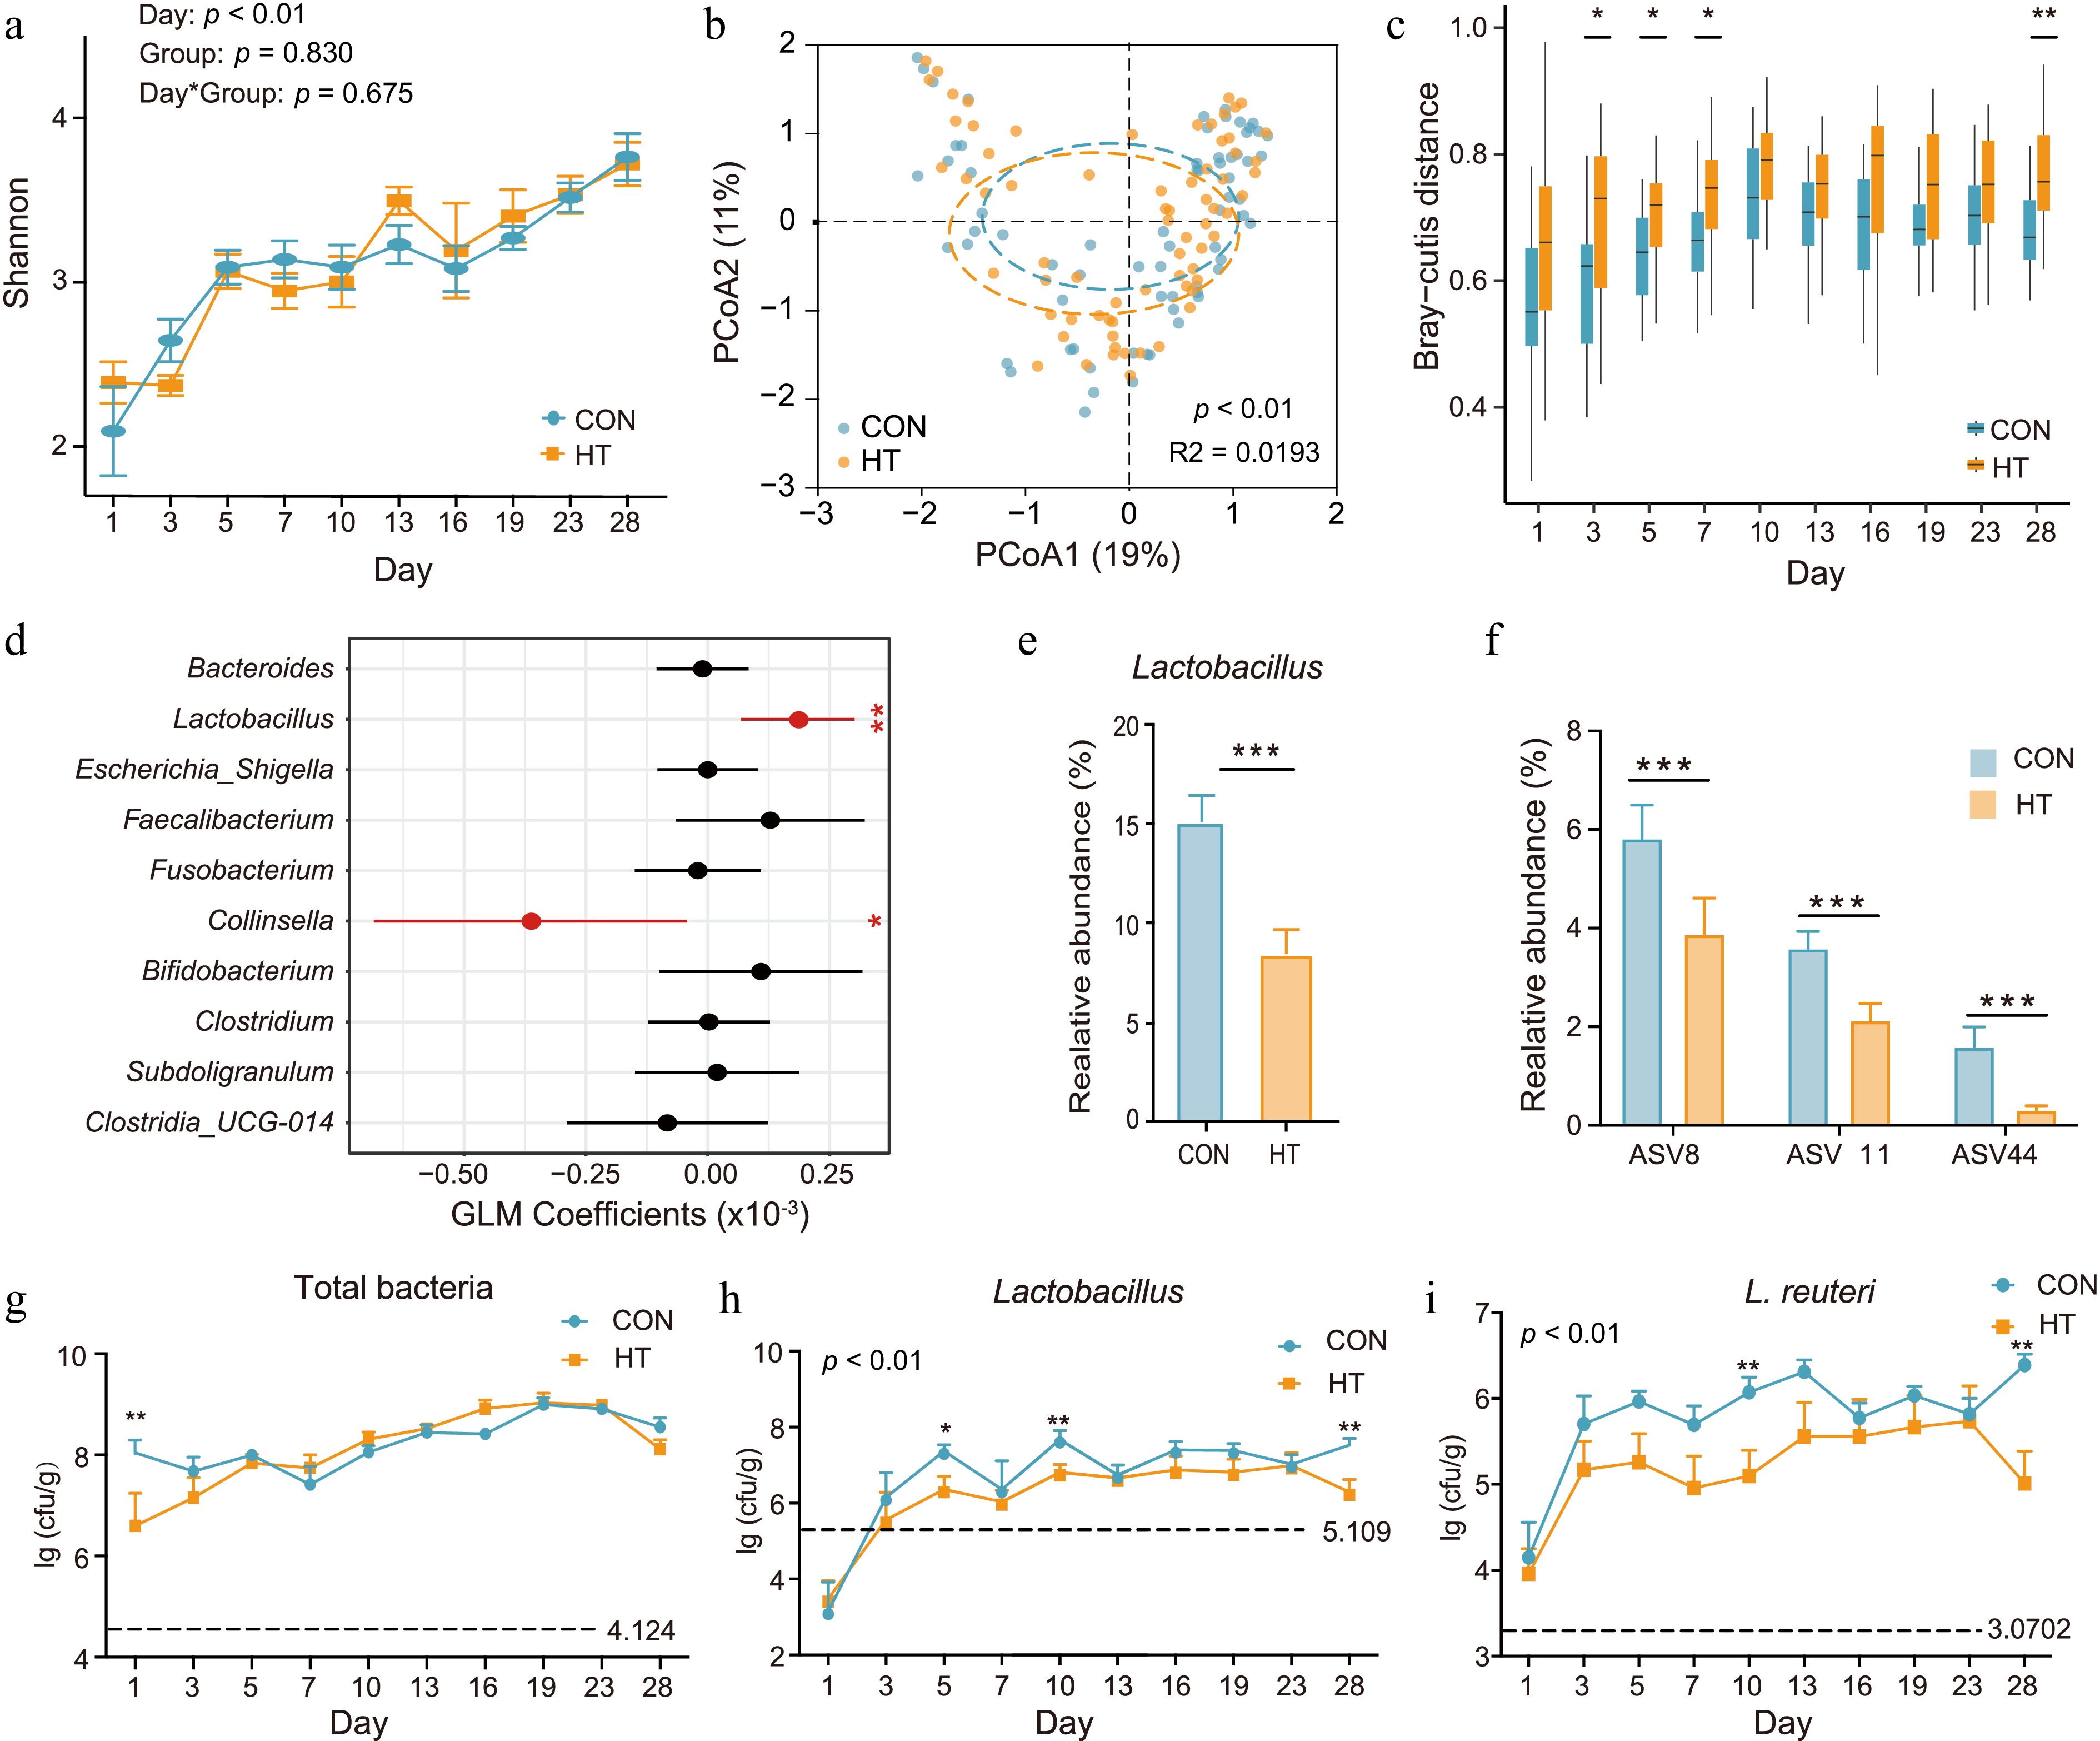
Figure 2.
Fecal microbial composition of the CON and HT groups over time. (a) Alpha diversity as measured by Shannon diversity index (LMM, p > 0.05). (b) Bacterial composition of CON and HT calves based on genus level visualized using principal coordinate analysis (PCoA). (c) Boxplot showing beta diversities (inter-community Bray-Curtis distance based on relative abundances) of bacterial communities between samples within each time point. (d) Estimates from the GLM analysis for quantifying the bacterial contribution on feeding pasteurized milk. (e), (f) Differences in relative abundance of Lactobacillus in calf feces (%). (g)–(i) Absolute abundance of total bacteria, Lactobacillus (U. test, p < 0.01) and L. reuteri (U. test, p < 0.01). CON, control group; HT, pasteurization group.
-
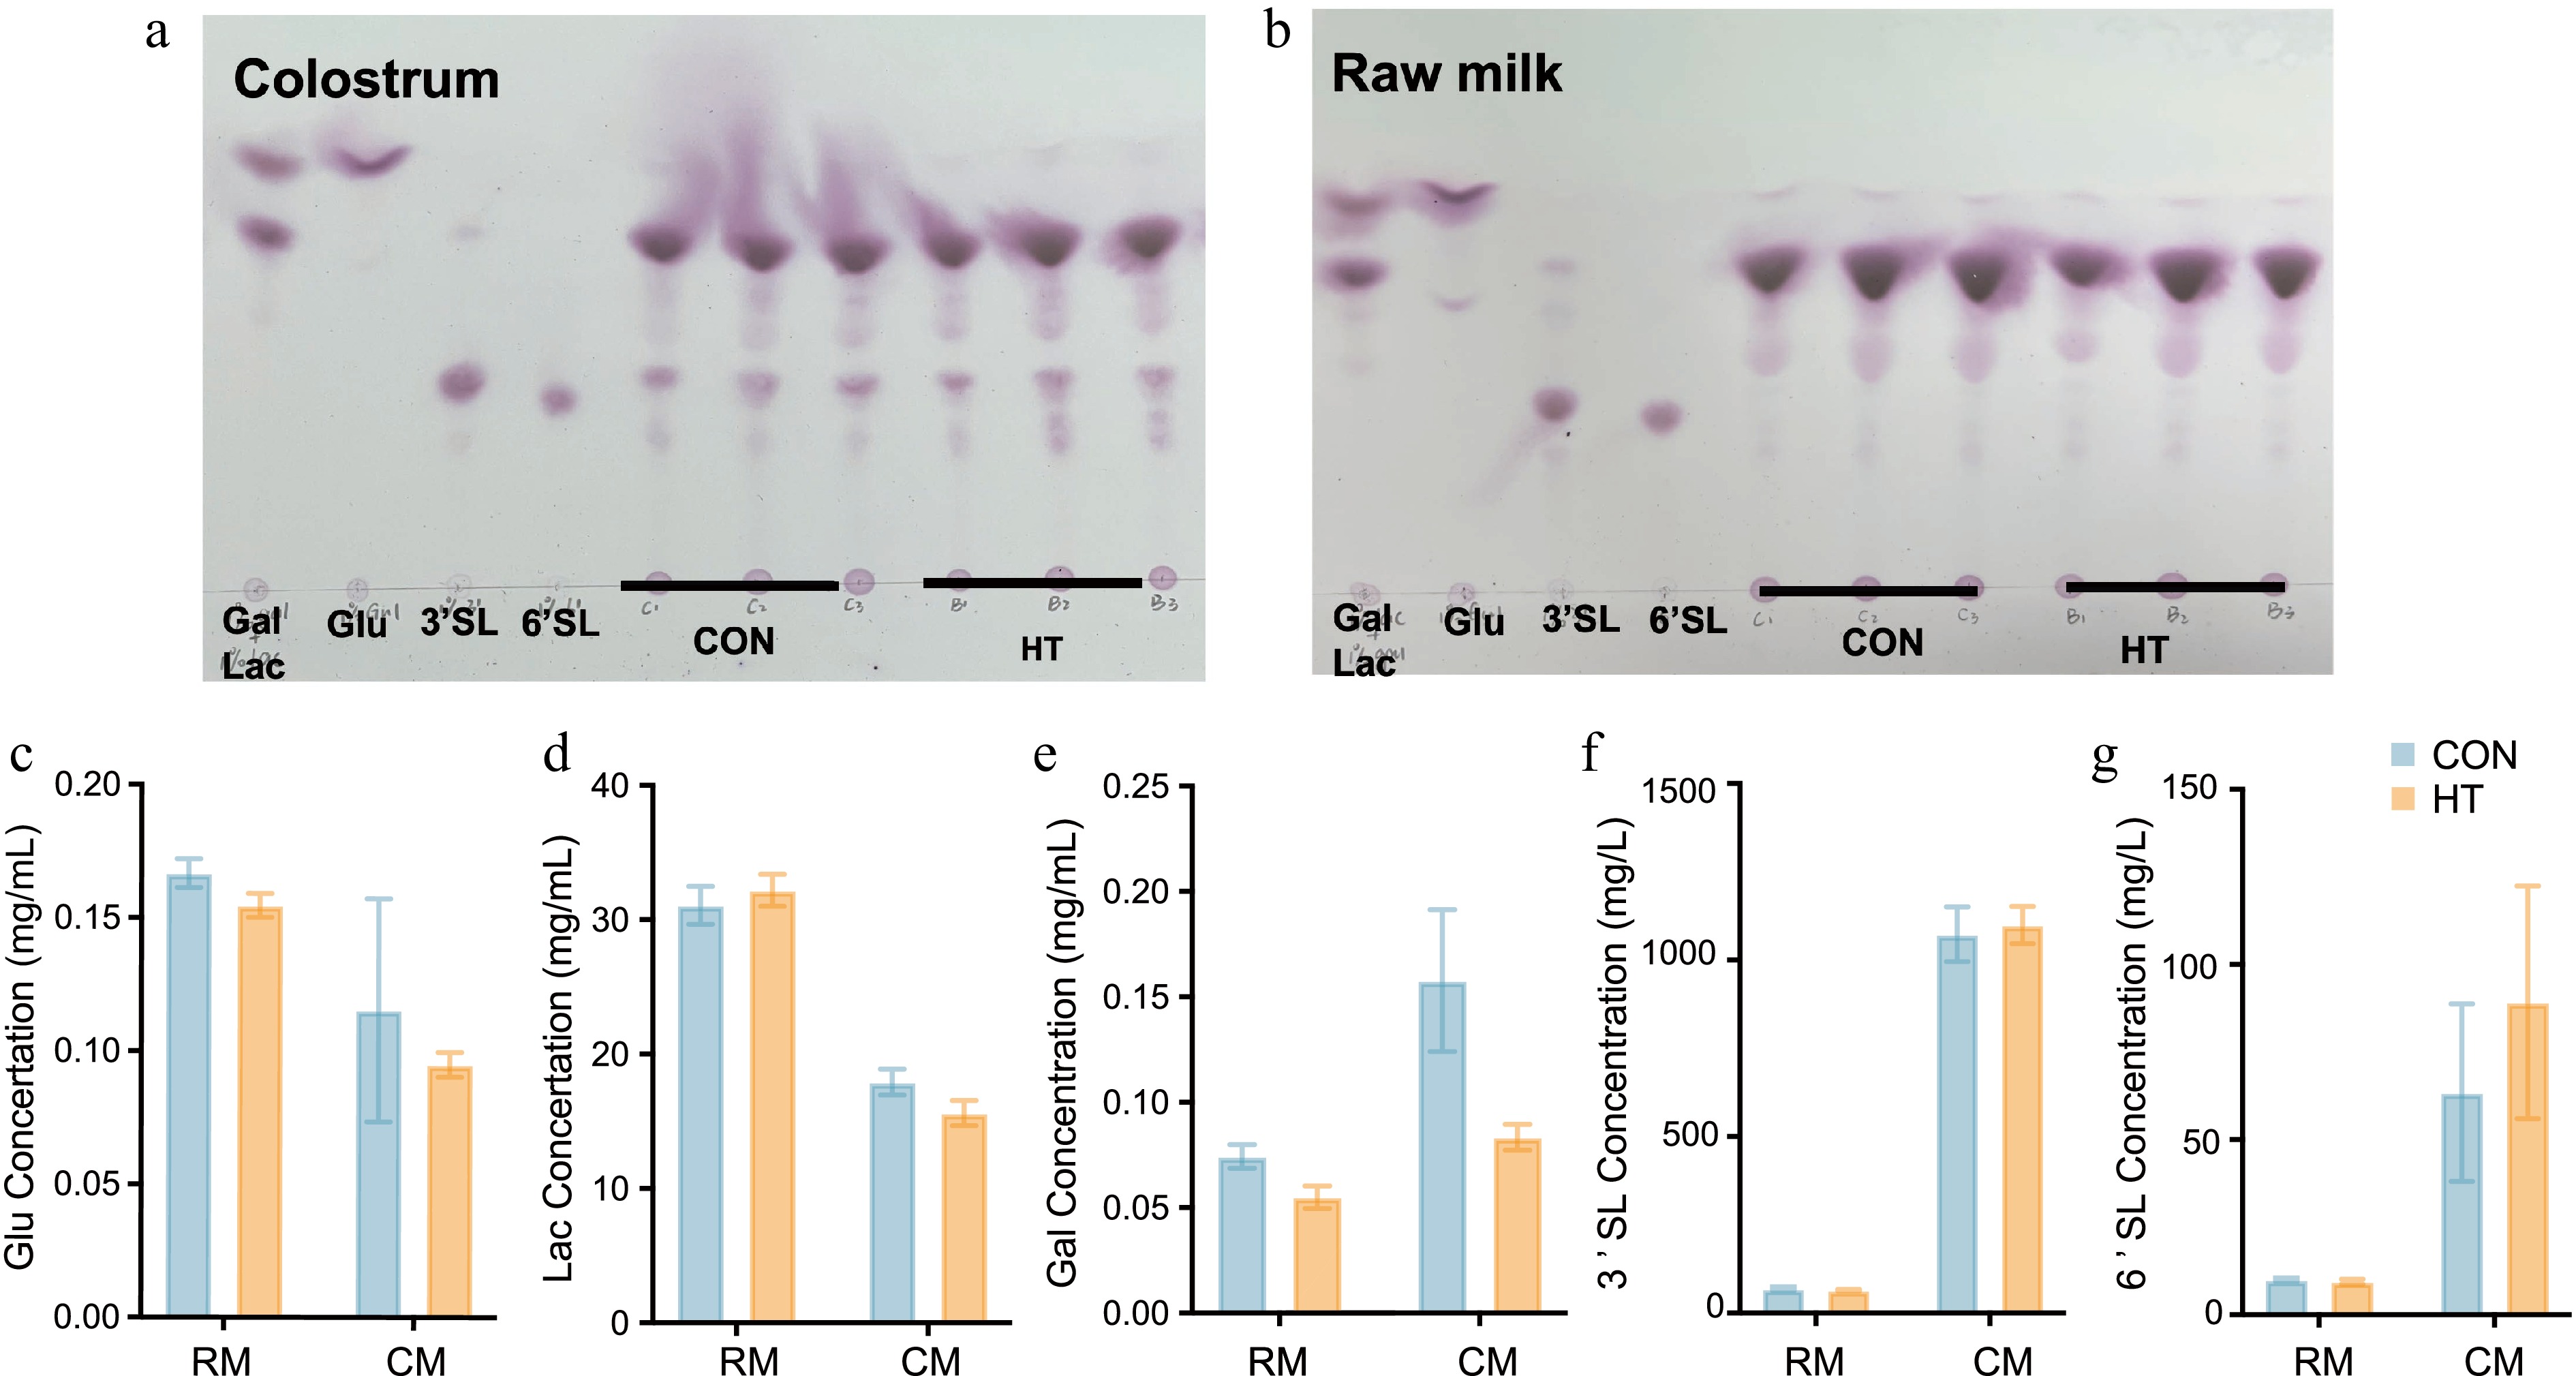
Figure 3.
The impact of pasteurization on key carbohydrates in milk. (a), (b) Results of TLC of key carbohydrates in raw milk and colostrum. (c)–(g) Carbohydrate content of raw milk and colostrum (p > 0.05). RM, raw milk; CM, colostrum; CON, control group; HT, pasteurization group.
-
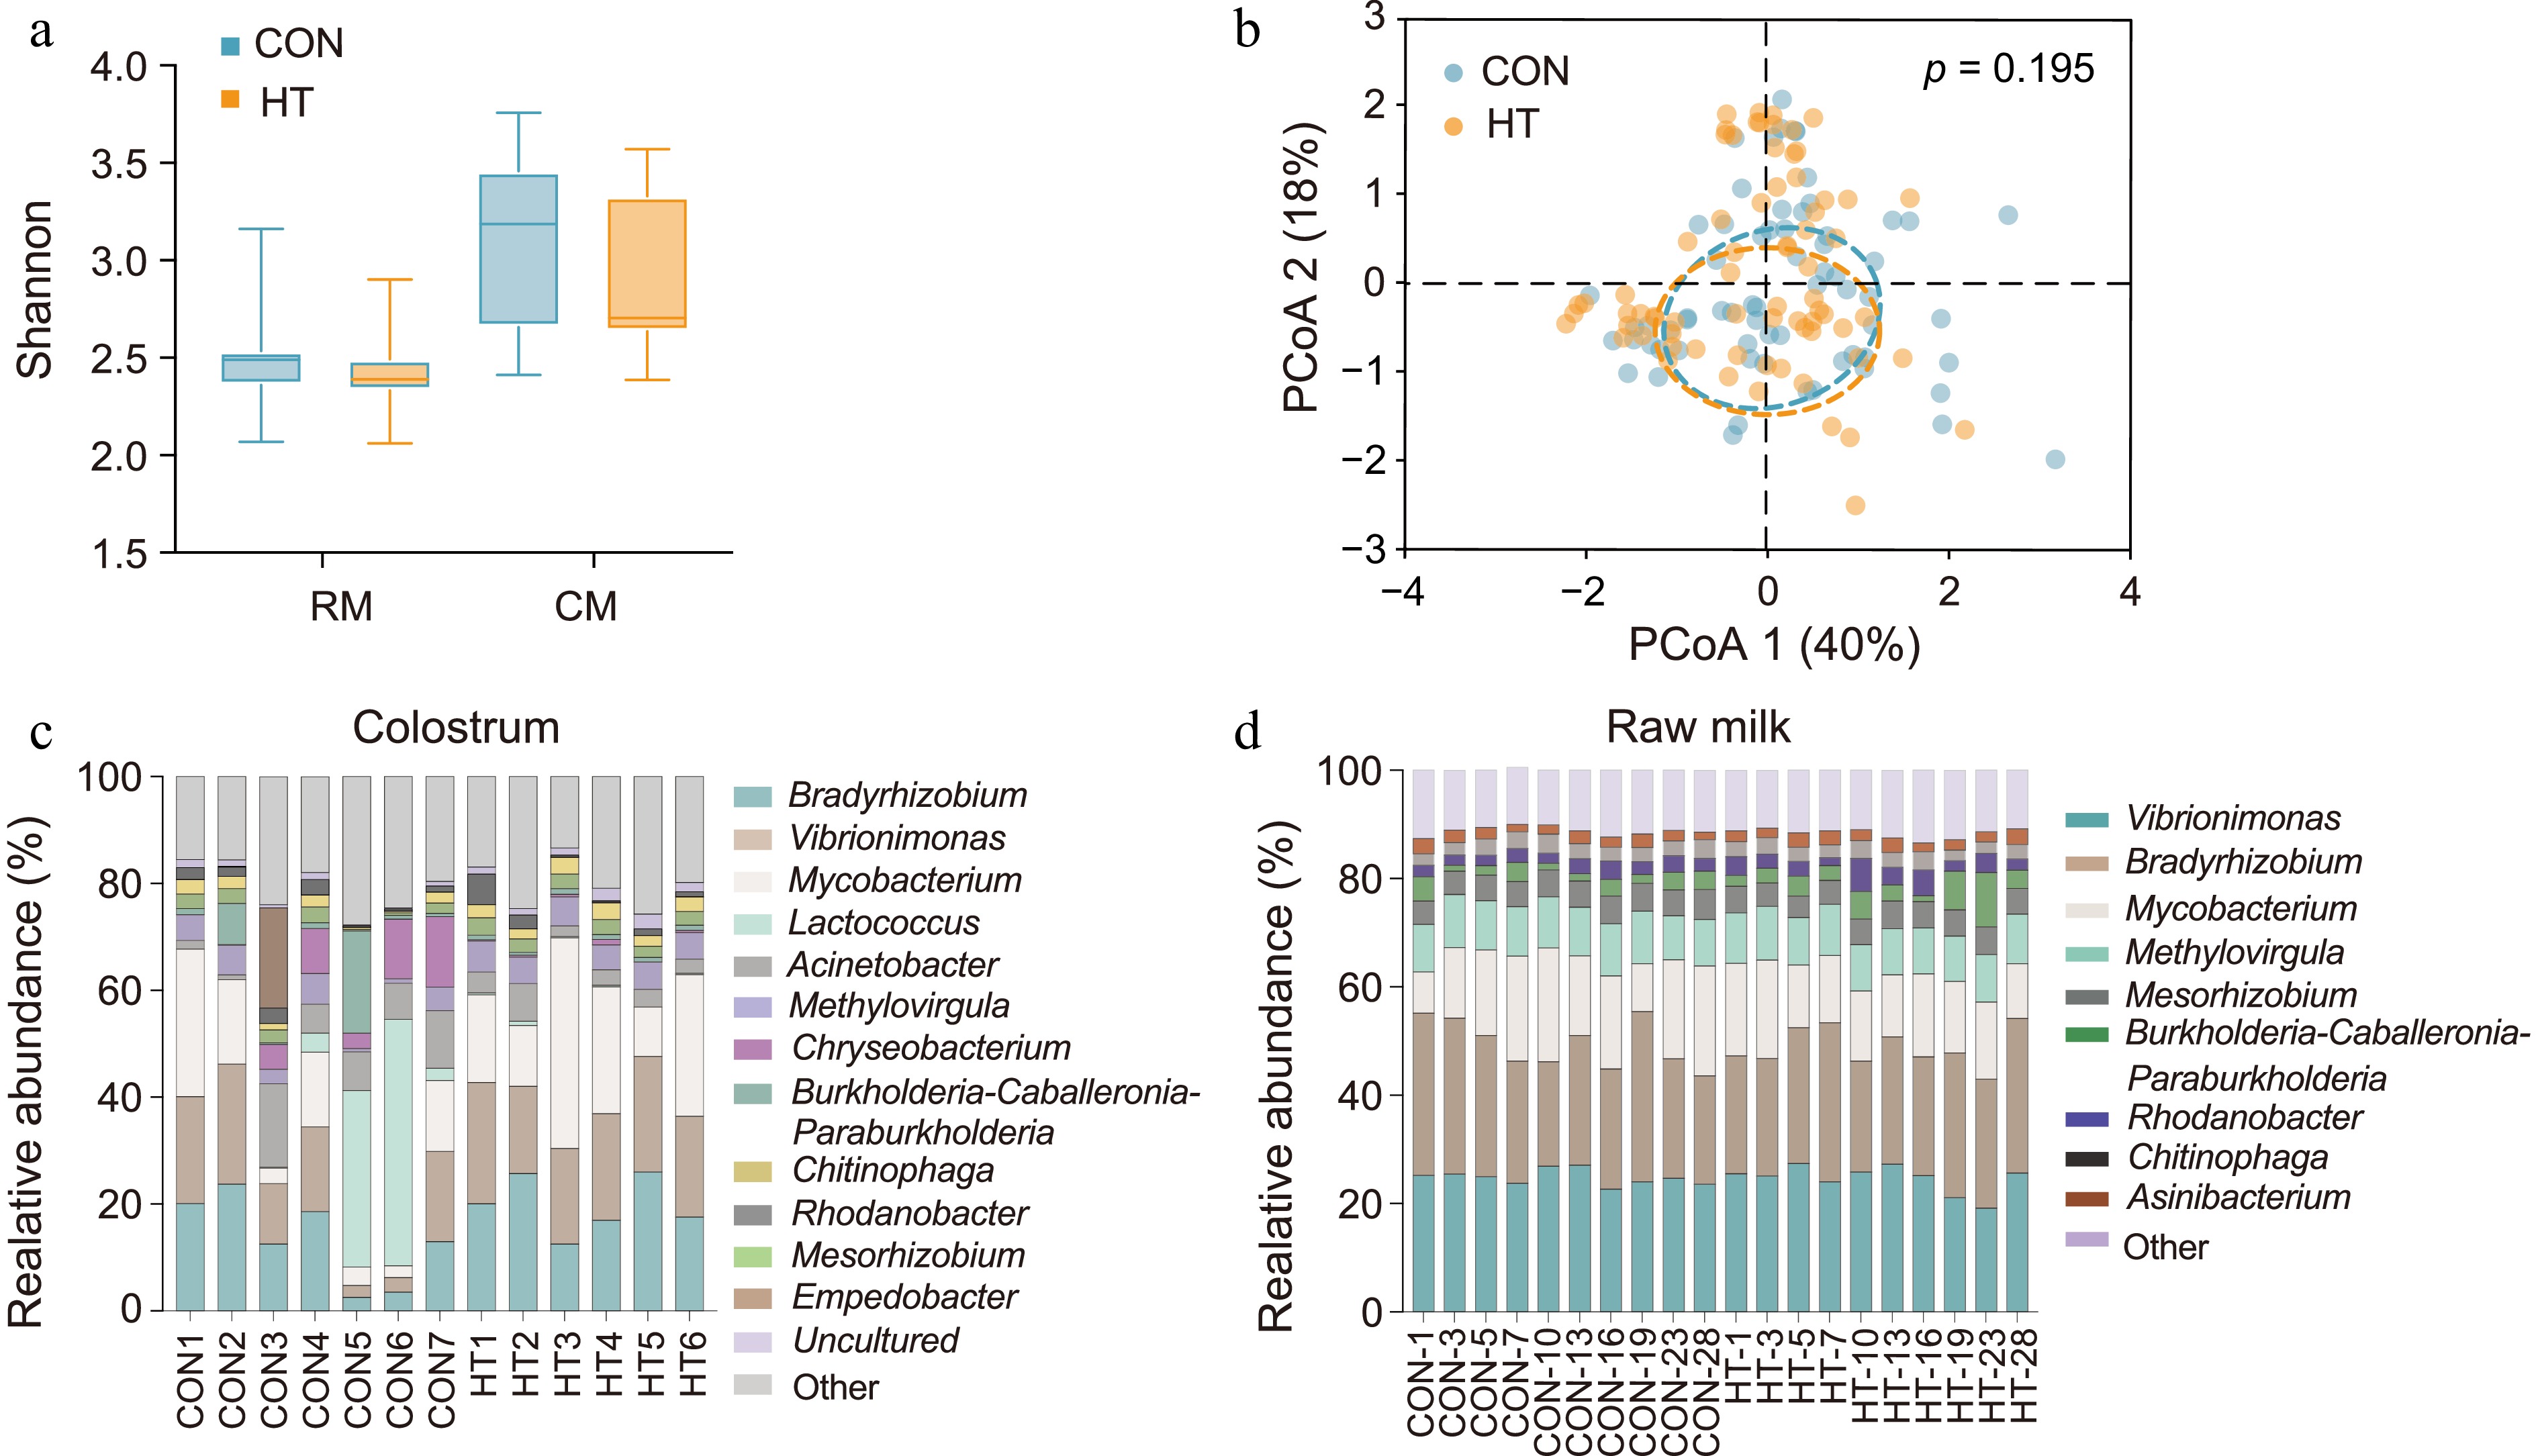
Figure 4.
Effect of pasteurization on the microbiota of milk. (a) Alpha diversity of milk and colostrum microorganisms (p > 0.05). (b) Bacterial composition of milk before and after pasteurization visualized using principal-coordinate analysis (PCoA). (c), (d) Composition of colostrum and raw milk microorganisms at the genus level. RM, raw milk; CM, colostrum; CON, control group; HT, pasteurization group.
-
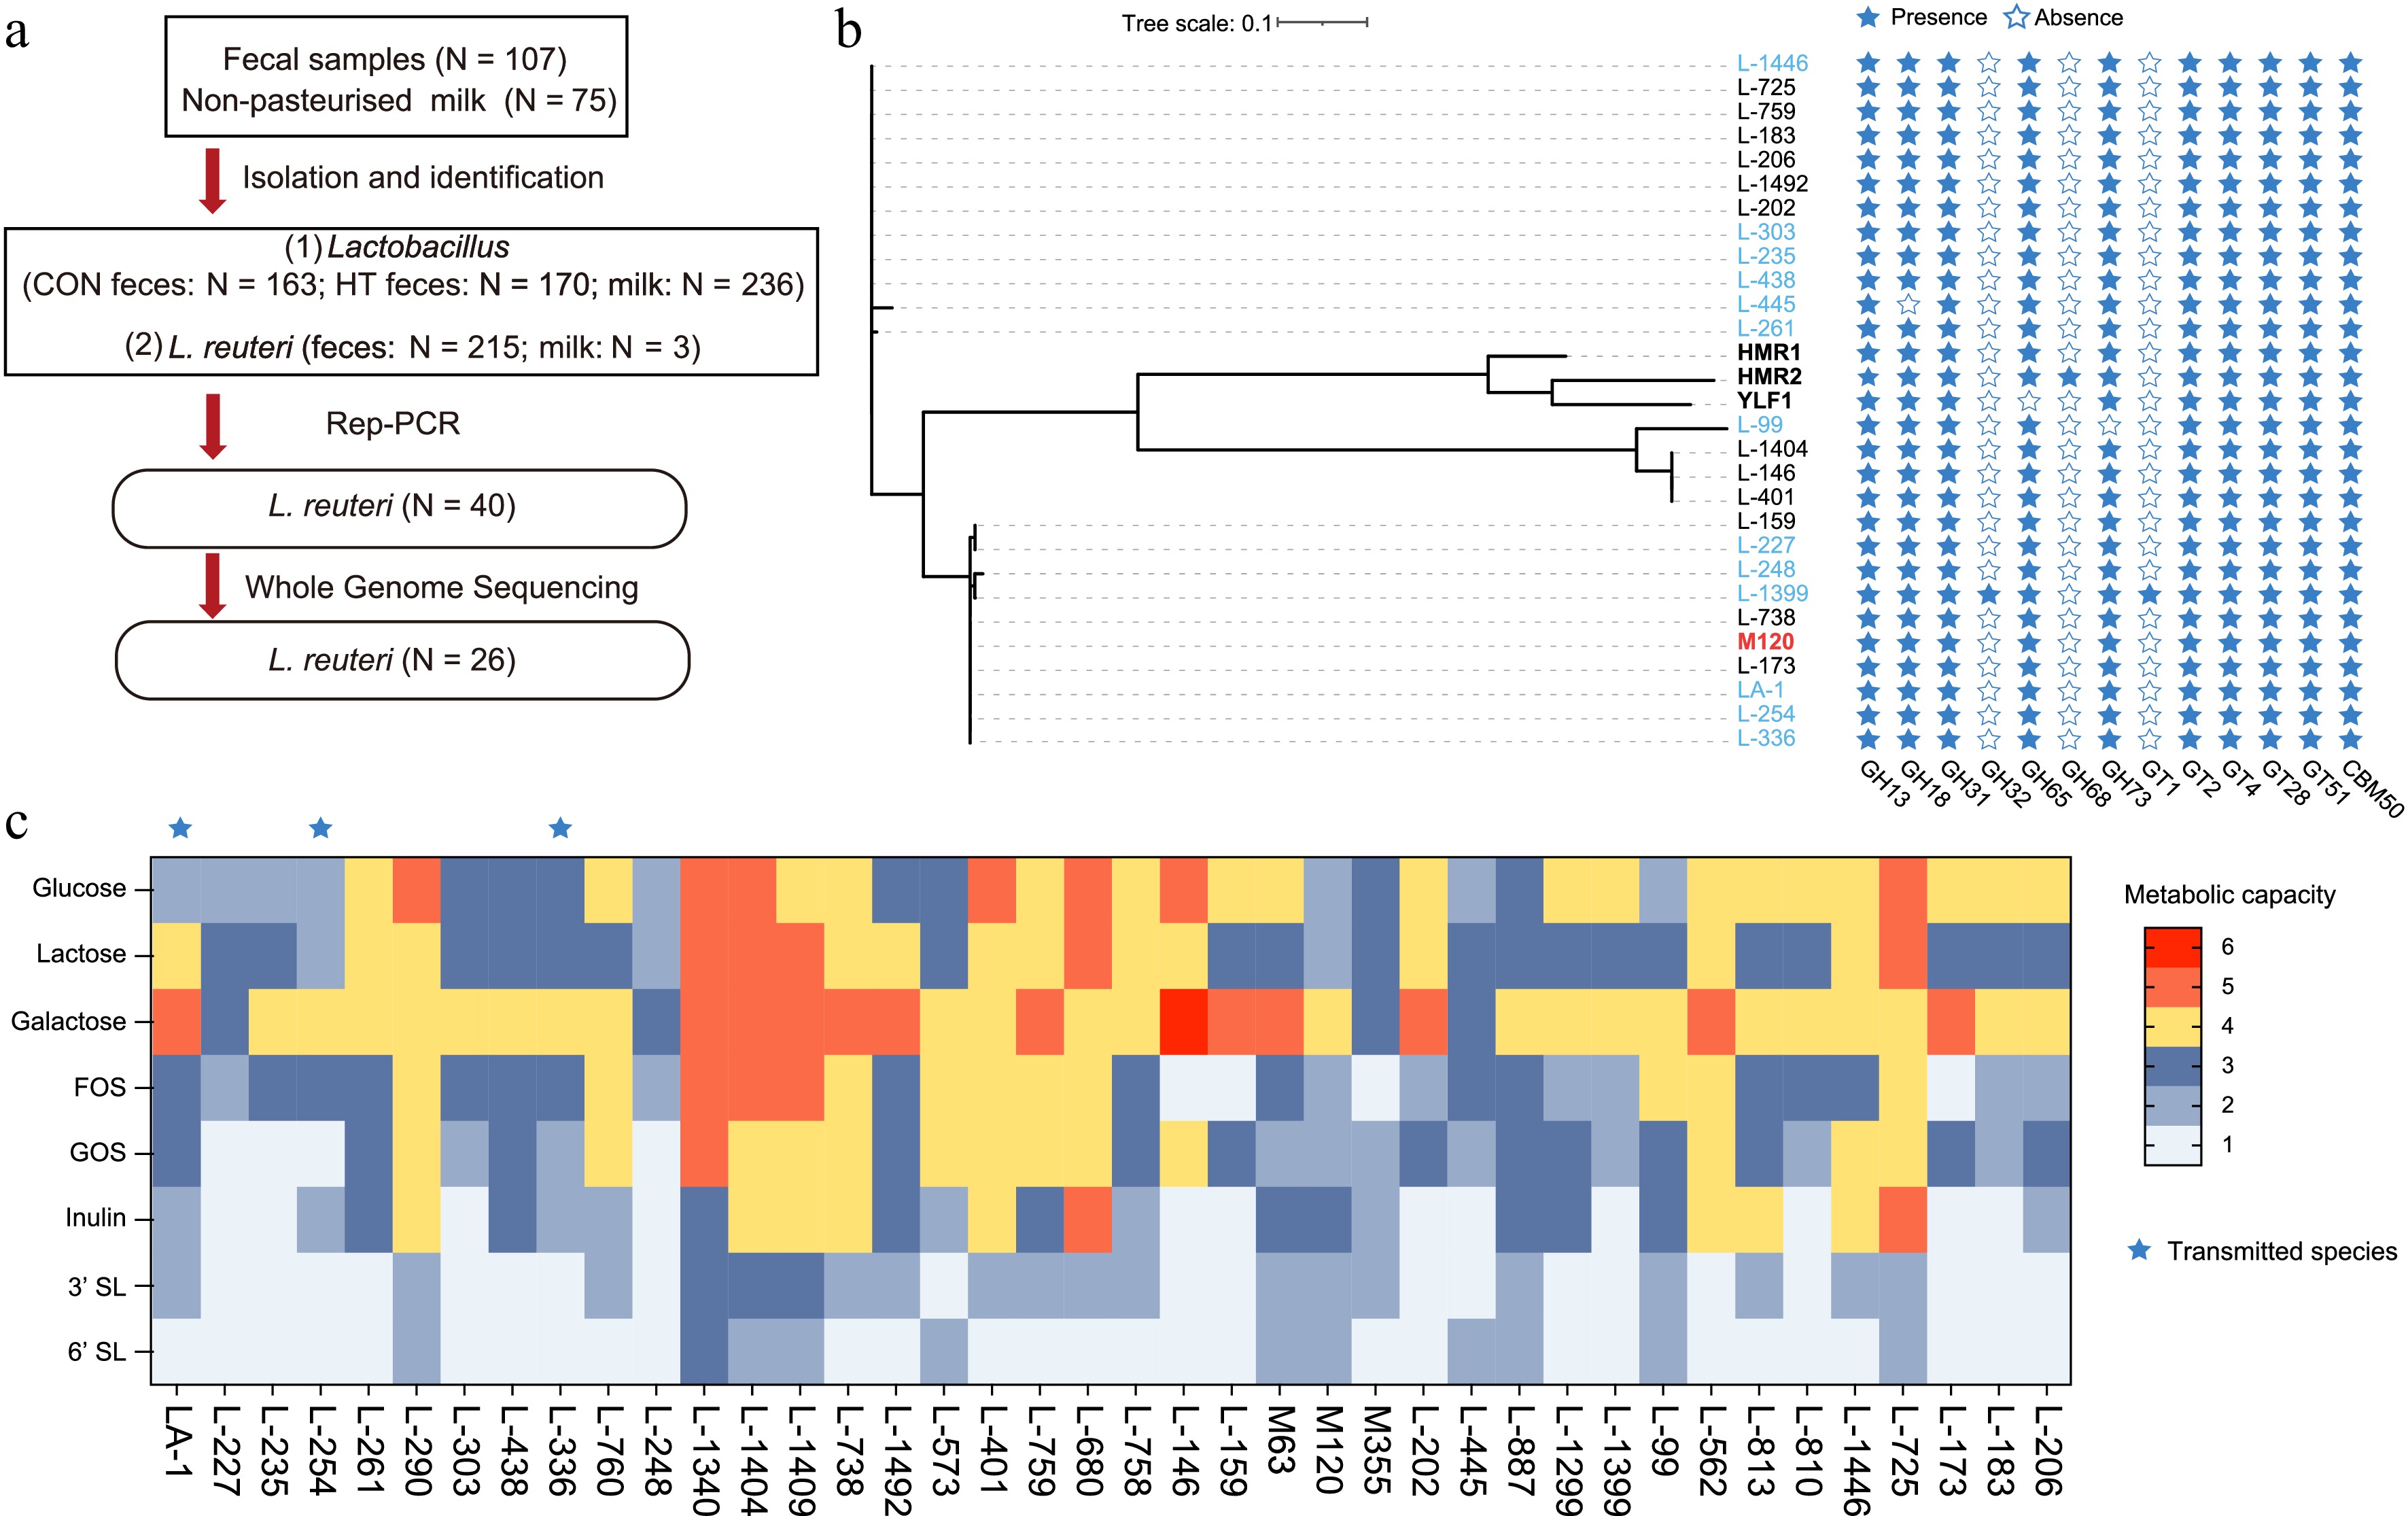
Figure 5.
Results of Lactobacillus isolation and identification. (a) Processes for strain screening and identification. (b) Phylogenetic analysis and the predicted glycosyl hydrolases in L. reuteri. Phylogenetic supertree showing the relationship in 29 L. reuteri strains. HMR1 and HMR2 are human-derived L. reuteri strains. YLF1 is a Yak-derived L. reuteri strain. Strains isolated from milk are marked in red. Strains isolated from CON group feces are marked in blue. Strains isolated from HT group feces are marked in black. (c) The metabolic capacity of L. reuteri for different carbon sources.
Figures
(5)
Tables
(0)