-
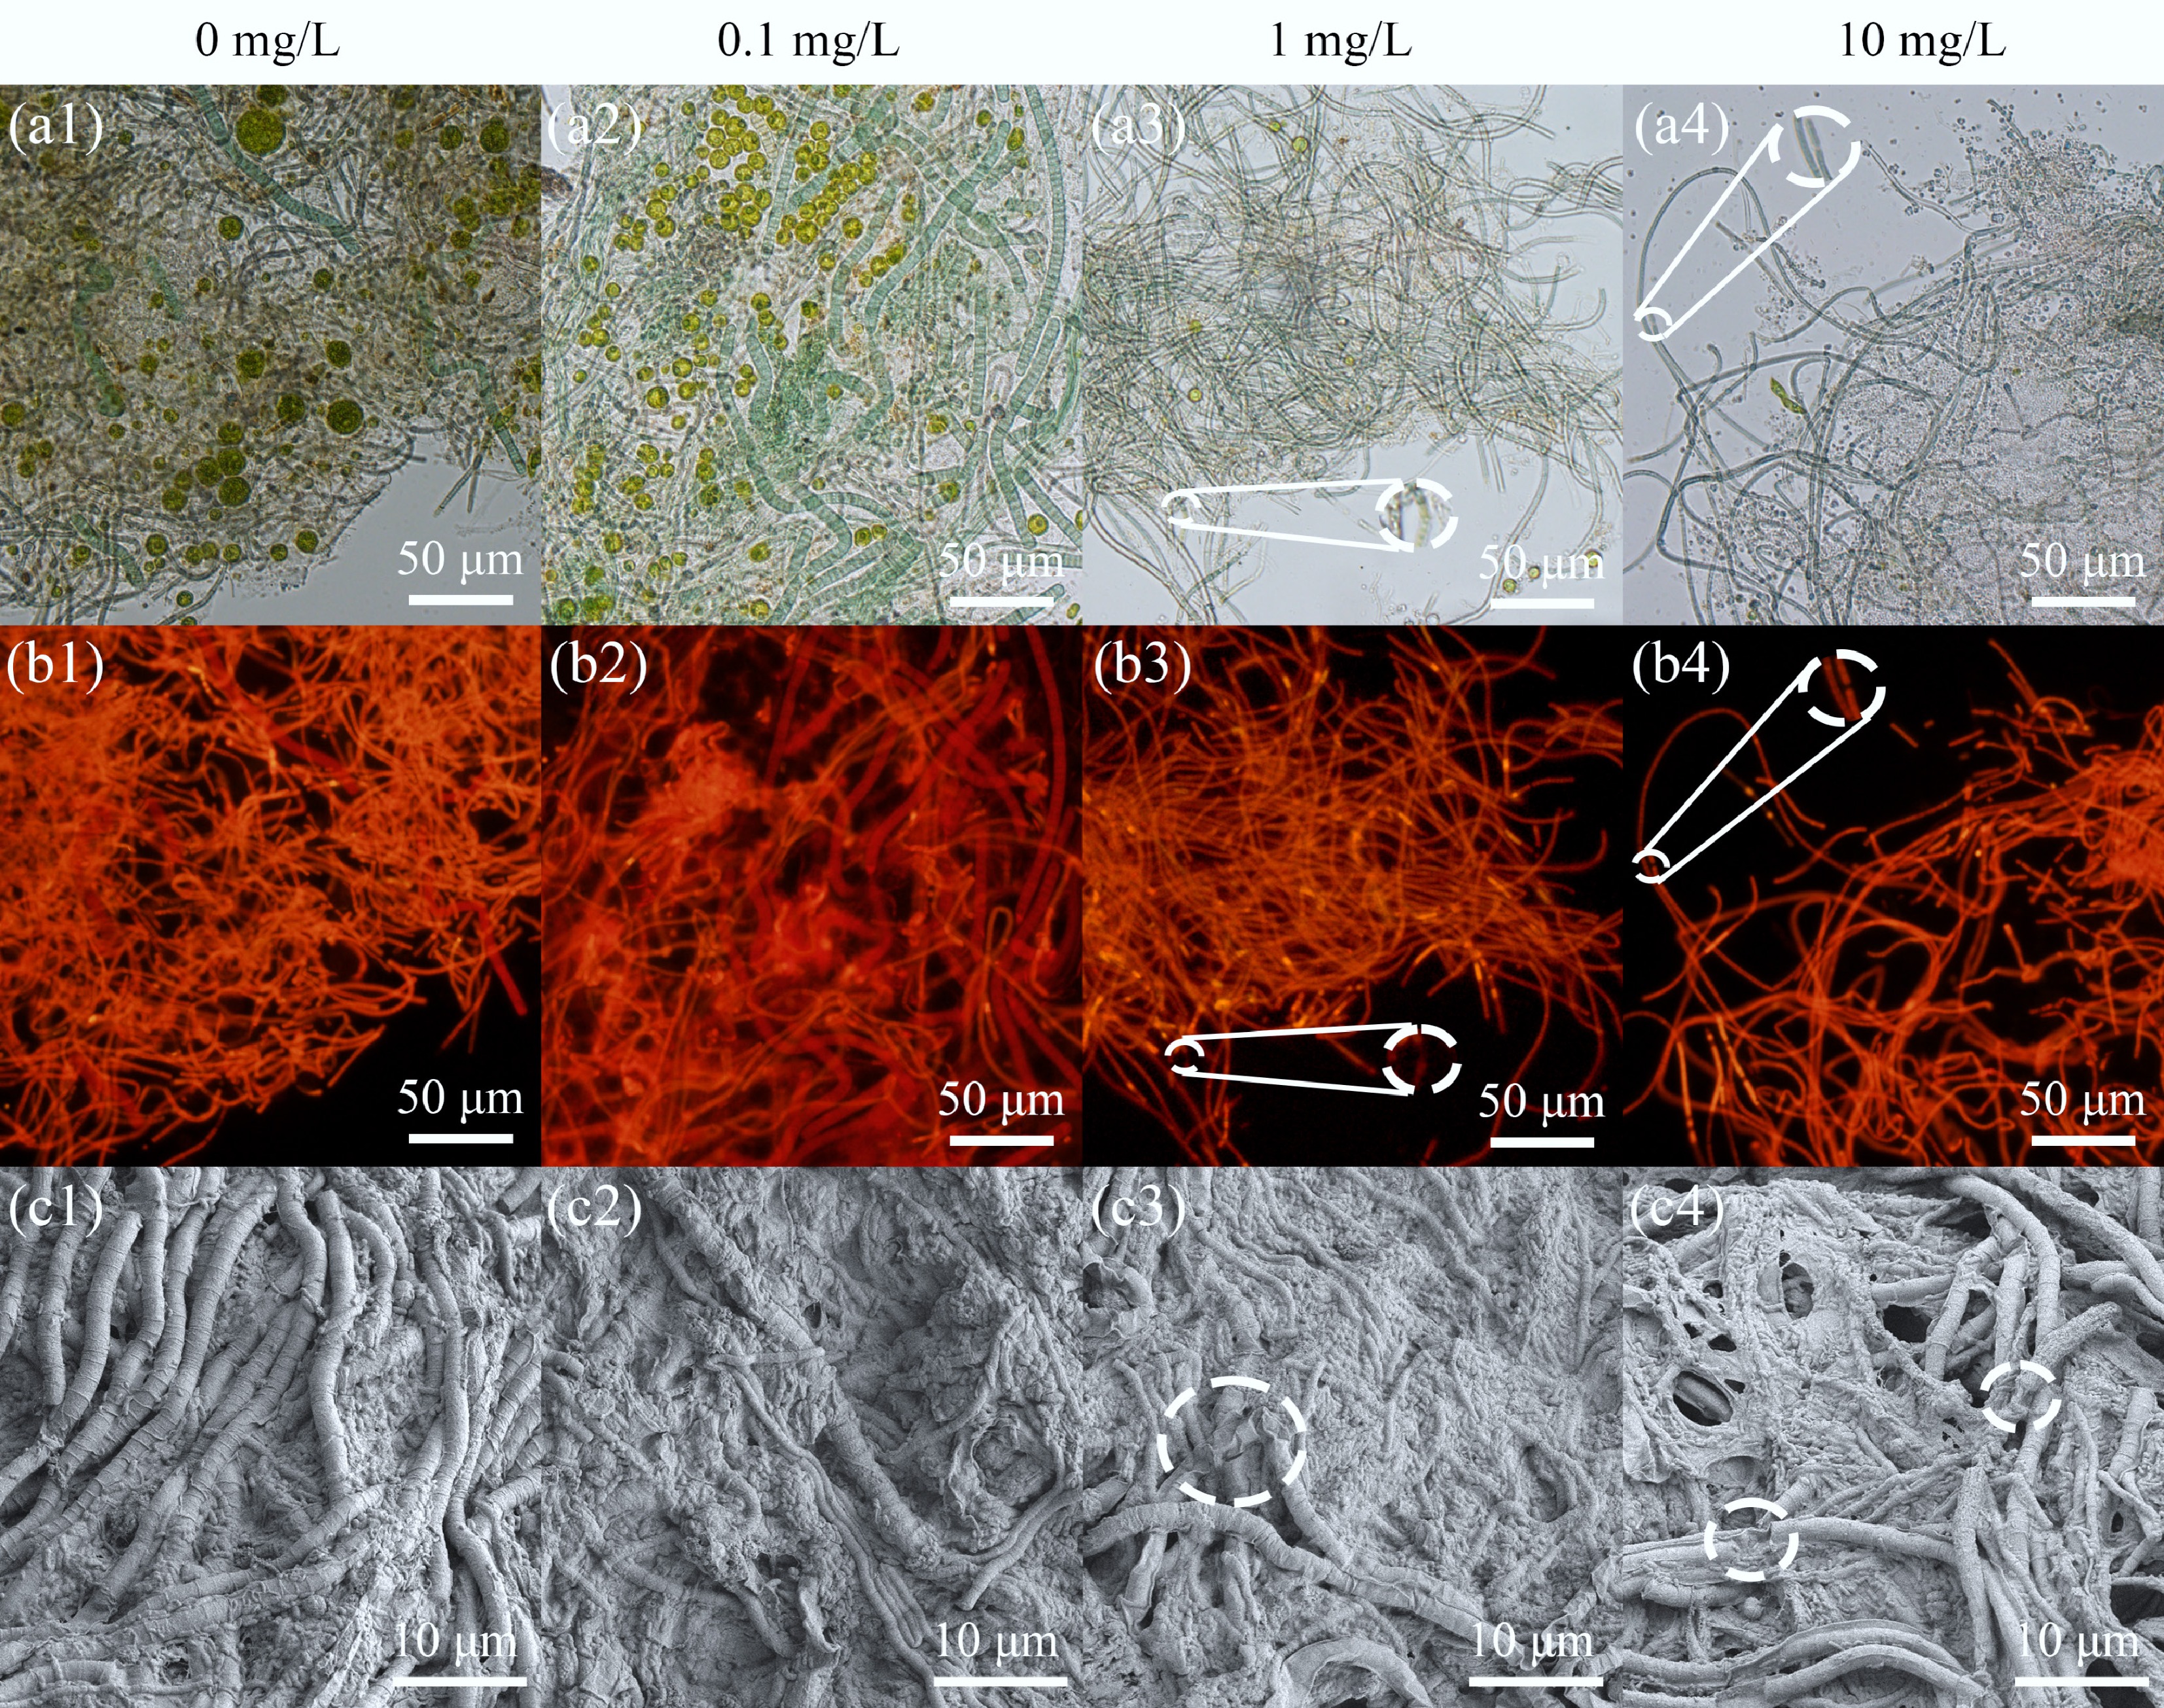
Figure 1.
Microbial morphological characteristics of MBGS under varying estriol (E3) concentrations (0, 0.1, 1, and 10 mg/L). (a) White-light, and (b) red-light micrographs, with red autofluorescence indicating Cyanobacteria. (c) SEM images.
-
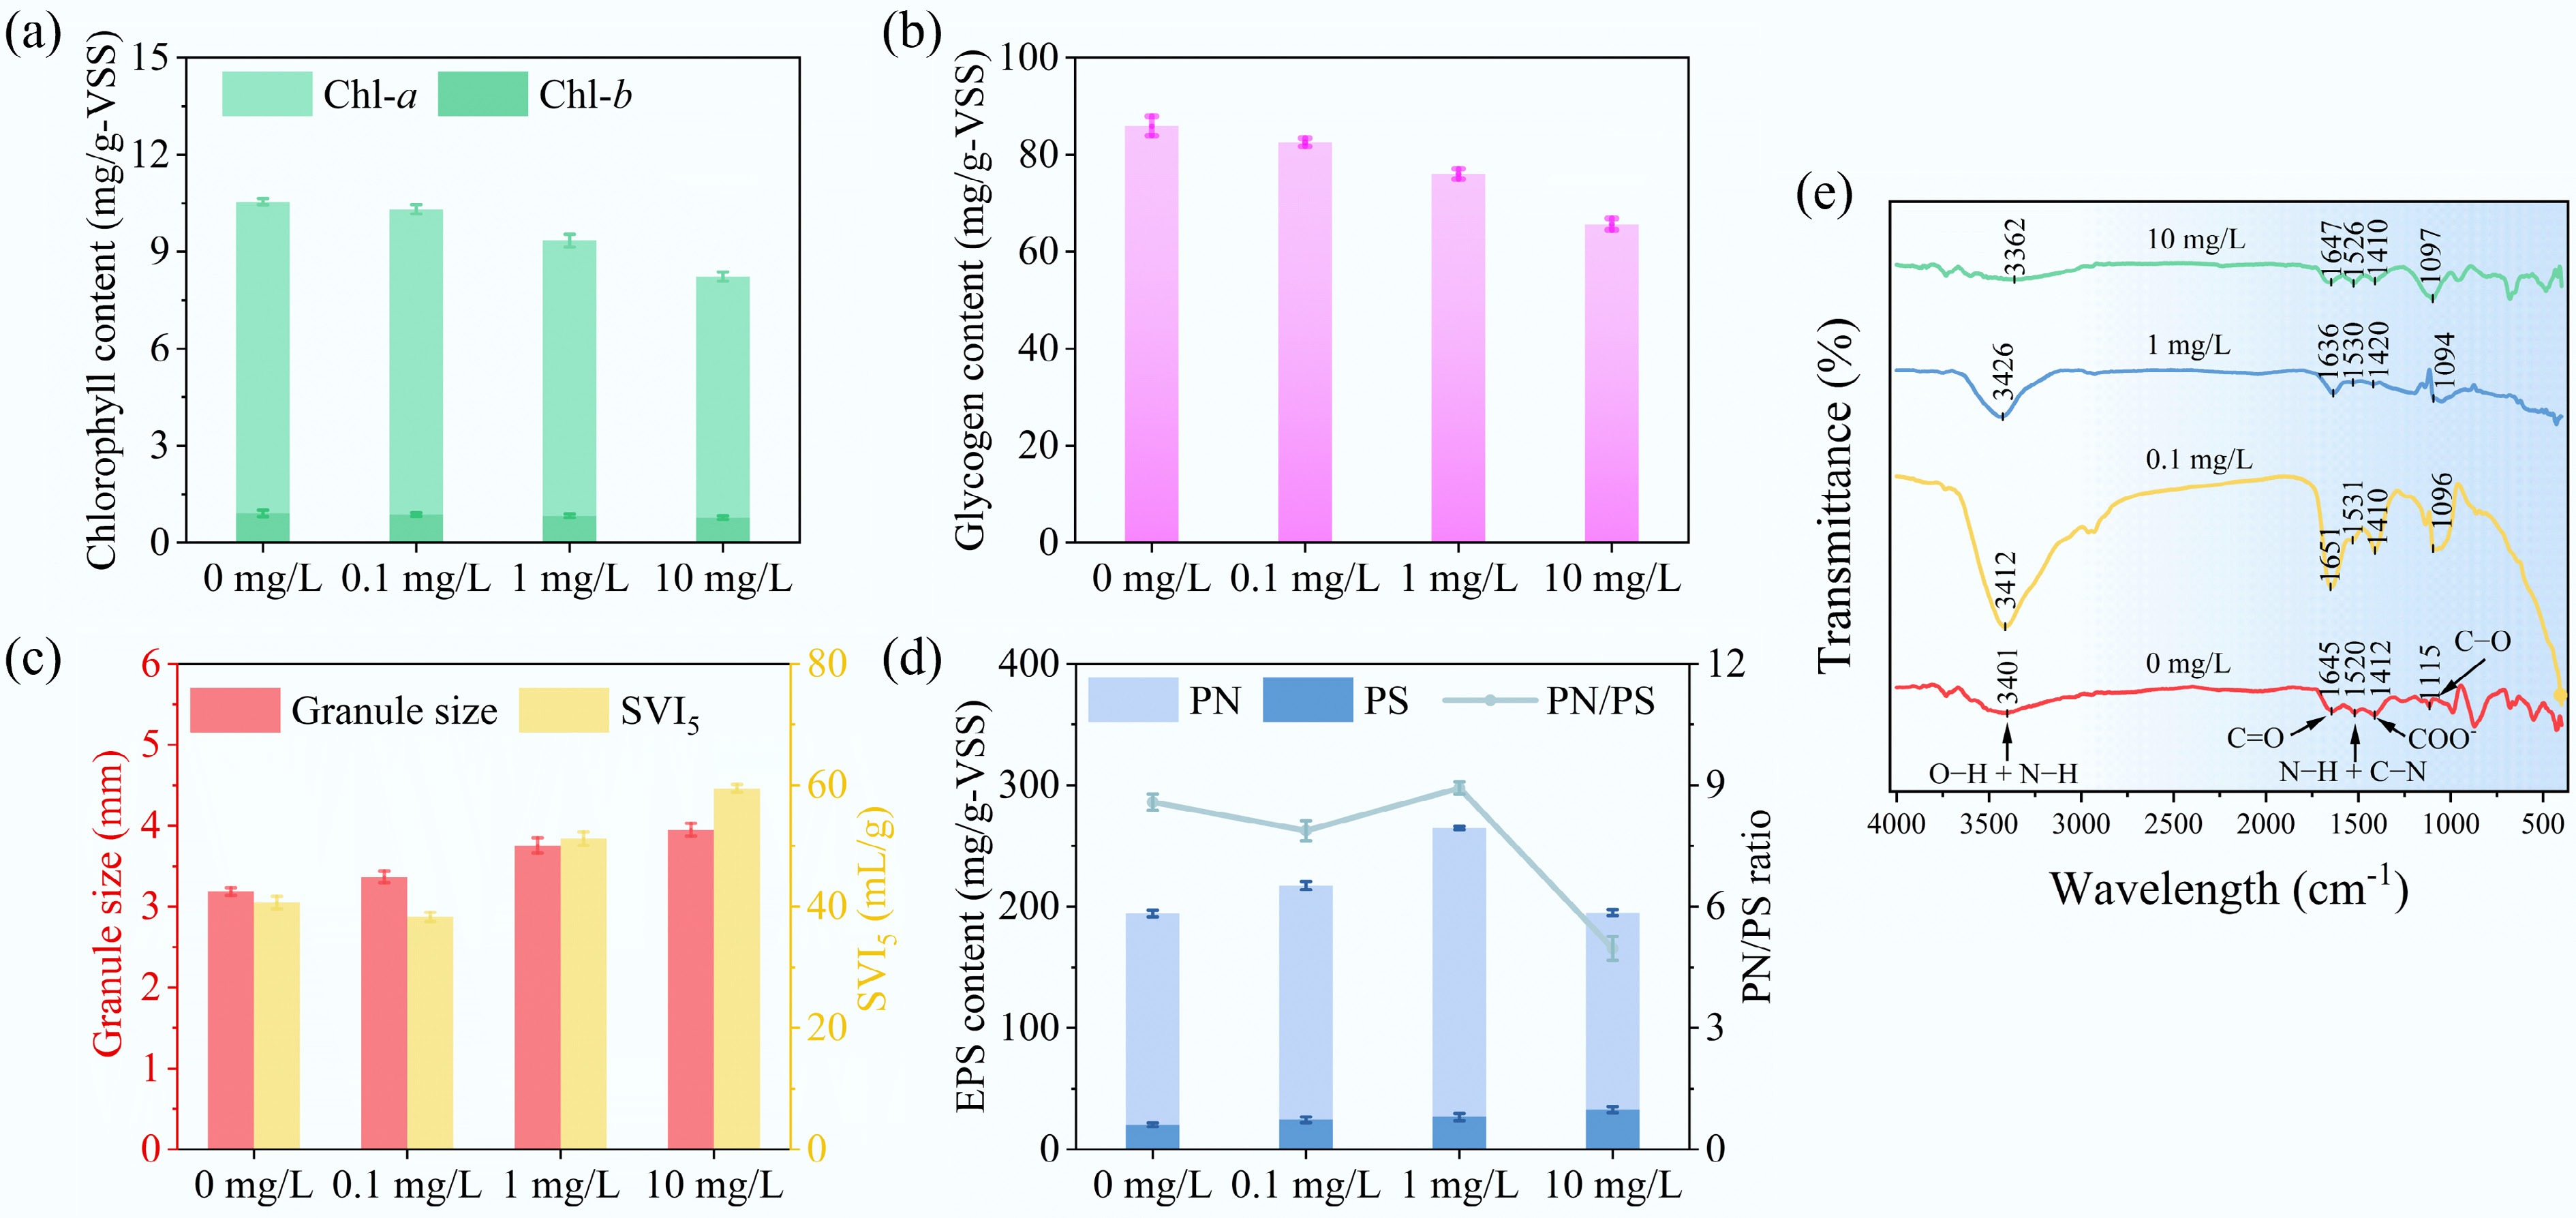
Figure 2.
Physiological and biochemical responses of MBGS to varying estriol (E3) concentrations (0, 0.1, 1, and 10 mg/L). (a) Chl-a and Chl-b contents. (b) Glycogen content. (c) Granule size and SVI5. (d) EPS content and PN/PS ratio. (e) FT-IR spectrum of EPS.
-
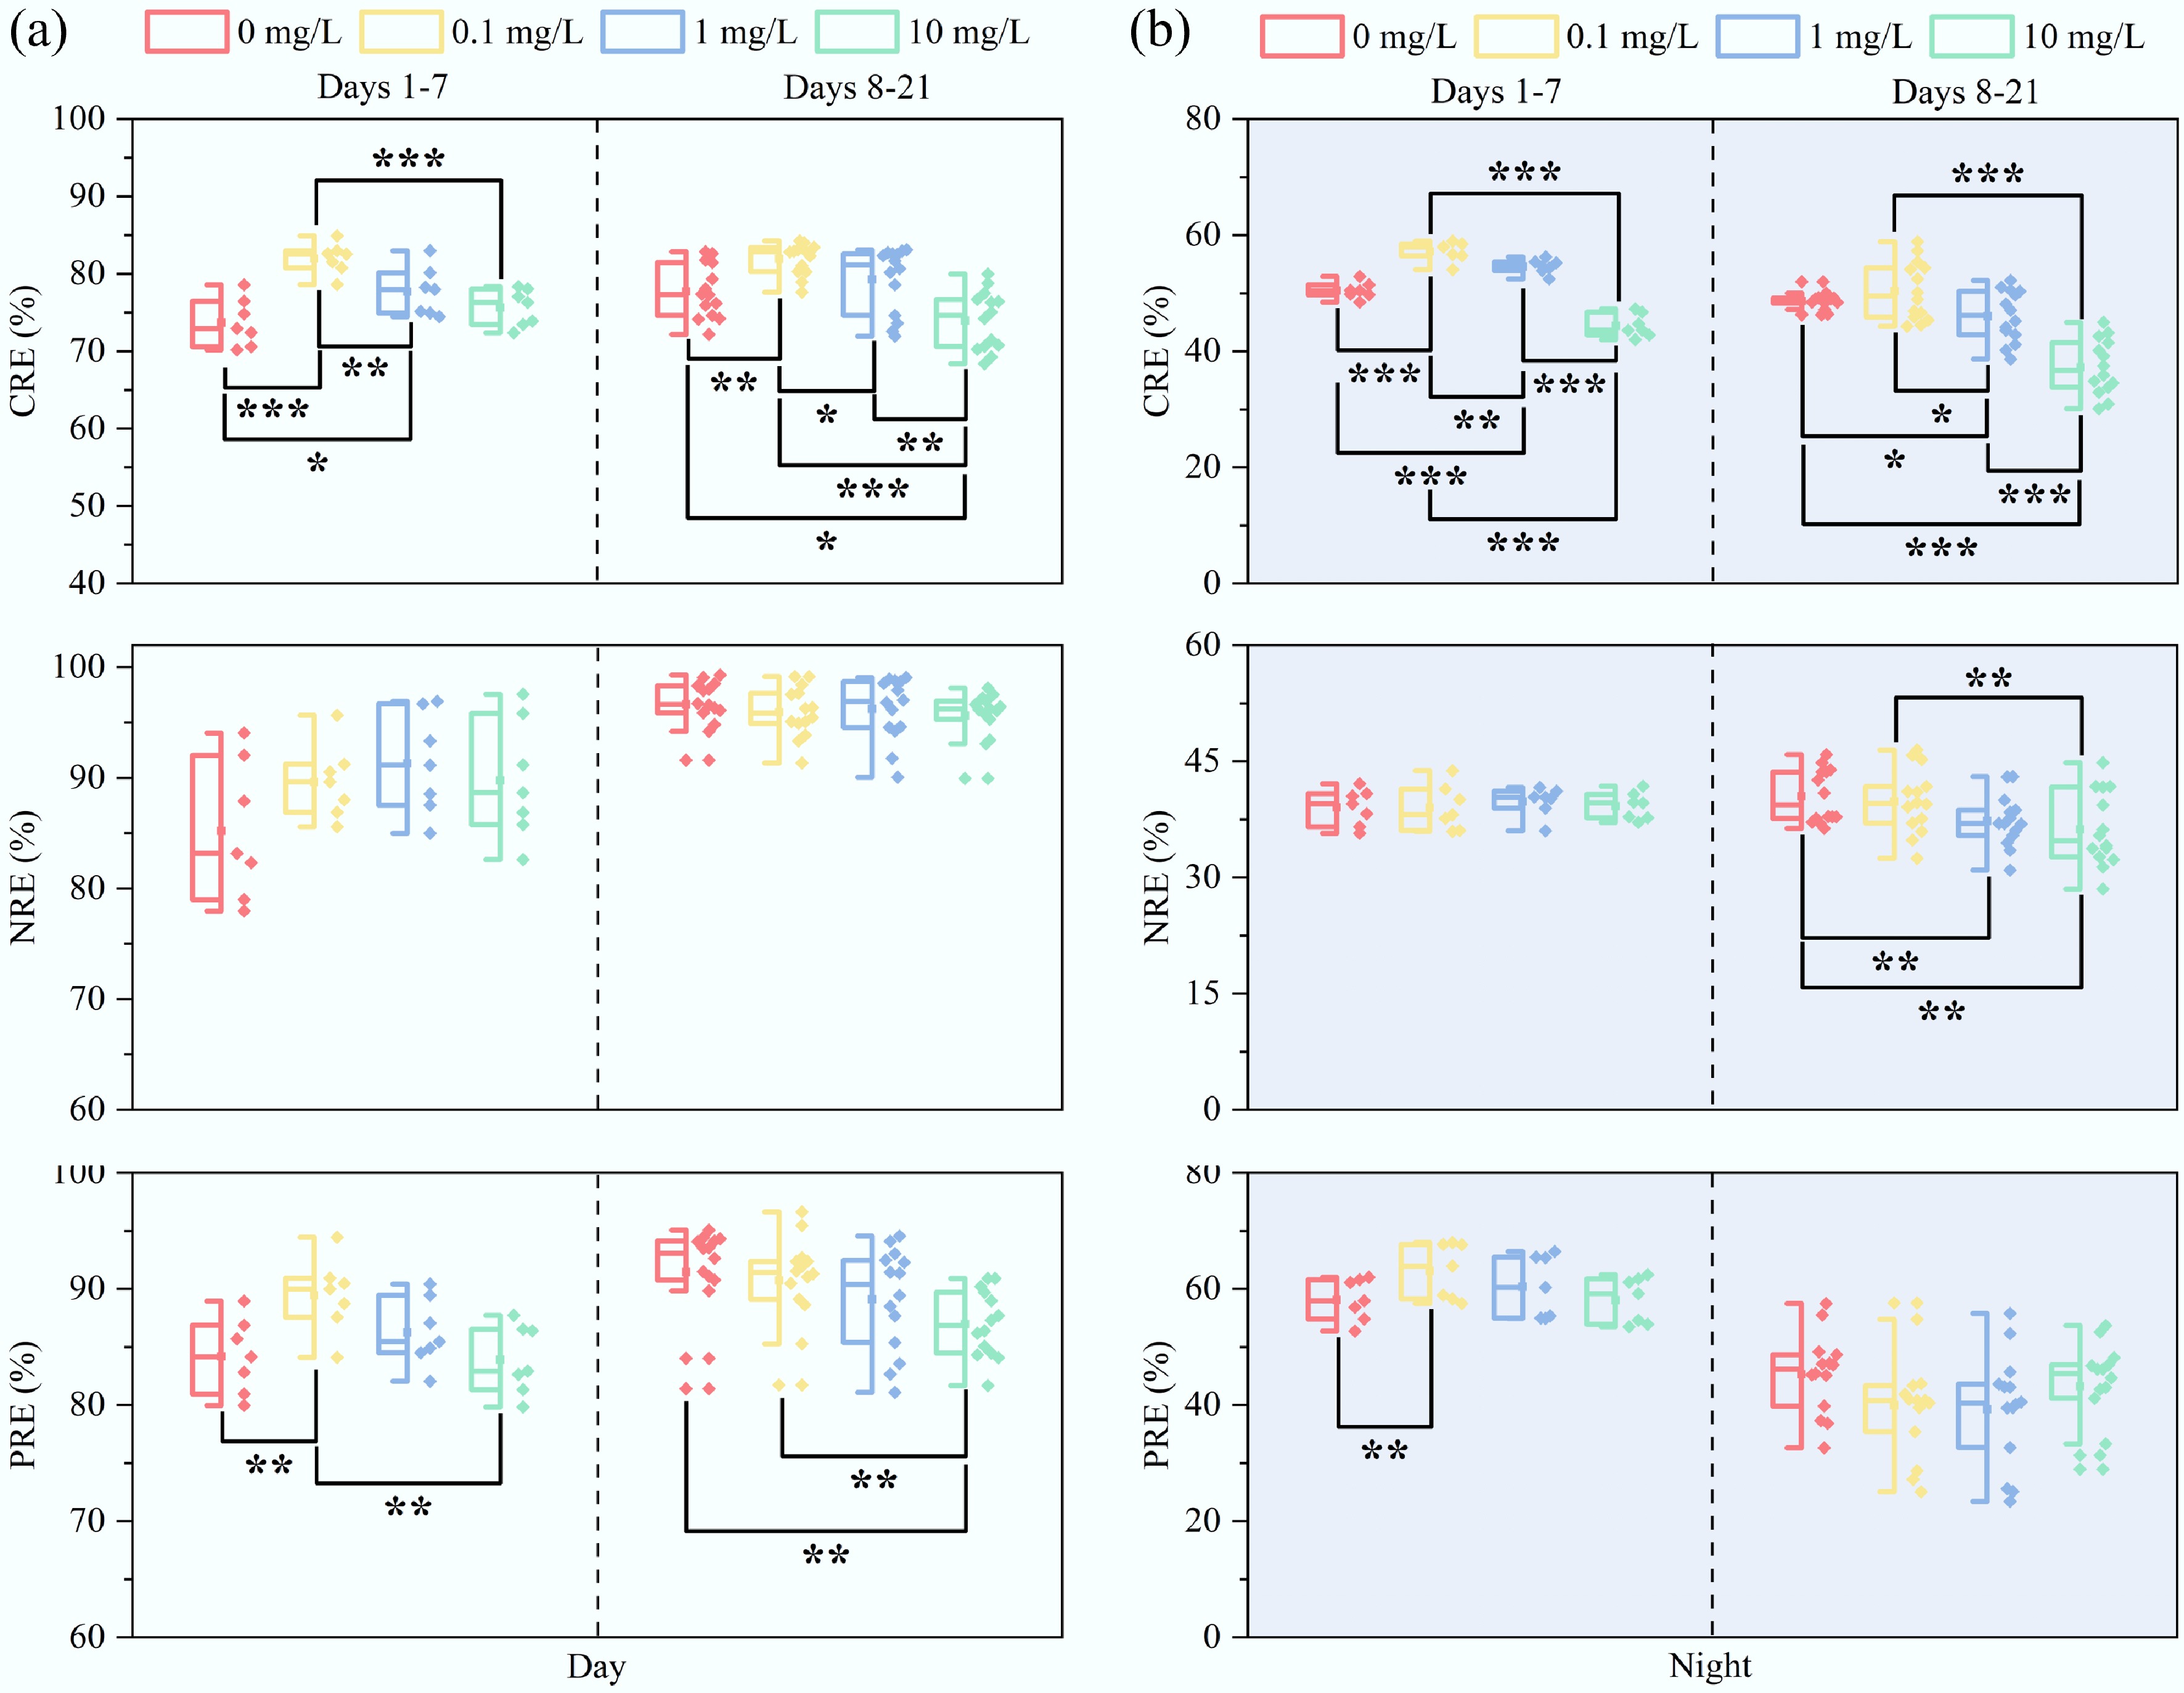
Figure 3.
Diurnal removal performance of pollutant by MBGS under varying estriol (E3) concentrations (0, 0.1, 1, and 10 mg/L). Removal efficiencies (RE) of COD, NH4+-N, and PO43−-P during (a) daytime, and (b) nighttime. n = 7 and 14 for days 1–7, and 8–21, respectively. * p < 0.05, ** p < 0.01, and *** p < 0.001.
-
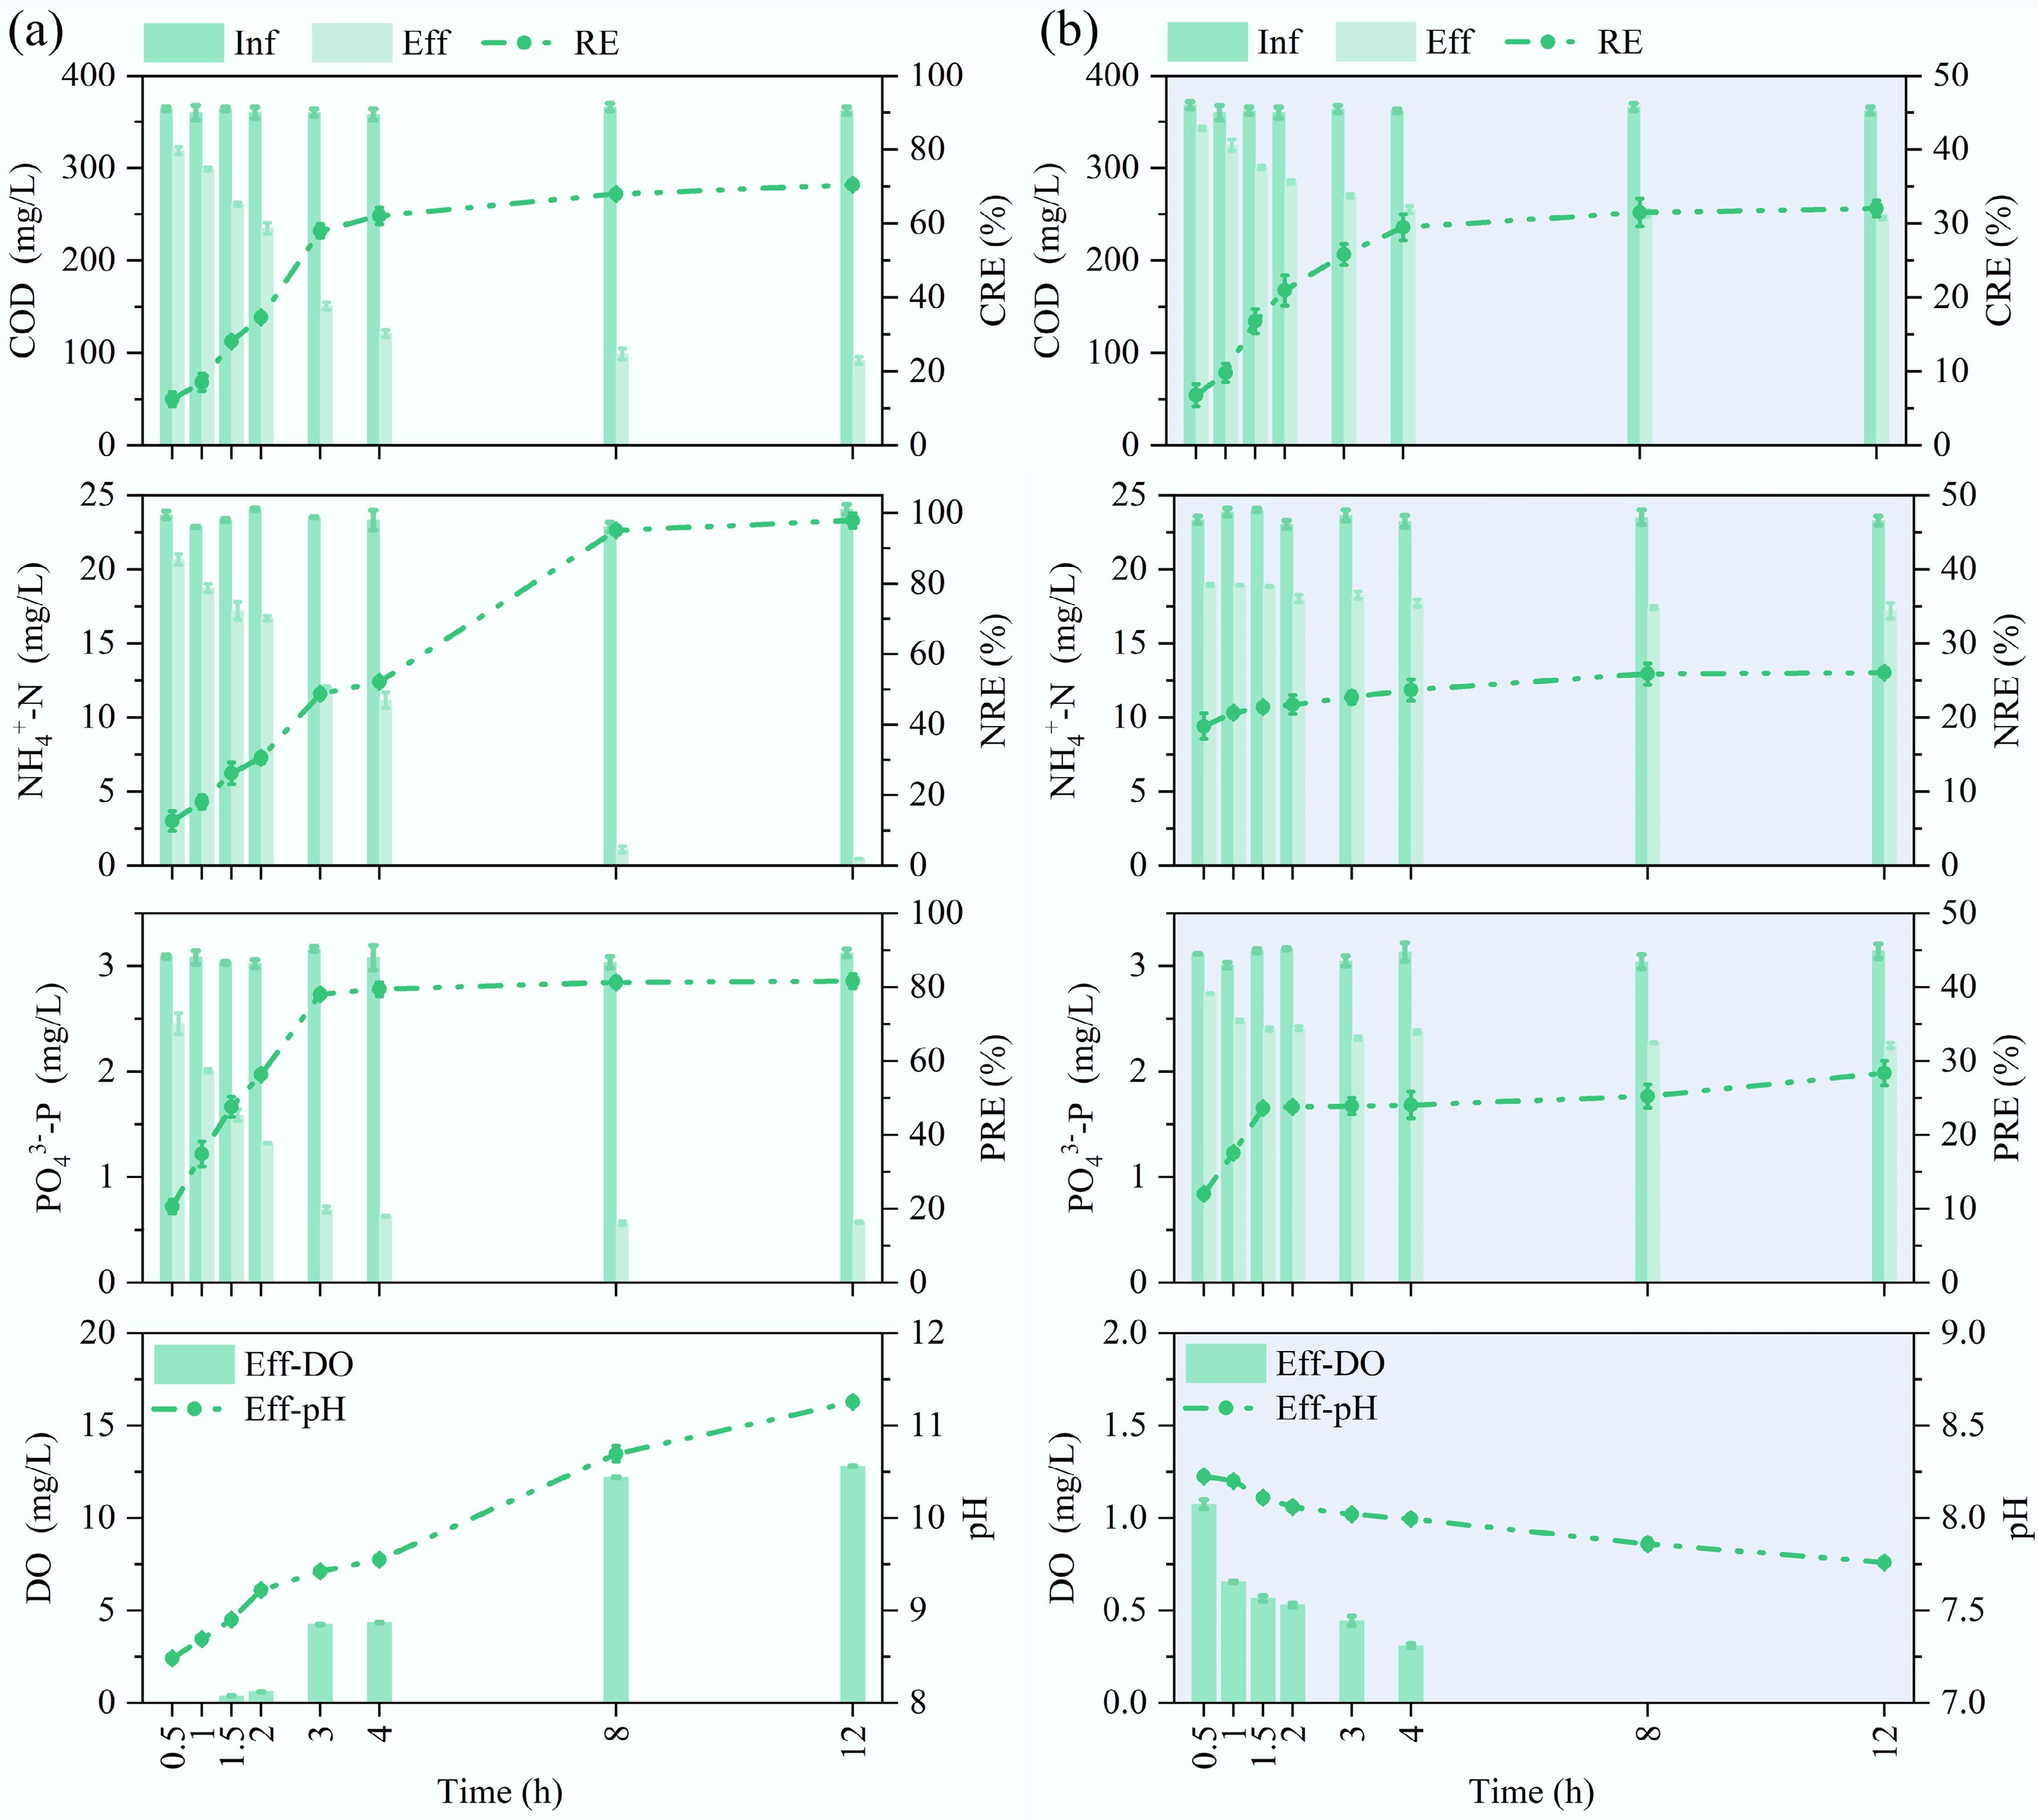
Figure 4.
Batch removal performance of pollutants by MBGS and effluent characteristics at 10 mg/L estriol (E3) addition. Removal efficiencies (RE) of COD, NH4+-N, and PO43−-P, along with effluent DO concentration and pH value, during (a) daytime, and (b) nighttime.
-
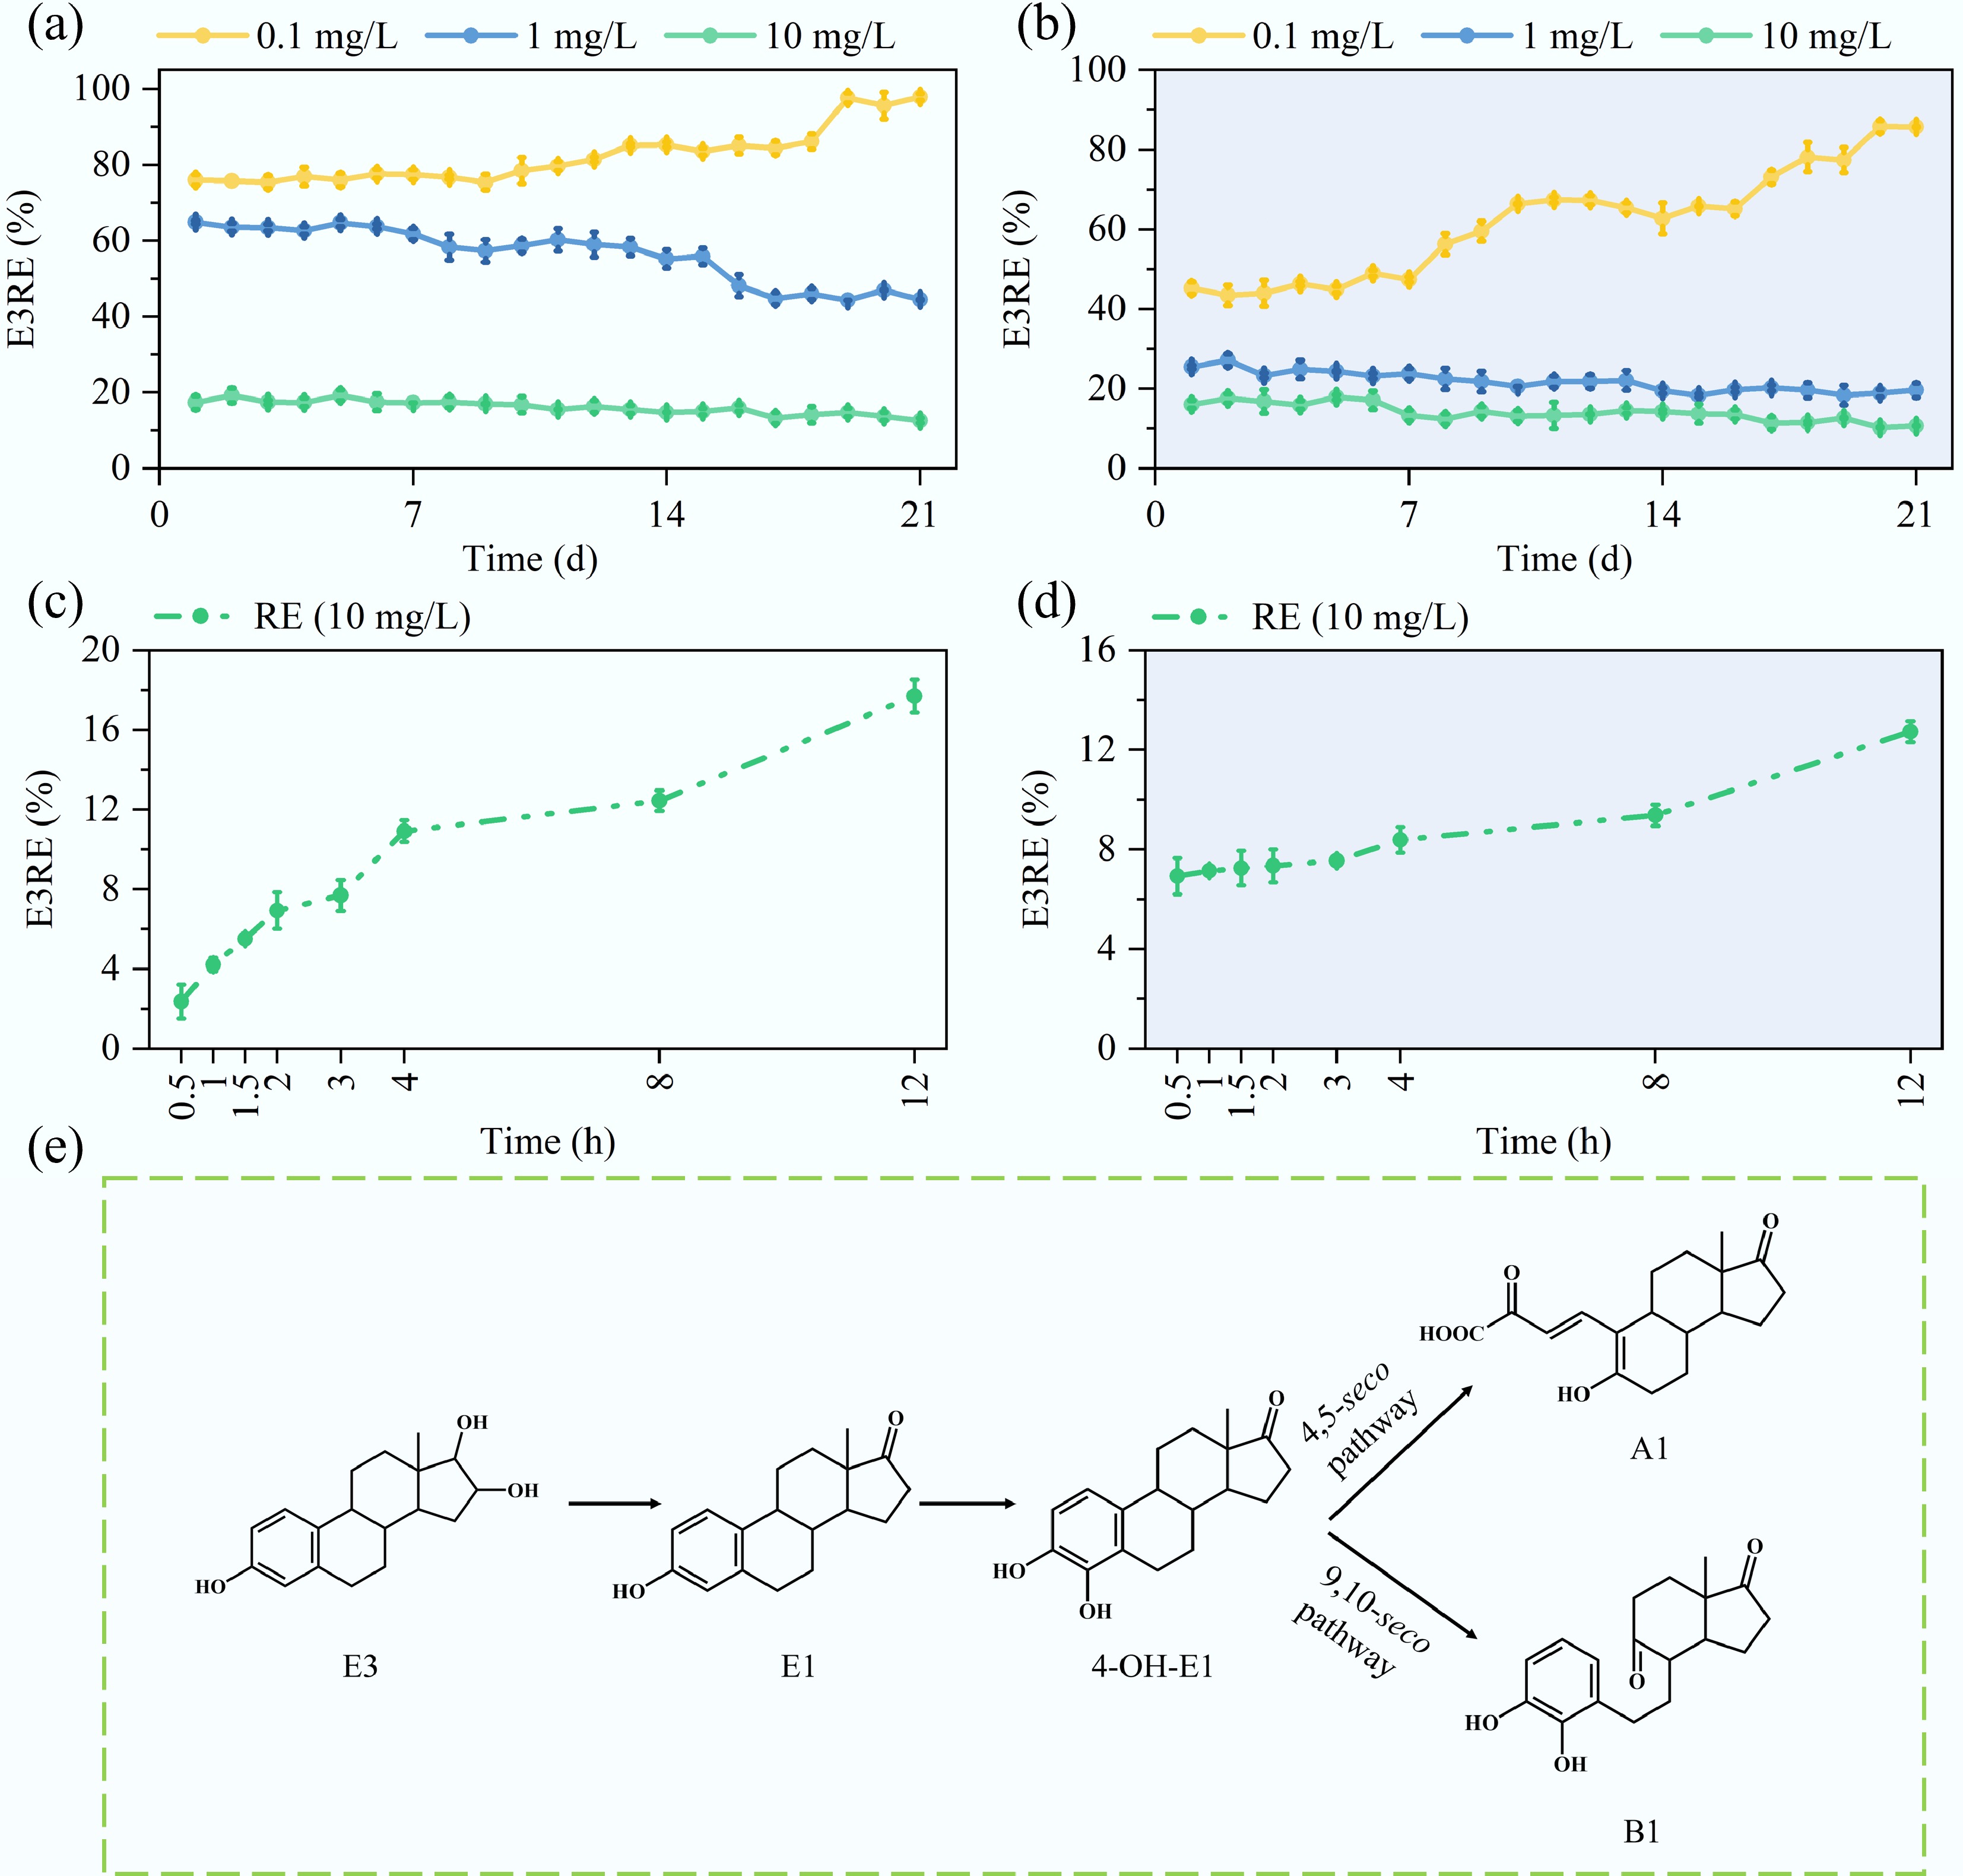
Figure 5.
Diurnal, batch, and metabolic profiling of estriol (E3) removal by MBGS. (a), (b) Daily removal efficiencies (RE) for 0.1, 1, and 10 mg/L E3, and (c), (d) batch removal efficiencies (RE) for 10 mg/L E3 during daytime and nighttime. (e) Proposed metabolic pathways.
-
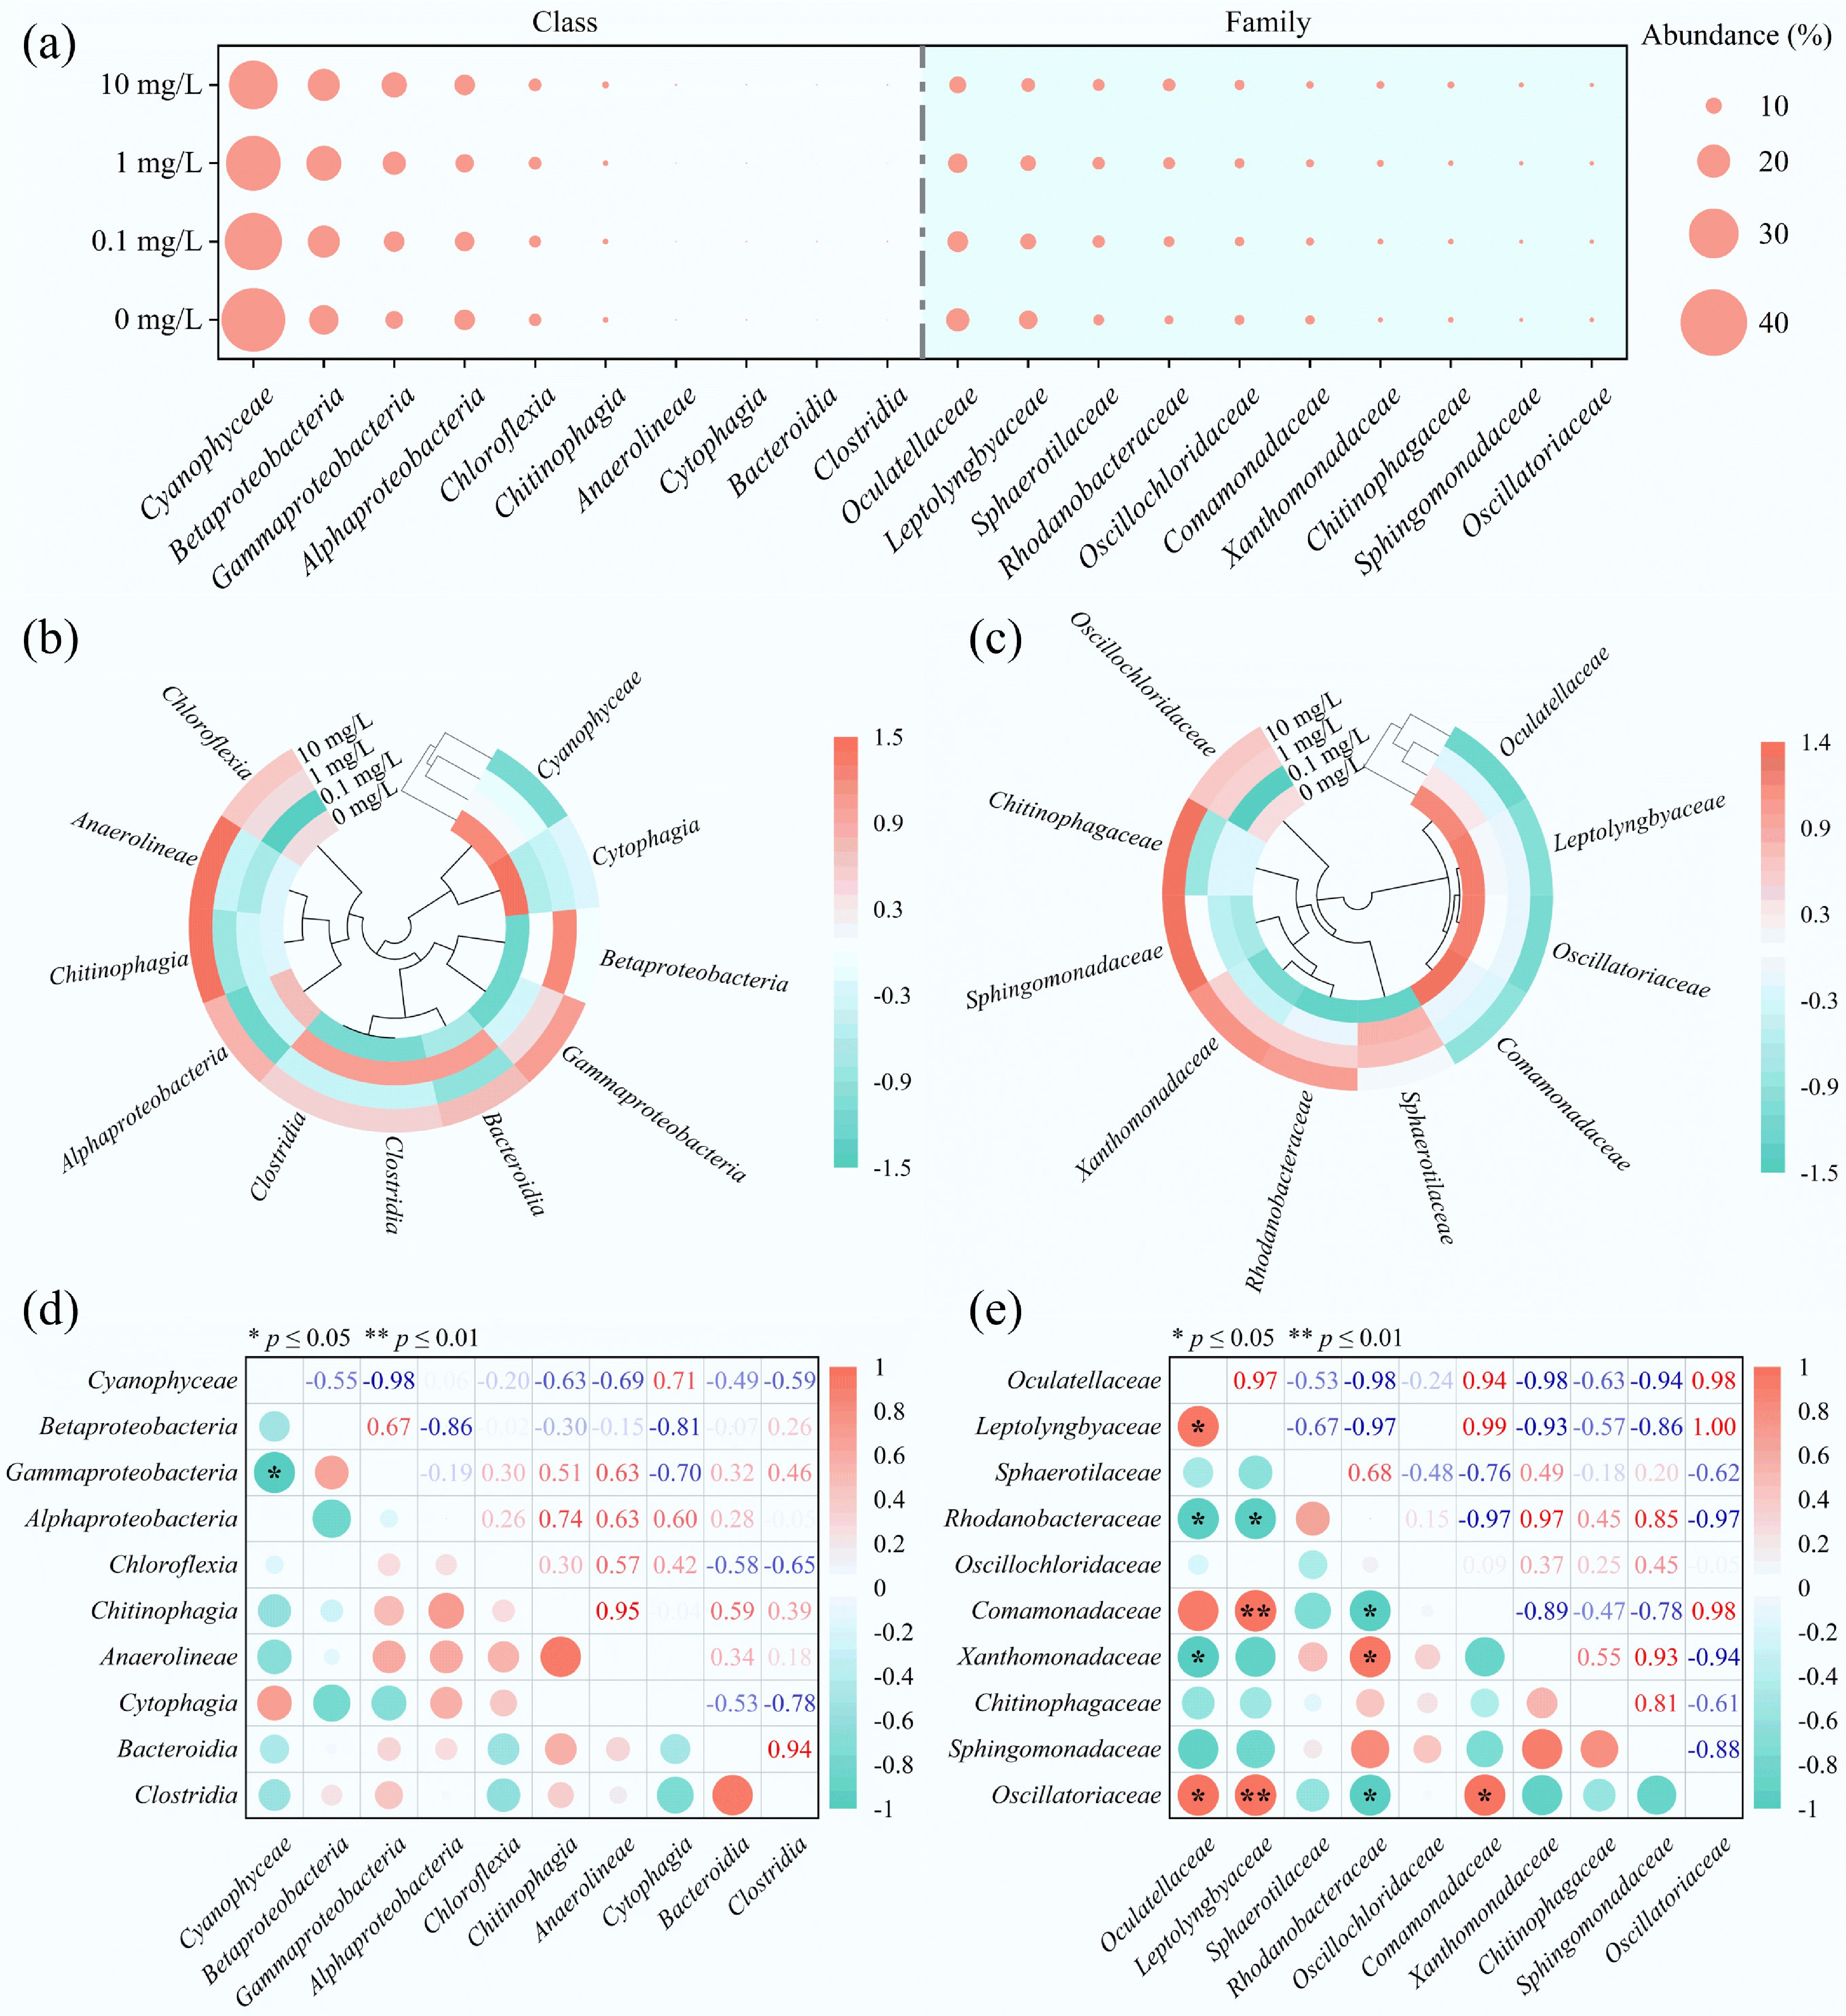
Figure 6.
Microbial community composition of the MBGS under varying estriol (E3) concentrations at class and family levels. (a) Relative abundance bubble plot, with circle size indicating abundance. (b), (c) Clustering heat maps, color intensity reflecting abundance changes. (d), (e) Correlation plots, with red and green denoting positive and negative correlations, respectively.
-
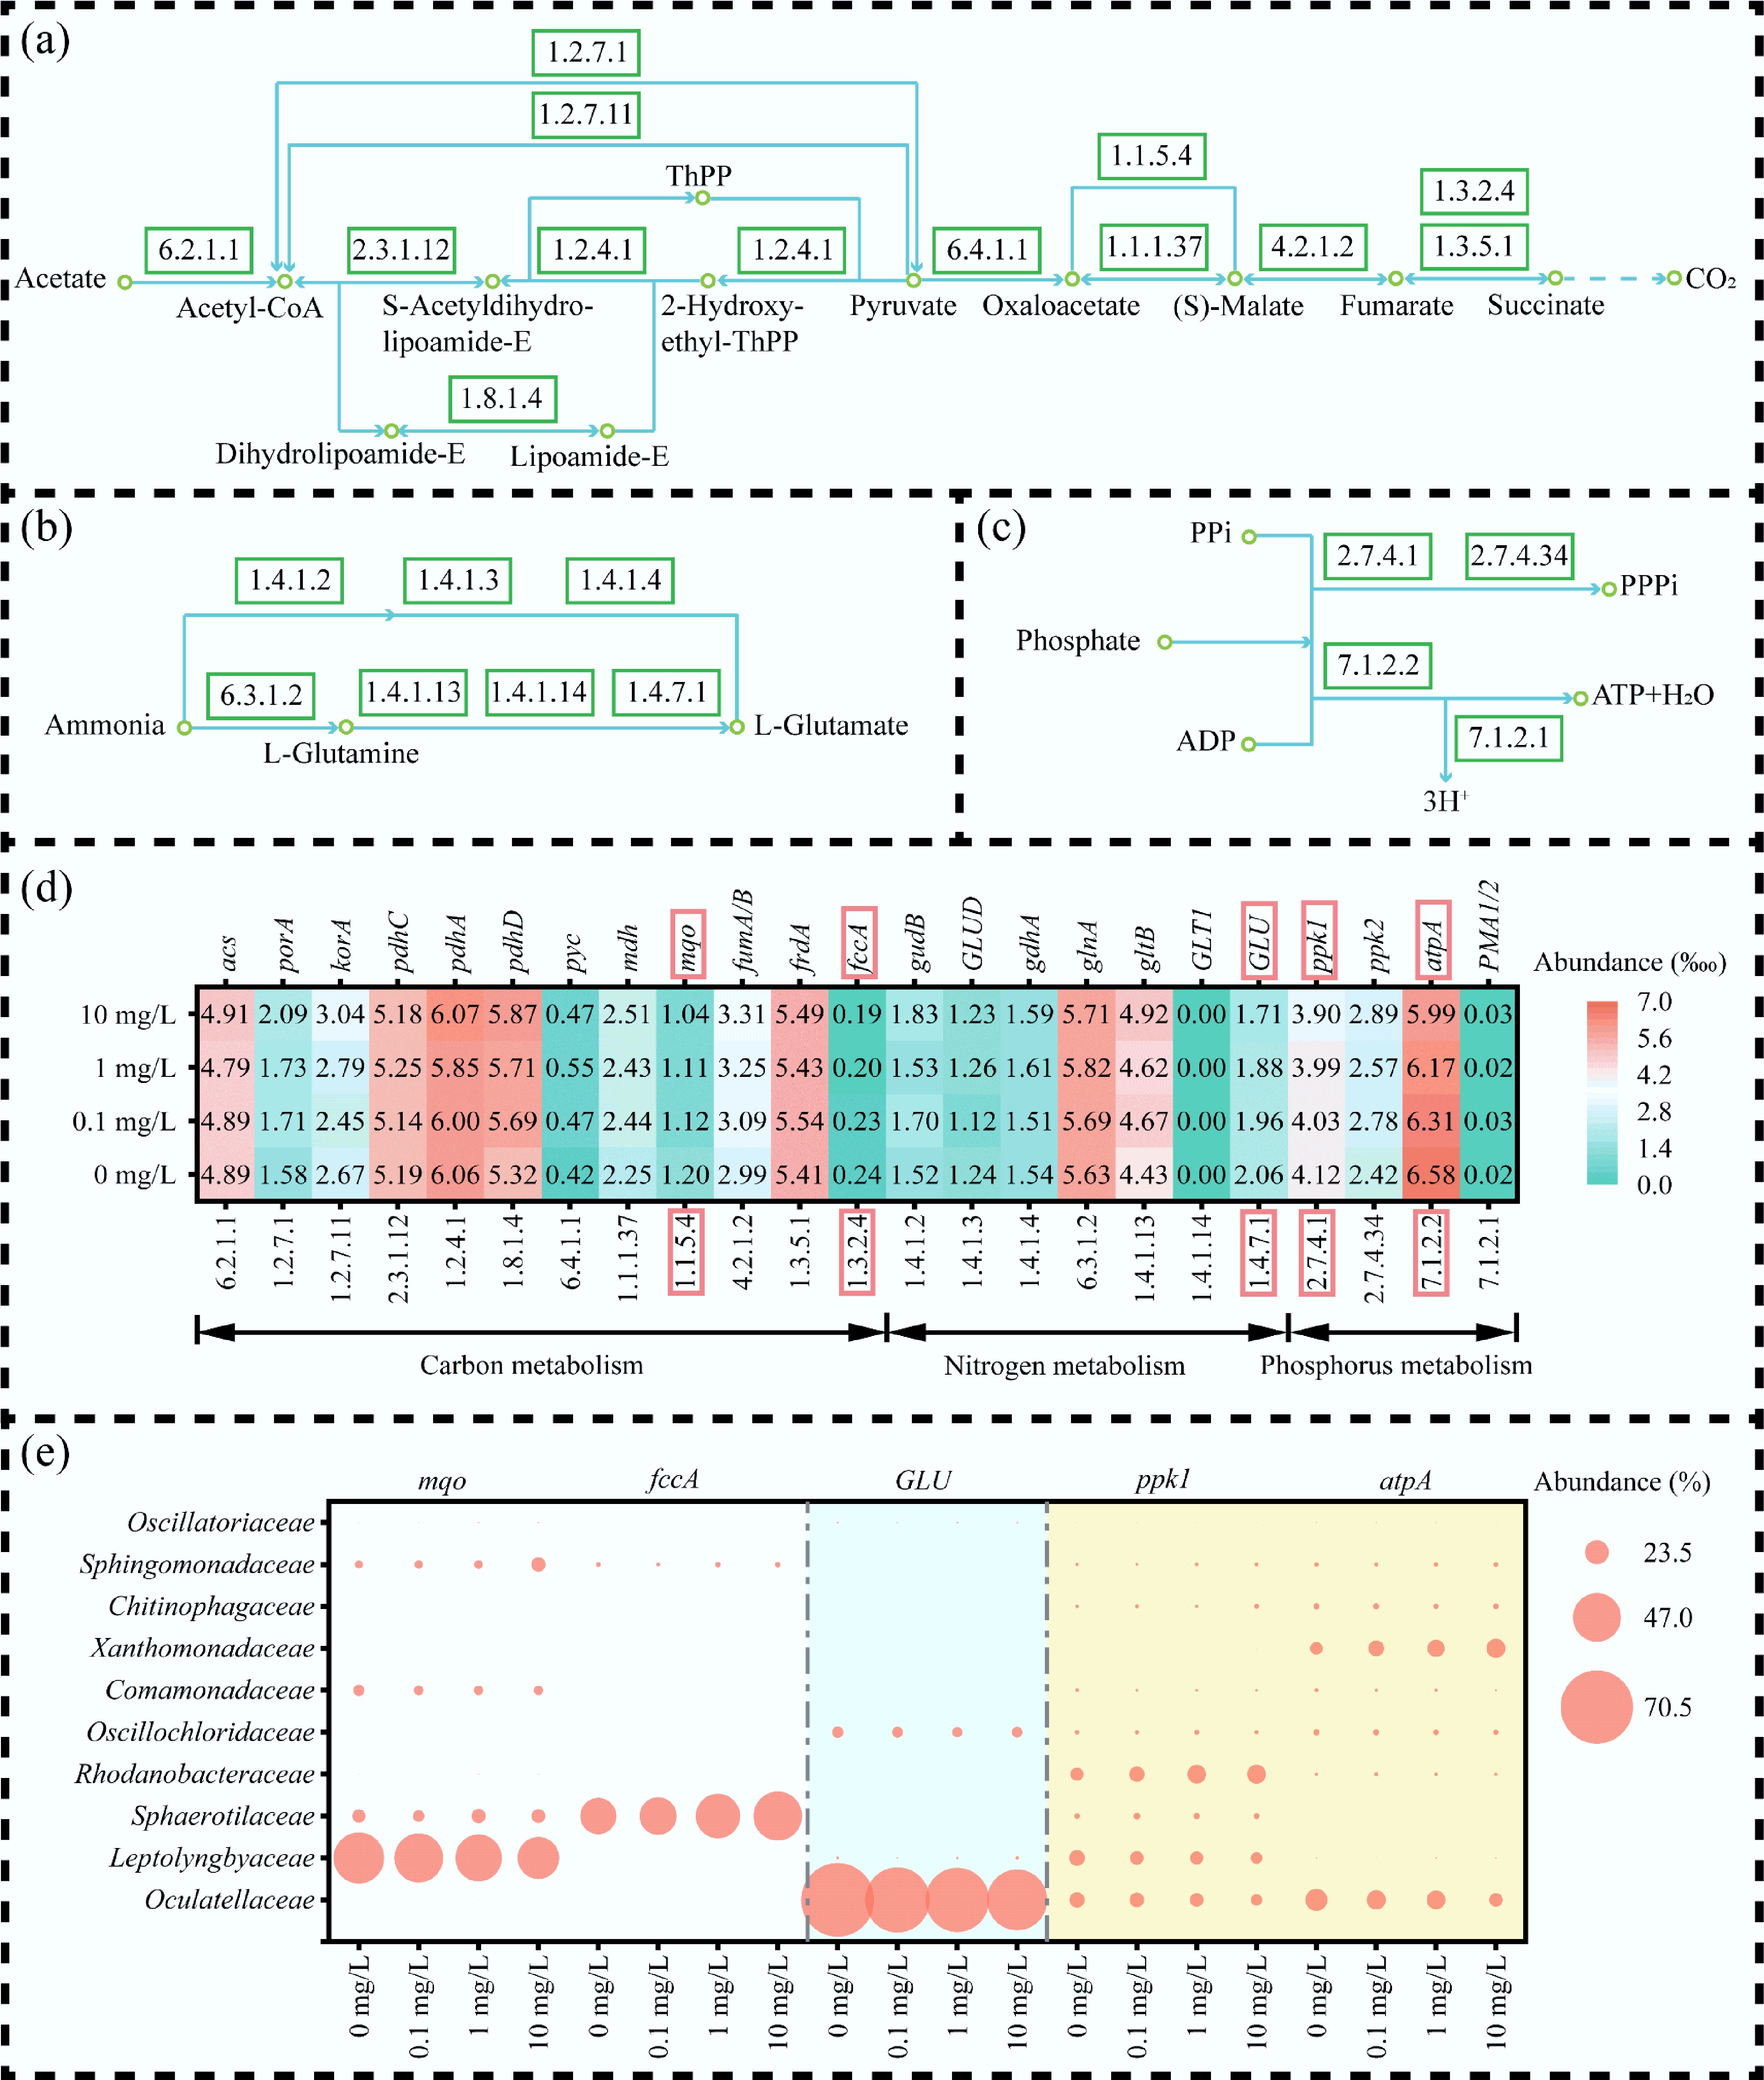
Figure 7.
Functional metabolic response of MBGS to varying estriol (E3) concentrations across carbon, nitrogen, and phosphate pathways. (a)–(c) Metabolic pathways of carbon, nitrogen, and phosphorus, respectively. (d) Relative abundance (‱) of key functional genes, with color intensity indicating abundance level. (e) Microbial contribution (%) to functional gene, with circle size indicating contribution.
-
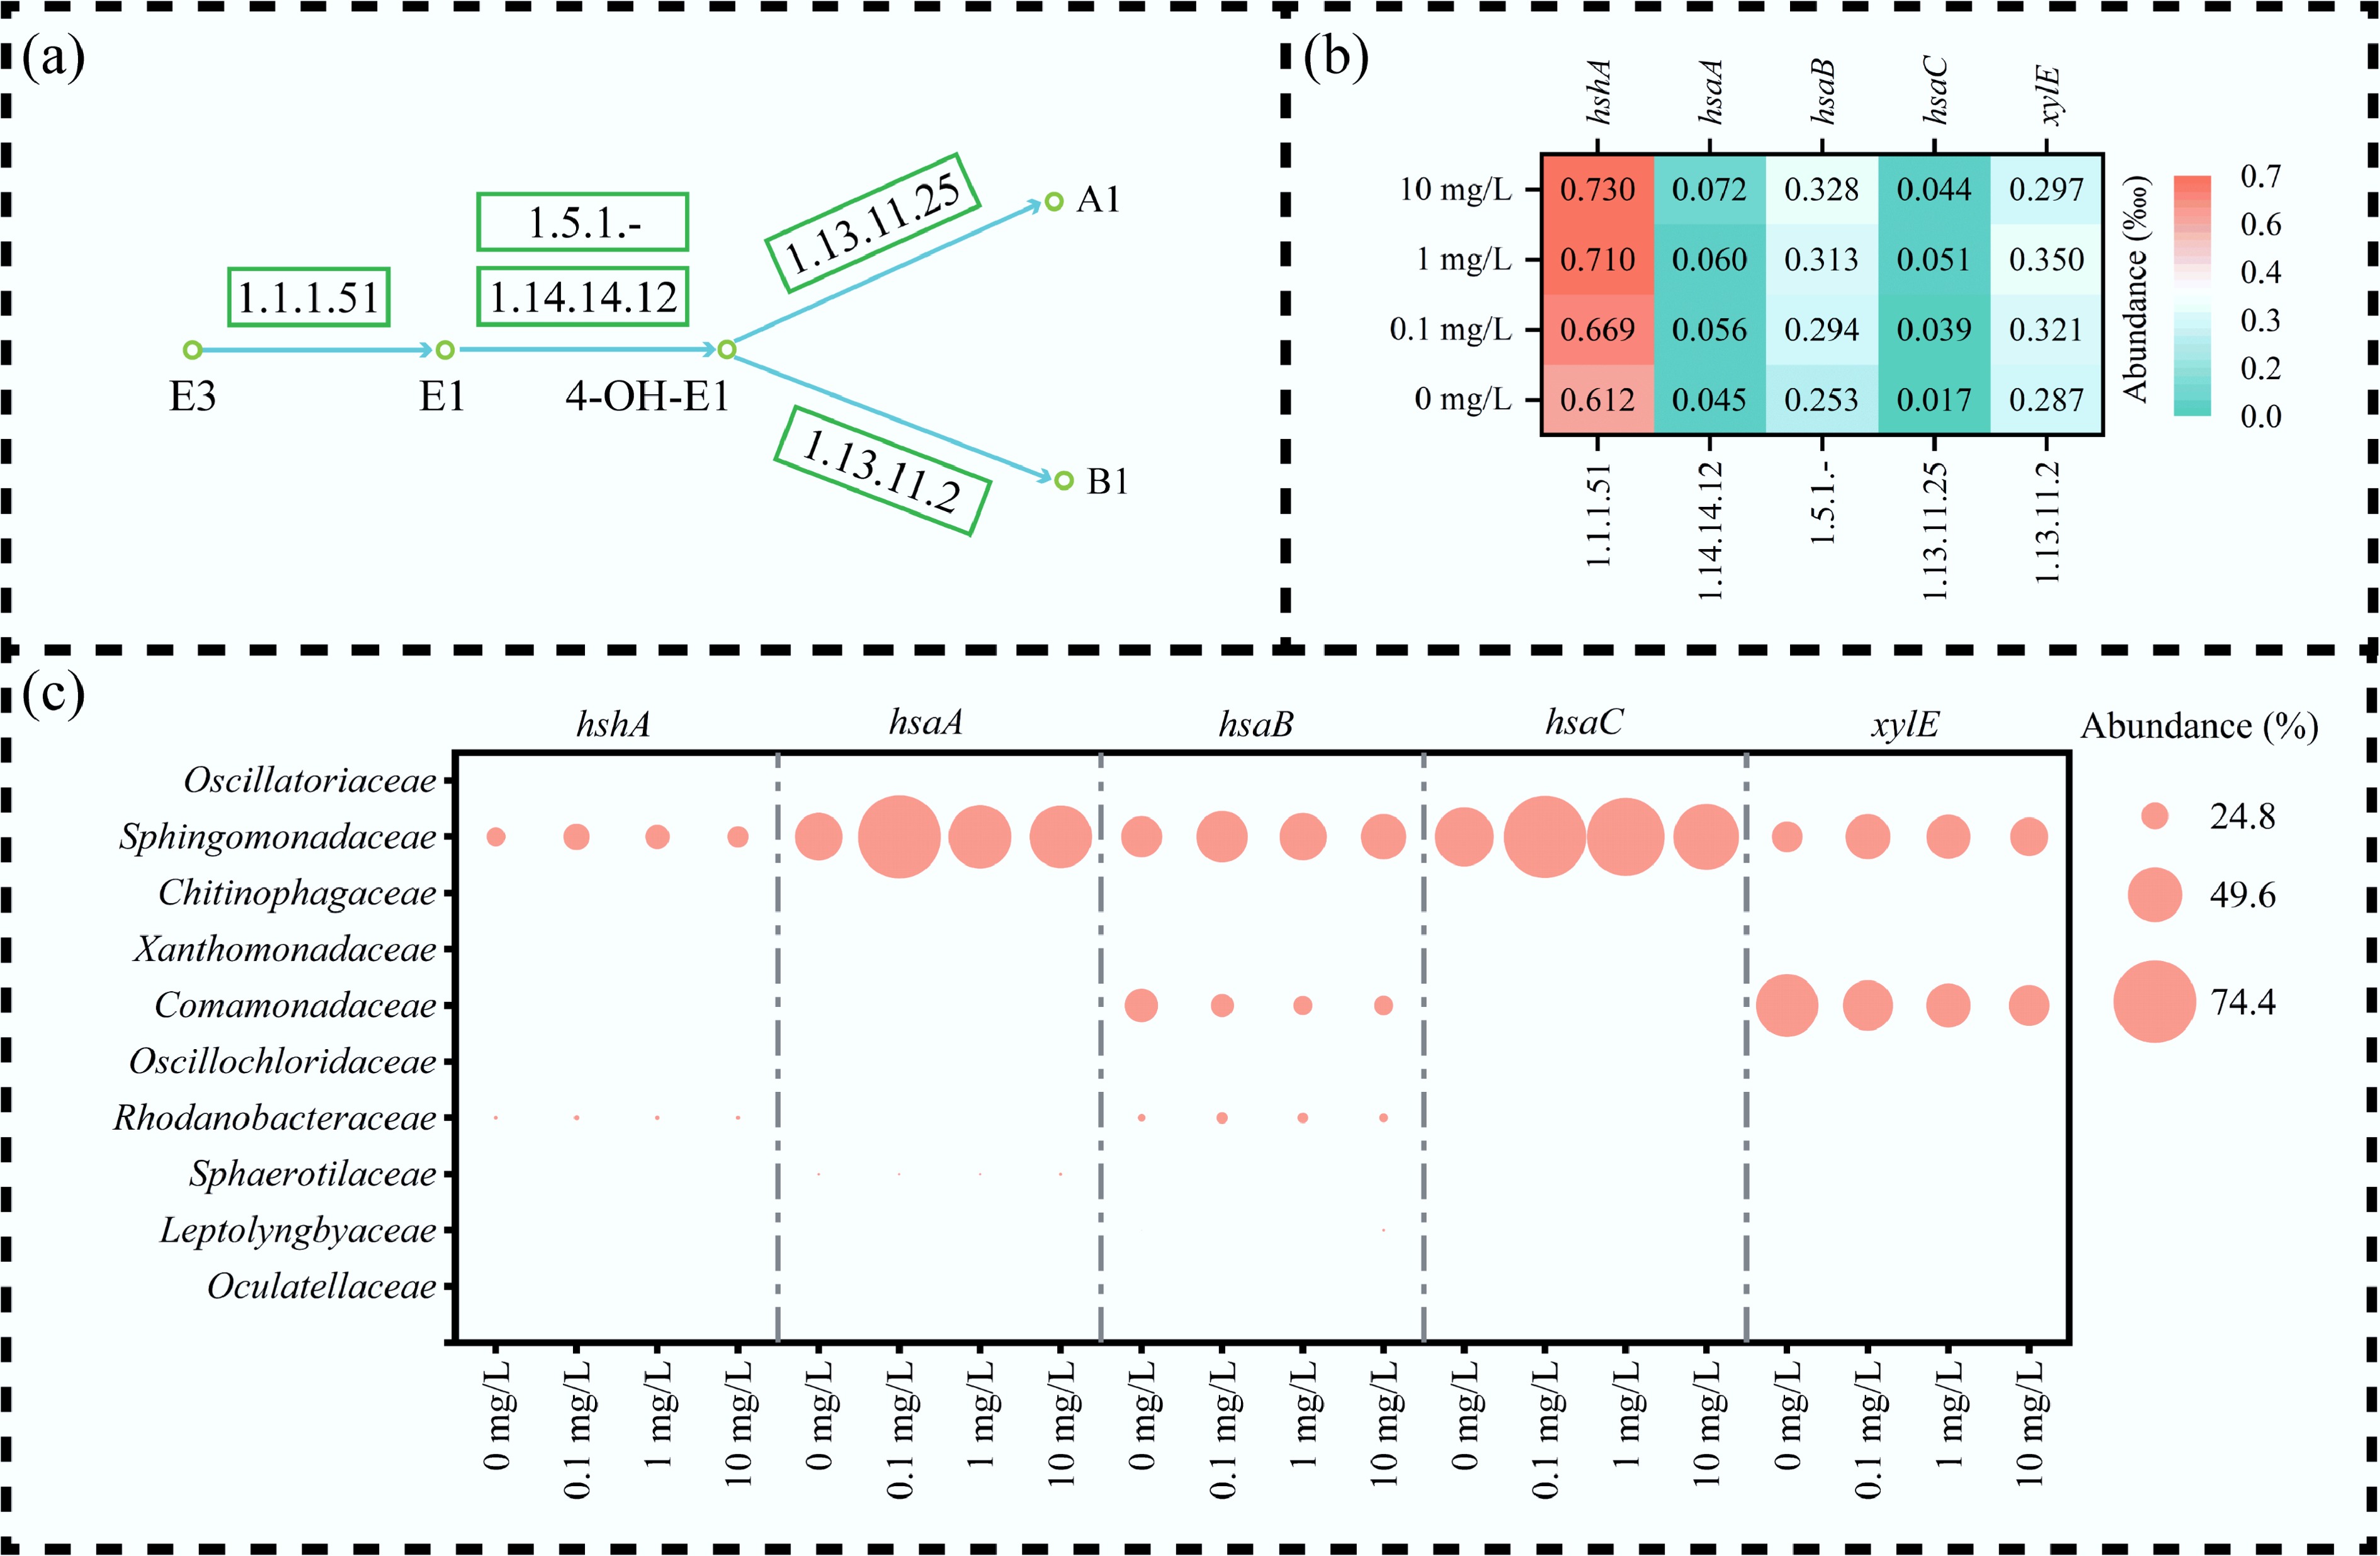
Figure 8.
Functional metabolism of estriol (E3) by MBGS. (a) Metabolic pathways and associated enzymes of E3. (b) Relative abundance (‱) of key functional genes, with color intensity indicating abundance level. (c) Microbial contribution (%) to functional gene, with circle size indicating contribution.
Figures
(8)
Tables
(0)