-
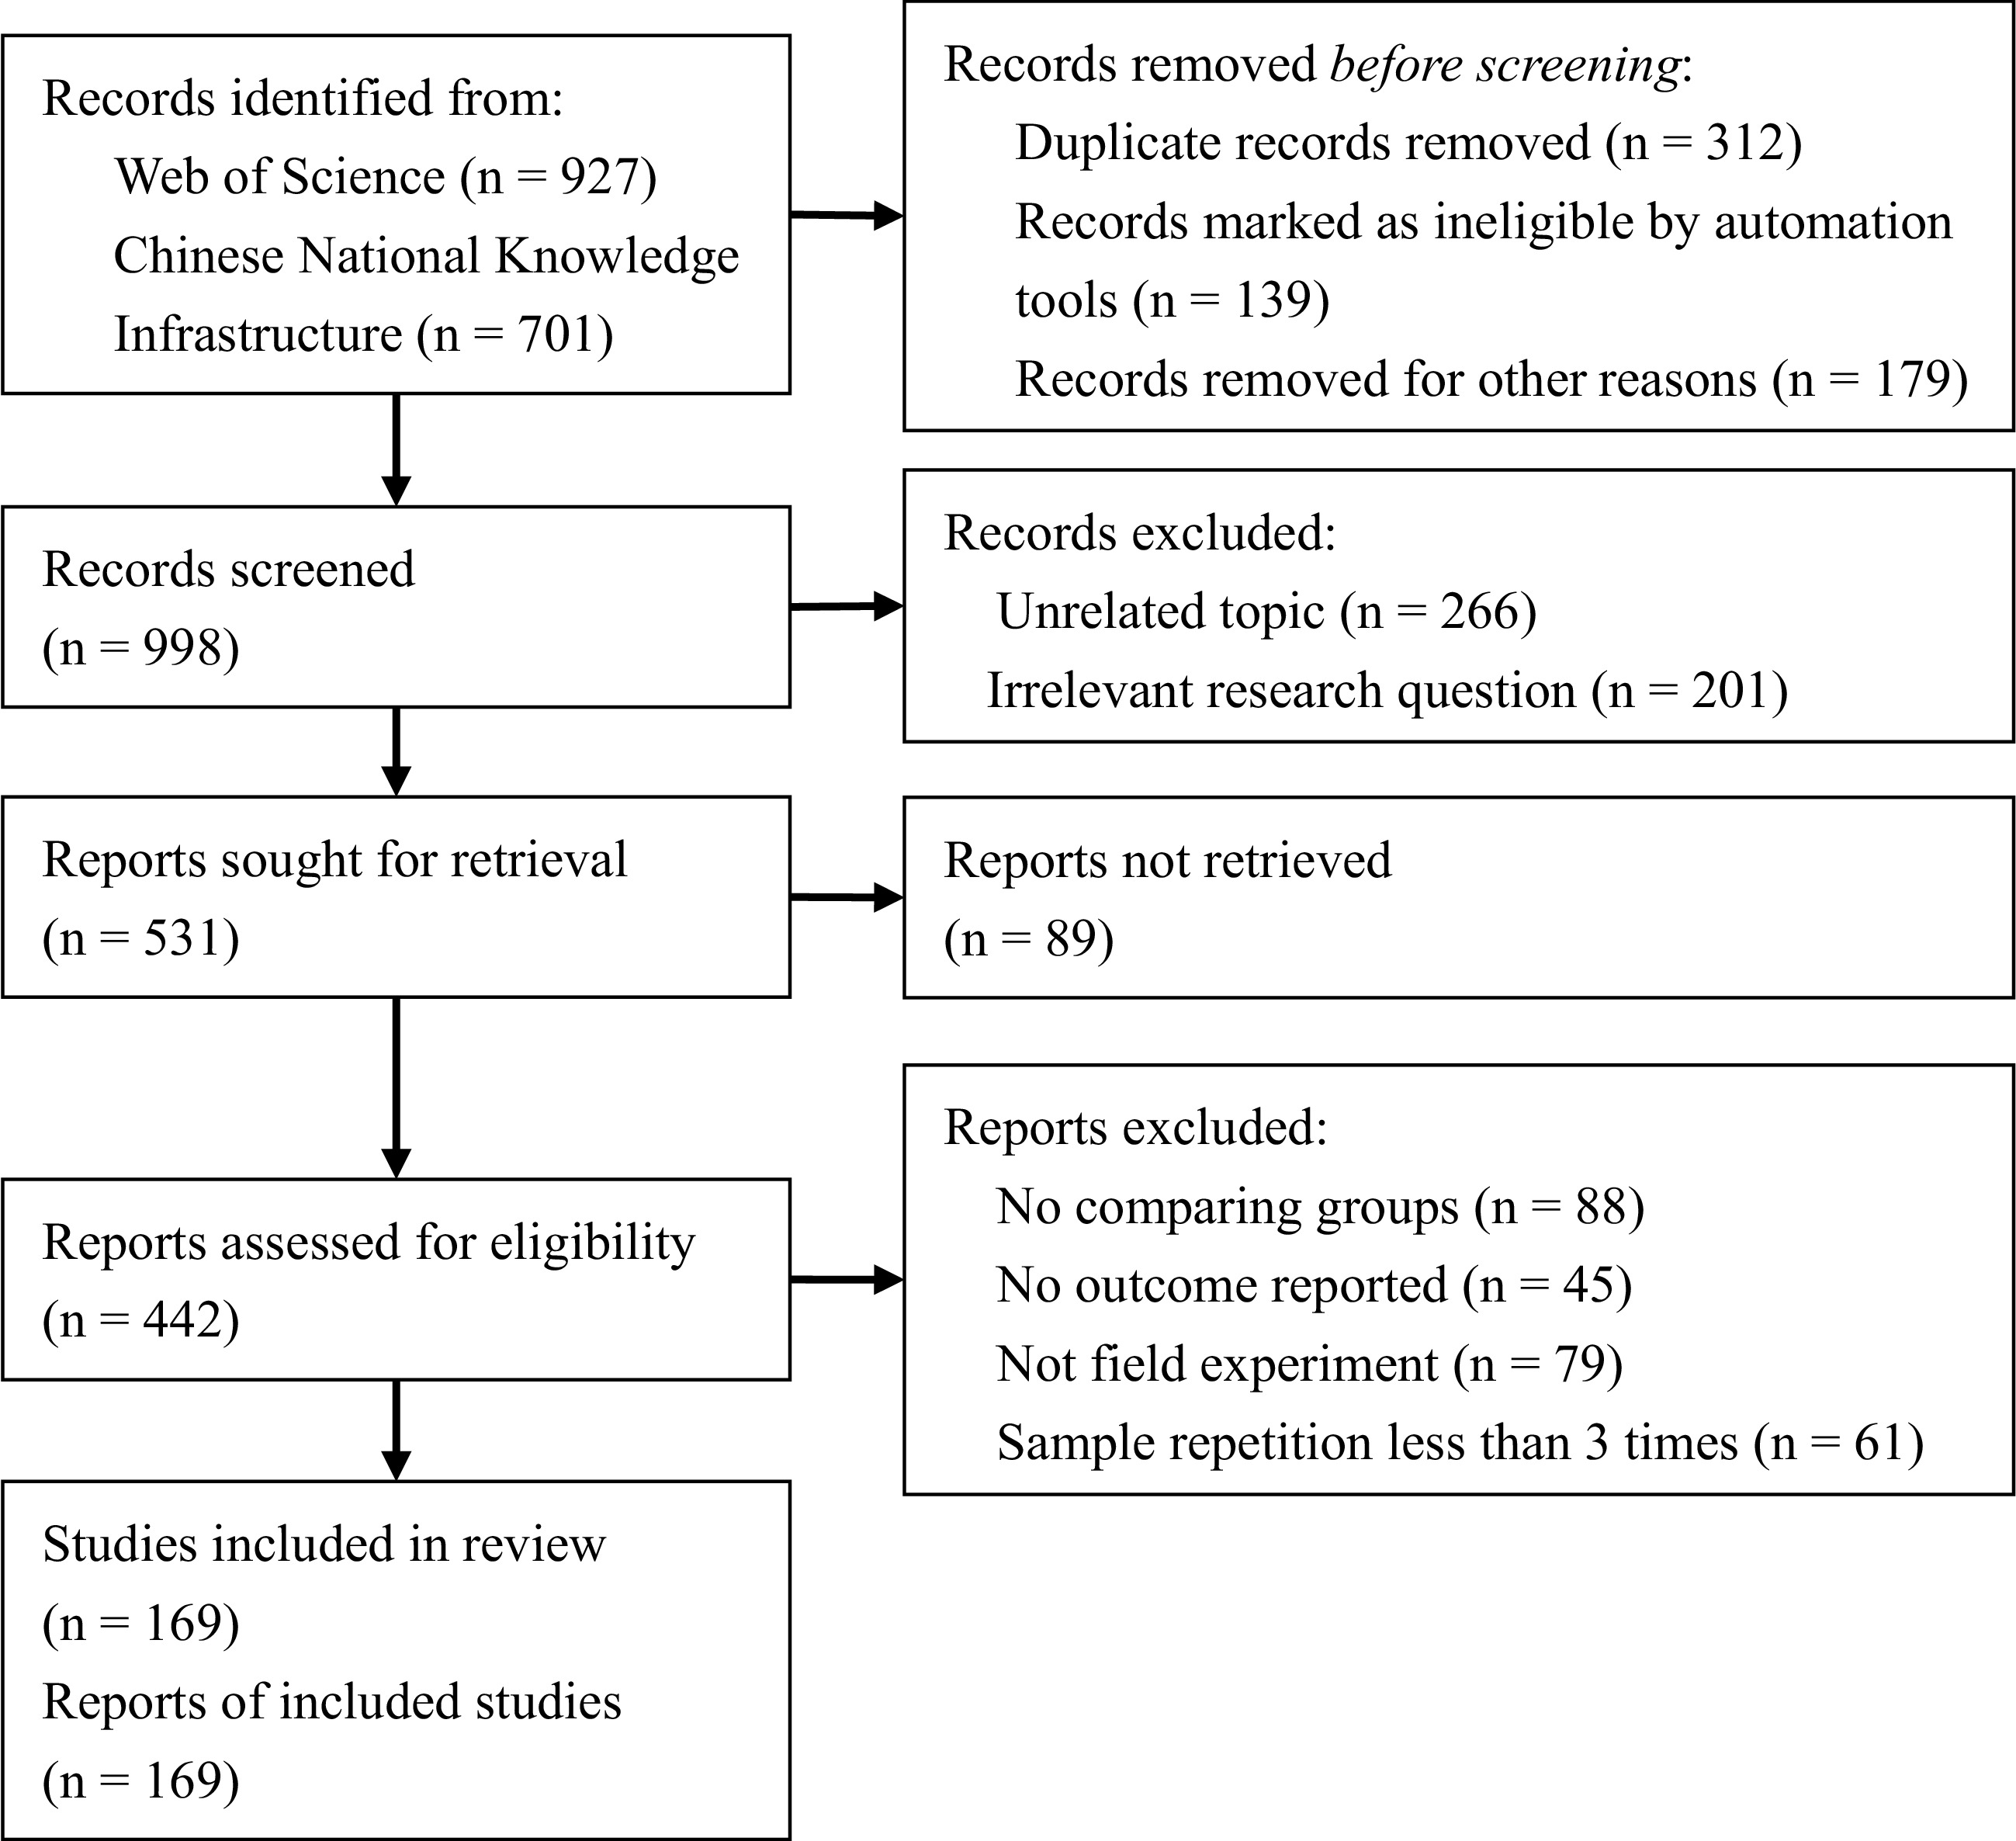
Figure 1.
PRISMA 2020 flow diagram.
-
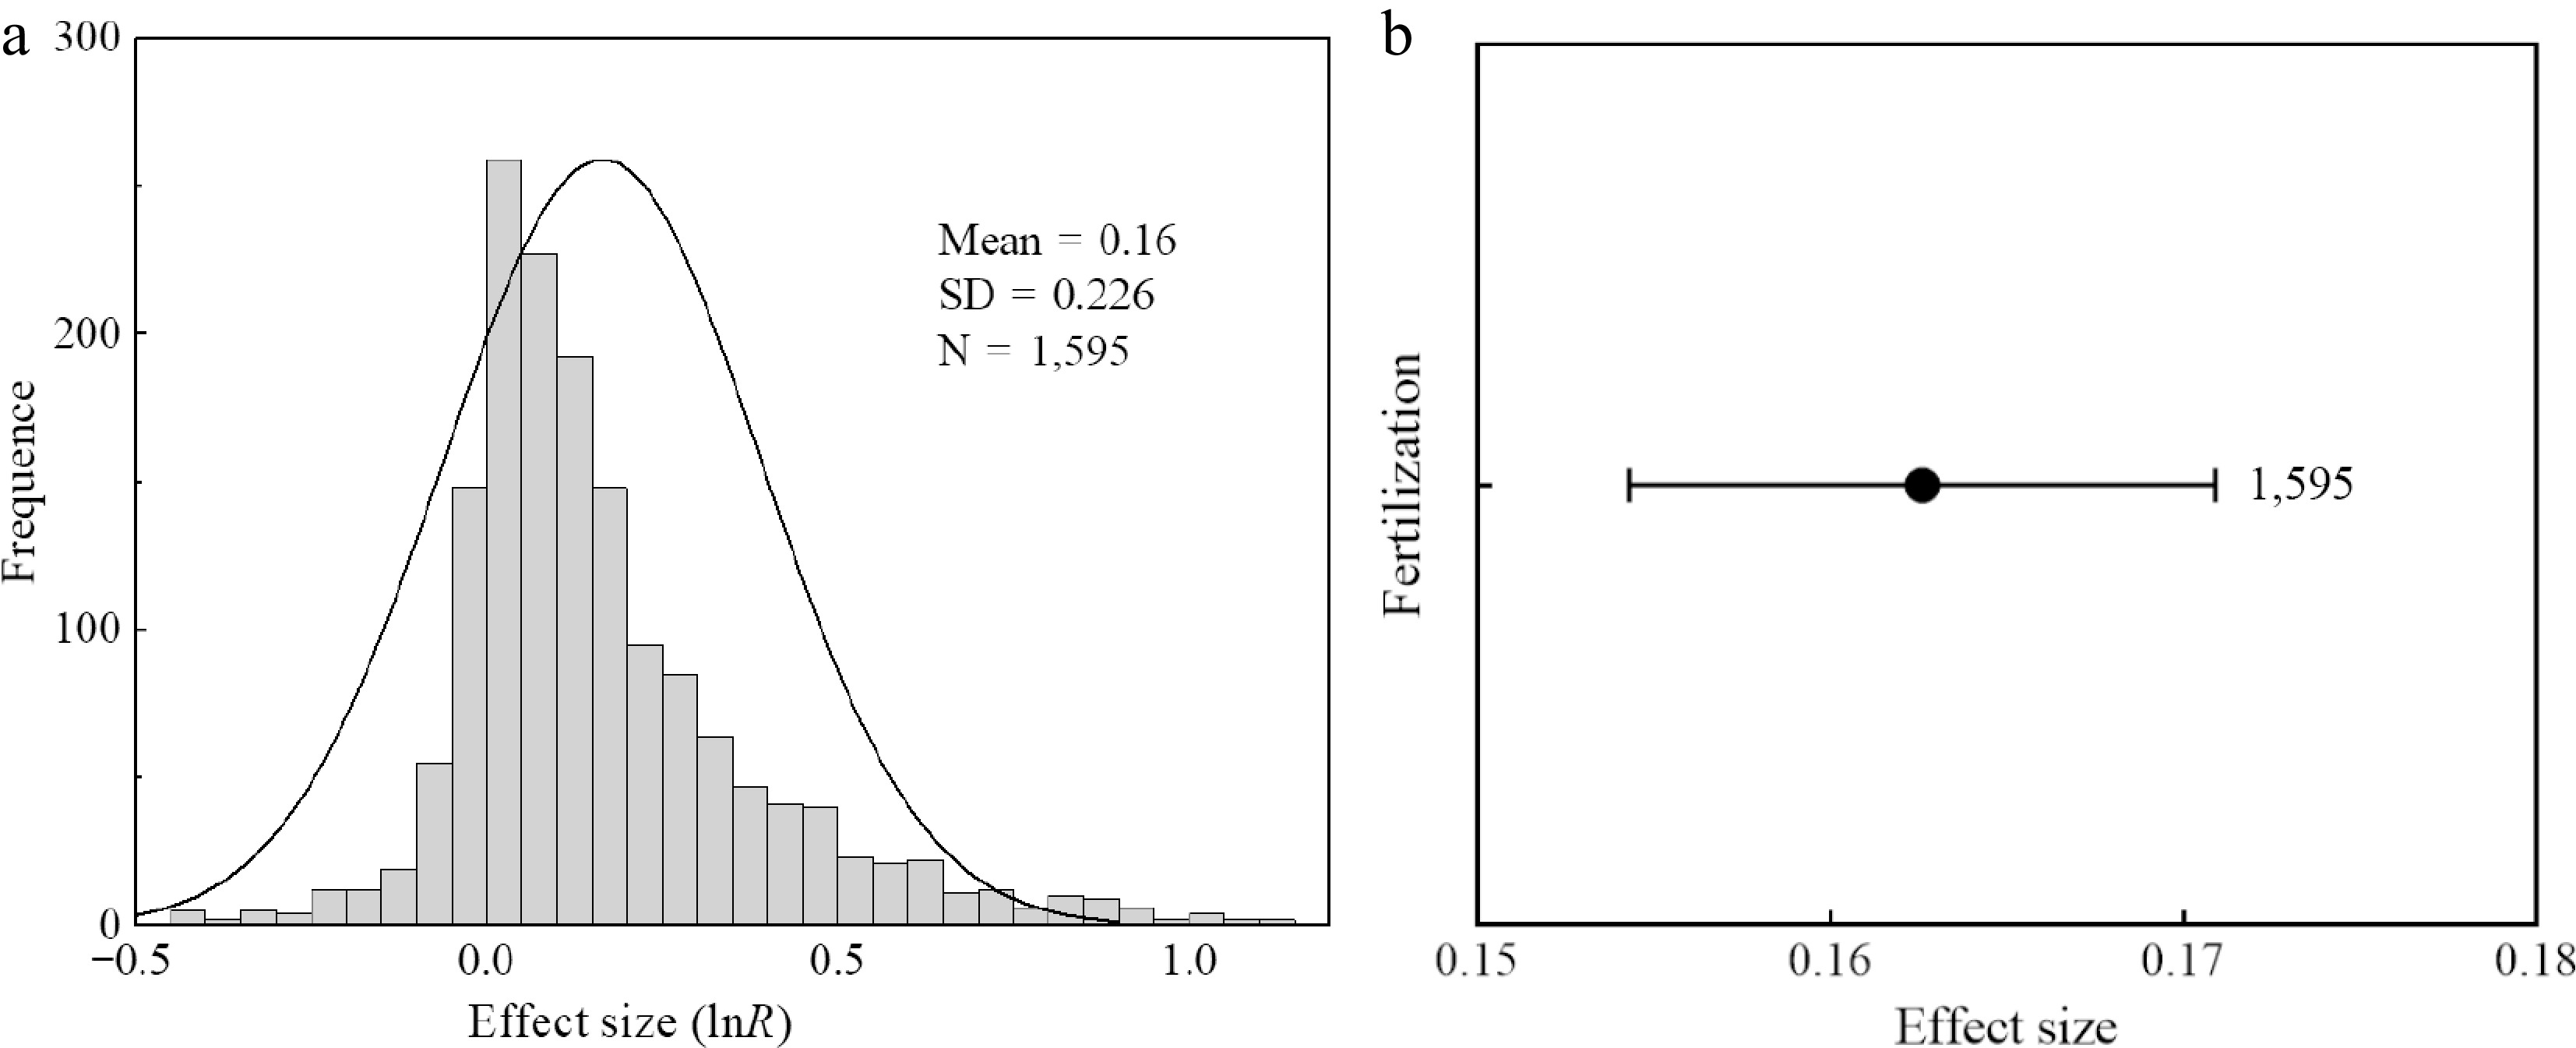
Figure 2.
(a) Distribution of the effect size and (b) the overall effect of fertilizer application on biomass accumulation in the first cut alfalfa. In (b), the number represents the sample size, and the point represents the mean value with the error bar showing the 95% confidence interval.
-
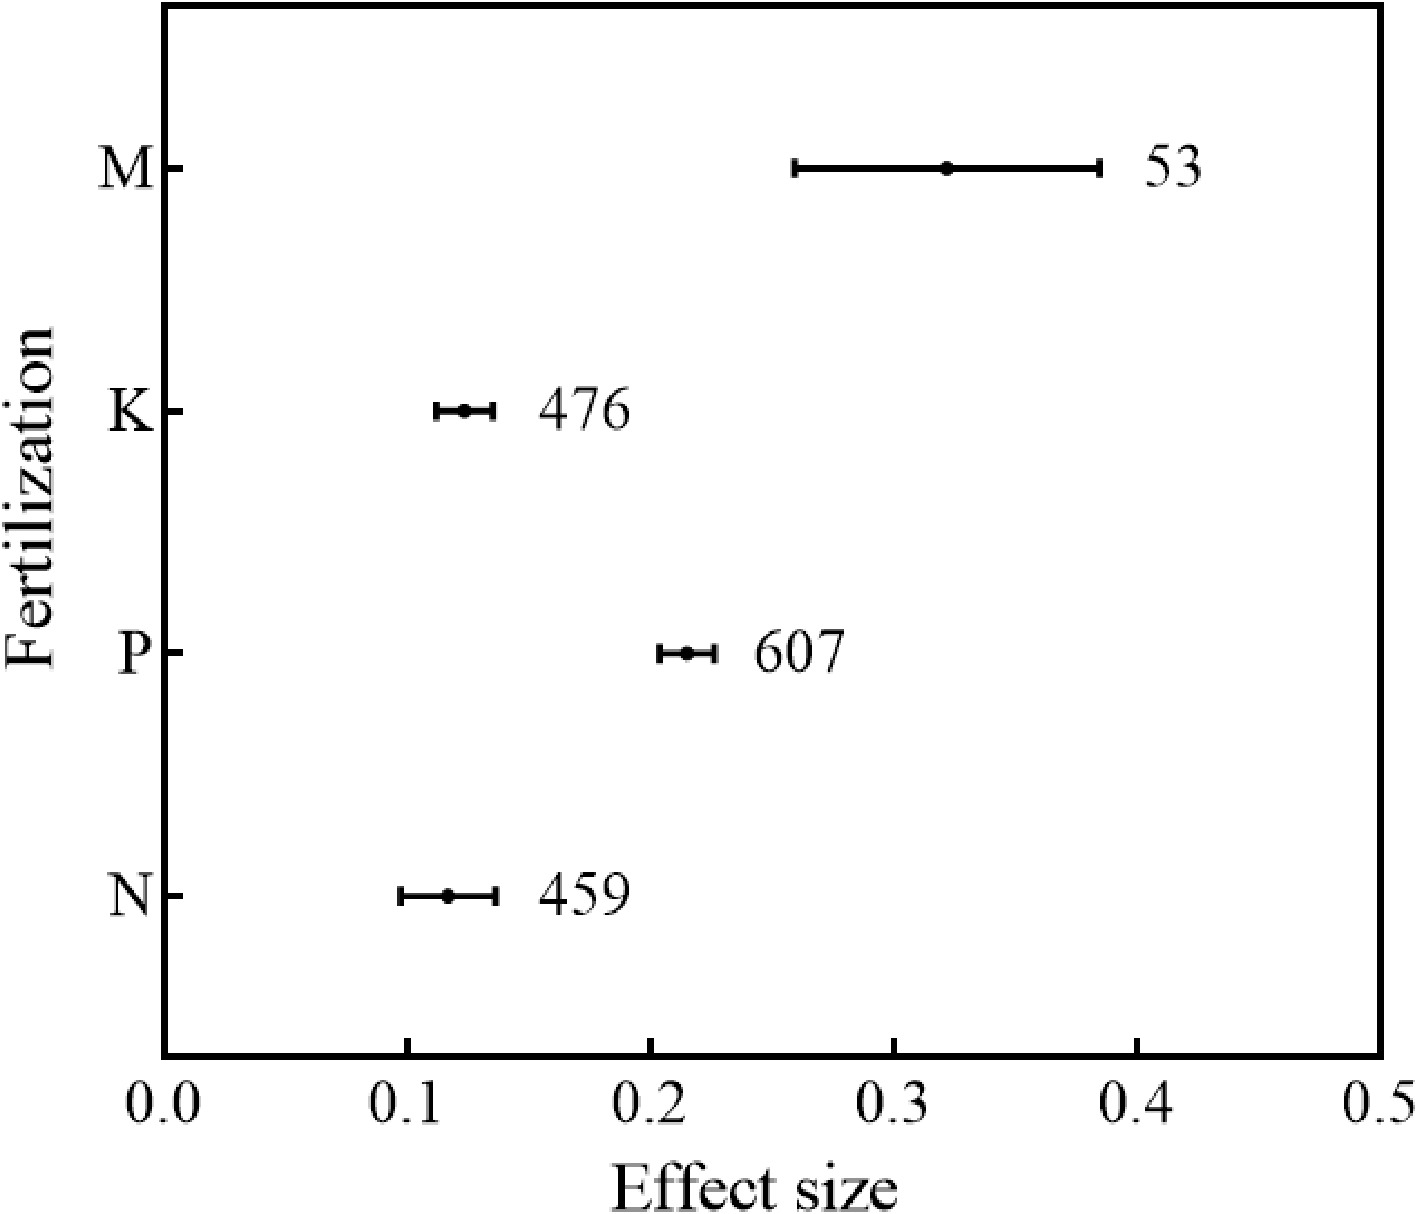
Figure 3.
Effects of applications of nitrogen (N), phosphorus (P), potassium (K) fertilizers, and manure (M) on biomass accumulation in the first cut alfalfa. The numbers represent the sample size, and the points represent the mean values with the error bars showing the 95% confidence intervals.
-
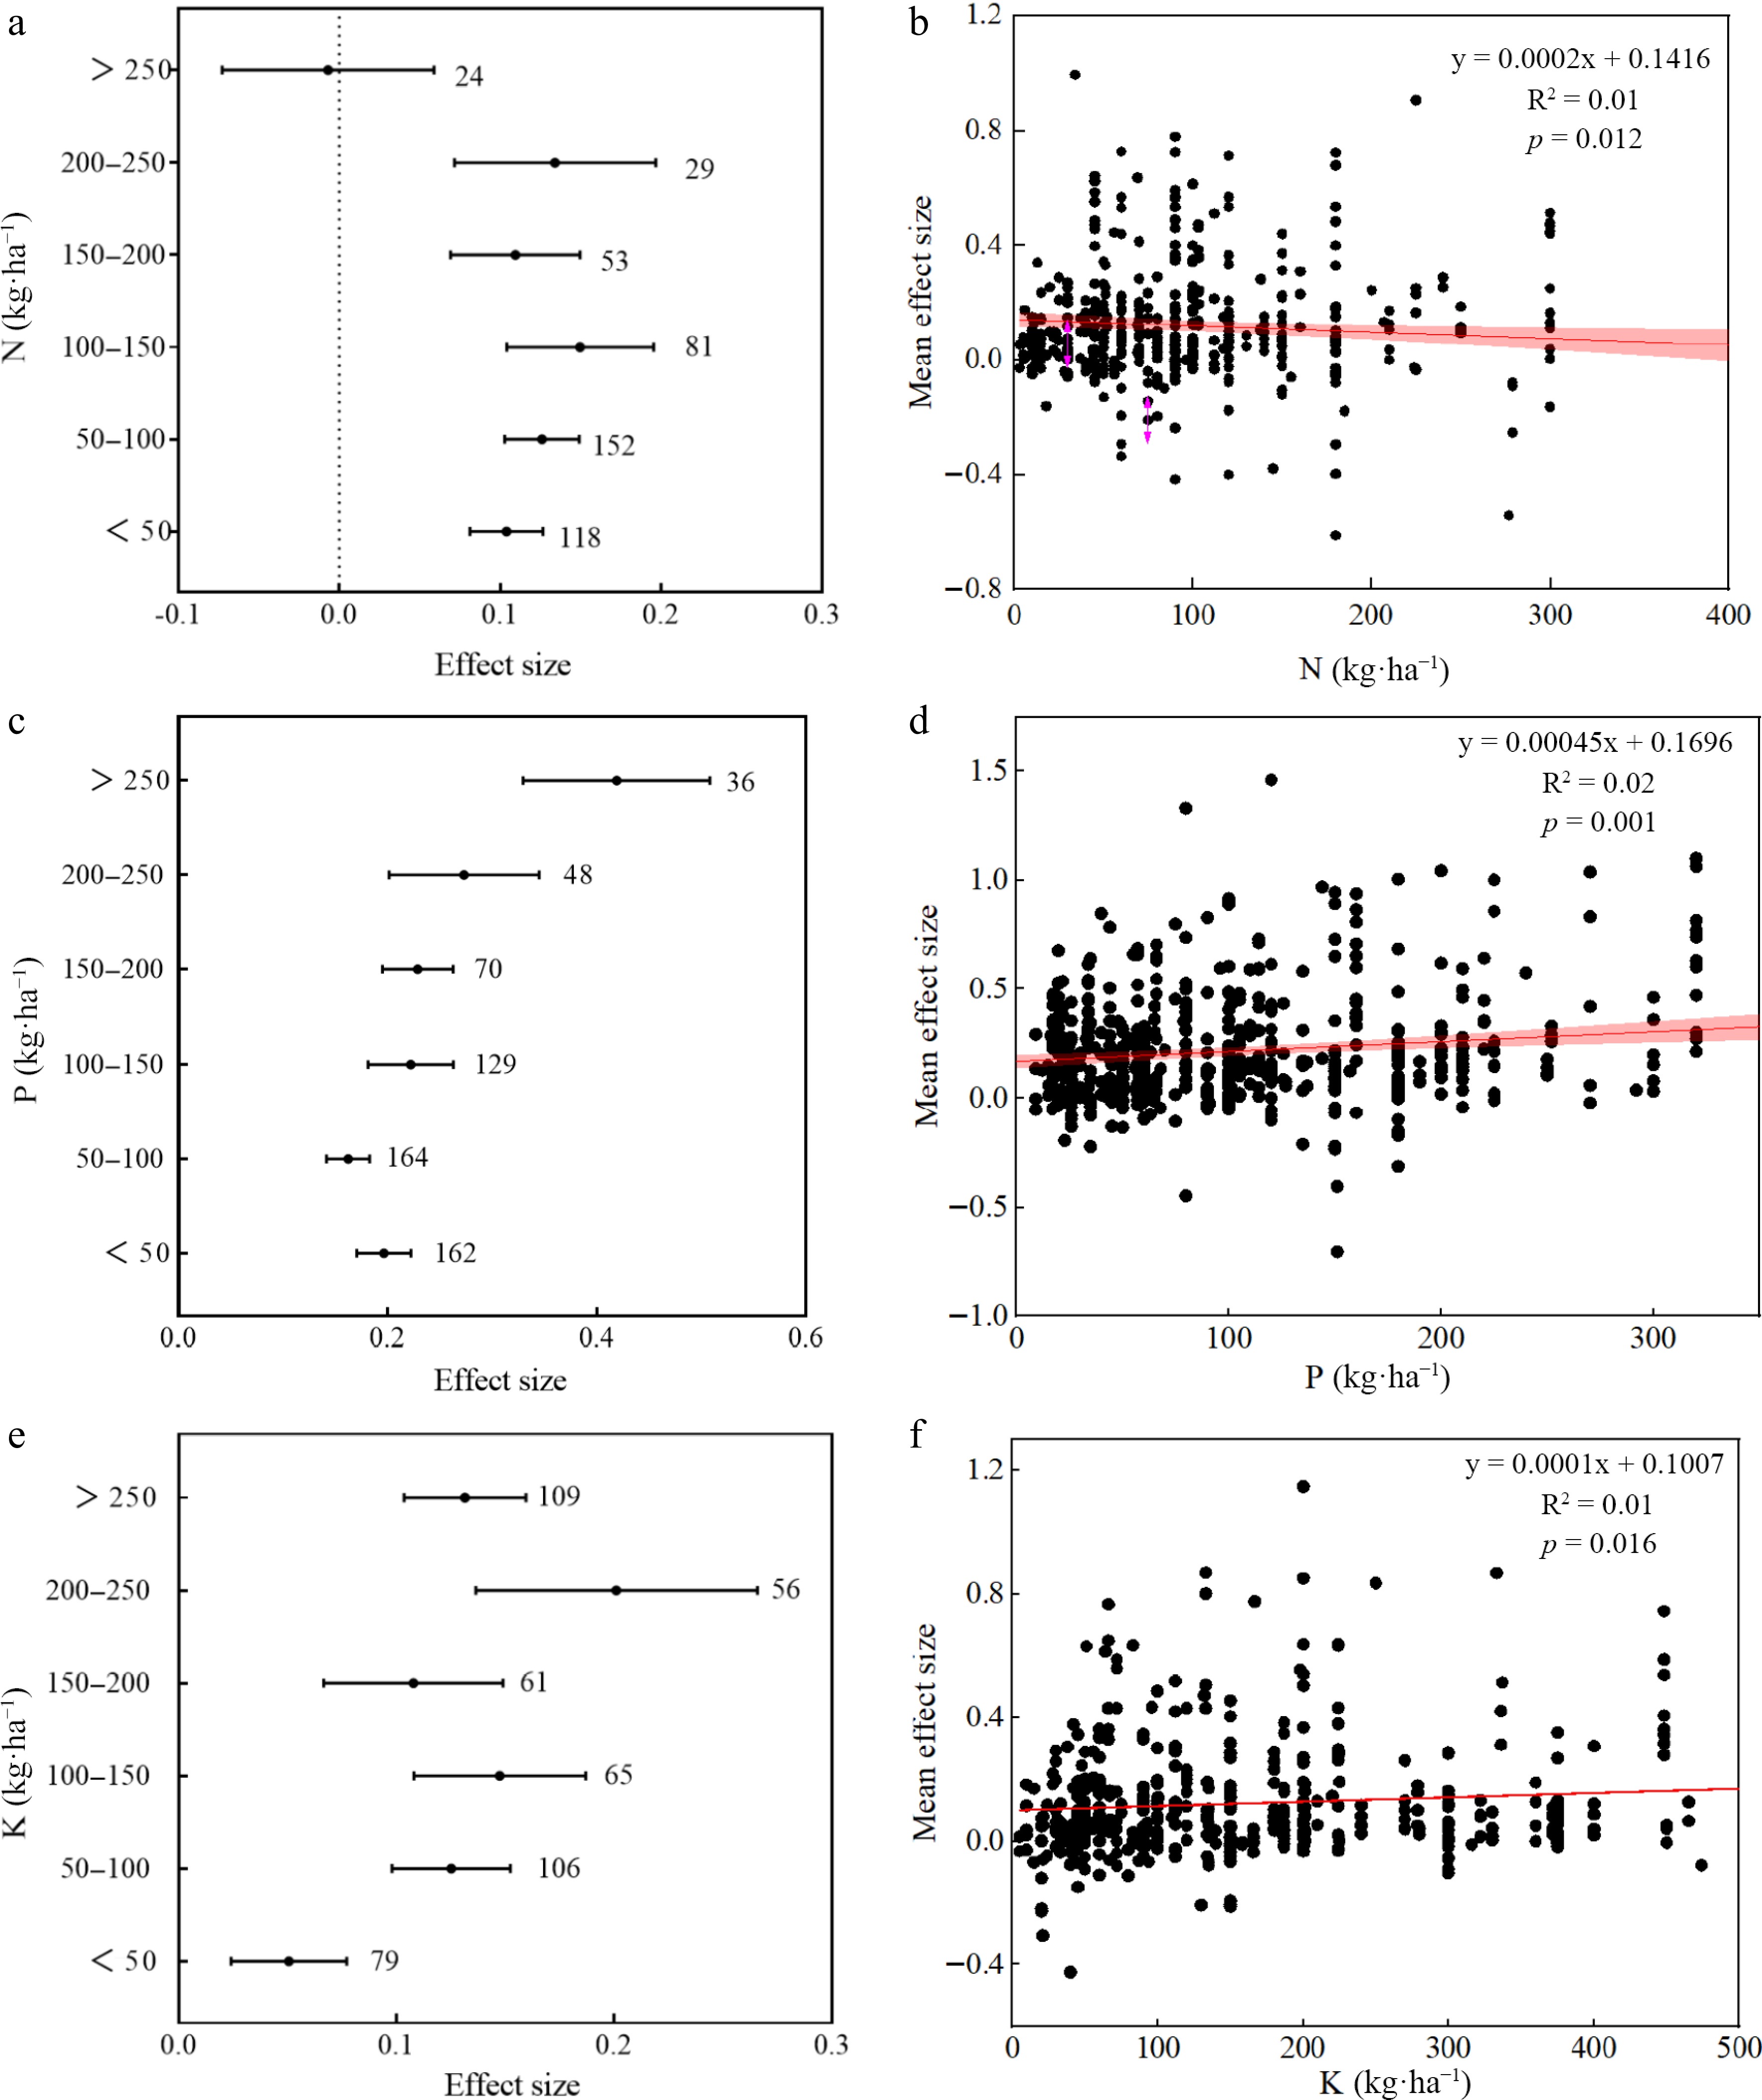
Figure 4.
Effects of (a) nitrogen (N), (c) phosphorus (P), and (e) potassium (K) fertilizers on biomass accumulation in the first cut alfalfa at different application rates, and linear regression analysis on mean effect size with applications of (b) N, (d) P, and (f) K fertilizers. In (a), (c), (e) the numbers represent the sample size, and the points represent the mean values with the error bars showing the 95% confidence intervals. In (b), (d), (f), the shaded area shows the 95% confidence intervals.
-
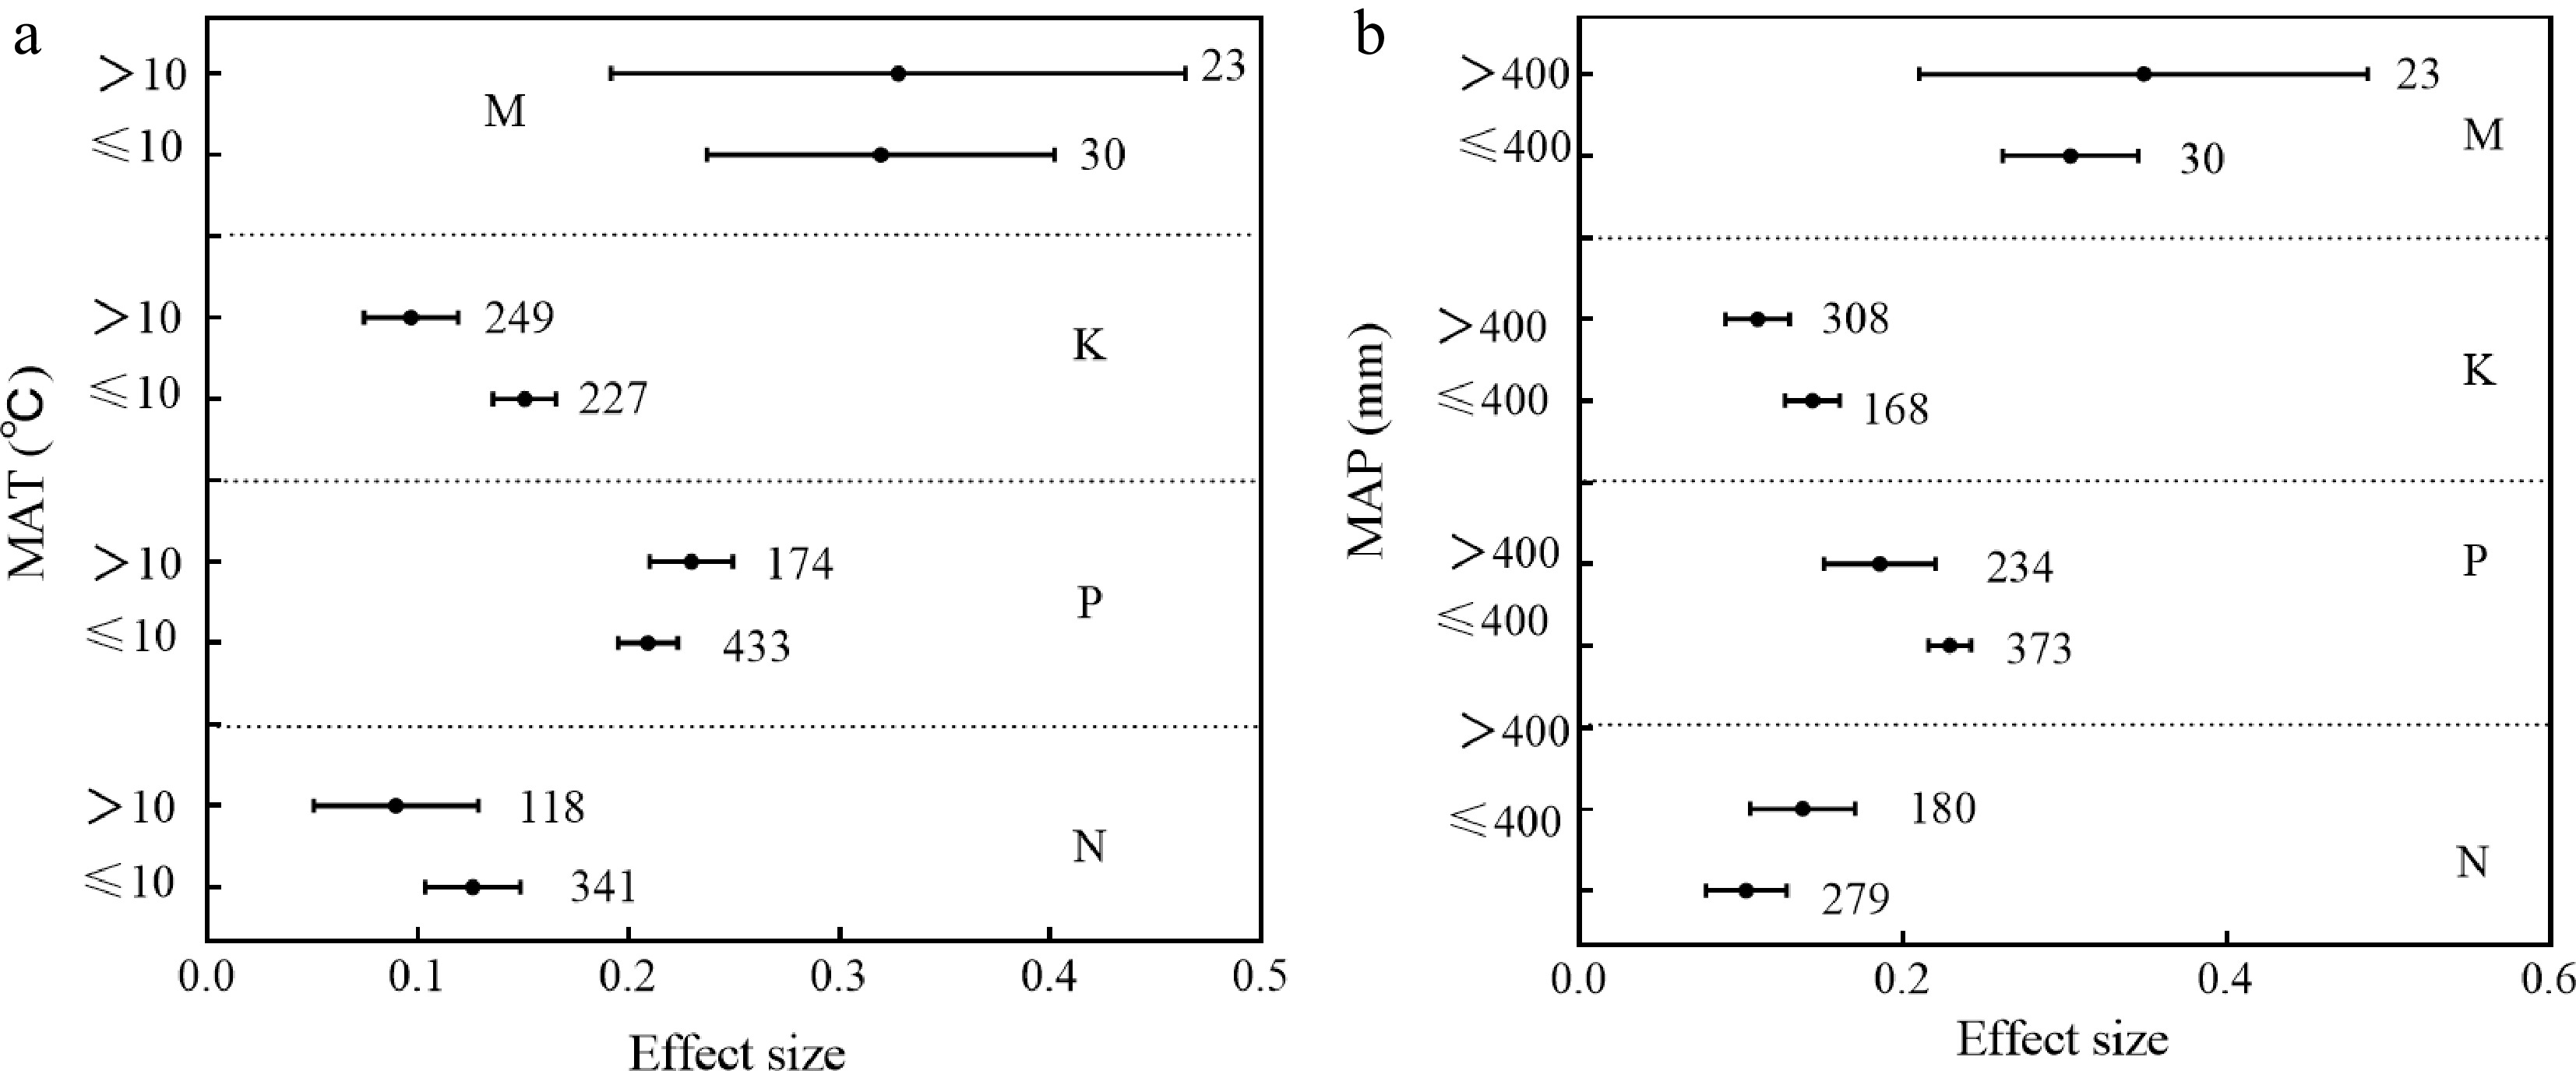
Figure 5.
Changes in the effects of various fertilizer applications on biomass accumulation in the first cut alfalfa under different levels of mean (a) annual temperature (MAT), and (b) precipitation (MAP). N: nitrogen fertilizer, P: phosphorus fertilizer, K: potassium fertilizer, M: manure. The numbers represent the sample size, and the points represent the mean values with the error bars showing the 95% confidence intervals.
-
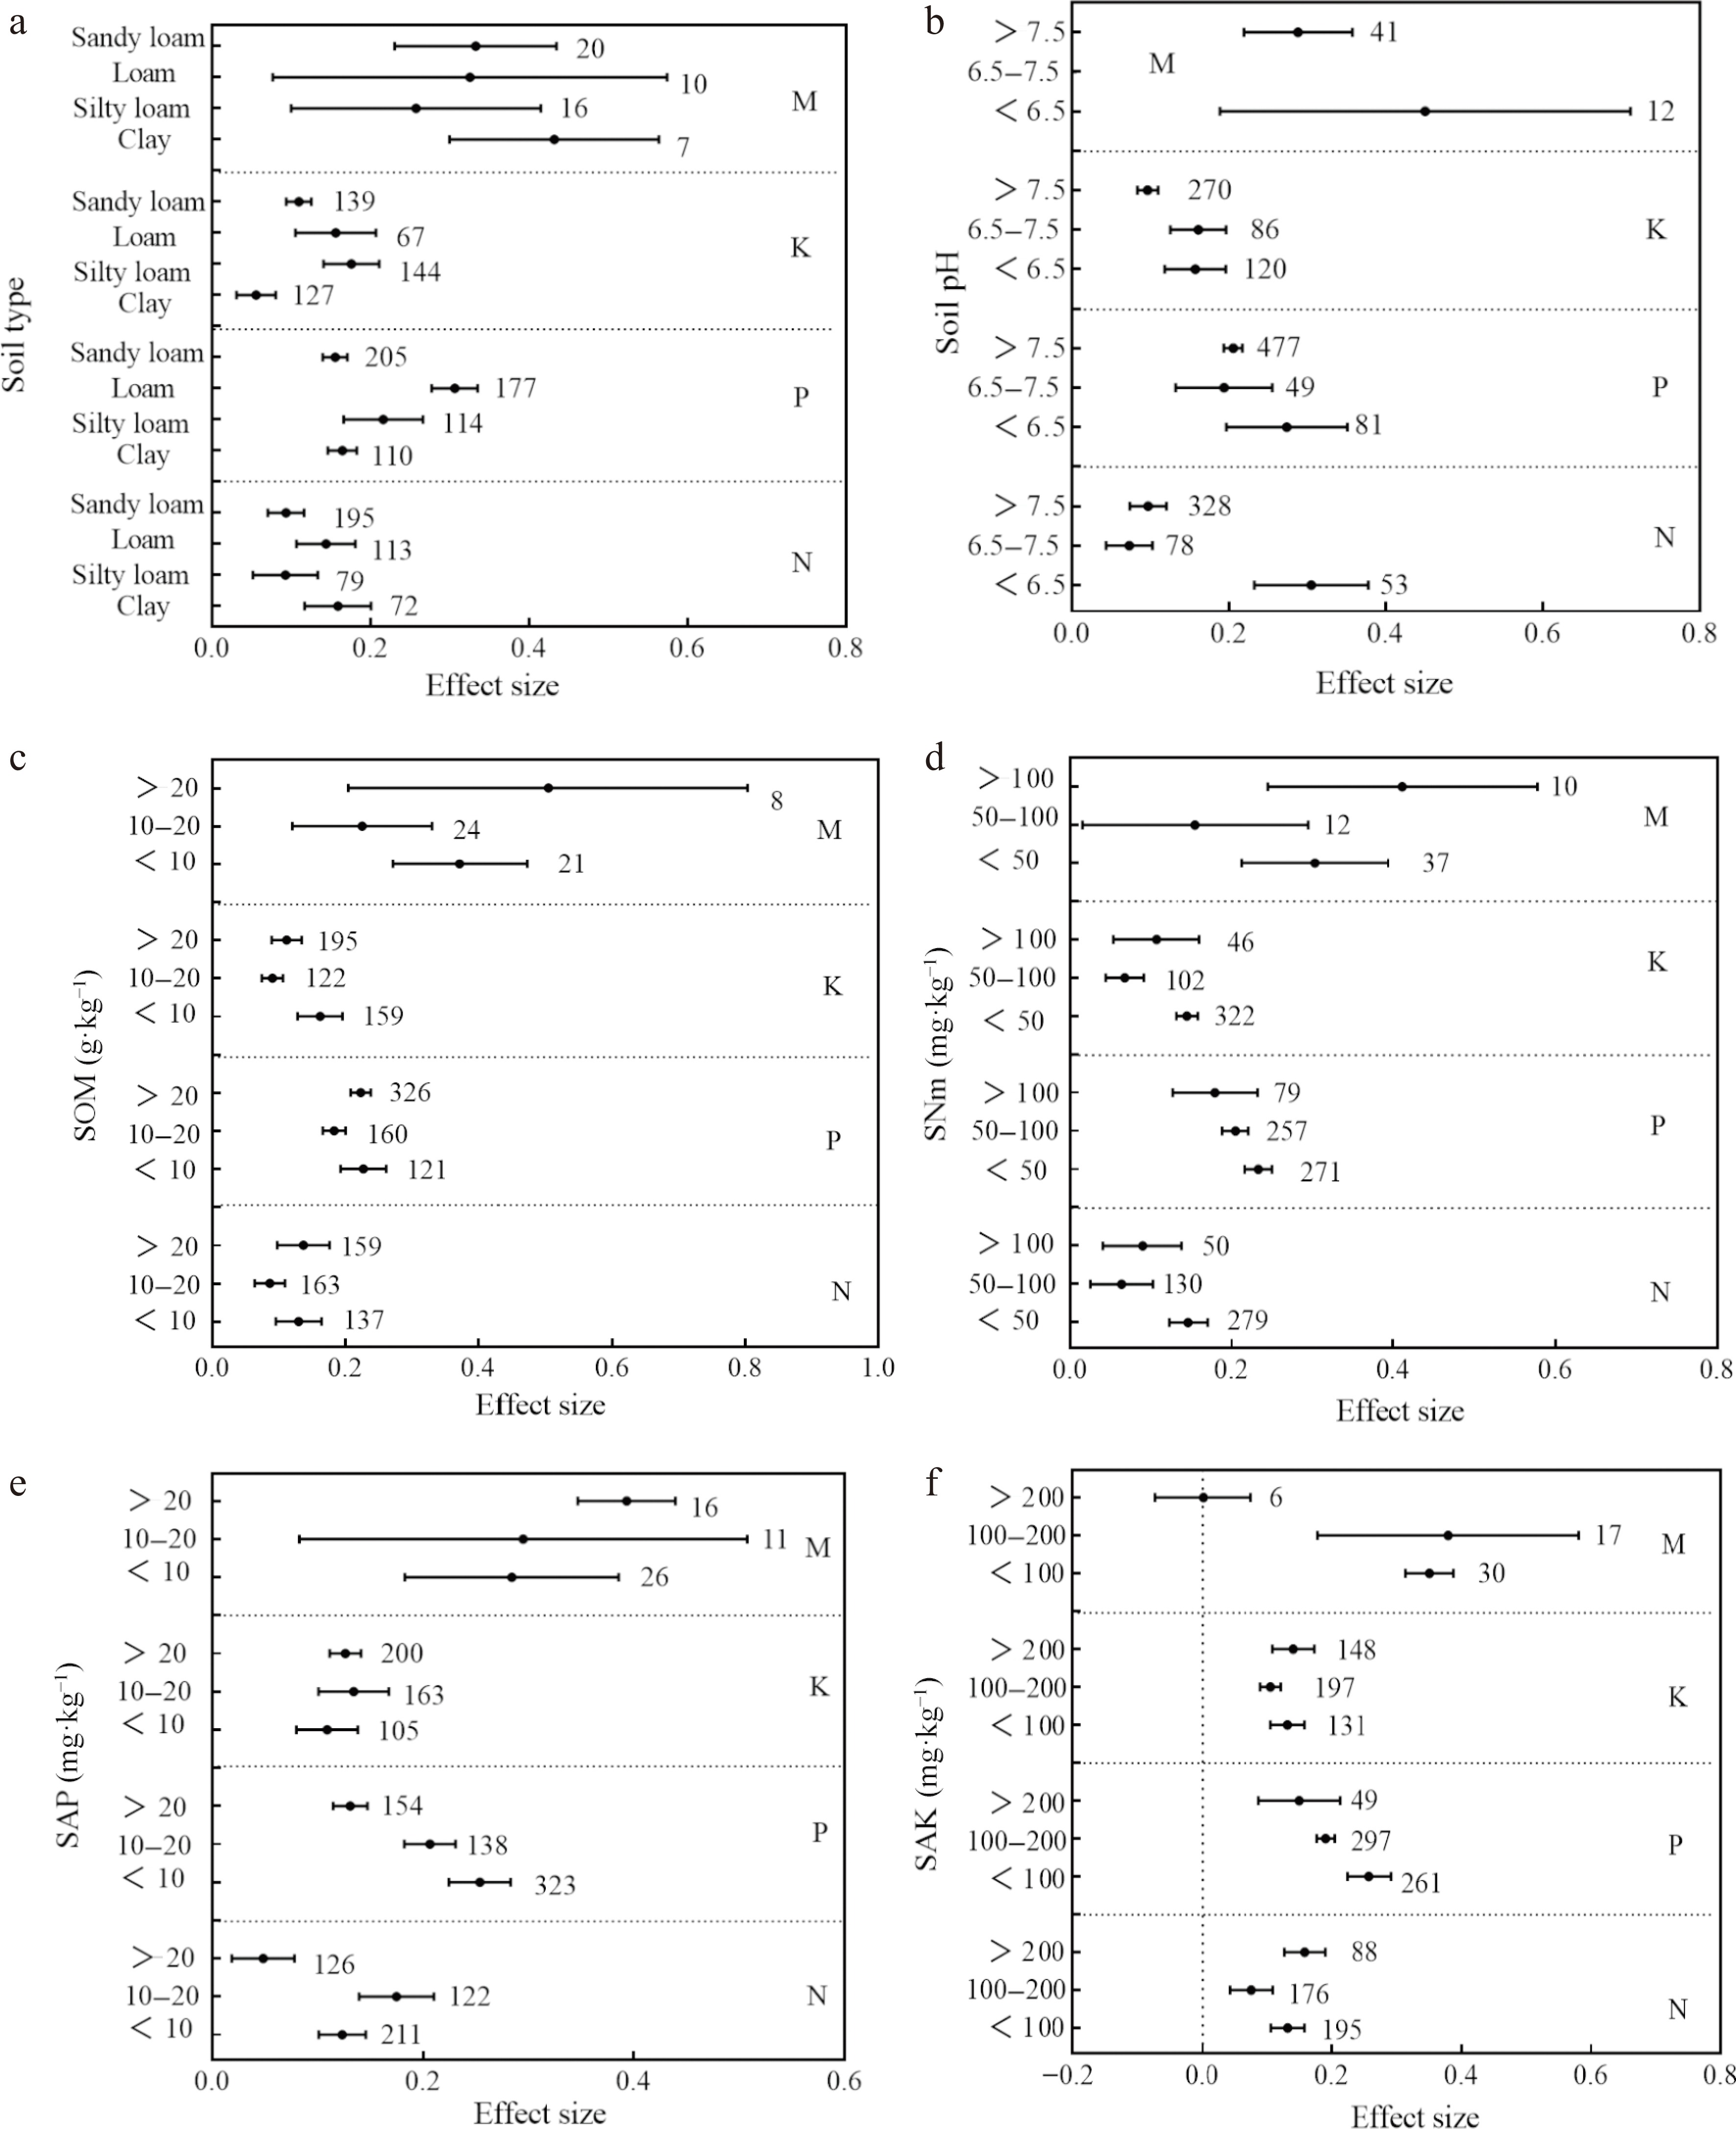
Figure 6.
Changes in the effects of various fertilizer applications on biomass accumulation in the first cut alfalfa under different levels of (a) soil type, (b) pH, (c) organic matter (SOM), (d) mineral nitrogen (SNm), (e) available phosphorus (SAP), and (f) available potassium (SAK). N: nitrogen fertilizer, P: phosphorus fertilizer, K: potassium fertilizer, M: manure. The numbers represent the sample size, and the points represent the mean values with the error bars showing the 95% confidence intervals.
-
Variable Group Number of paired data Qb p MAT (°C) ≤ 10 1,031 45.73 < 0.001 > 10 564 MAP (mm) ≤ 400 850 37.82 < 0.001 > 400 745 Soil pH < 6.5 266 0.84 0.657 6.5−7.5 213 > 7.5 1,116 Soil type Clay 316 49.88 < 0.001 Silty loam 353 Loam 367 Sandy loam 559 SOM
(mg·kg−1)< 10 438 9.84 0.007 10−20 469 > 20 688 SNm
(mg·kg−1)< 50 909 27.43 < 0.001 50−100 501 > 100 185 SAP
(mg·kg−1)< 10 665 14.46 0.001 10−20 434 > 20 496 SAK
(mg·kg−1)< 100 617 35.32 < 0.001 100−200 687 > 200 291 Note: MAT, mean annual temperature; MAP, mean annual precipitation; SOM, soil organic matter; SNm, soil mineral nitrogen; SAP, soil available phosphorus; SAK, soil available potassium. Table 1.
List of variables and between-group heterogeneity (Qb) of effect sizes on biomass accumulation in the meta-analysis.
Figures
(6)
Tables
(1)