-
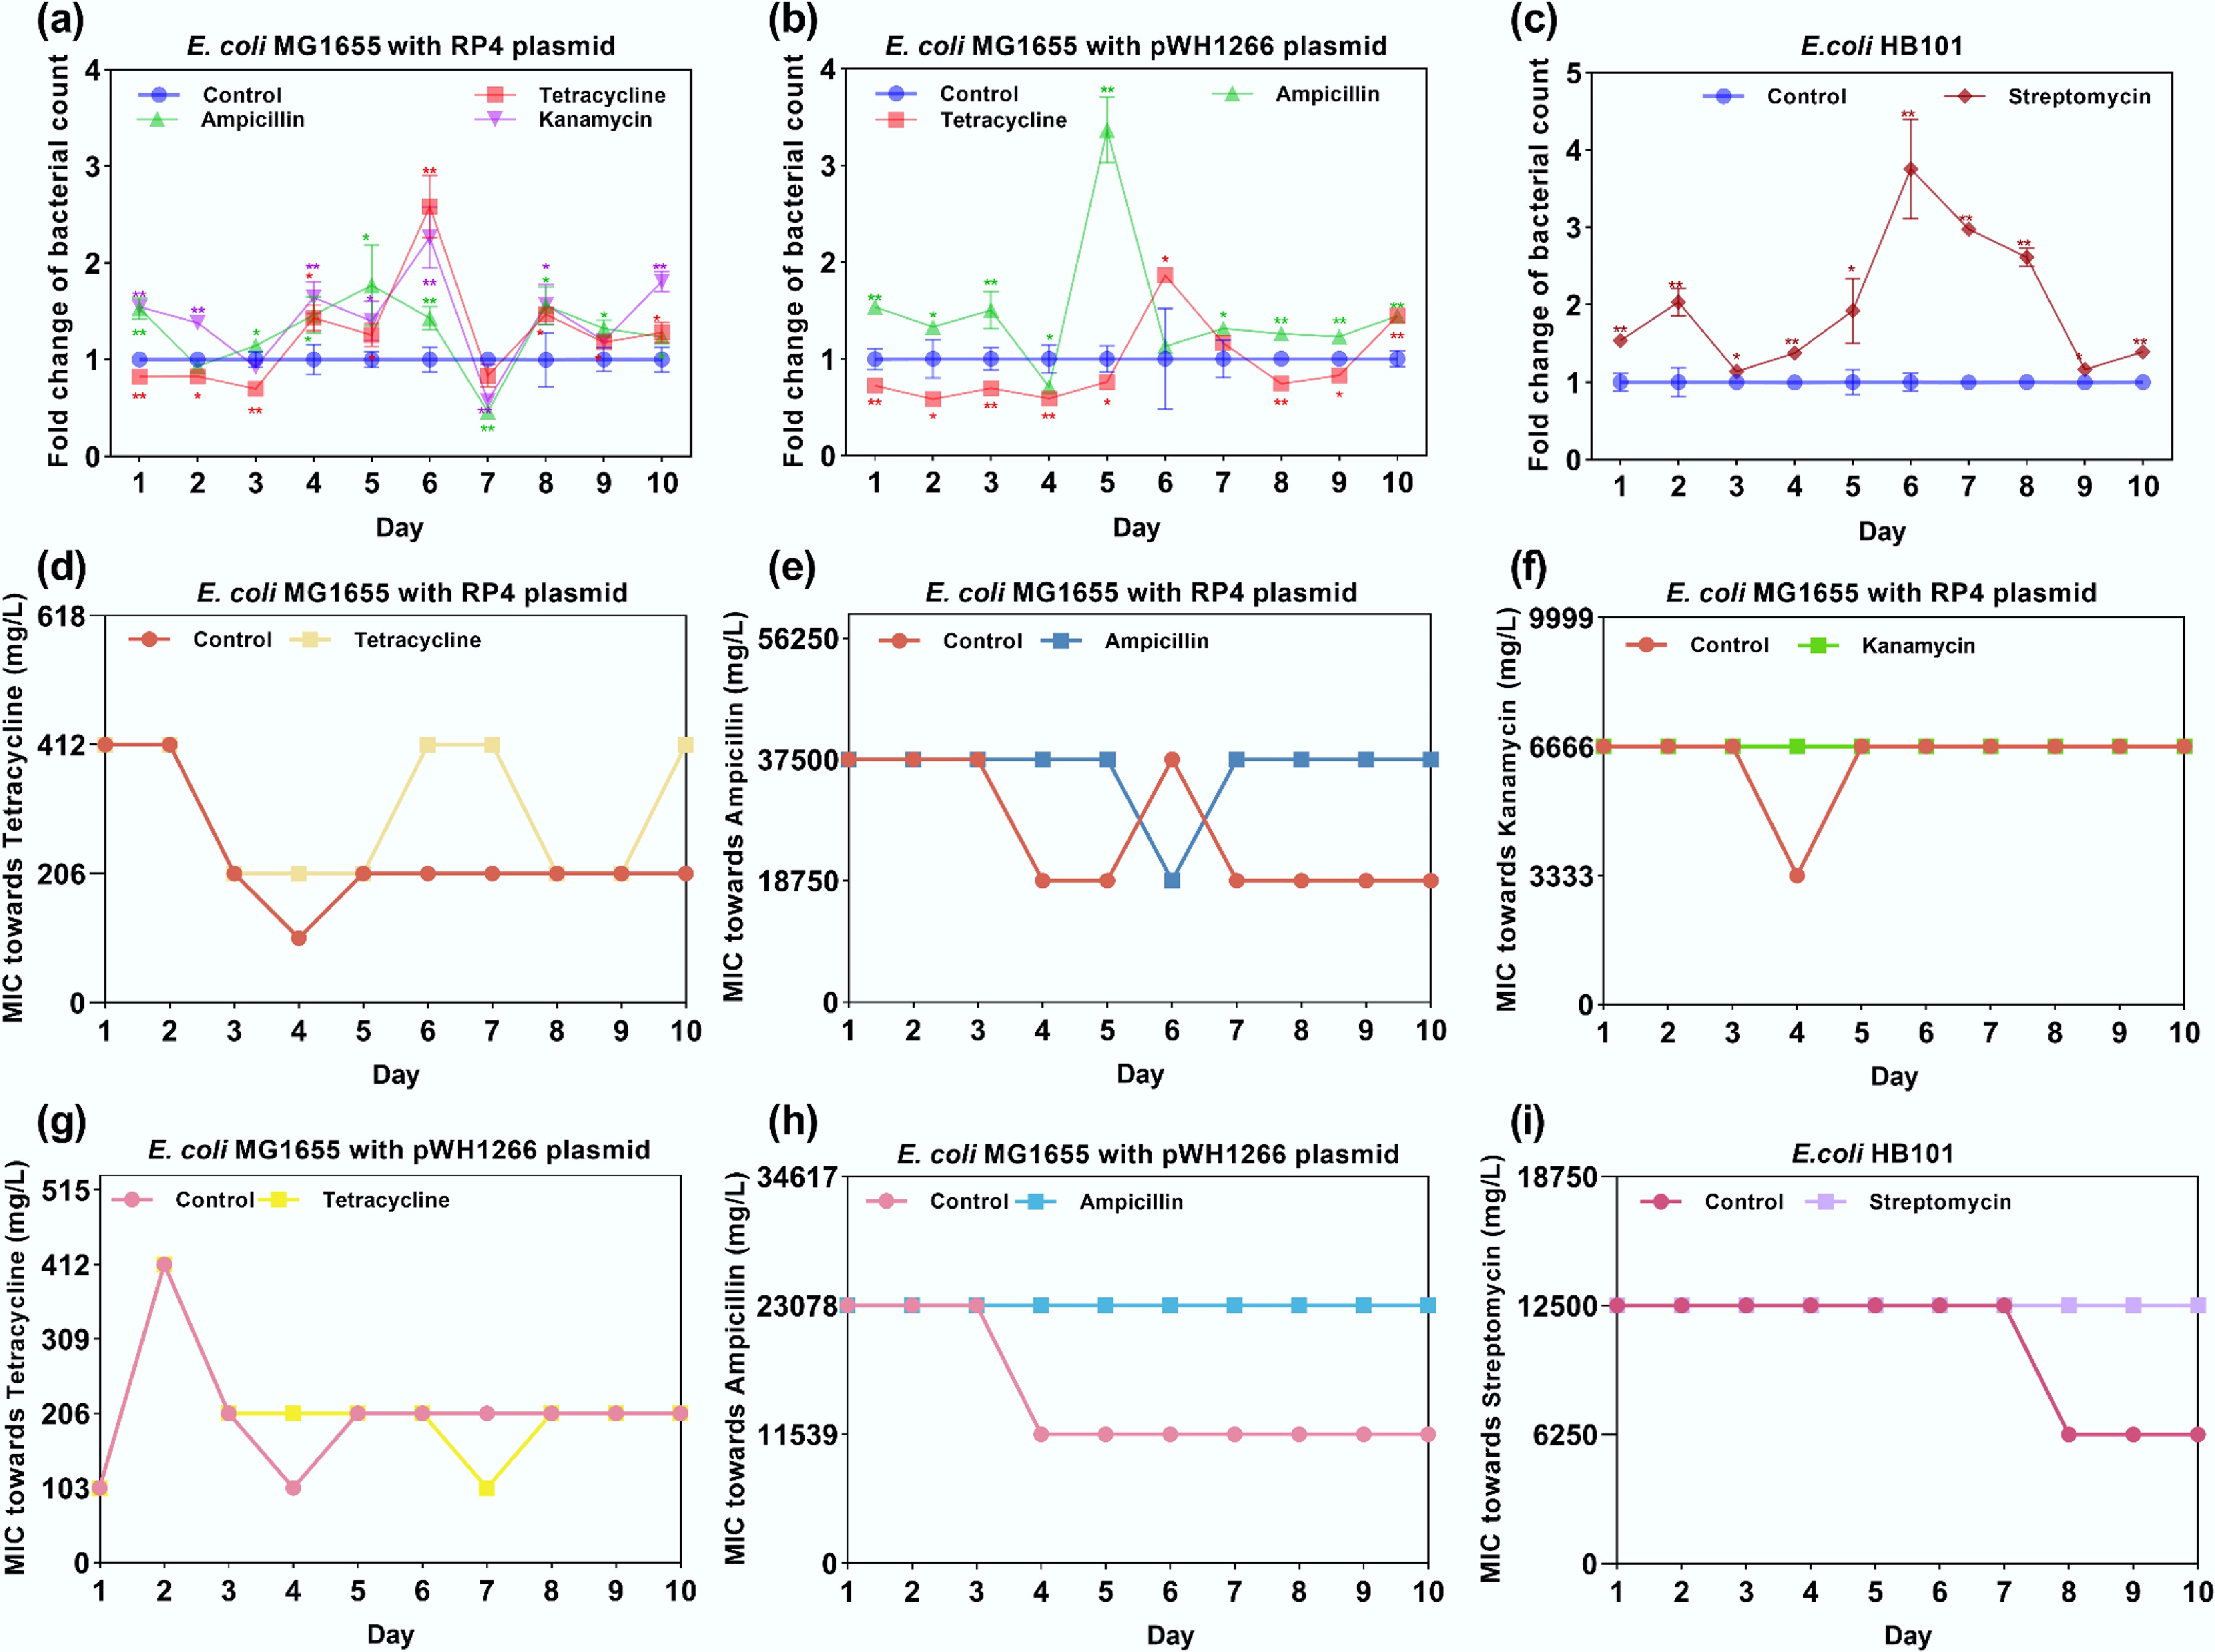
Figure 1.
Fold change in bacterial counts and MIC variation under exposure to antibiotics. (a) Fold change in bacterial counts for E. coli MG1655 with the RP4 plasmid. (b) Fold change in bacterial counts for E. coli MG1655 with the pWH1266 plasmid. (c) Fold change in bacterial counts for E. coli HB101. (d) MIC variations of E. coli MG1655 with the RP4 plasmid treated with tetracycline. (e) MIC variations of E. coli MG1655 with the RP4 plasmid treated with ampicillin. (f) MIC variations of E. coli MG1655 with the RP4 plasmid treated with kanamycin. (g) MIC variations of E. coli MG1655 with the pWH1266 plasmid treated with tetracycline. (h) MIC variations of E. coli MG1655 with the pWH1266 plasmid treated with ampicillin. (i) MIC variations of E. coli HB101 treated with streptomycin. Statistical significance between the antibiotic-treated and control groups was analyzed using an independent sample t-test and corrected by the Benjamini–Hochberg method, * padj < 0.05 and ** padj < 0.01. Data represent the mean ± SD of three biological replicates.
-
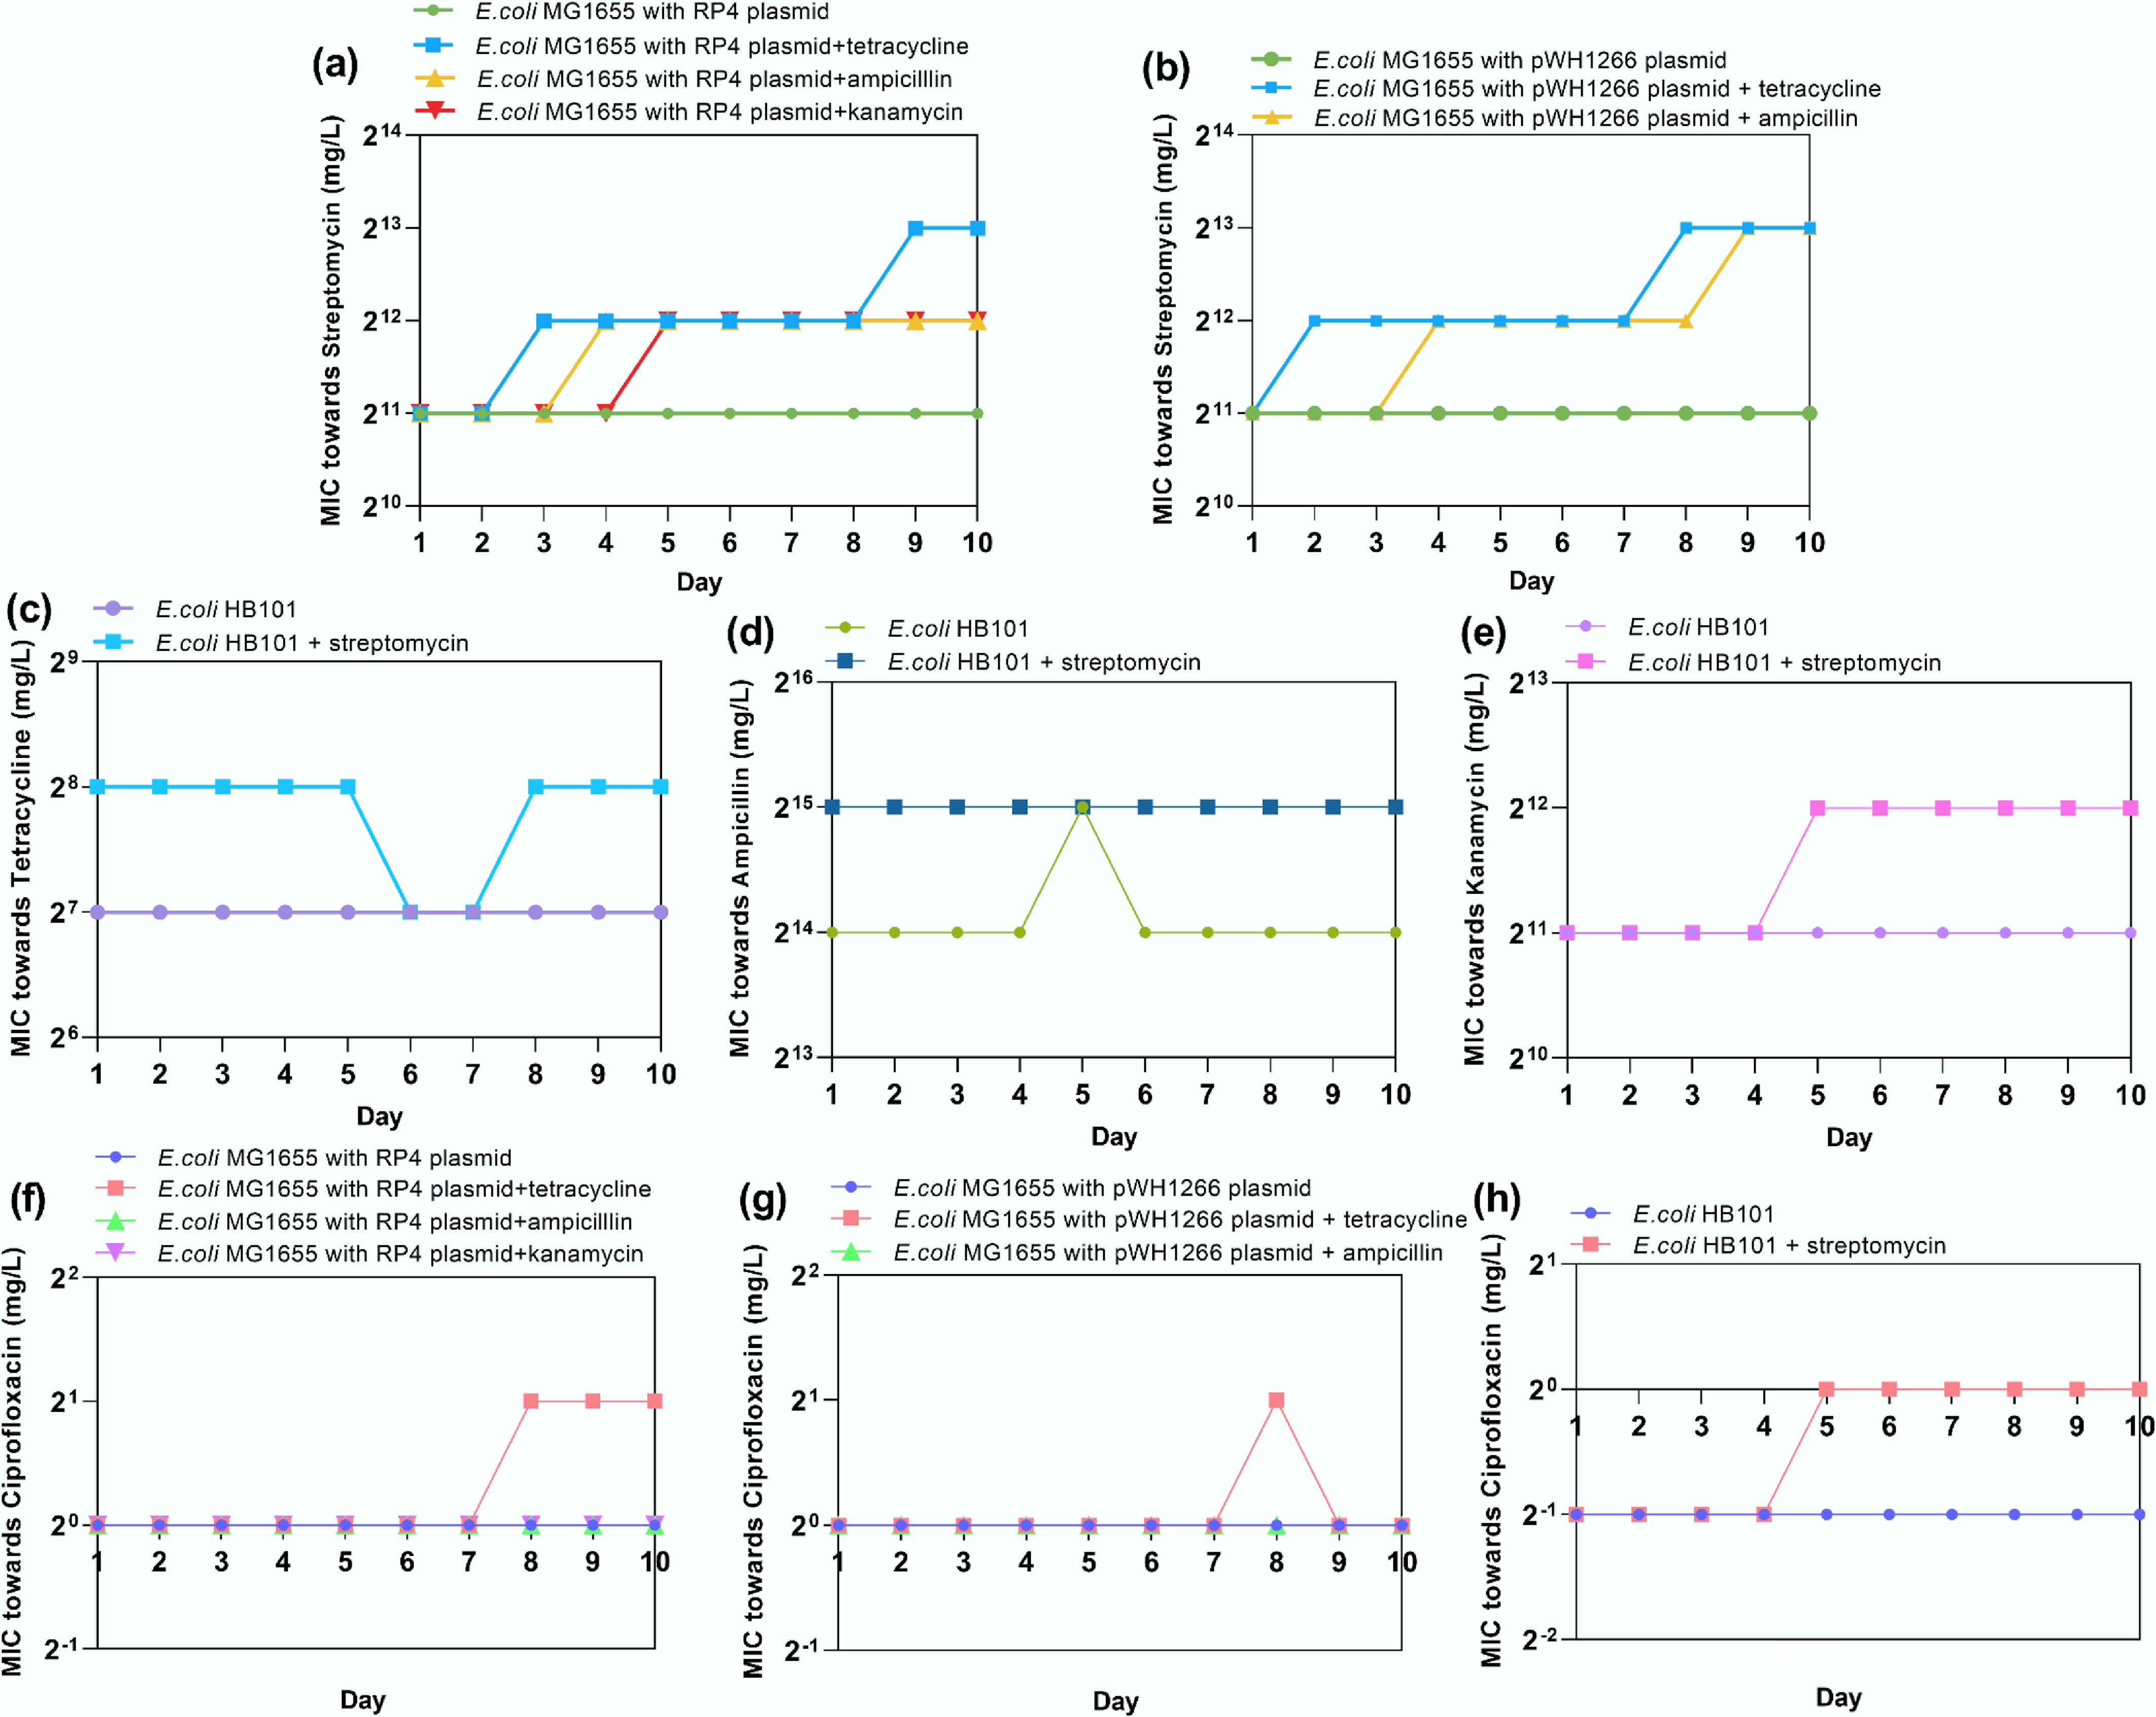
Figure 2.
(a) MIC variations of E. coli MG1655 with the RP4 plasmid treated with streptomycin. (b) MIC variations of E. coli MG1655 with the pWH1266 plasmid treated with streptomycin. (c) MIC variations of E. coli HB101 treated with tetracycline. (d) MIC variations of E. coli HB101 treated with tetracycline. (e) MIC variations of E. coli HB101 treated with ampicillin. (f) MIC variations of E. coli HB101 treated with kanamycin. (g) MIC variations of E. coli MG1655 with the RP4 plasmid treated with ciprofloxacin. (h) MIC variations of E. coli MG1655 with the pWH1266 plasmid treated with ciprofloxacin.
-
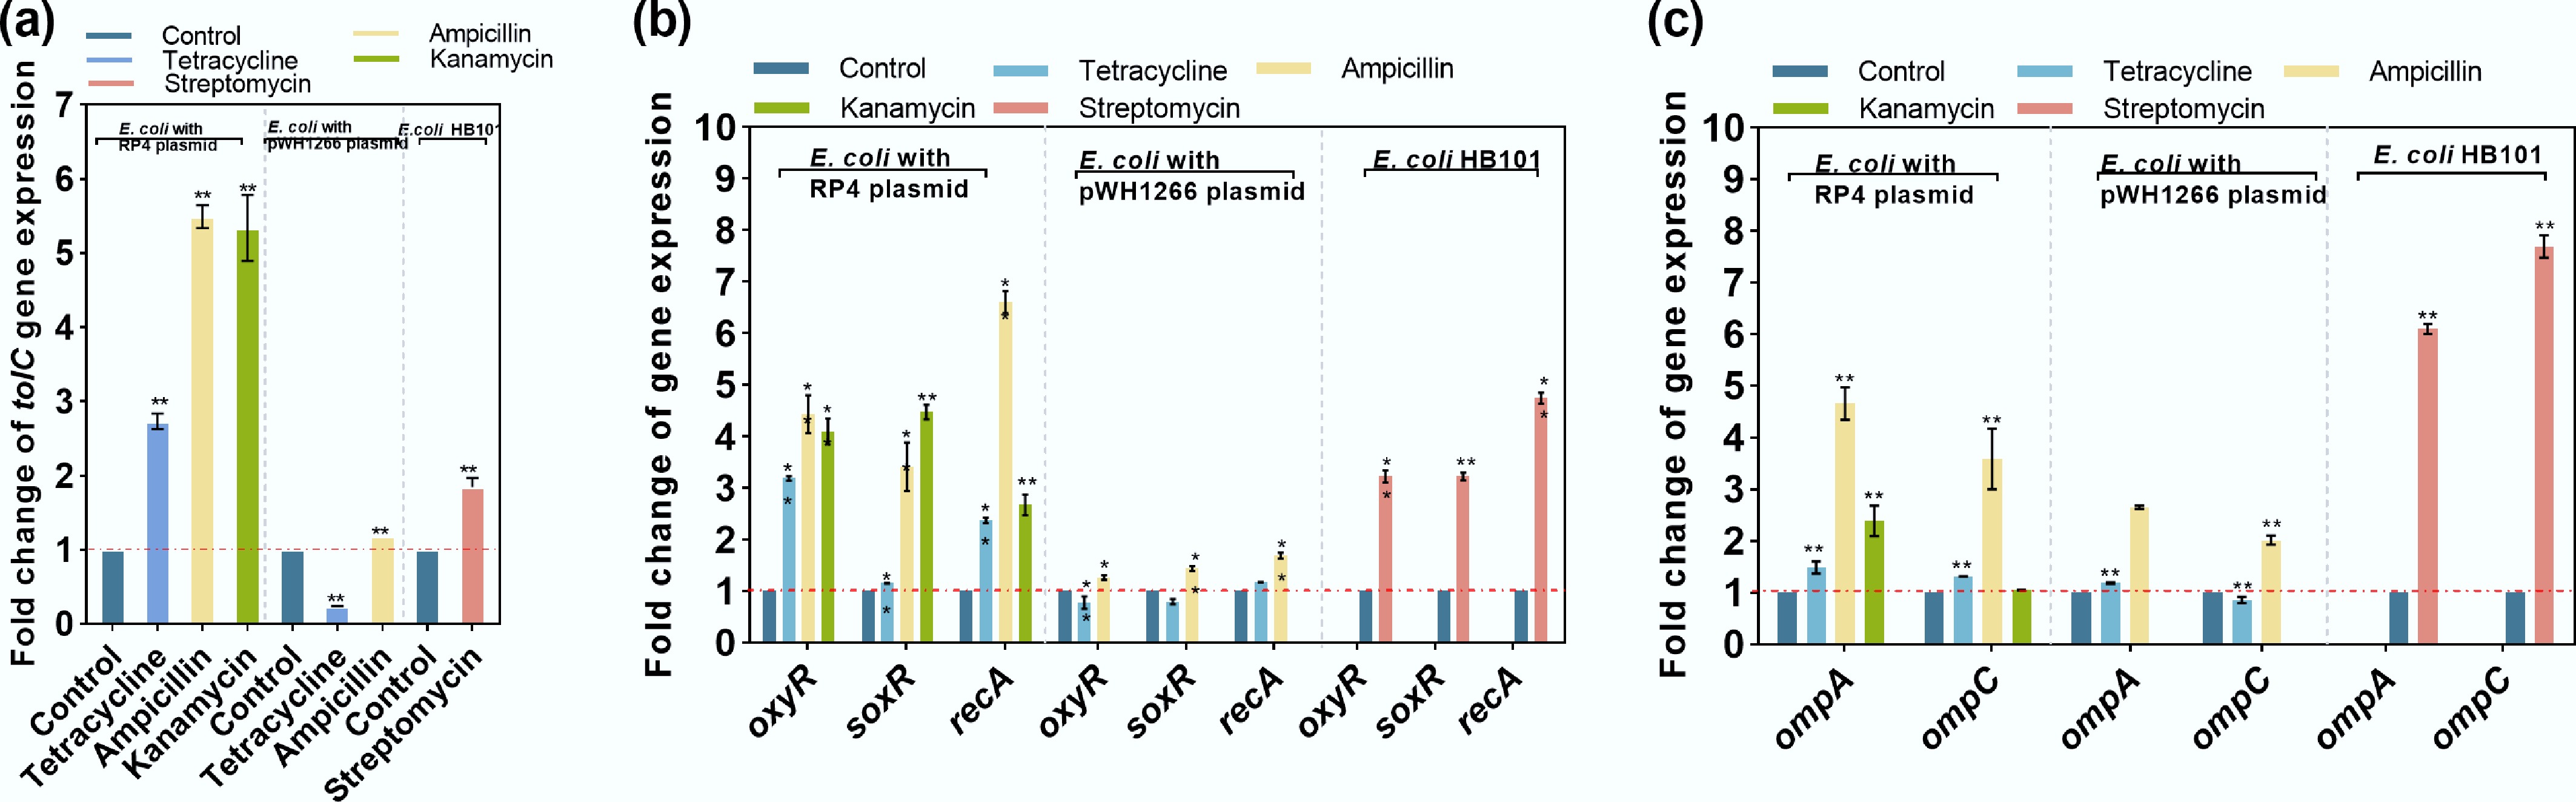
Figure 3.
Changes in the expression of key genes under exposure to antibiotics. (a) Efflux pump-related gene tolC. (b) Oxidative stress-related genes (oxyR and soxR) and an SOS response-related gene (recA). (c) Membrane porin-related genes ompA and ompC. Statistical significance between the antibiotic-treated groups and controls is indicated by * padj < 0.05 and ** padj < 0.01.
-
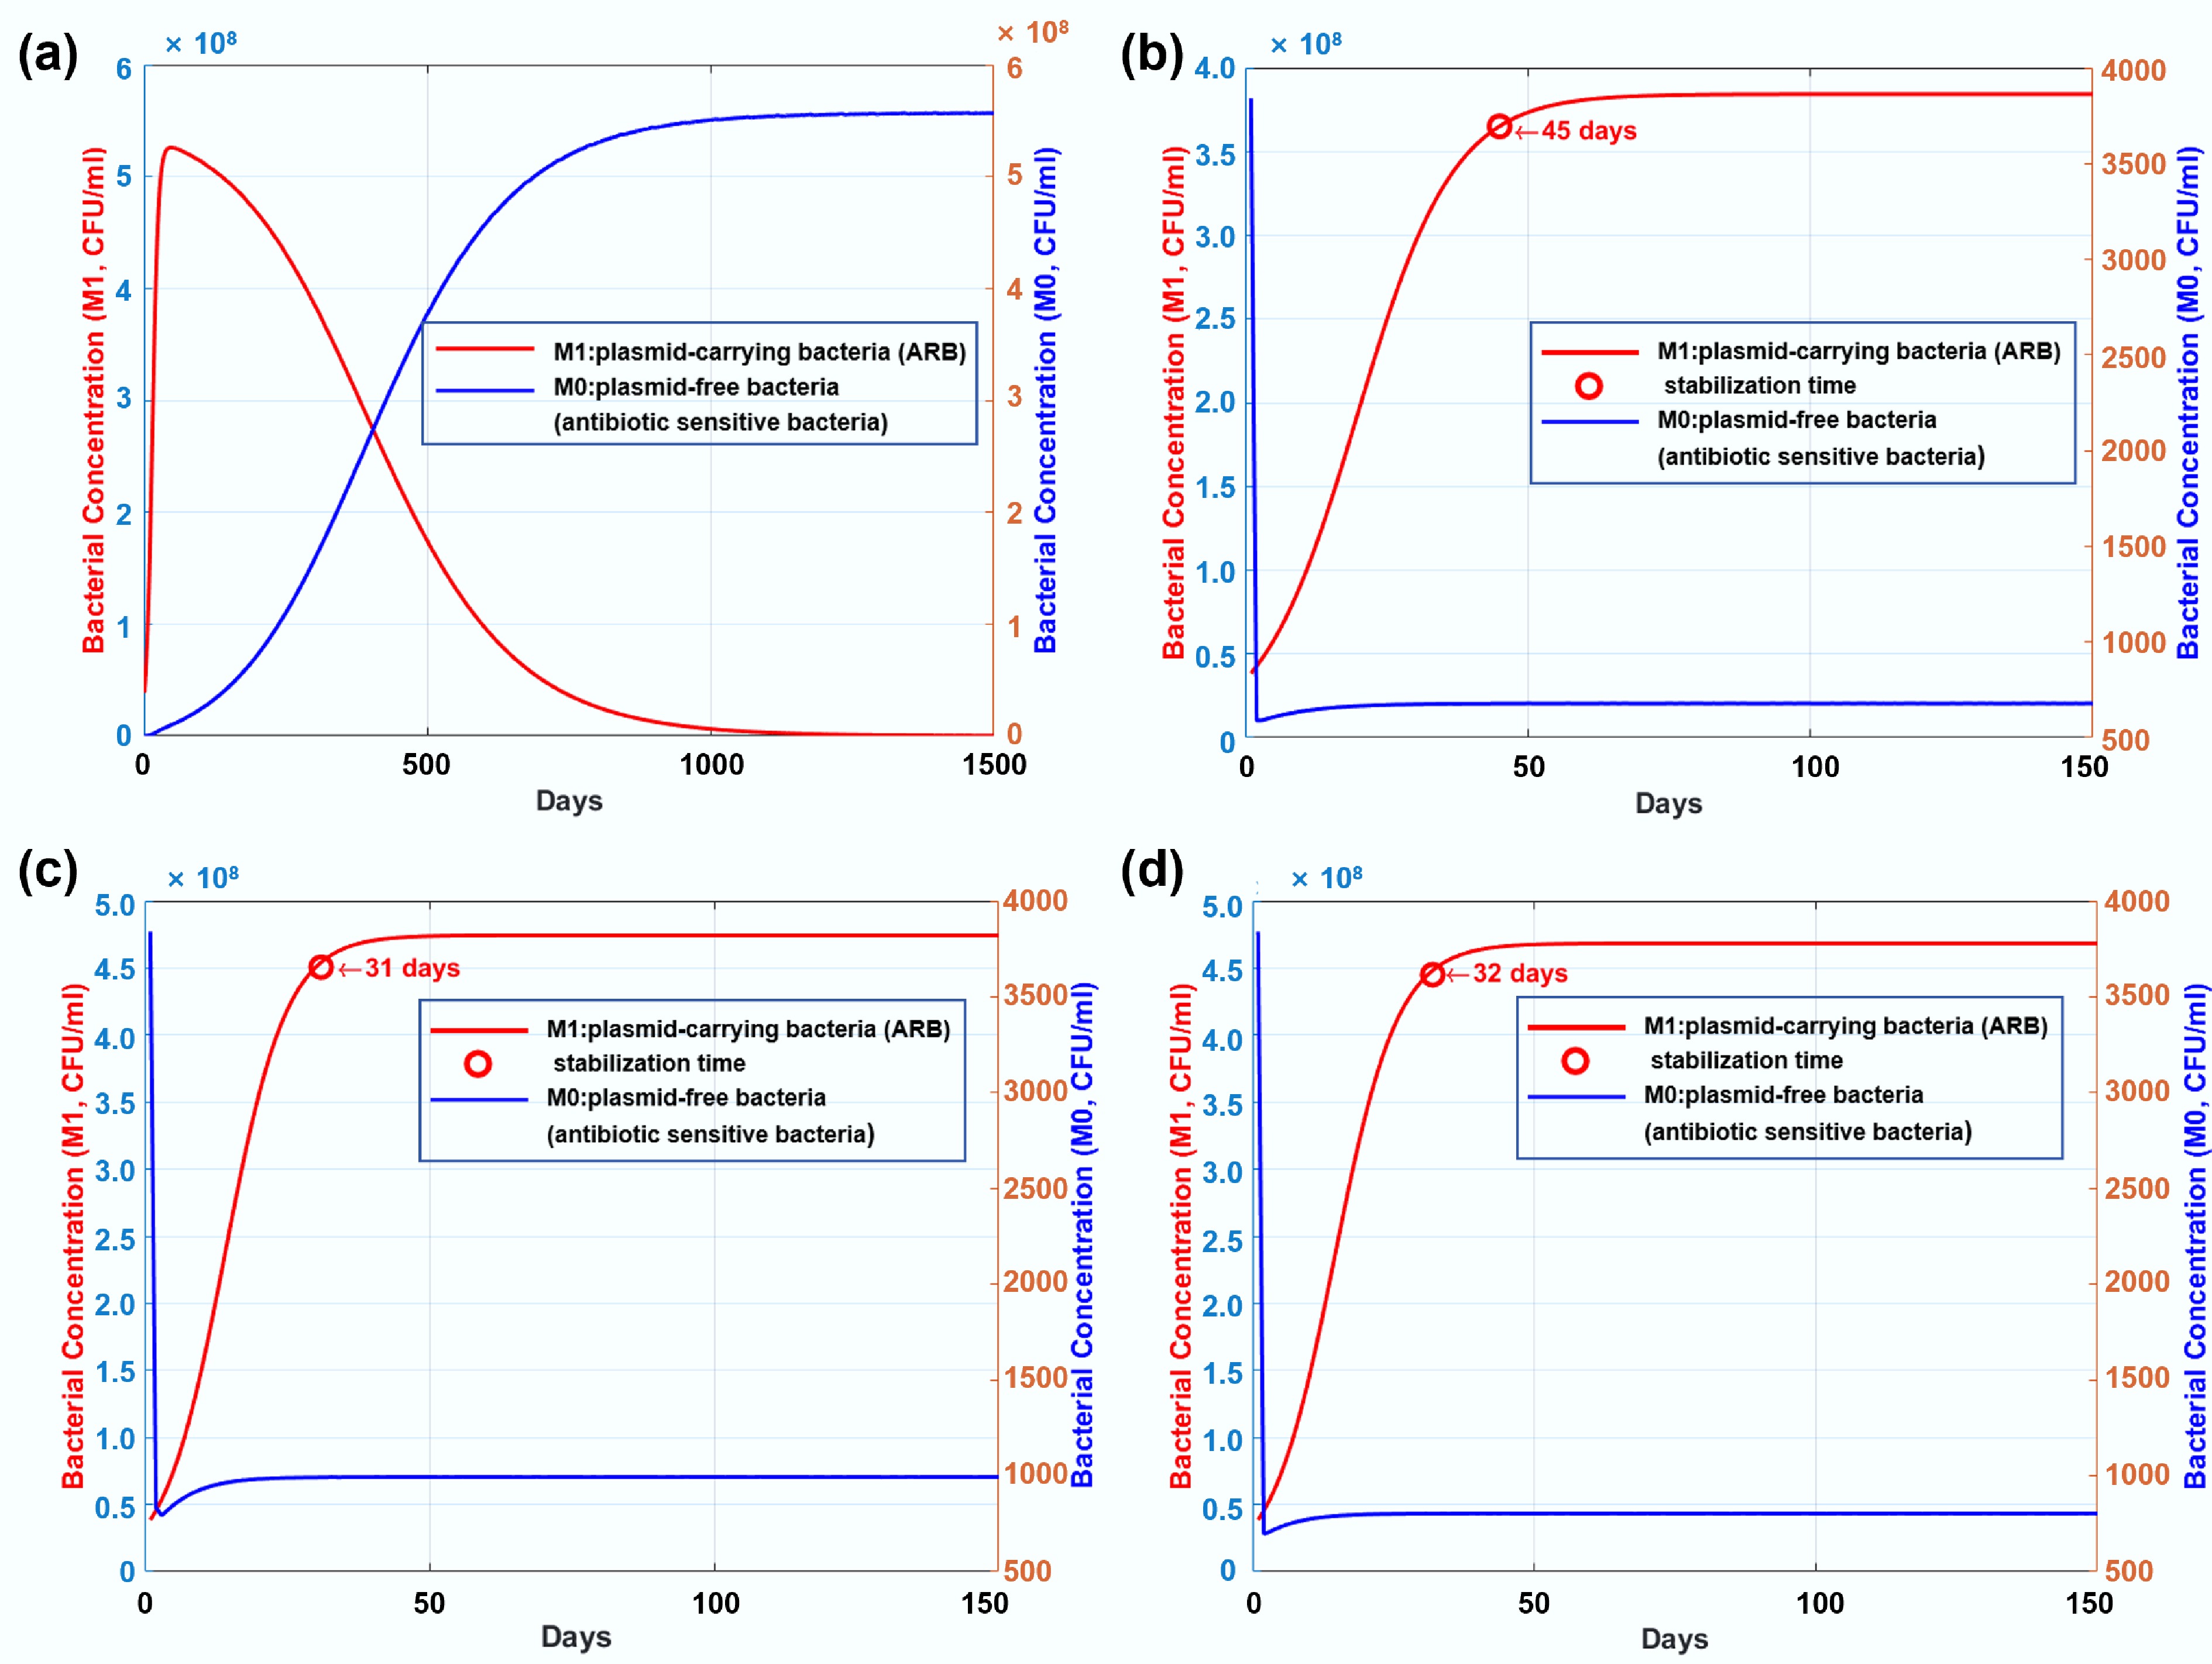
Figure 4.
(a) Long-term genetic dynamics of plasmid-carrying bacteria (ARB) and plasmid-free bacteria (antibiotic-sensitive bacteria) in the control group without any antibiotic dosage. (b) Long-term genetic dynamics of resistant and susceptible bacterial strains under exposure to tetracycline. (c) Long-term genetic dynamics of resistant and susceptible bacterial strains under exposure to kanamycin. (d) Long-term genetic dynamics of resistant and susceptible bacterial strains under exposure to ampicillin.
-
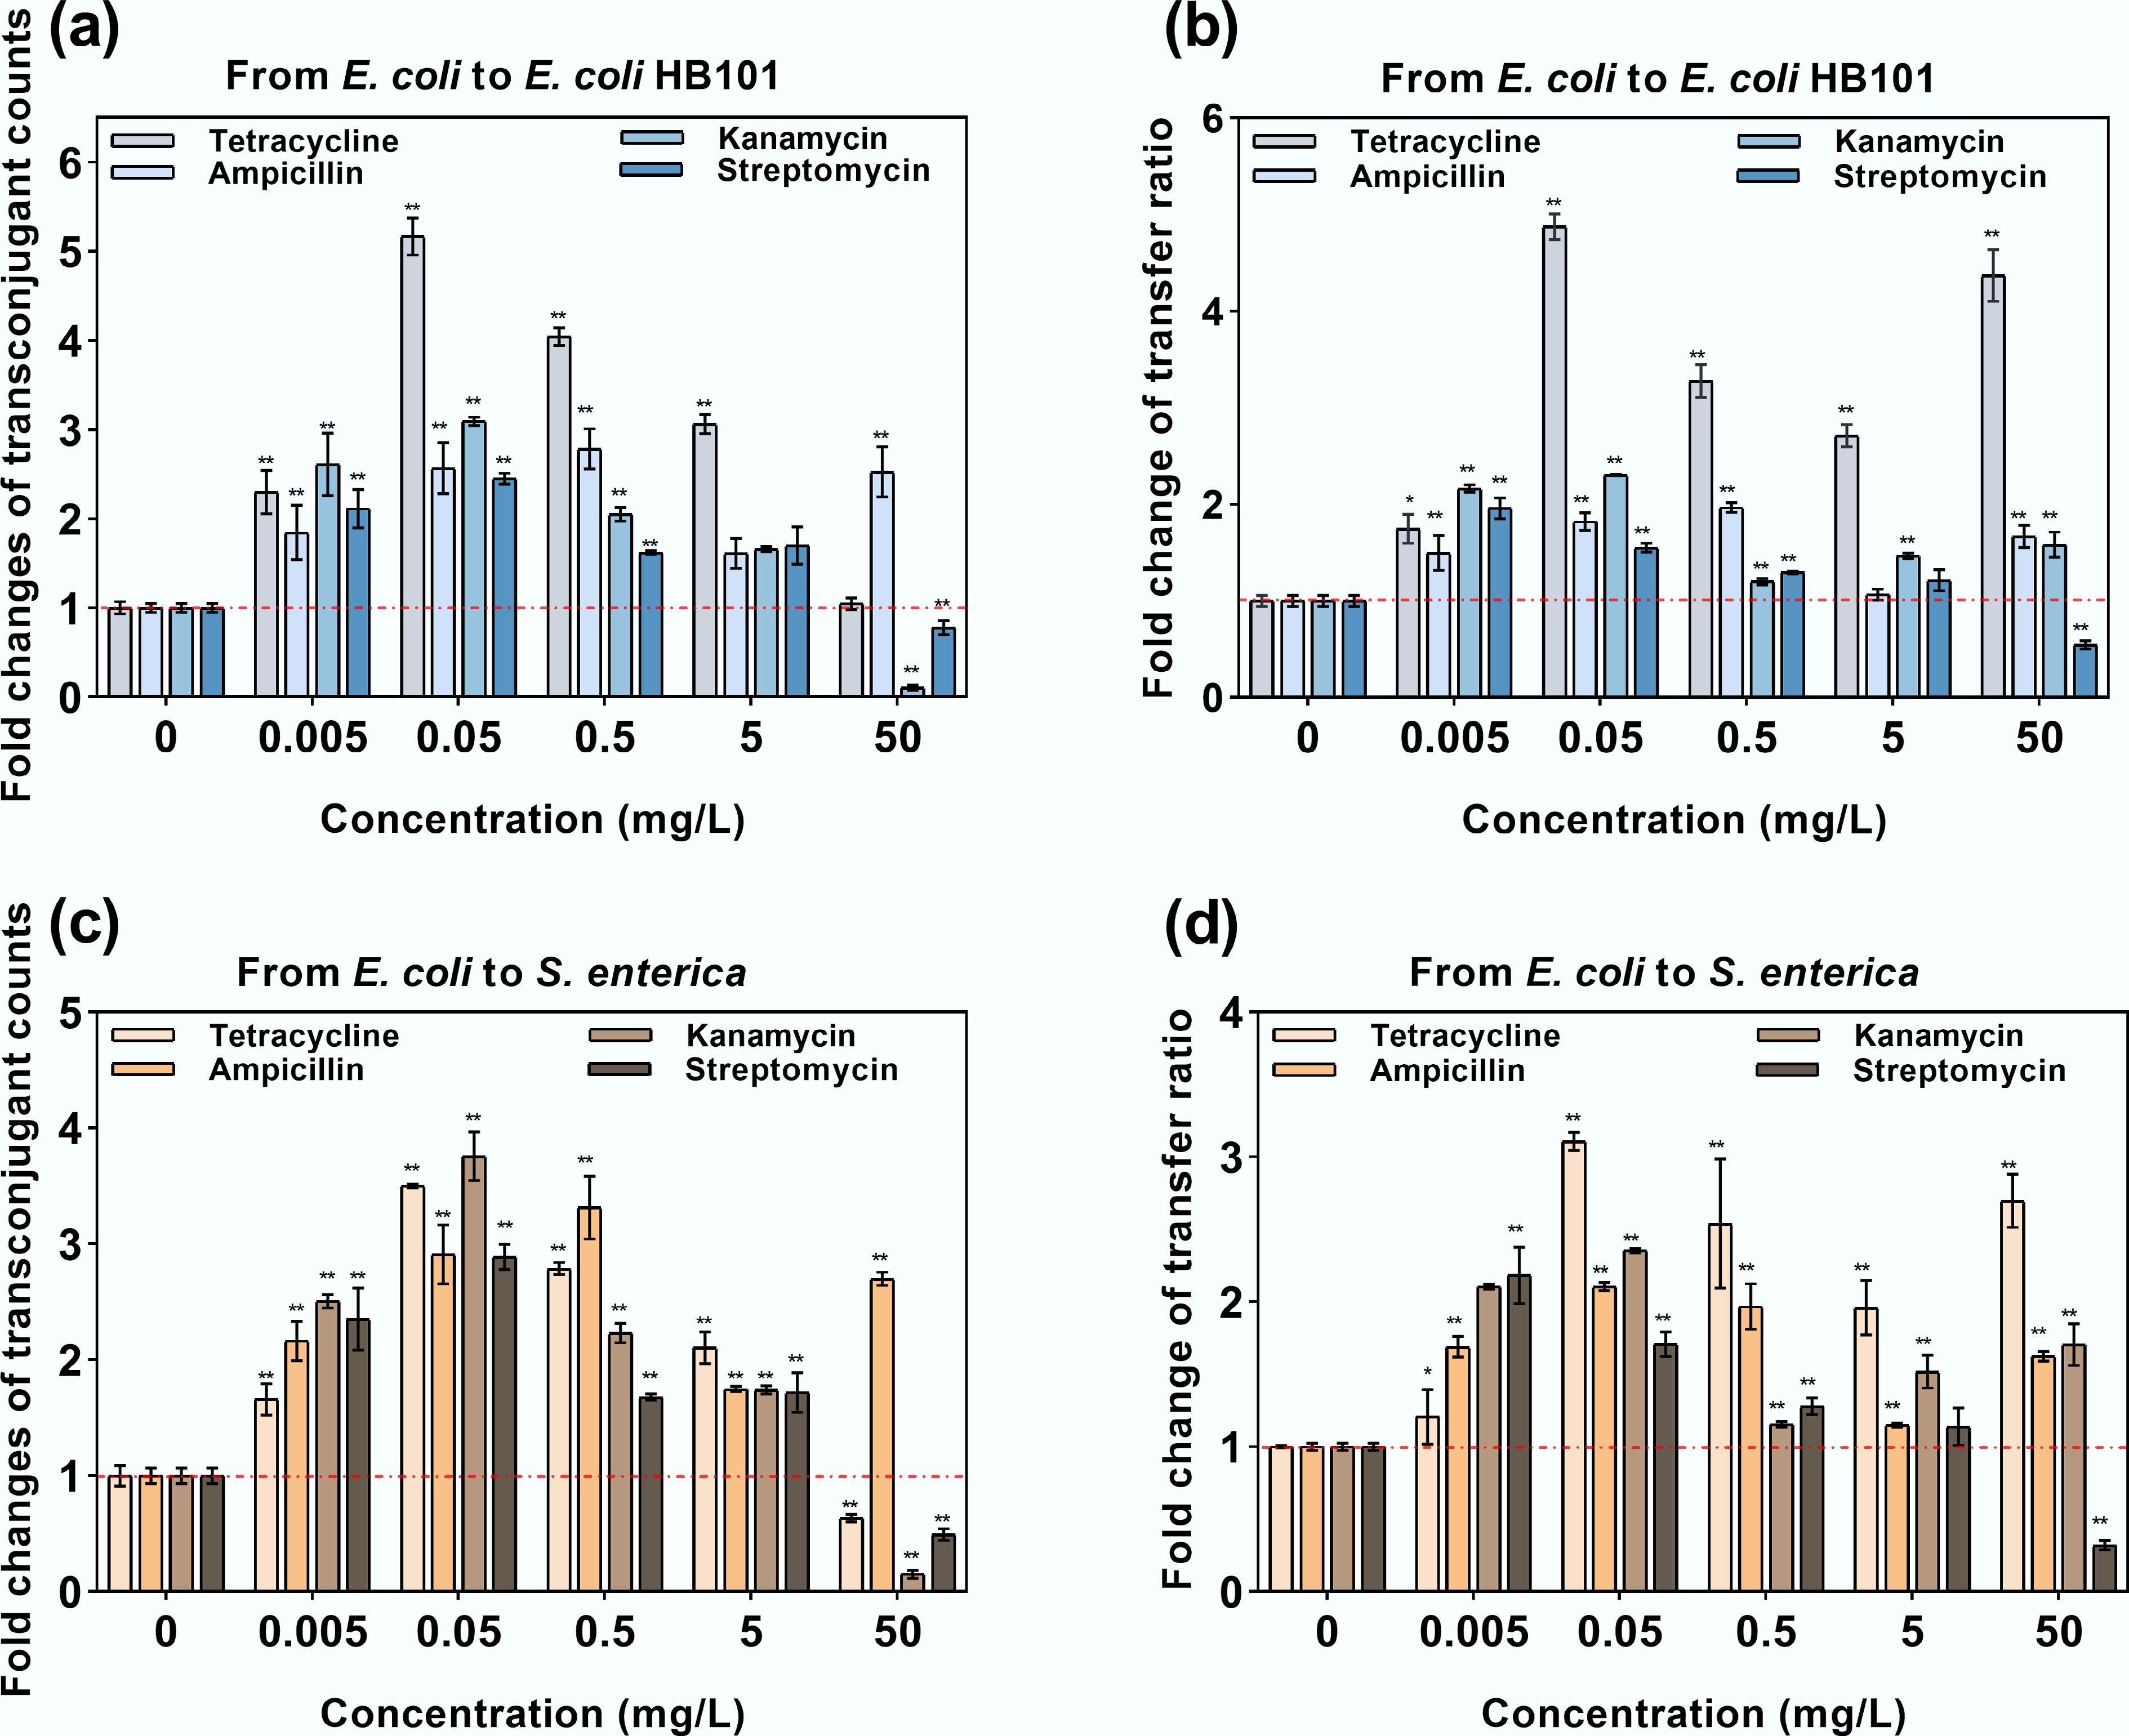
Figure 5.
Intrageneric and intergeneric conjugative transfer under exposure to antibiotics. (a) Fold change in transconjugants under intrageneric conjugative transfer. (b) Fold change in the transfer ratio under intrageneric conjugative transfer. (c) Fold change in transconjugants under intergeneric conjugative transfer. (d) Fold change in the transfer ratio under intergenic conjugative transfer. Statistical significance between the antibiotic-treated and control groups was analyzed using an independent sample t-test and corrected by the Benjamini–Hochberg method, * padj < 0.05 and ** padj < 0.01. Data represent the mean ± SD of three biological replicates.
-
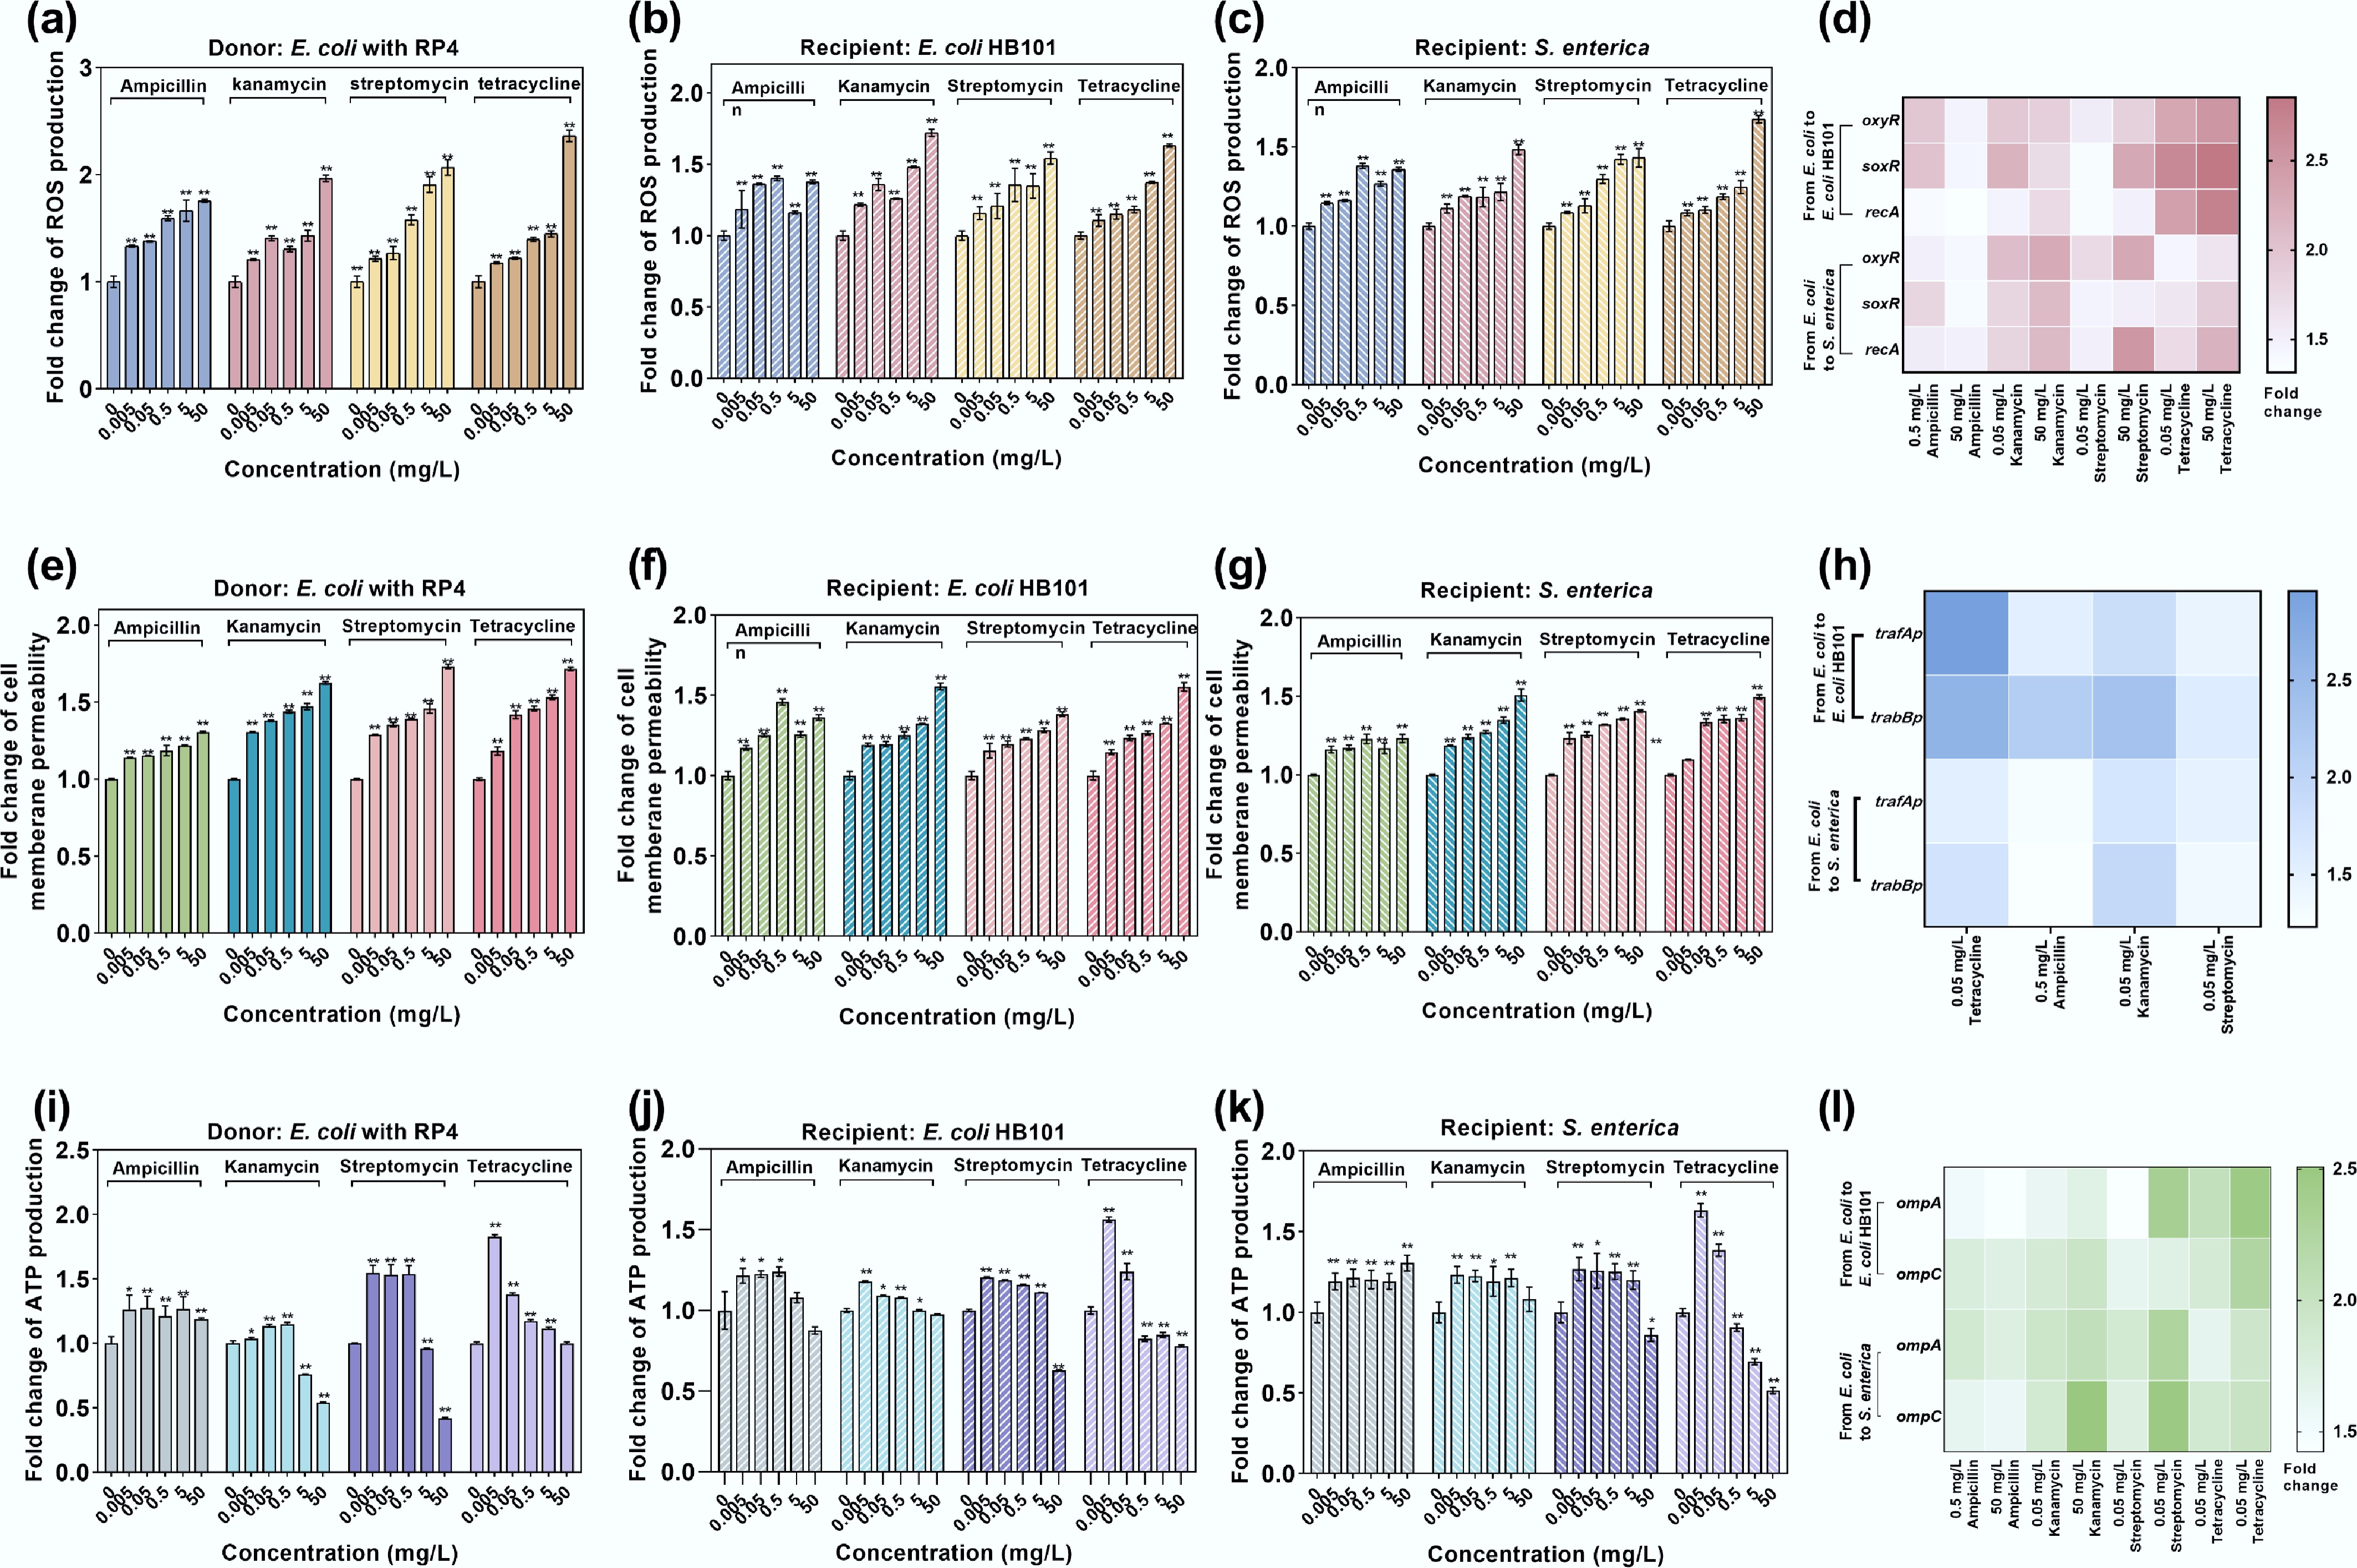
Figure 6.
Bacterial ROS production, cell membrane permeability, and ATP production under the exposure to antibiotics in conjugative systems. (a) ROS production in donor E. coli MG1655 with the RP4 plasmid. (b) ROS production in the intraspecies recipient E. coli HB101. (c) ROS production in the interspecies recipient bacteria S. enterica. (d) Fold changes in the expression of key oxidative stress-related genes in intrageneric and intergeneric conjugative systems. (e) Fold change in cell membrane permeability in donor E. coli MG1655 with the RP4 plasmid. (f) Fold change in cell membrane permeability in the intraspecies recipient E. coli HB101. (g) Fold change in cell membrane permeability of interspecies recipient S. enterica. (h) Fold change in the expression of key membrane porin-related genes in intrageneric and intergeneric conjugative systems. (i) Fold change in ATP production in donor E. coli MG1655 with the RP4 plasmid. (j) Fold change in ATP production in the intraspecies recipient E. coli HB101. (k) Fold change in ATP production in the interspecies recipient S. enterica. (l) Fold changes in the expression of conjugative regulation genes in intrageneric and intergeneric conjugative systems. Statistical significance between the antibiotic-treated and control groups was analyzed using an independent sample t-test and corrected by the Benjamini–Hochberg method, * padj < 0.05 and ** padj < 0.01. Data represent the mean ± SD of biological triplicates.
-
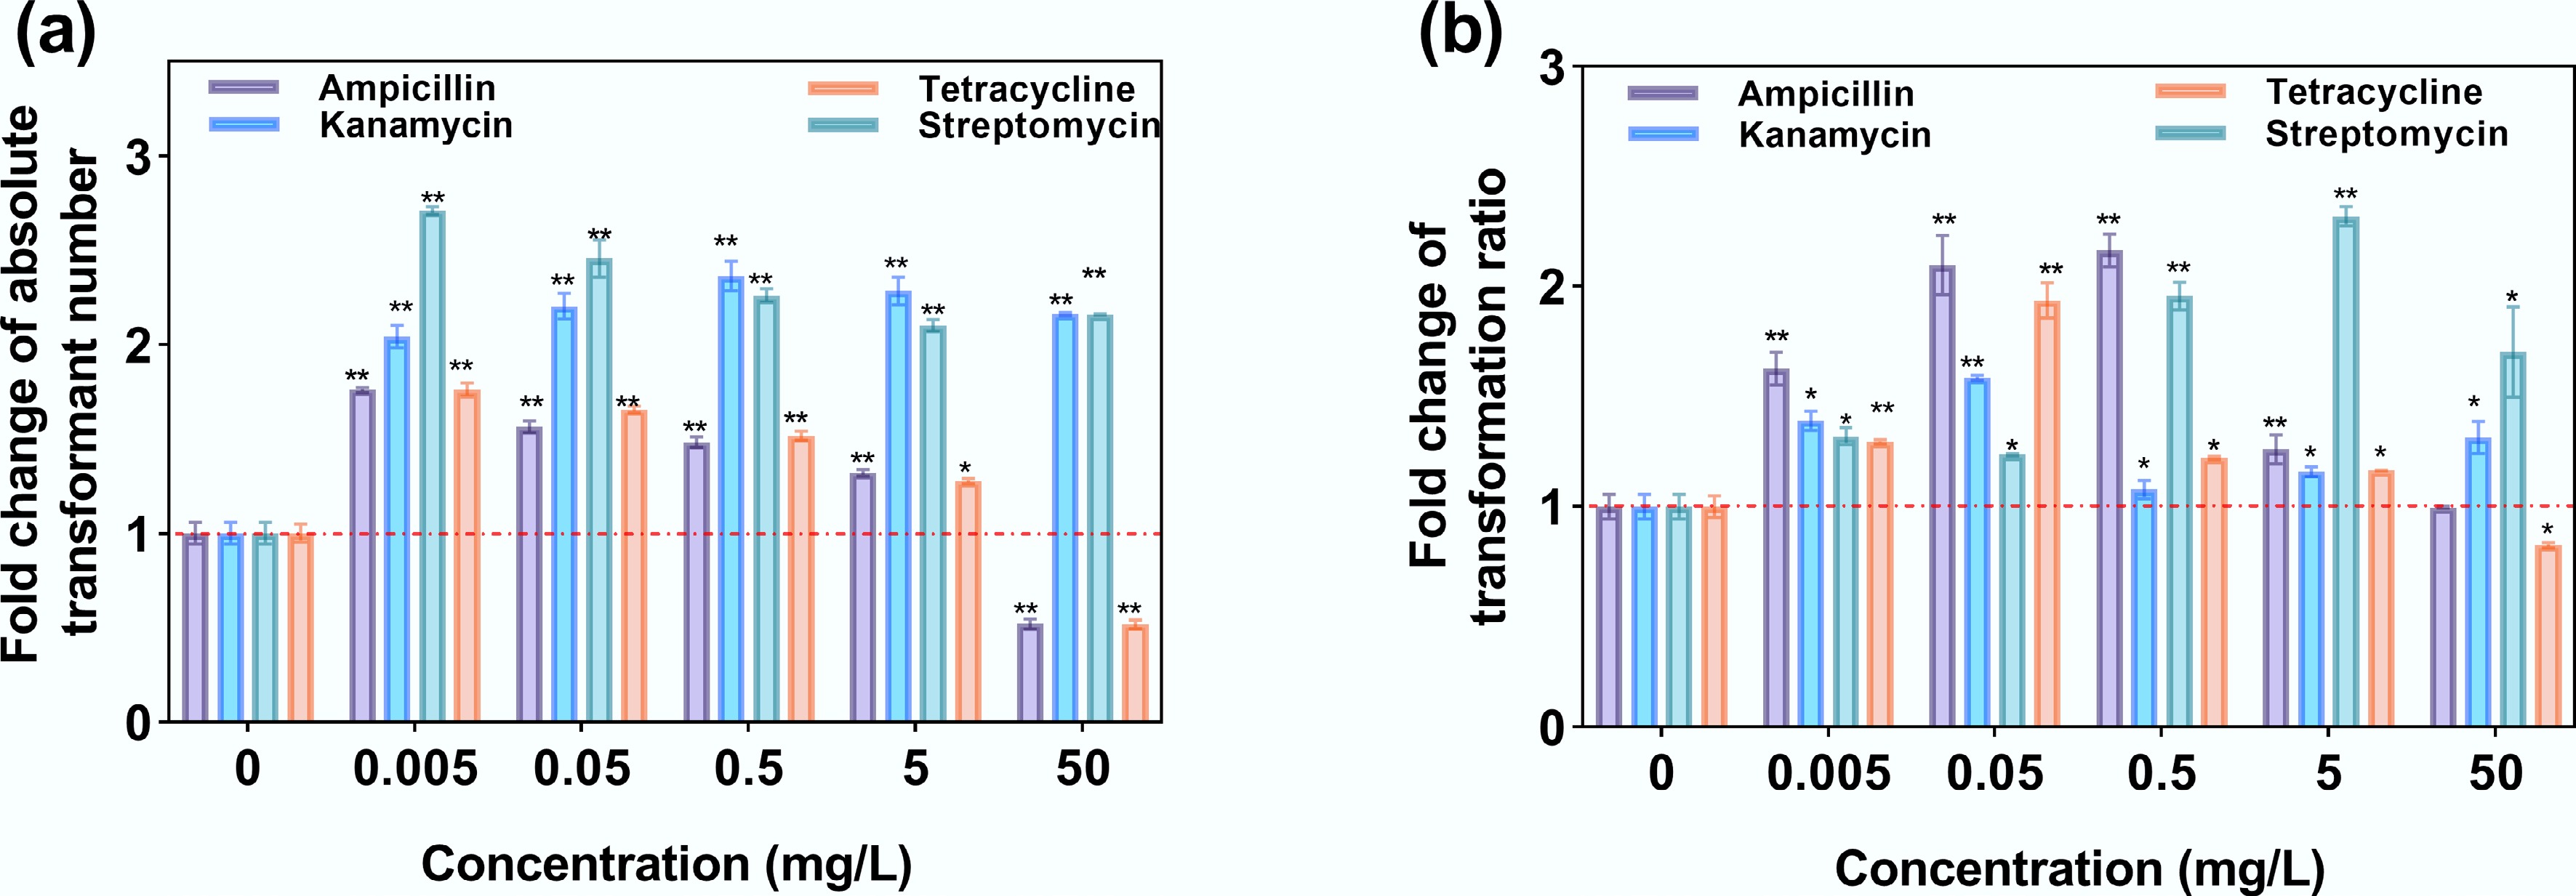
Figure 7.
Transformation under exposure to antibiotics. (a) Fold change in absolute transformant number. (b) Fold change in the transformation ratio.
-
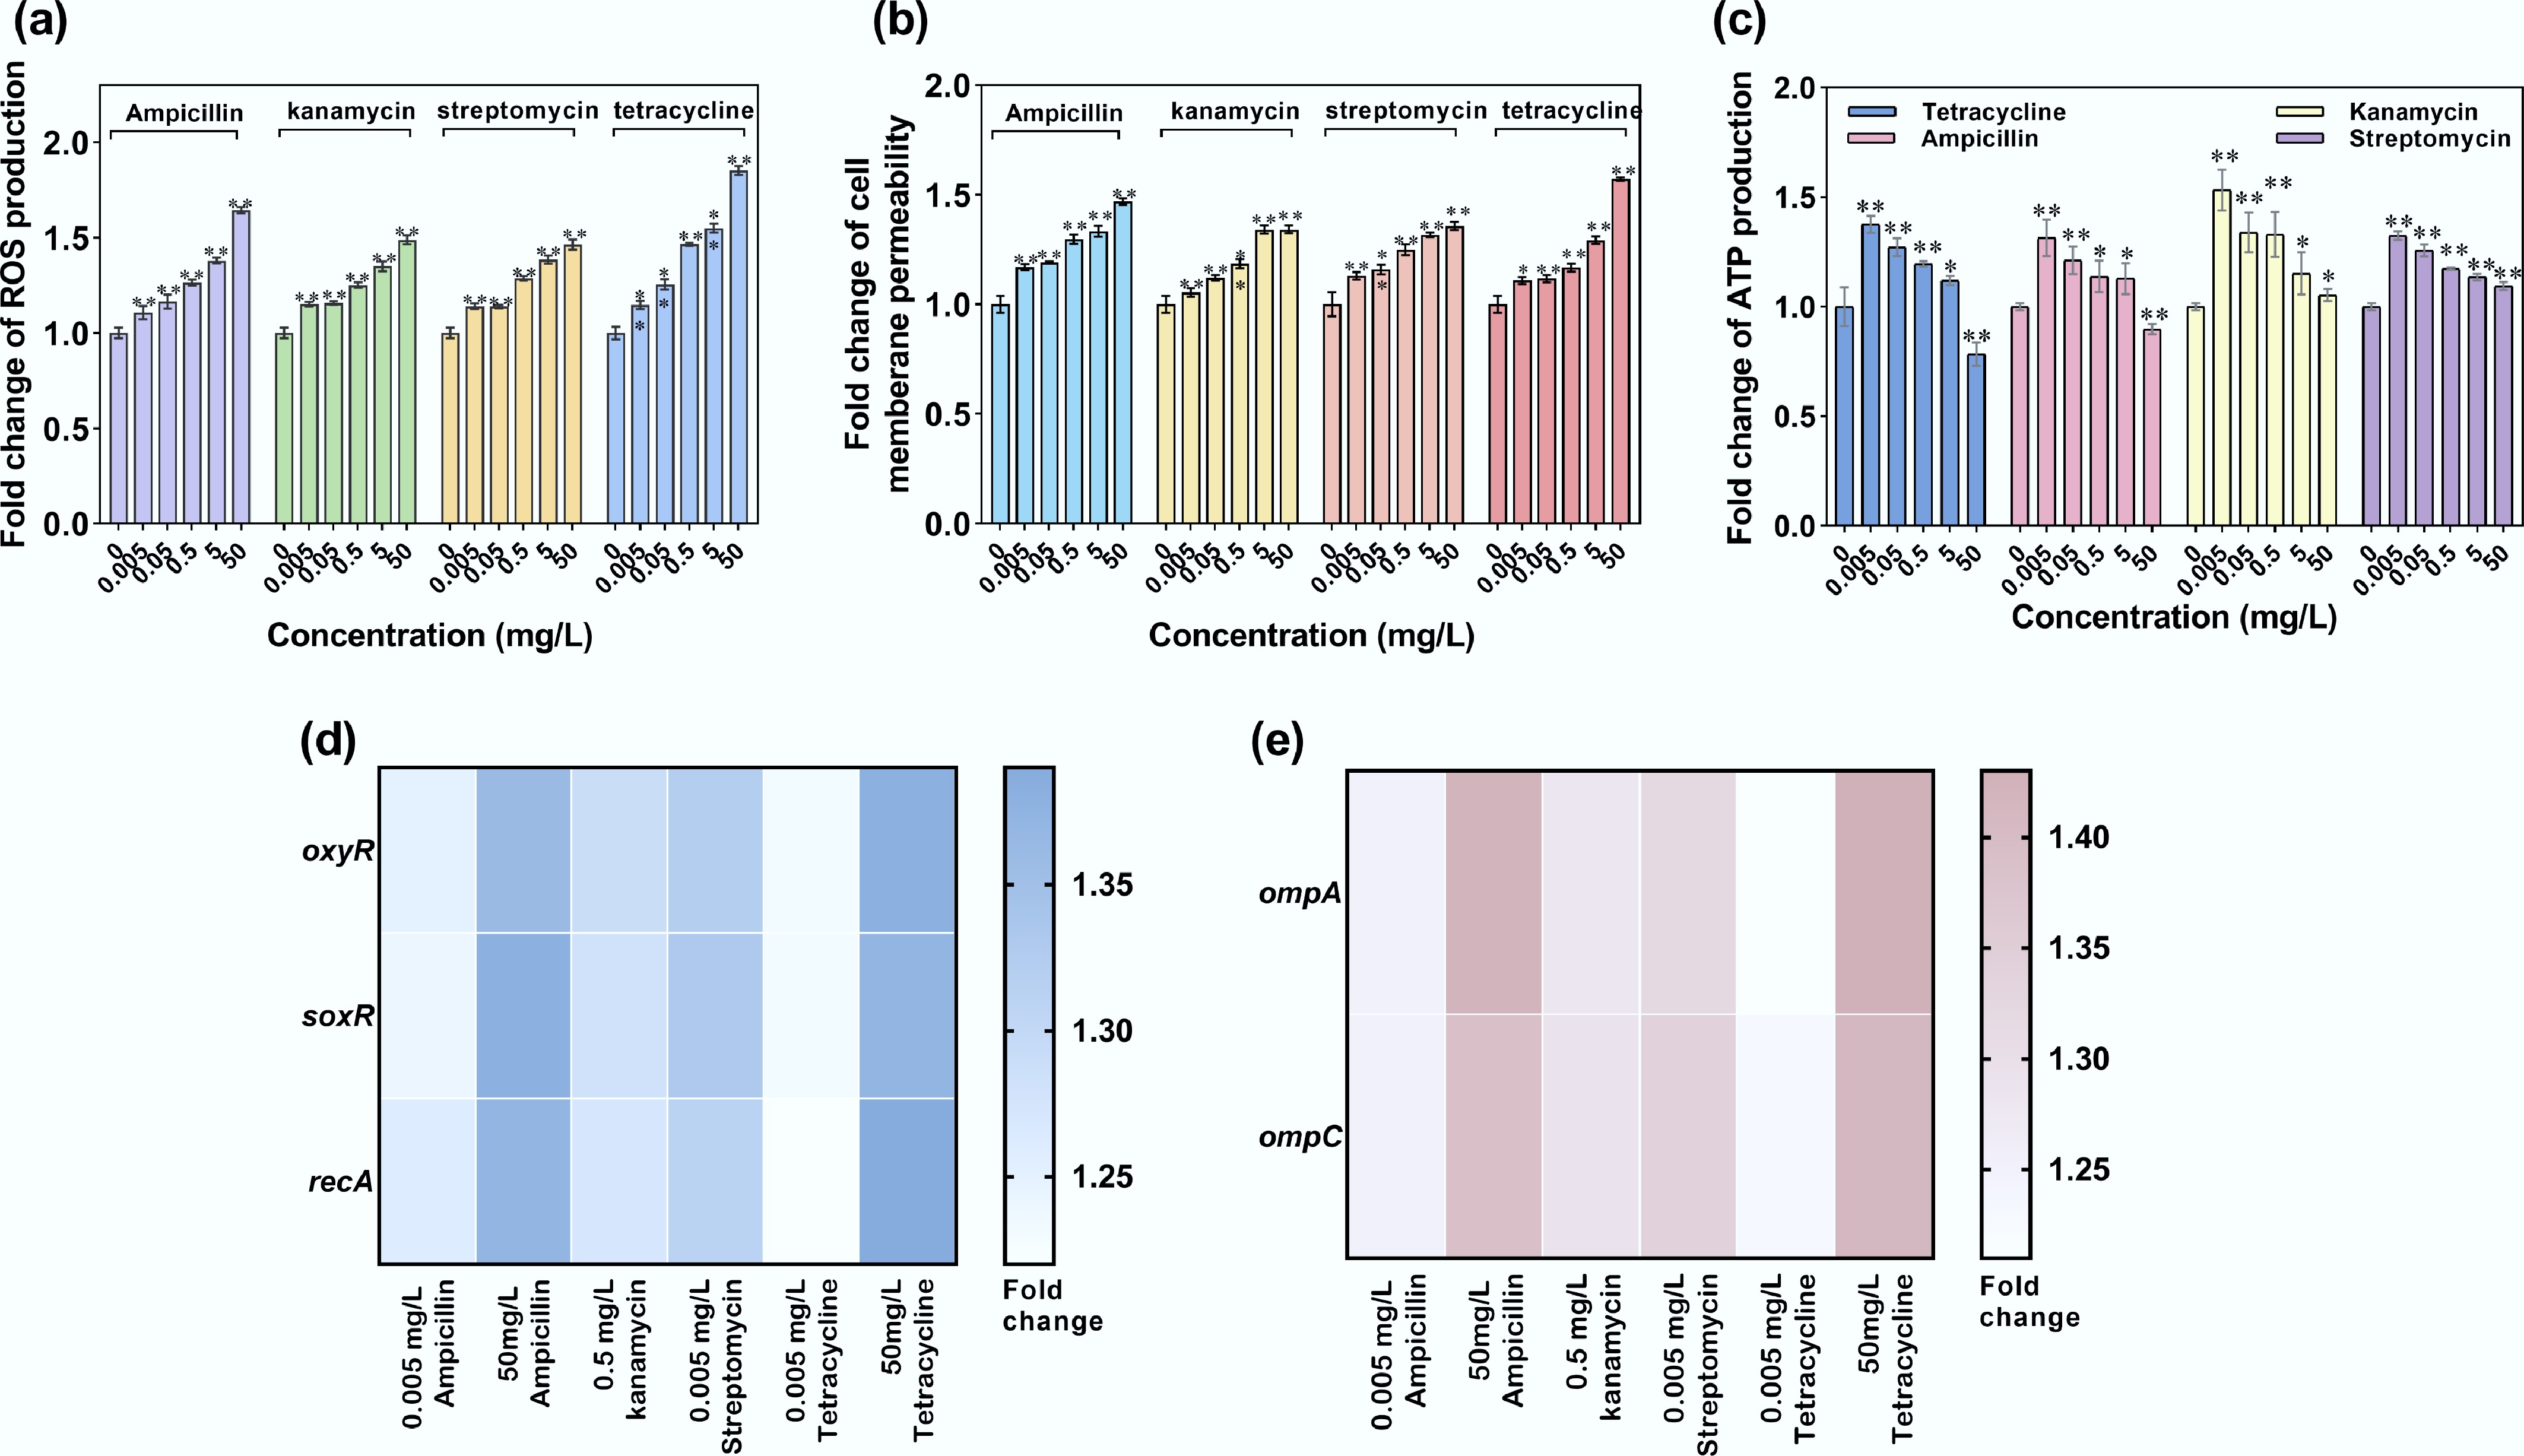
Figure 8.
ROS production, cell membrane permeability, and ATP production of recipient A. baylyi ADP1 under exposure to antibiotics. (a) Fold change in ROS production. (b) Fold change in oxidative stress-related gene expression. (c) Fold change in cell membrane permeability. (d) Fold change in membrane porin-related gene expression. (e) Fold change in ATP production. Statistical significance between the antibiotic-treated and control groups was analyzed using an independent sample t-test and corrected by the Benjamini–Hochberg method, * padj < 0.05 and ** padj < 0.01. Data represent the mean ± SD of biological triplicates.
-
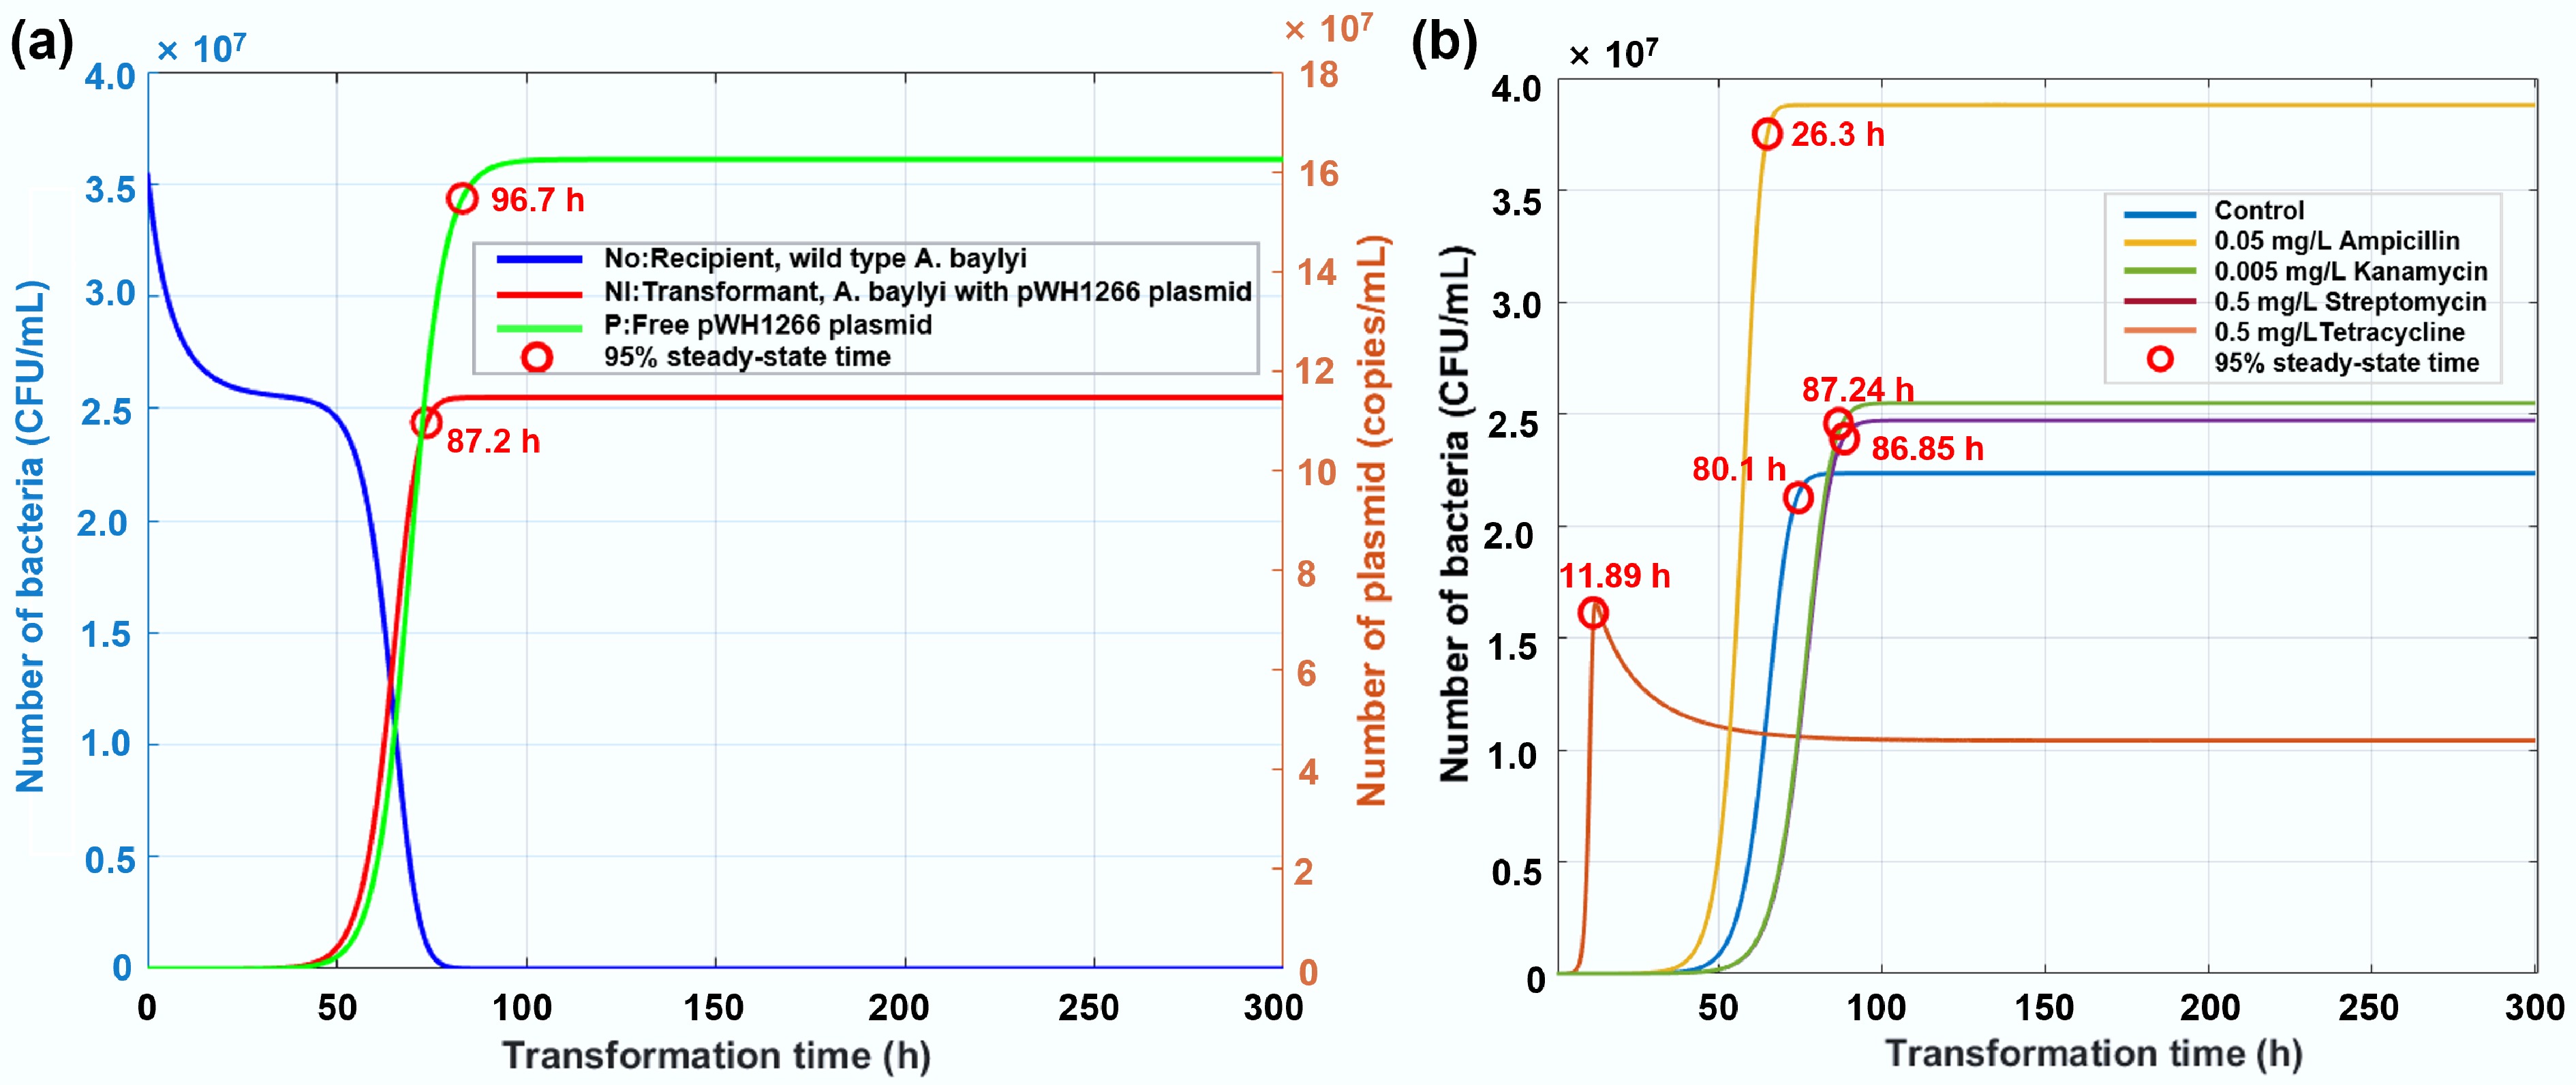
Figure 9.
Simulated changes in the number of bacteria with increased transformation time. (a) Temporal dynamics of recipient bacteria, transformants, and plasmid abundance in the absence of antibiotics. (b) Trajectories of transformant prevalence under exposure to antibiotics at environmentally relevant concentrations.
-
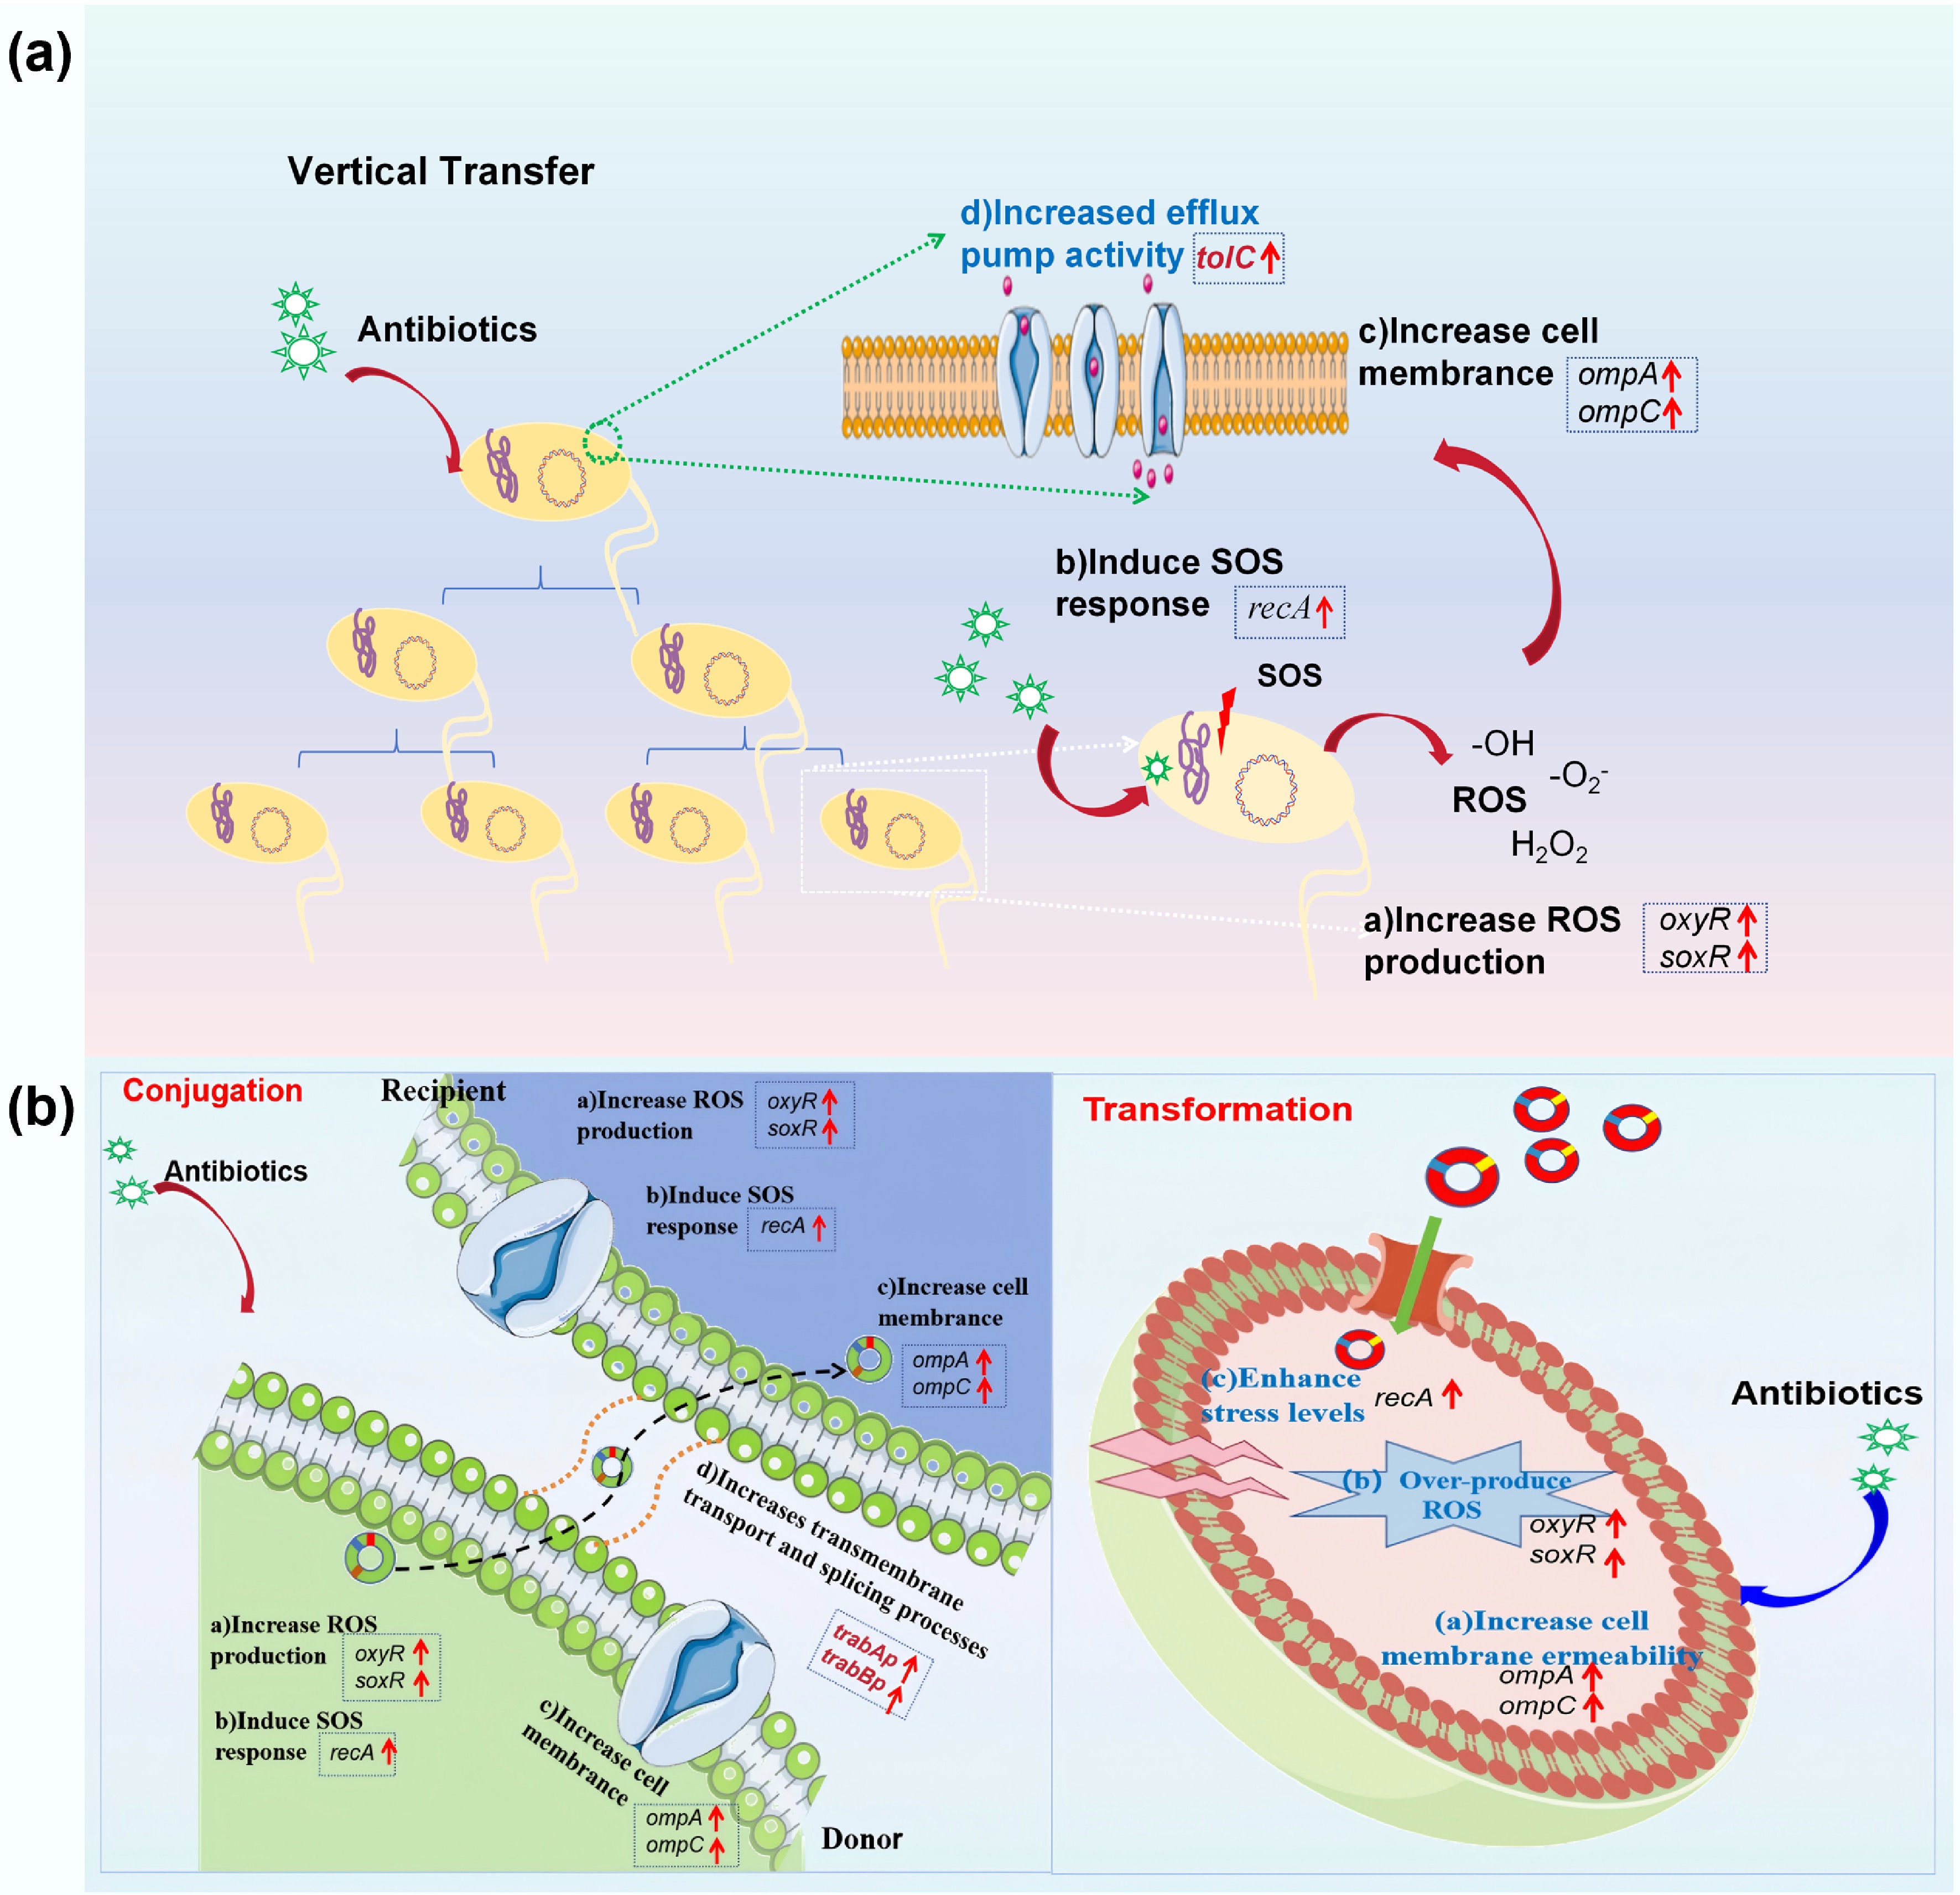
Figure 10.
Underlying mechanisms of antibiotic-promoted dissemination of antibiotic resistance. (a) VGT model. (b) HGT model.
-
Symbol Description Model variables M0 Count of E. coli MG1655 M1 Count of E. coli MG1655 with the RP4 plasmid t Time (h) Model parameters r0/r1 Growth rate of M0 or M1 d0/d1 Death rate of M0 or M1 K Environmental carrying capacity, set as 108 α Probability of plasmid loss β Conjugative transfer ratio Table 1.
Variables used in Model I (VGT model)
-
Symbol Description Model variables A0 Count of wild-type A. baylyi A1 Count of transformants, A. baylyi with the pWH1266 plasmid P Number of free plasmids t Time (h) Model parameters r0/r1 Growth rate of A0 or A1 d0/d1 Death rate of A0 or A1 K Environmental carrying capacity, set as 108 μ Transformation ratio λ Plasmid copy number in the transformant θ Decay rate of free plasmids in the environment Table 2.
Variables used in Model II (transformation model)
Figures
(10)
Tables
(2)