-
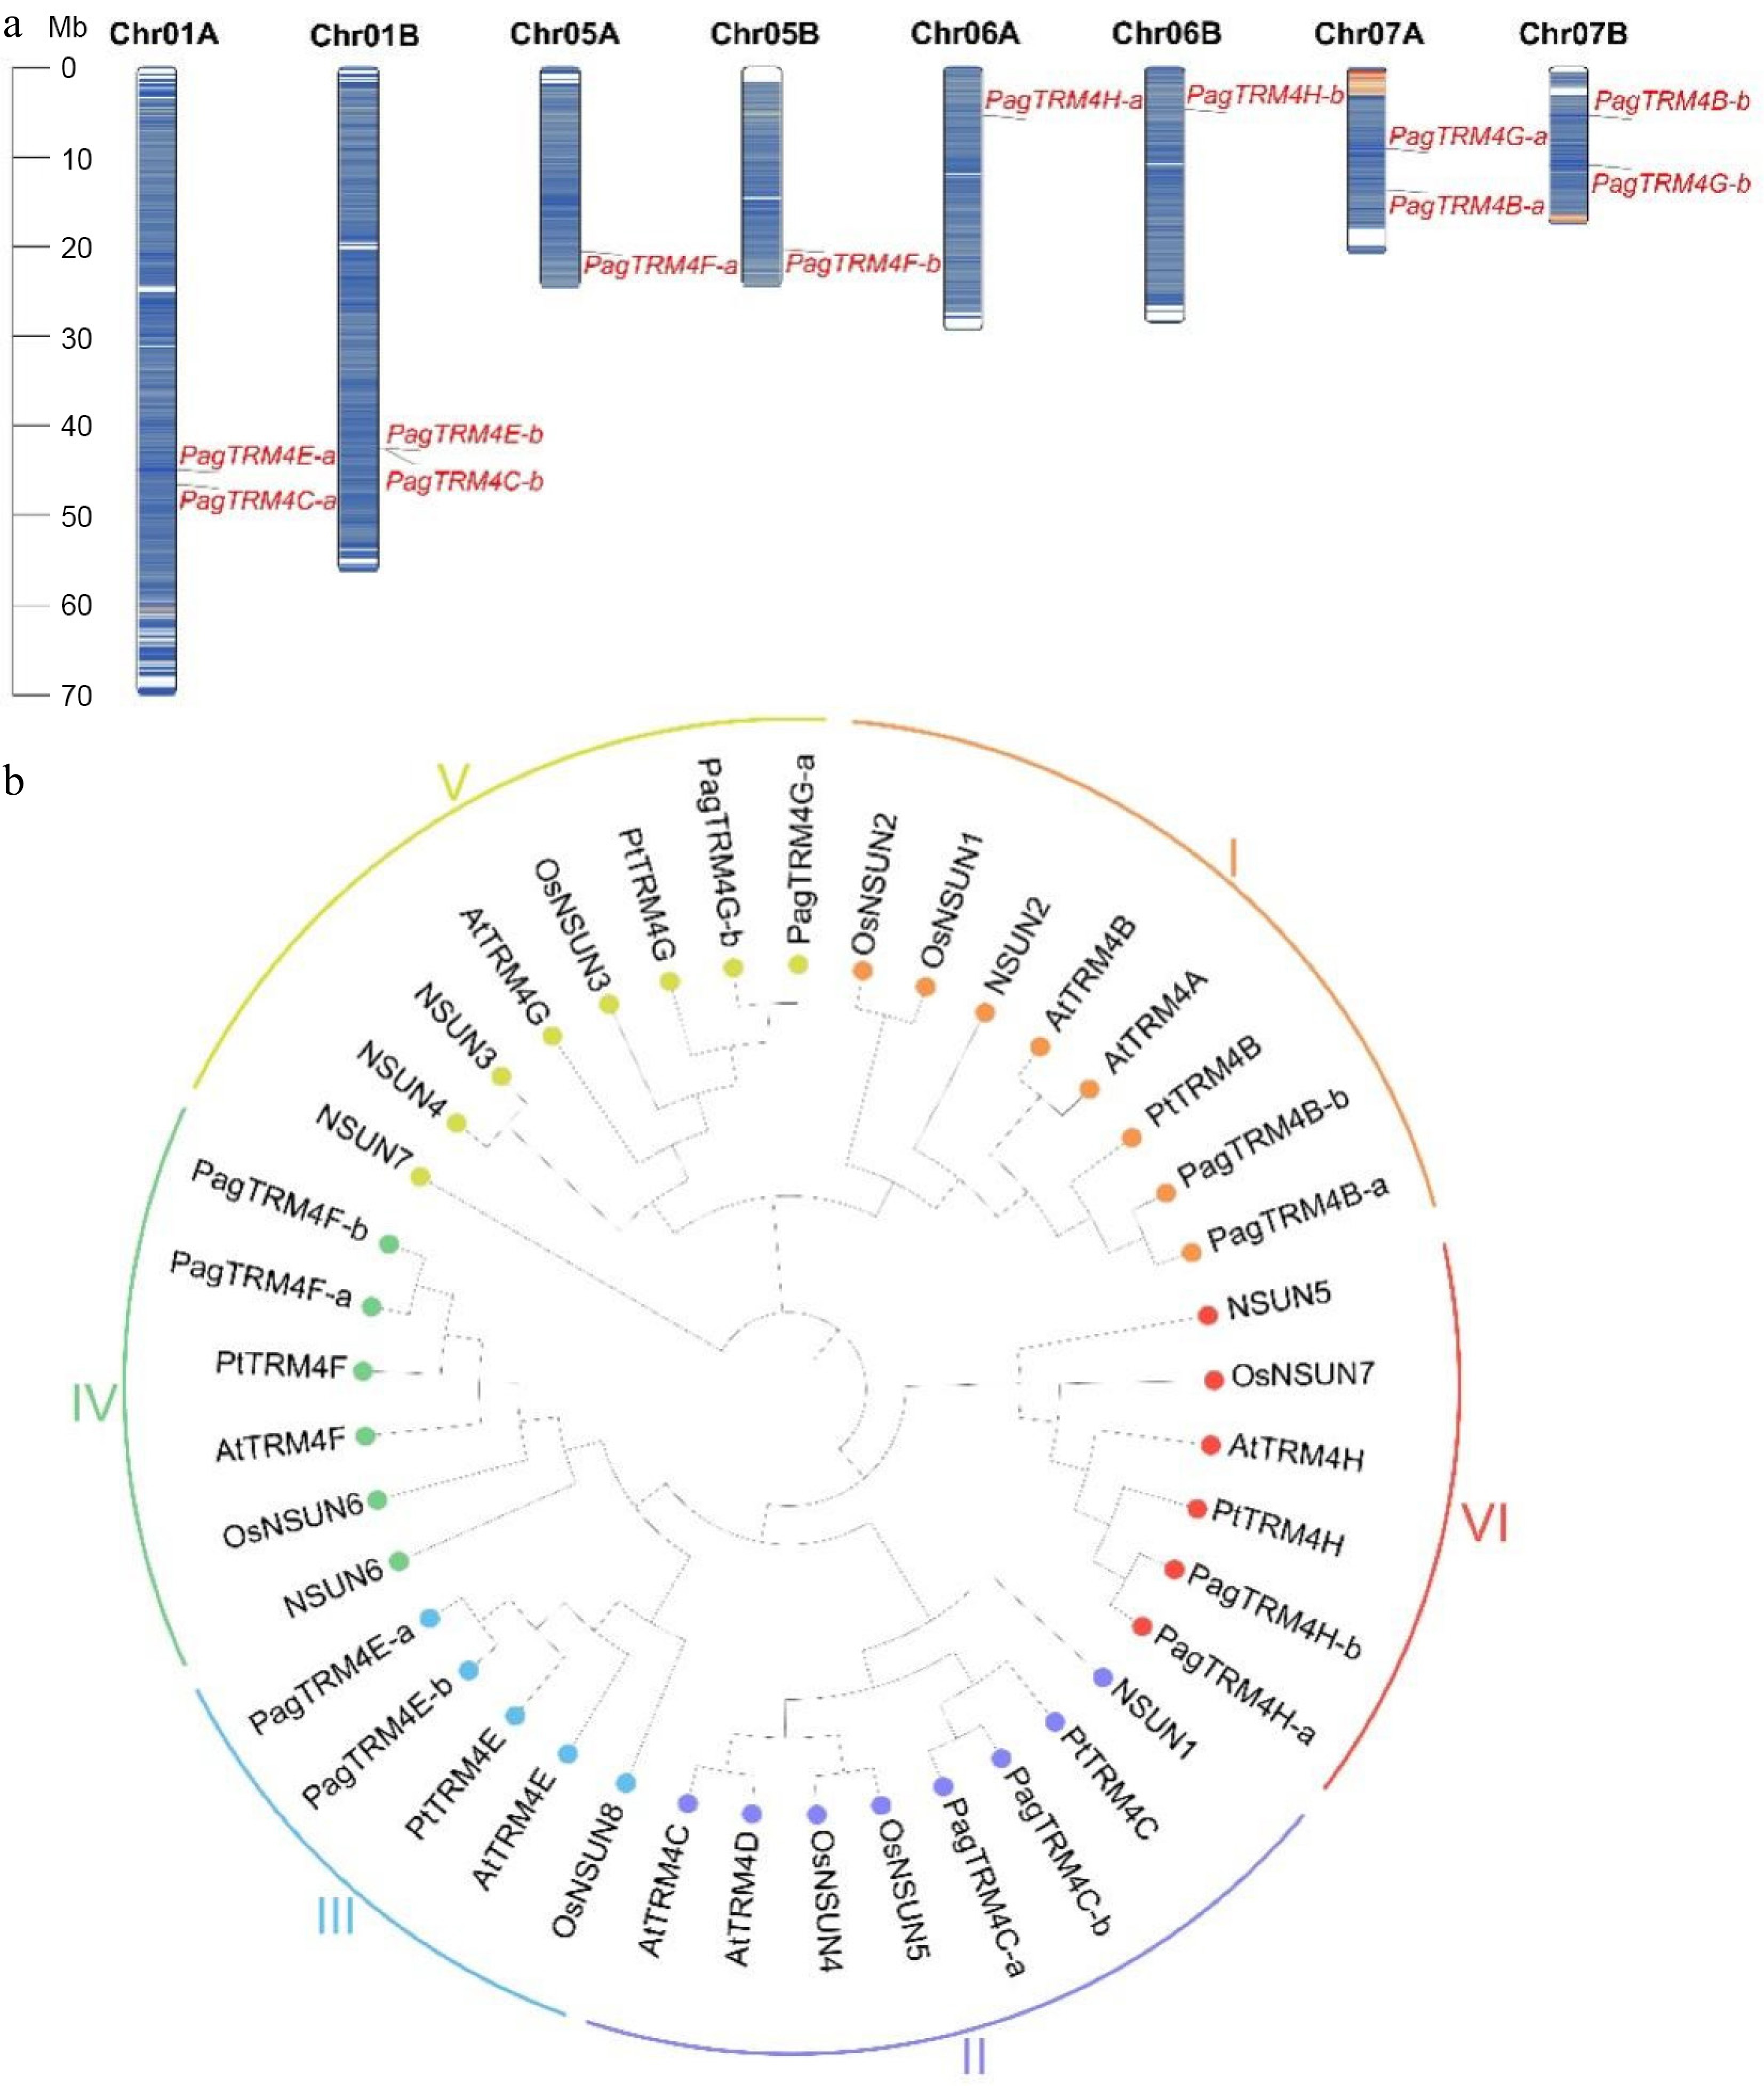
Figure 1.
Chromosome distribution and phylogenetic analysis of PagTRM4 genes in P. alba × P. glandulosa. (a) Chromosomal localization of PagTRM4 genes across the eight chromosomes of the A and B subgenomes in P. alba × P. glandulosa. (b) Phylogenetic tree of TRM4 proteins from Homo sapiens, A. thaliana, Oryza sativa, P. trichocarpa, and P. alba × P. glandulosa. The tree was constructed using the ClustalW alignment and Neighbor-Joining (NJ) method with 1,000 bootstrap replicates in MEGA 12.0. Based on sequence homology, TRM4 proteins were classified into six distinct subfamilies (I to VI), indicated by colored circles and arcs.
-

Figure 2.
Phylogenetic analysis and conserved features of TRM4 family protein genes in three plant species. (a) Phylogenetic relationships of TRM4 proteins from A. thaliana, Oryza sativa, and P. alba × P. glandulosa. (b) Conserved motifs within TRM4 proteins were identified using the MEME tool (version 5.5.7), resulting in the identification of 10 unique motifs, designated as Motif 1 through Motif 10. (c) The schematic representation of conserved domains illustrates their positions and sizes, with each domain depicted as a colored square.
-
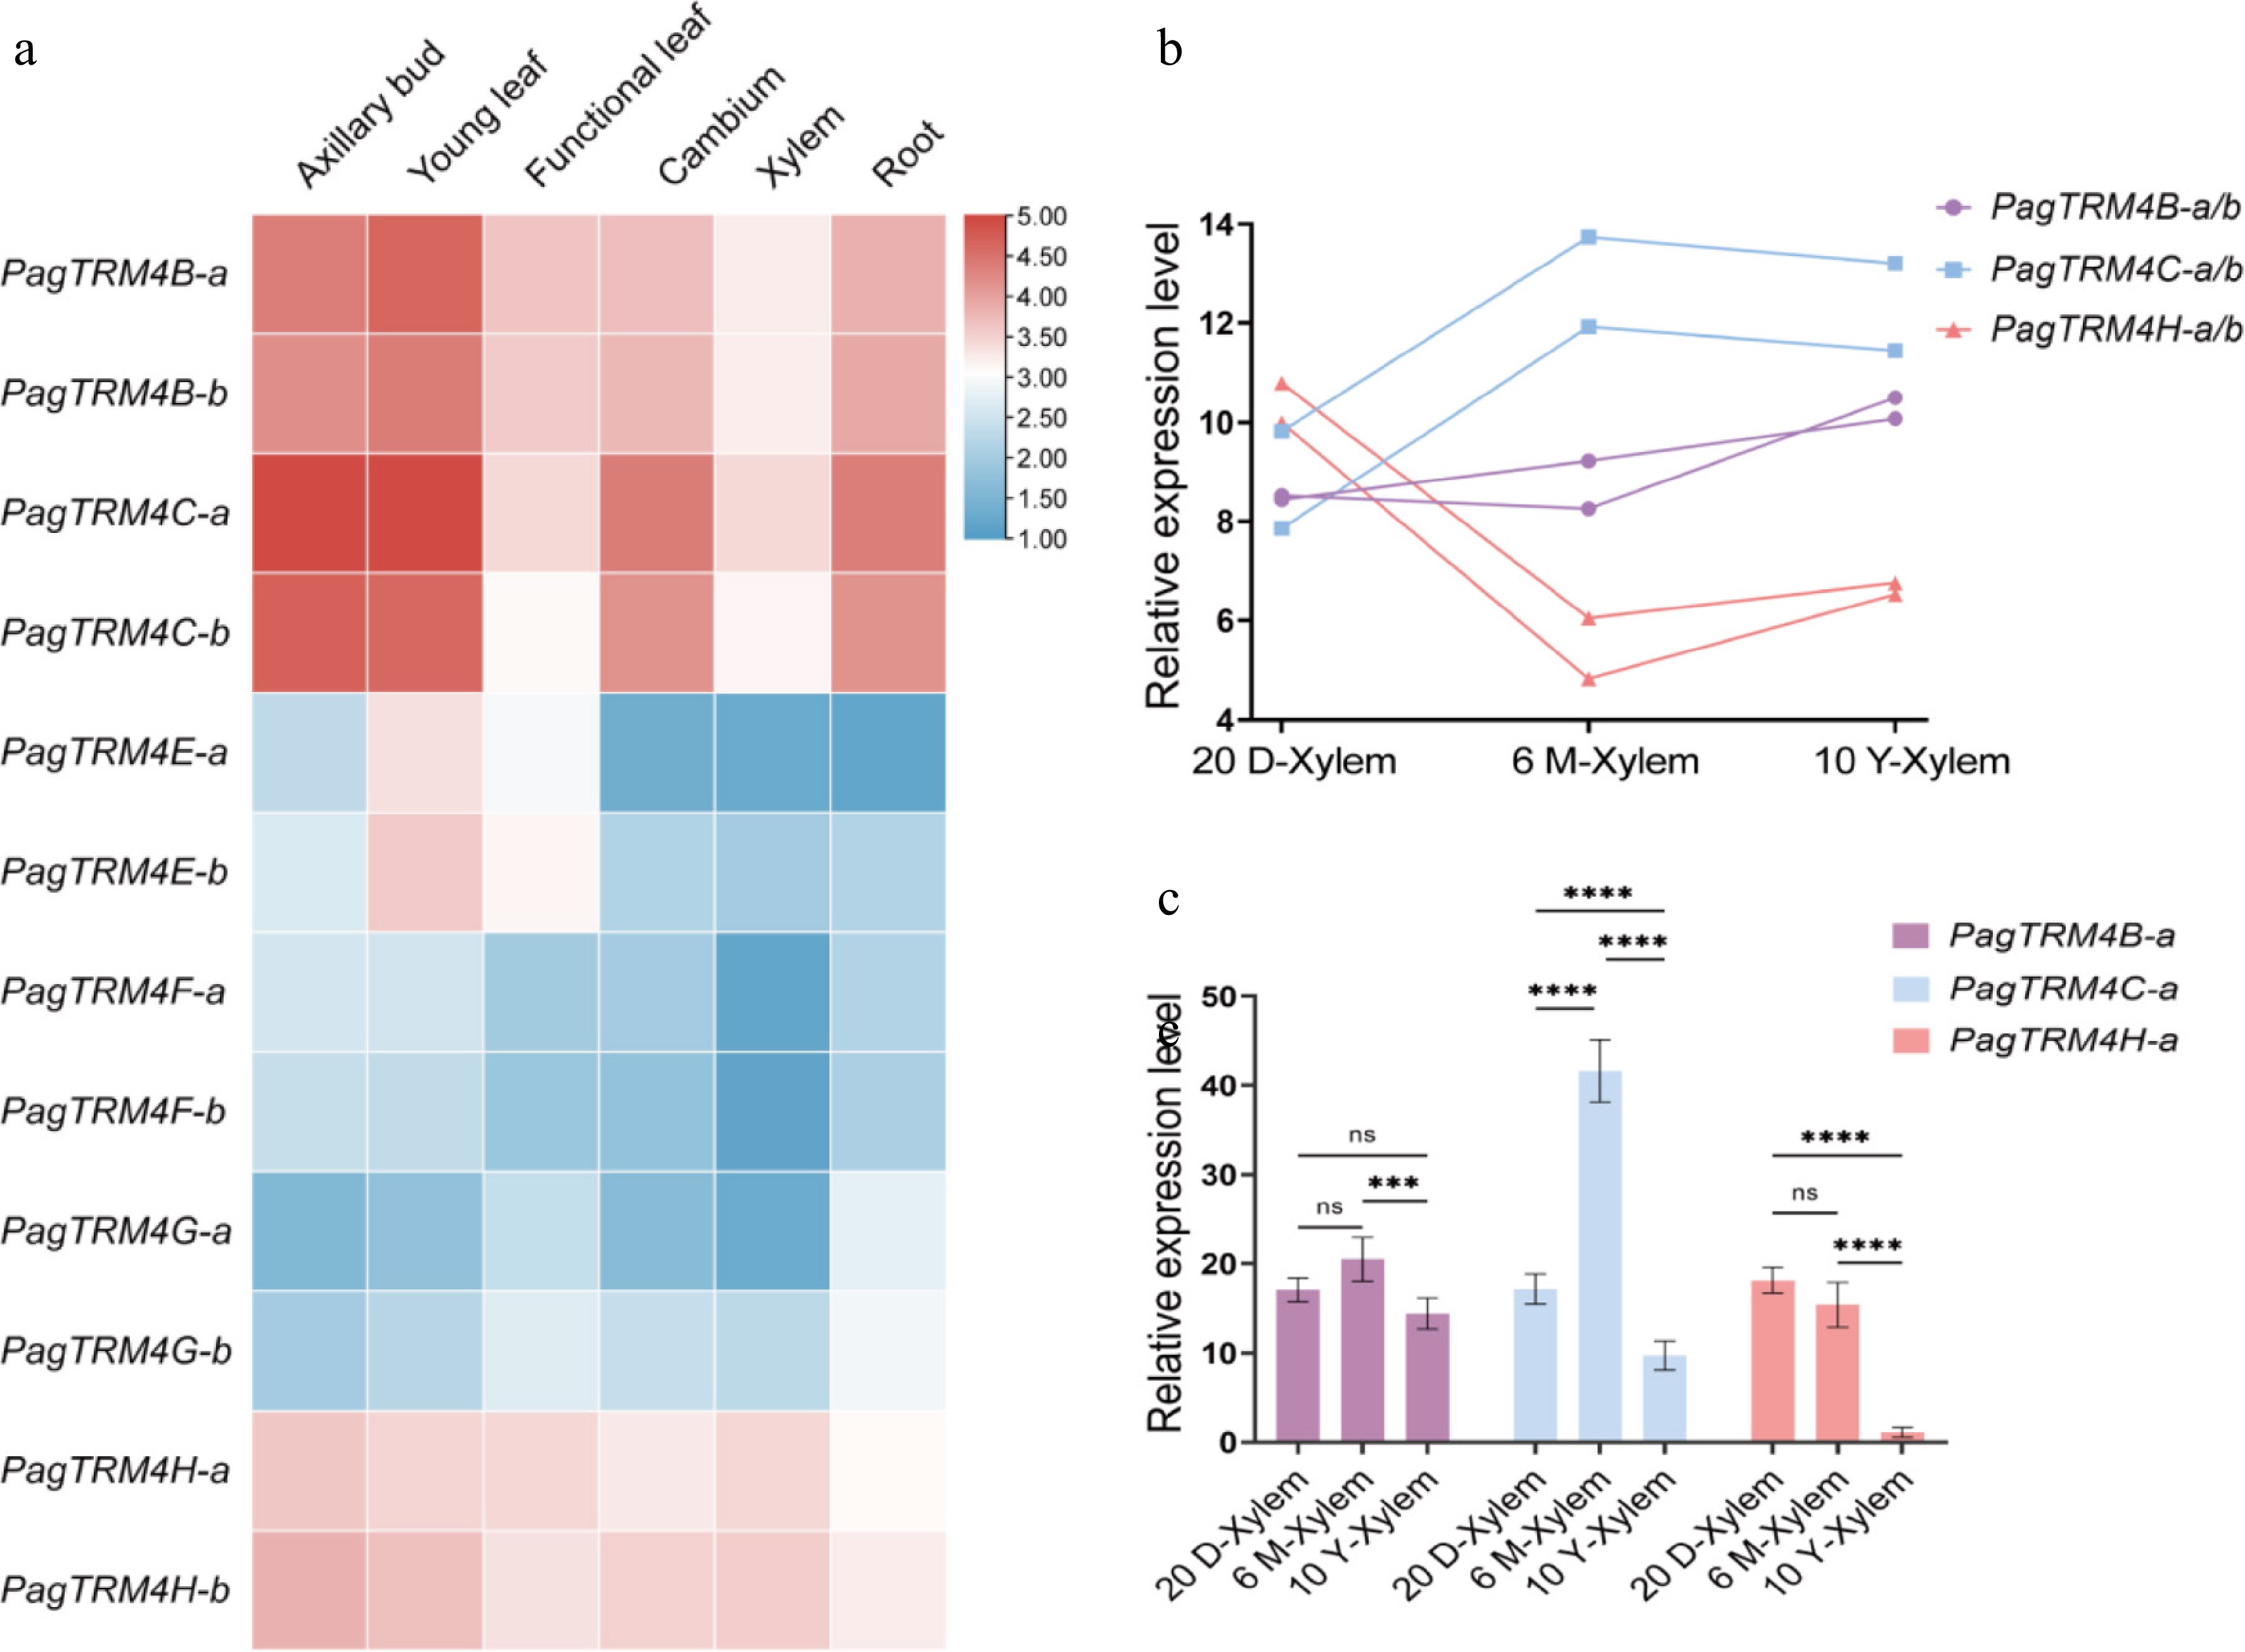
Figure 3.
Expression profiles of PagTRM4 genes in P. alba × P. glandulosa in 20-day-old (20 D), 6-month-old (6 M), and 10-year-old (10 Y) trees. (a) Heatmap displaying the transcript abundance of PagTRM4 genes across different tissues, including axillary buds, young leaves, functional leaves, cambium, xylem, and roots. The color scale (blue to red) represents low to high expression levels. (b) Expression patterns of PagTRM4B/C/H-a/b genes in the xylem of different developmental stages. (c) RT-qPCR analysis of PagTRM4B/C/H-a genes in xylem tissues collected from 20-day-old (20 D-Xylem), 6-month-old (6 M-Xylem), and 10-year-old (10 Y-Xylem) trees. Error bars represent mean with SD. Asterisks indicate statistically significant differences among samples (two-way ANOVA with Tukey's post-hoc test for pairwise comparisons; *** p < 0.001; **** p < 0.0001; n = 3 biological replicates, each with three technical replicates).
-

Figure 4.
PagTRM4B-a-OE transgenic poplar phenotypes. (a) Five-month-old wild type and three PagTRM4B-a overexpression transgenic lines (OE-2, OE-7, and OE-9). Bar = 10 cm. (b)–(d) Measurement of plant height, basal stem diameter, and internode number. (e) and (f) Quantification of the m5C/C of total RNA and mRNA isolated from 5-month-old WT, OE-2, OE-7, and OE-9 transgenic poplar xylem by LC-MS/MS. Error bars represent mean with SD. Asterisks indicate statistically significant differences among samples (one-way ANOVA followed by Dunnett's test for pairwise comparisons; * p < 0.05; ** p < 0.01; *** p < 0.001; **** p < 0.0001; n = 3 biological replicates, each with three technical replicates).
-
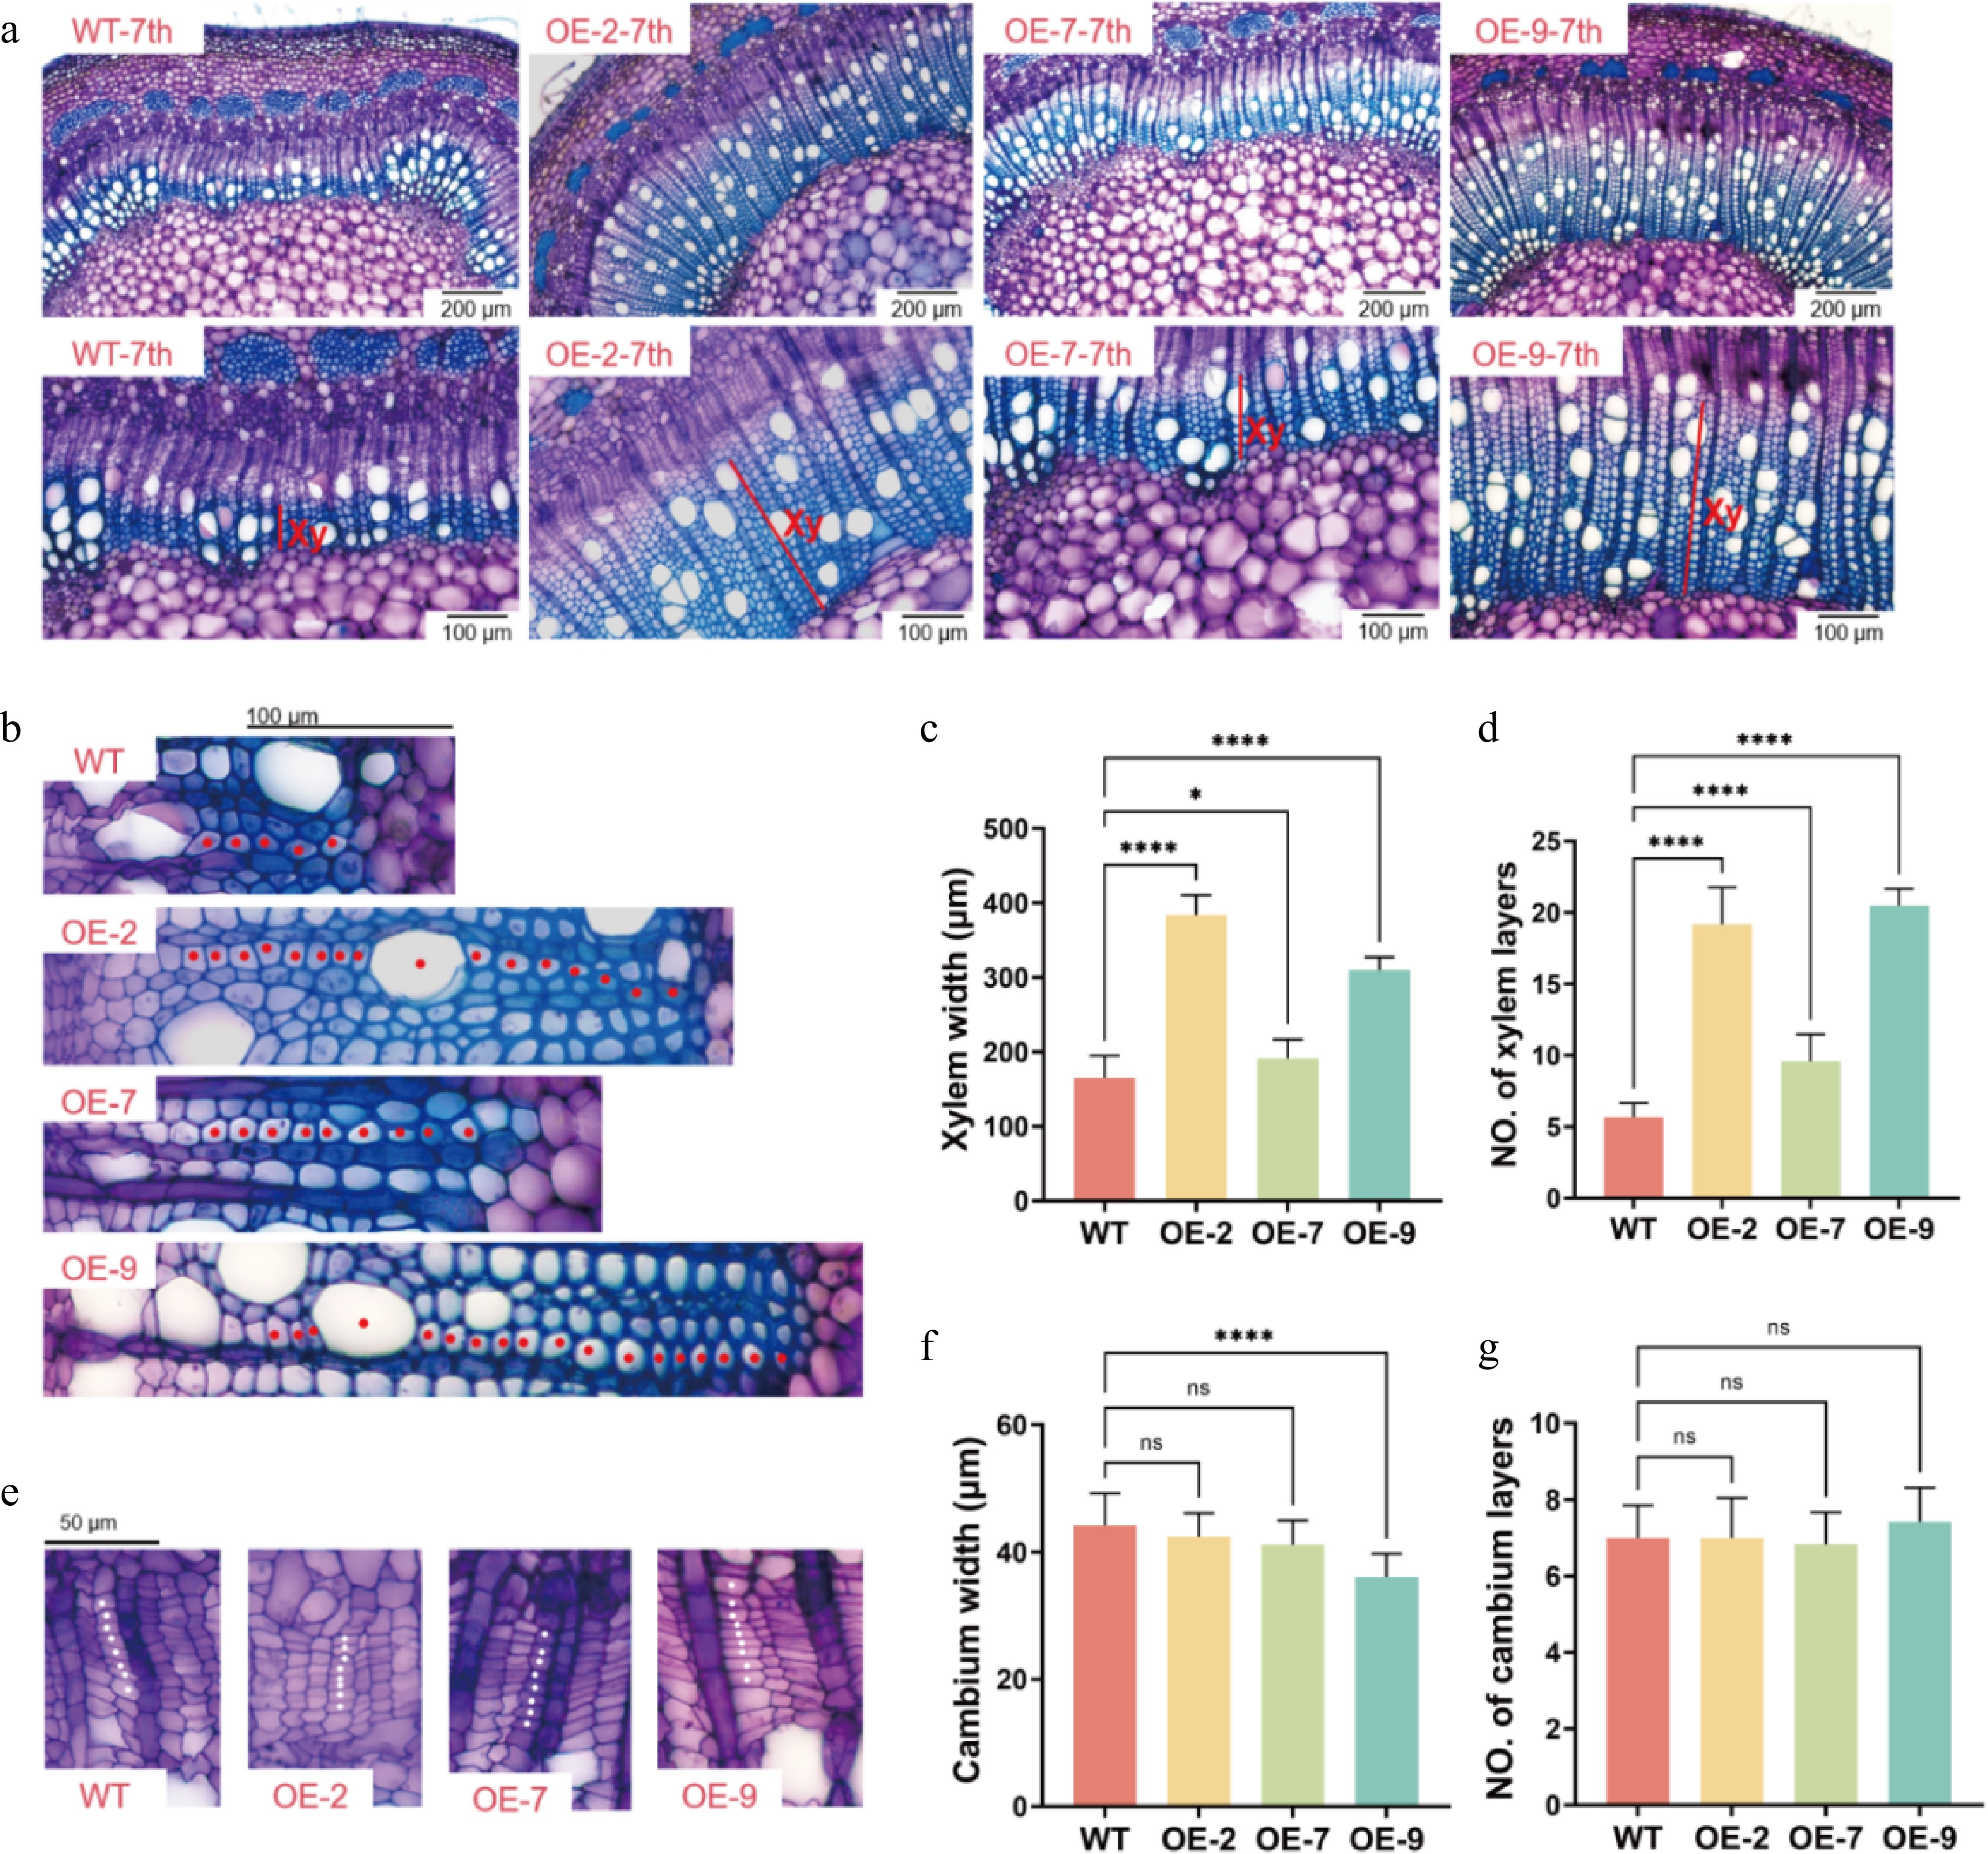
Figure 5.
Characterization of secondary xylem development in WT and PagTRM4B-a-OE transgenic lines. (a) Stem cross-sections of the 7th internode of 5-month-old WT, OE-2, OE-7, and OE-9, stained with toluidine blue O (TBO). Xylem width is indicated with red bars. Bars are 200 μm (top line), and 100 μm (bottom line). Xy, xylem. (b) Enlarged images in the secondary xylem region of WT, OE-2, OE-7, and OE-9. Red dots indicate vessels and fiber cells. Bars are 100 μm. (c), (d) Quantification of xylem width and xylem layers in poplar stems. (e) Enlarged images in the cambial region of WT, OE-2, OE-7, and OE-9. White dots indicate cambial cells. Bars are 50 μm. (f), (g) Quantification of cambium width and cambium layers in poplar stems. Error bars represent mean with SD. Asterisks indicate statistically significant differences between the WT and OE lines (one-way ANOVA followed by Dunnett's test for pairwise comparisons; * p < 0.05; **** p < 0.0001; n = 3 biological replicates, each with 12 technical replicates).
-
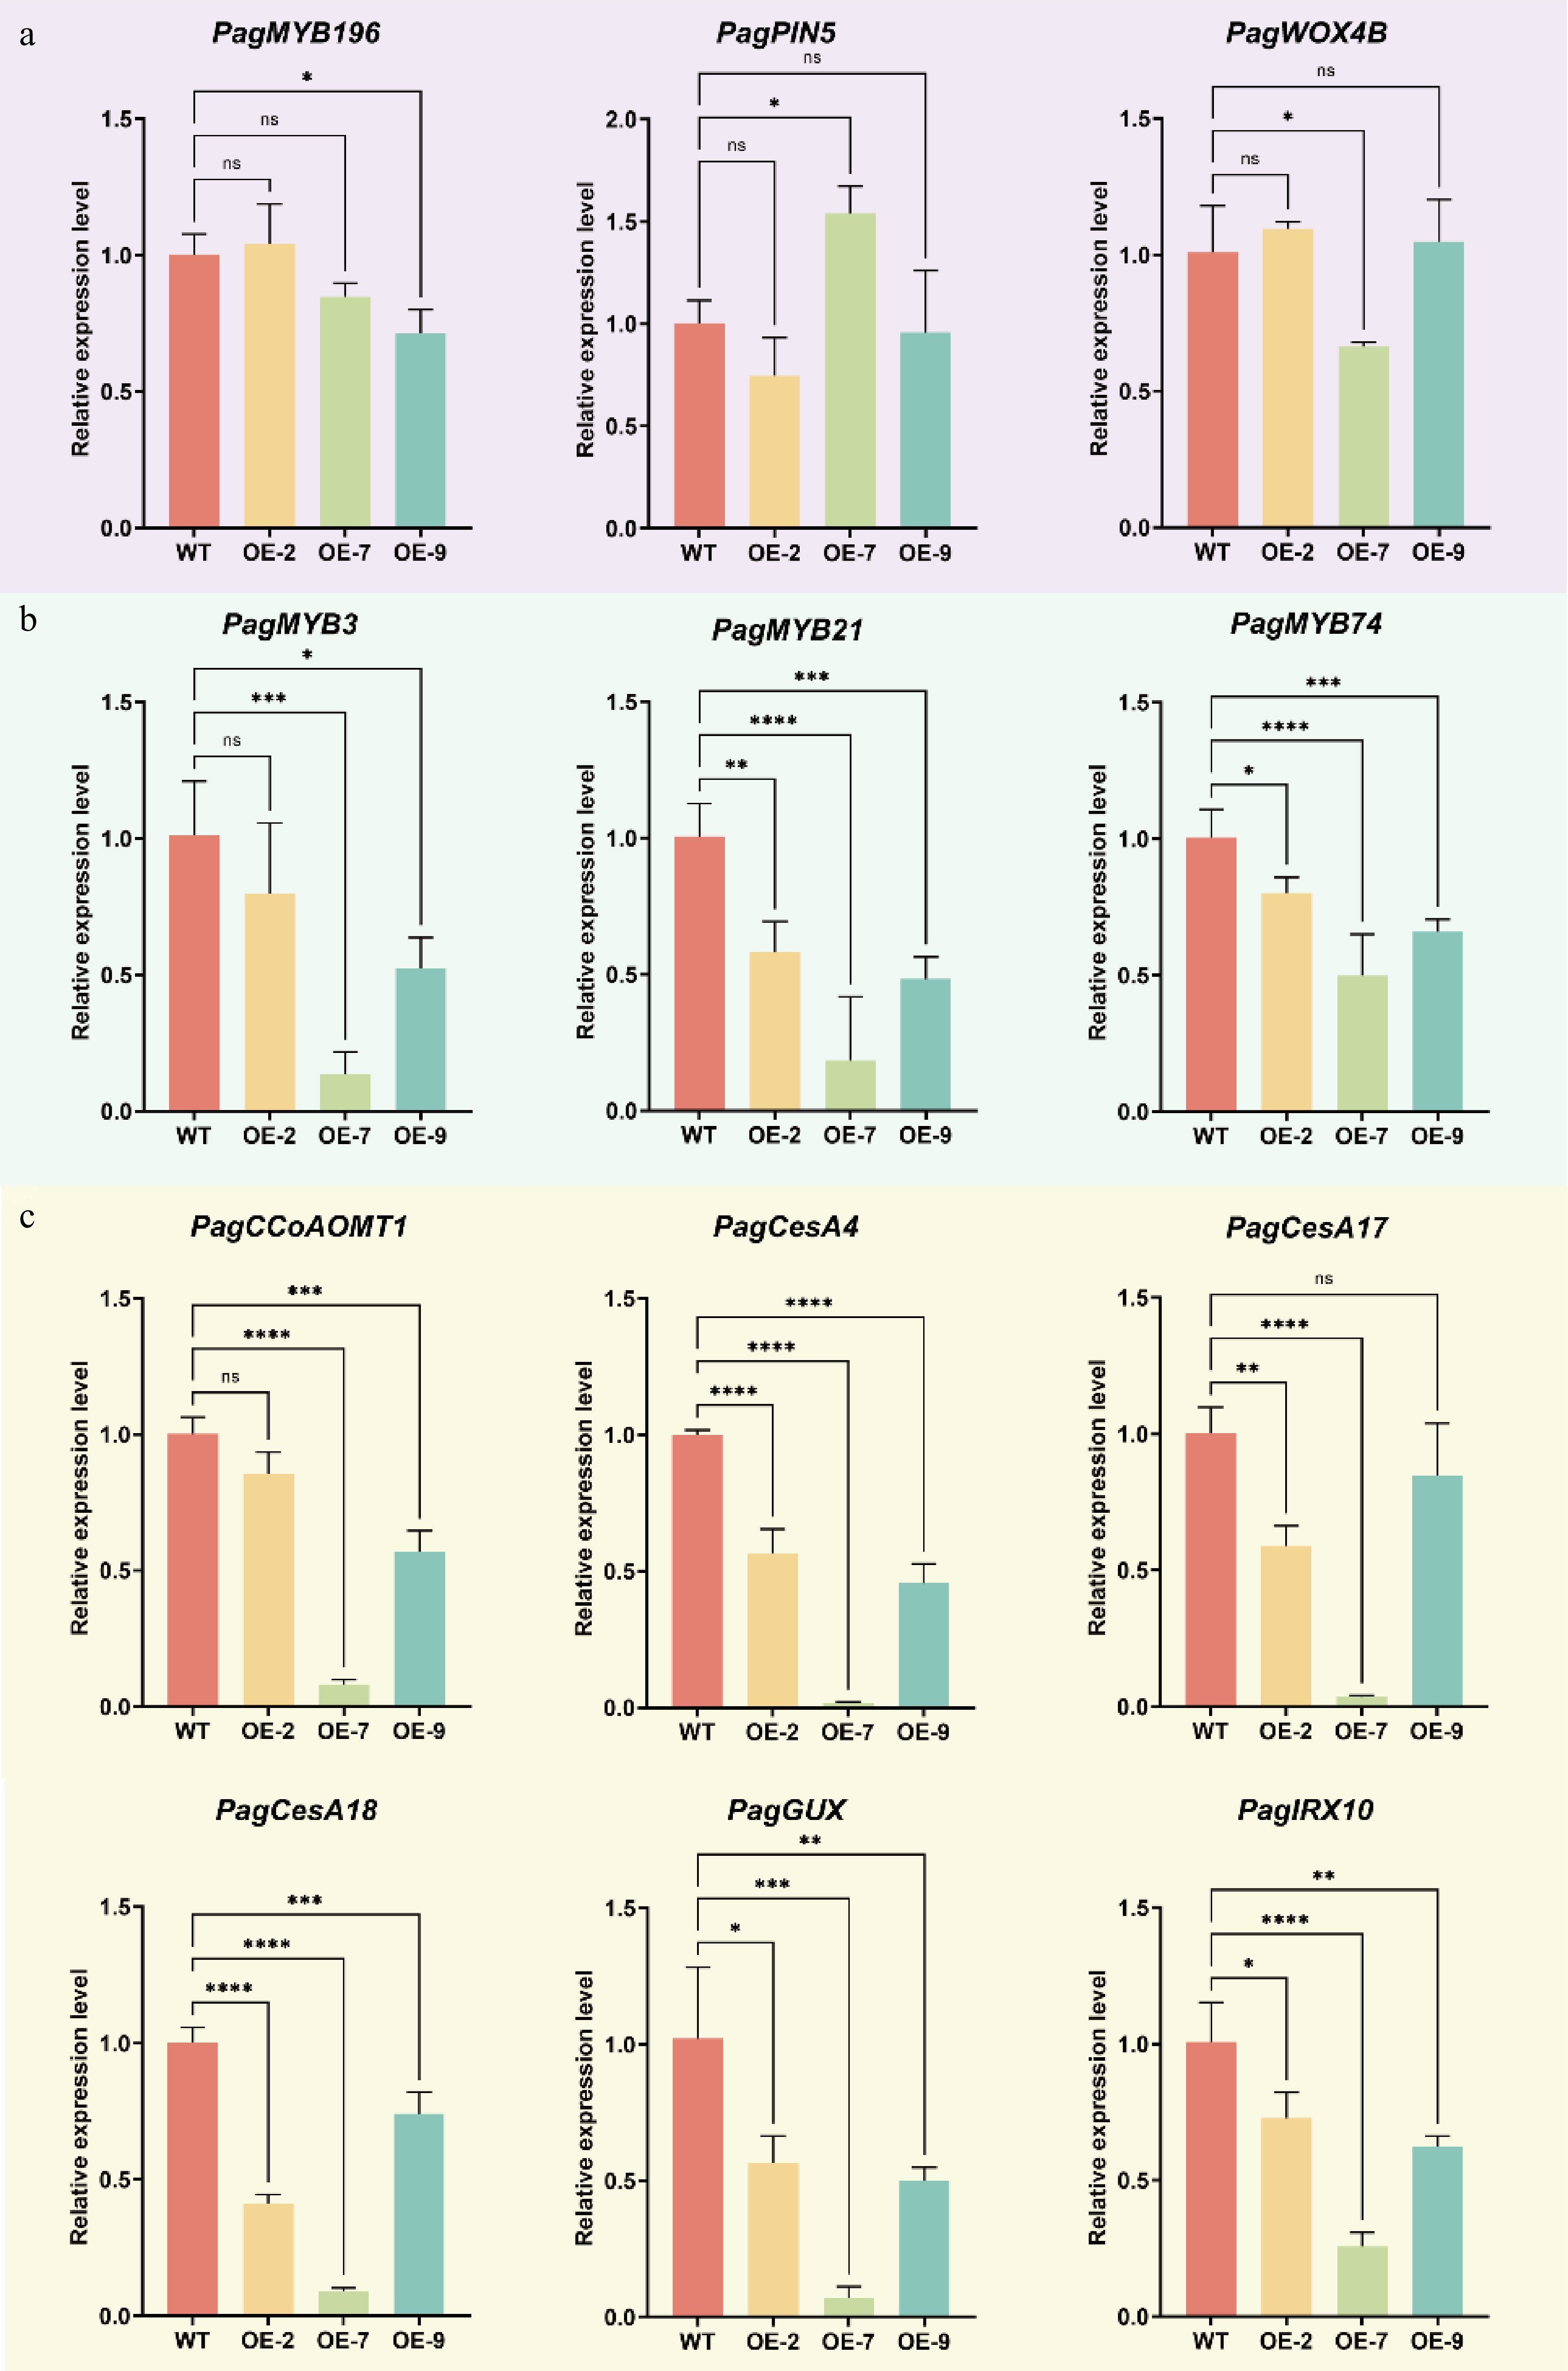
Figure 6.
RT-qPCR analysis of key genes during wood formation in xylem tissues of WT and PagTRM4B-a-OE transgenic lines. (a) Relative expression levels of genes in cambial cell proliferation were determined by RT-qPCR. (b) Relative expression levels of transcription factors in SCW formation were determined by RT-qPCR. (c) Relative expression levels of SCW biosynthesis genes were determined by RT-qPCR. Error bars represent mean with SD. Asterisks indicate statistically significant differences between the WT and OE lines (one-way ANOVA followed by Dunnett's test for pairwise comparisons; * p < 0.05; ** p < 0.01; *** p < 0.001; **** p < 0.0001; n = 3 biological replicates, each with three technical replicates).
-
Wood composition WT OE-2 OE-7 OE-9 Lignin 26.23% ± 0.56% 33.41% ± 1.16%*** 28.49% ± 1.22% 29.86% ± 1.33%* Cellulose 51.26% ± 1.68% 28.90% ± 0.83%**** 33.58% ± 1.36%**** 30.57% ± 1.82%**** Hemicellulose 18.30% ± 0.50% 15.42% ± 0.66%** 17.59% ± 0.87% 17.55% ± 0.82% Wood compositions were analyzed using samples from 5-month-old trees. Values represent mean ± SD (n = 3). Asterisks indicate statistically significant differences among samples (one-way ANOVA followed by Dunnett's test for pairwise comparisons; * p < 0.05; ** p < 0.01; *** p < 0.001; **** p < 0.0001; n = 3 biological replicates, each with three technical replicates). Table 1.
Wood composition in wild-type (WT), and PagTRM4B-a-OE (OE) transgenic plants.
Figures
(6)
Tables
(1)