-
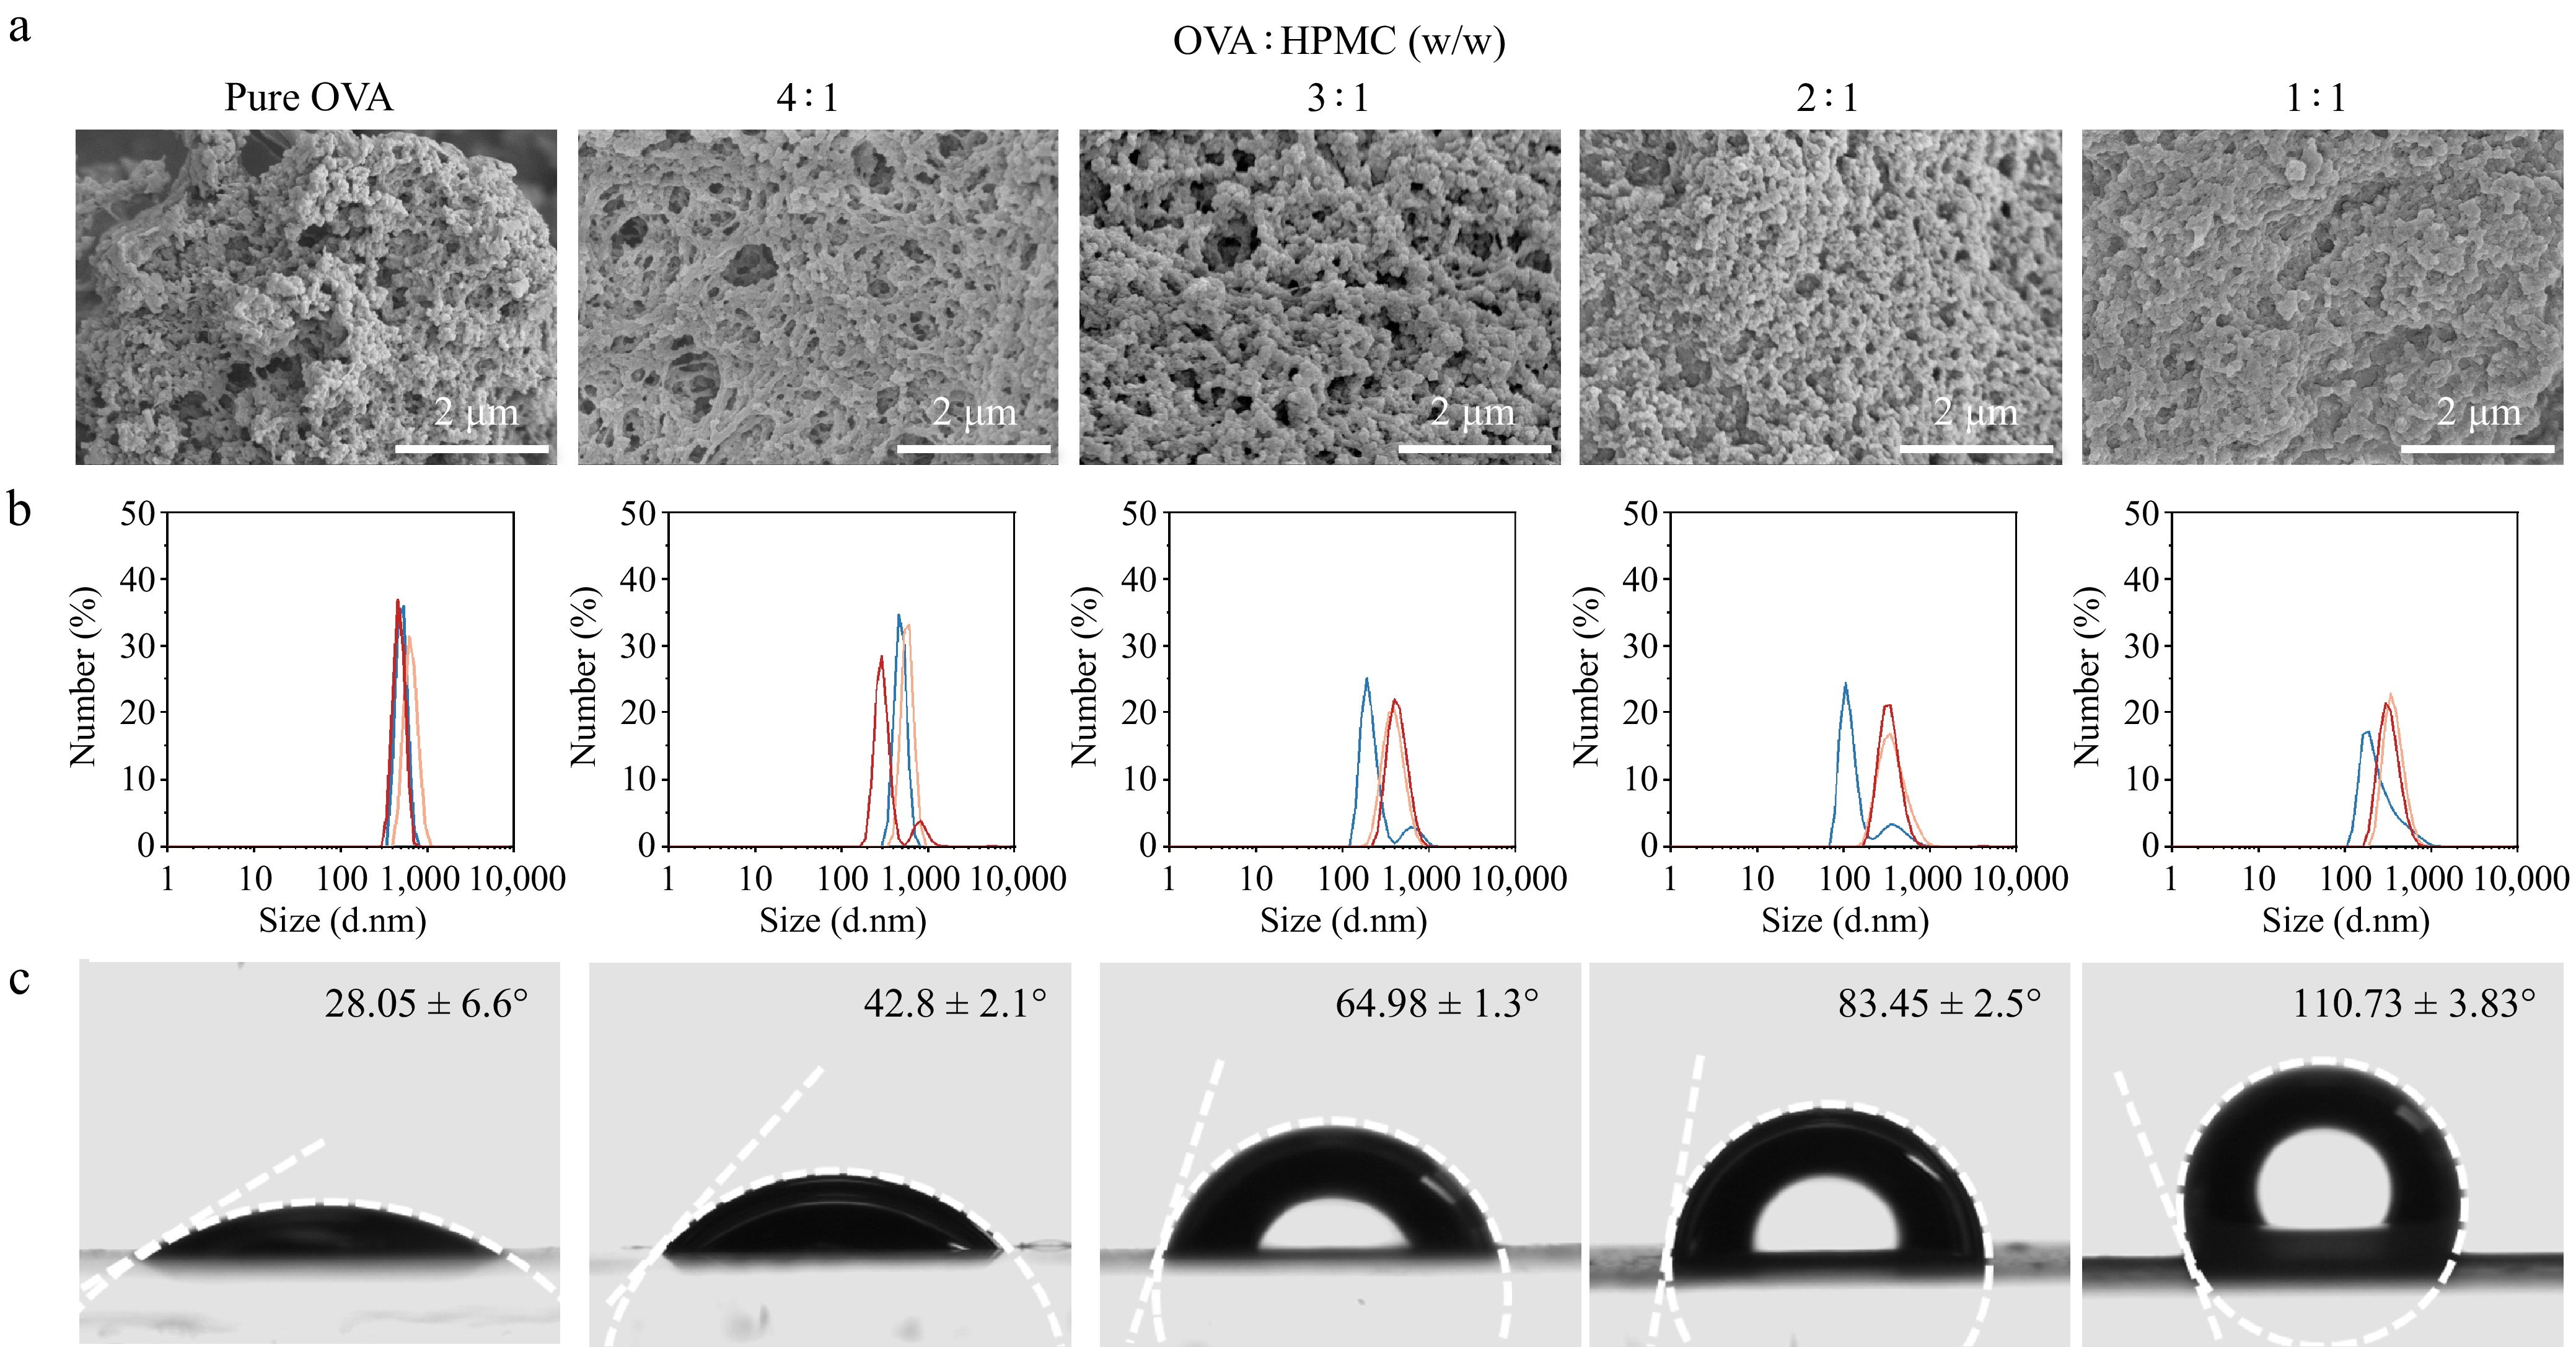
Figure 1.
Characterization of particle solutions with different HPMC-OVA ratios. (a) Scanning electron microscope (scale bar = 2 μm). (b) Particle size distribution. (c) Contact angle.
-
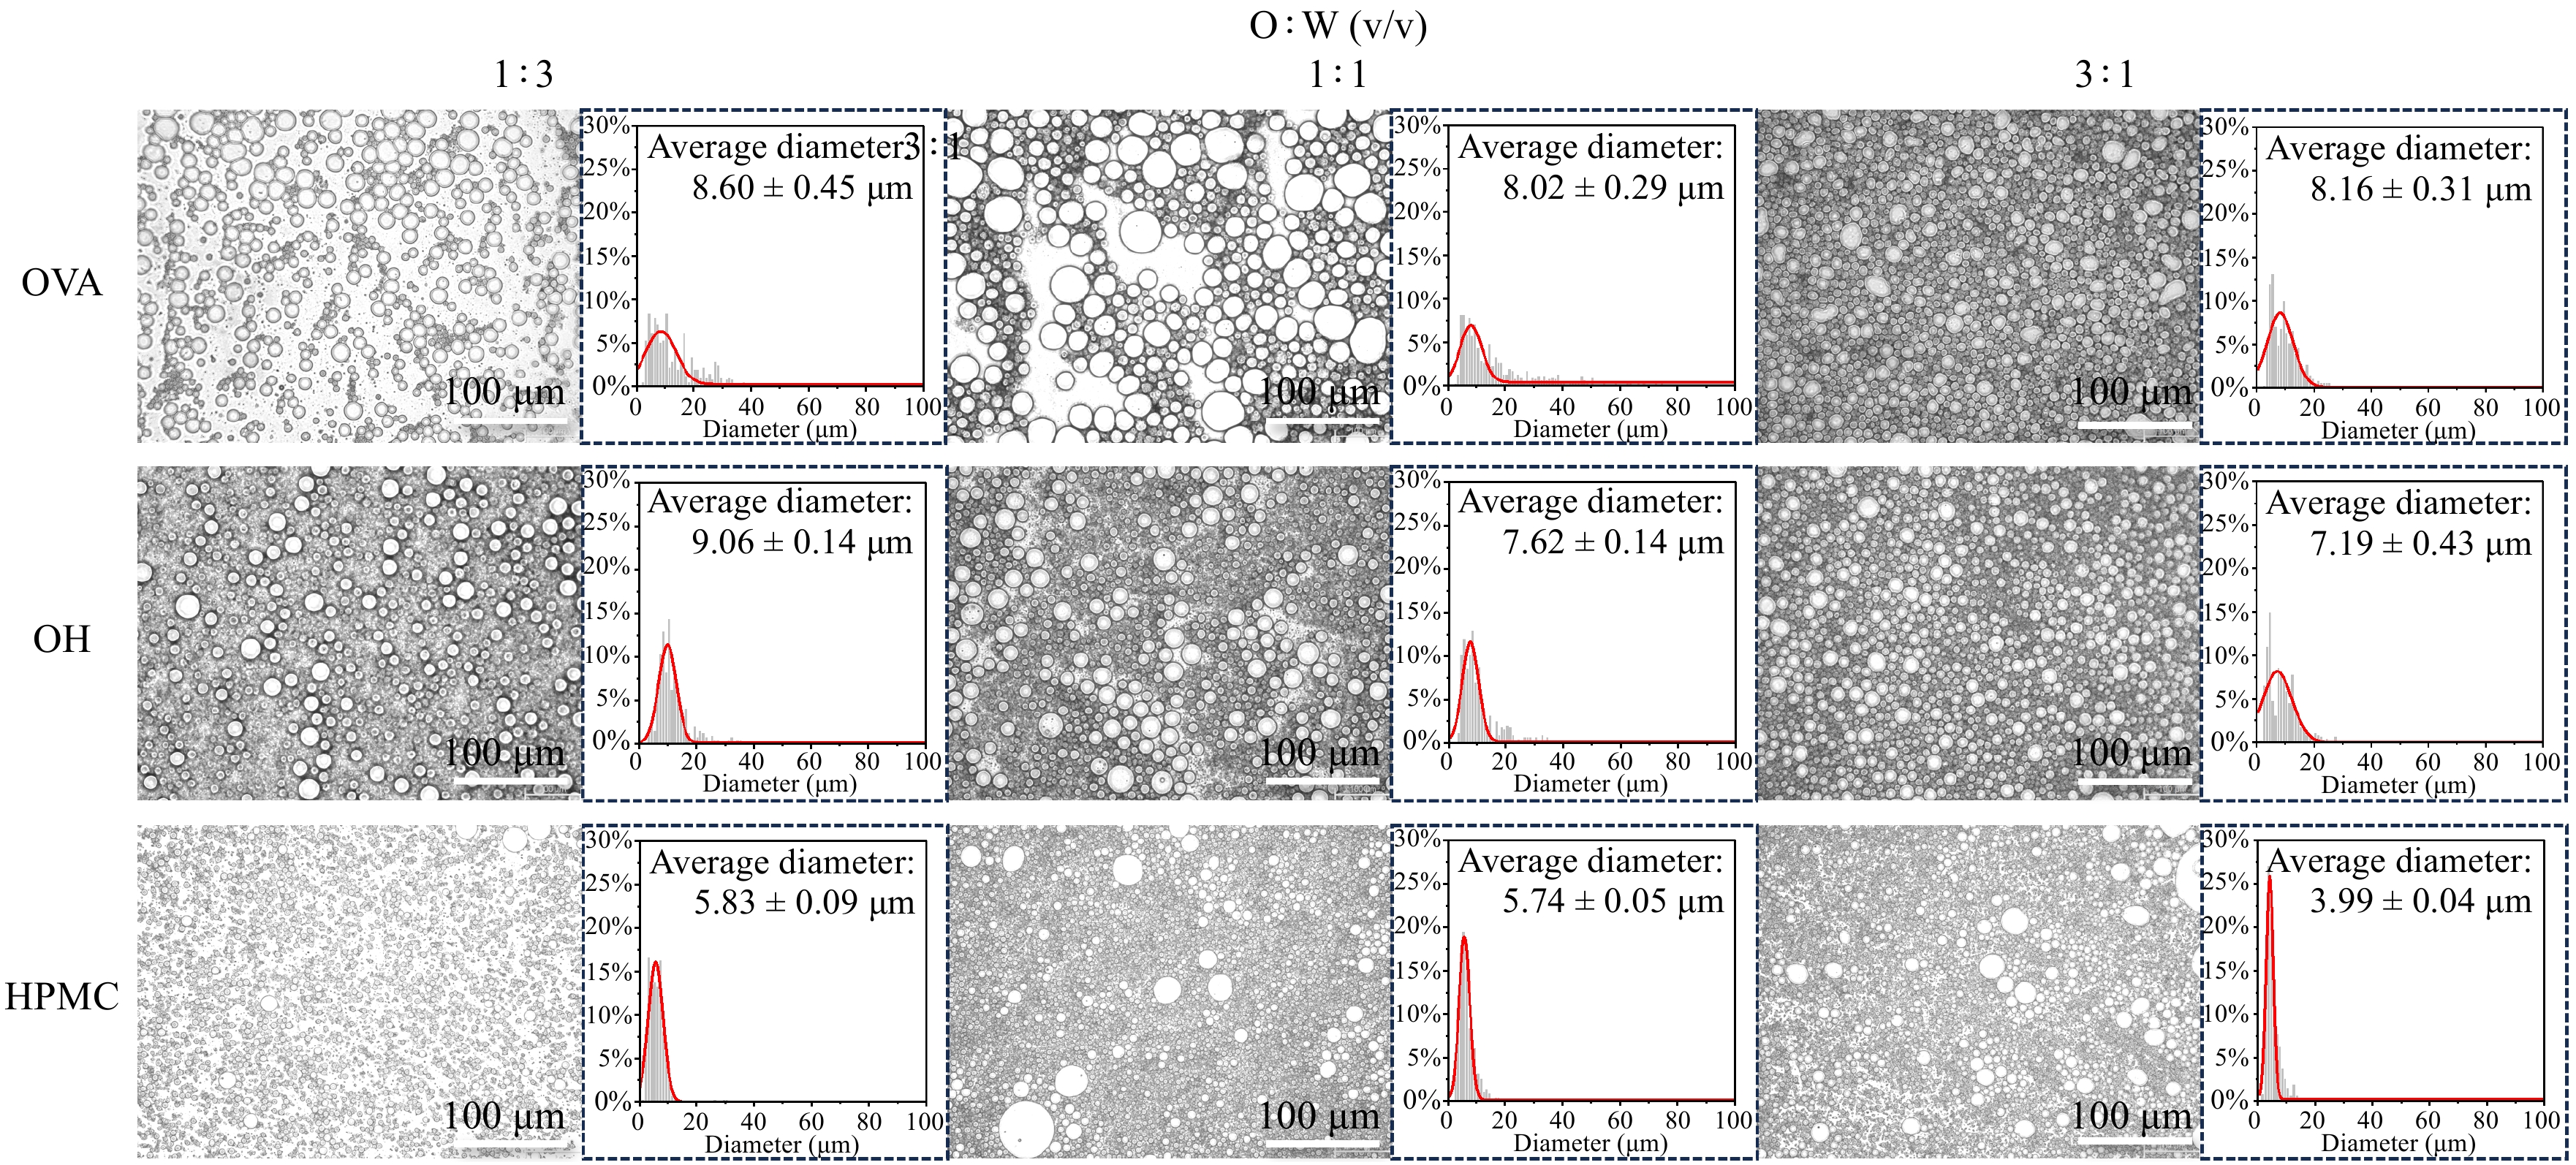
Figure 2.
Optical micrographs (scale bar = 200 μm), and droplet size distribution of emulsion with different HPMC-OVA and oil : water ratios.
-
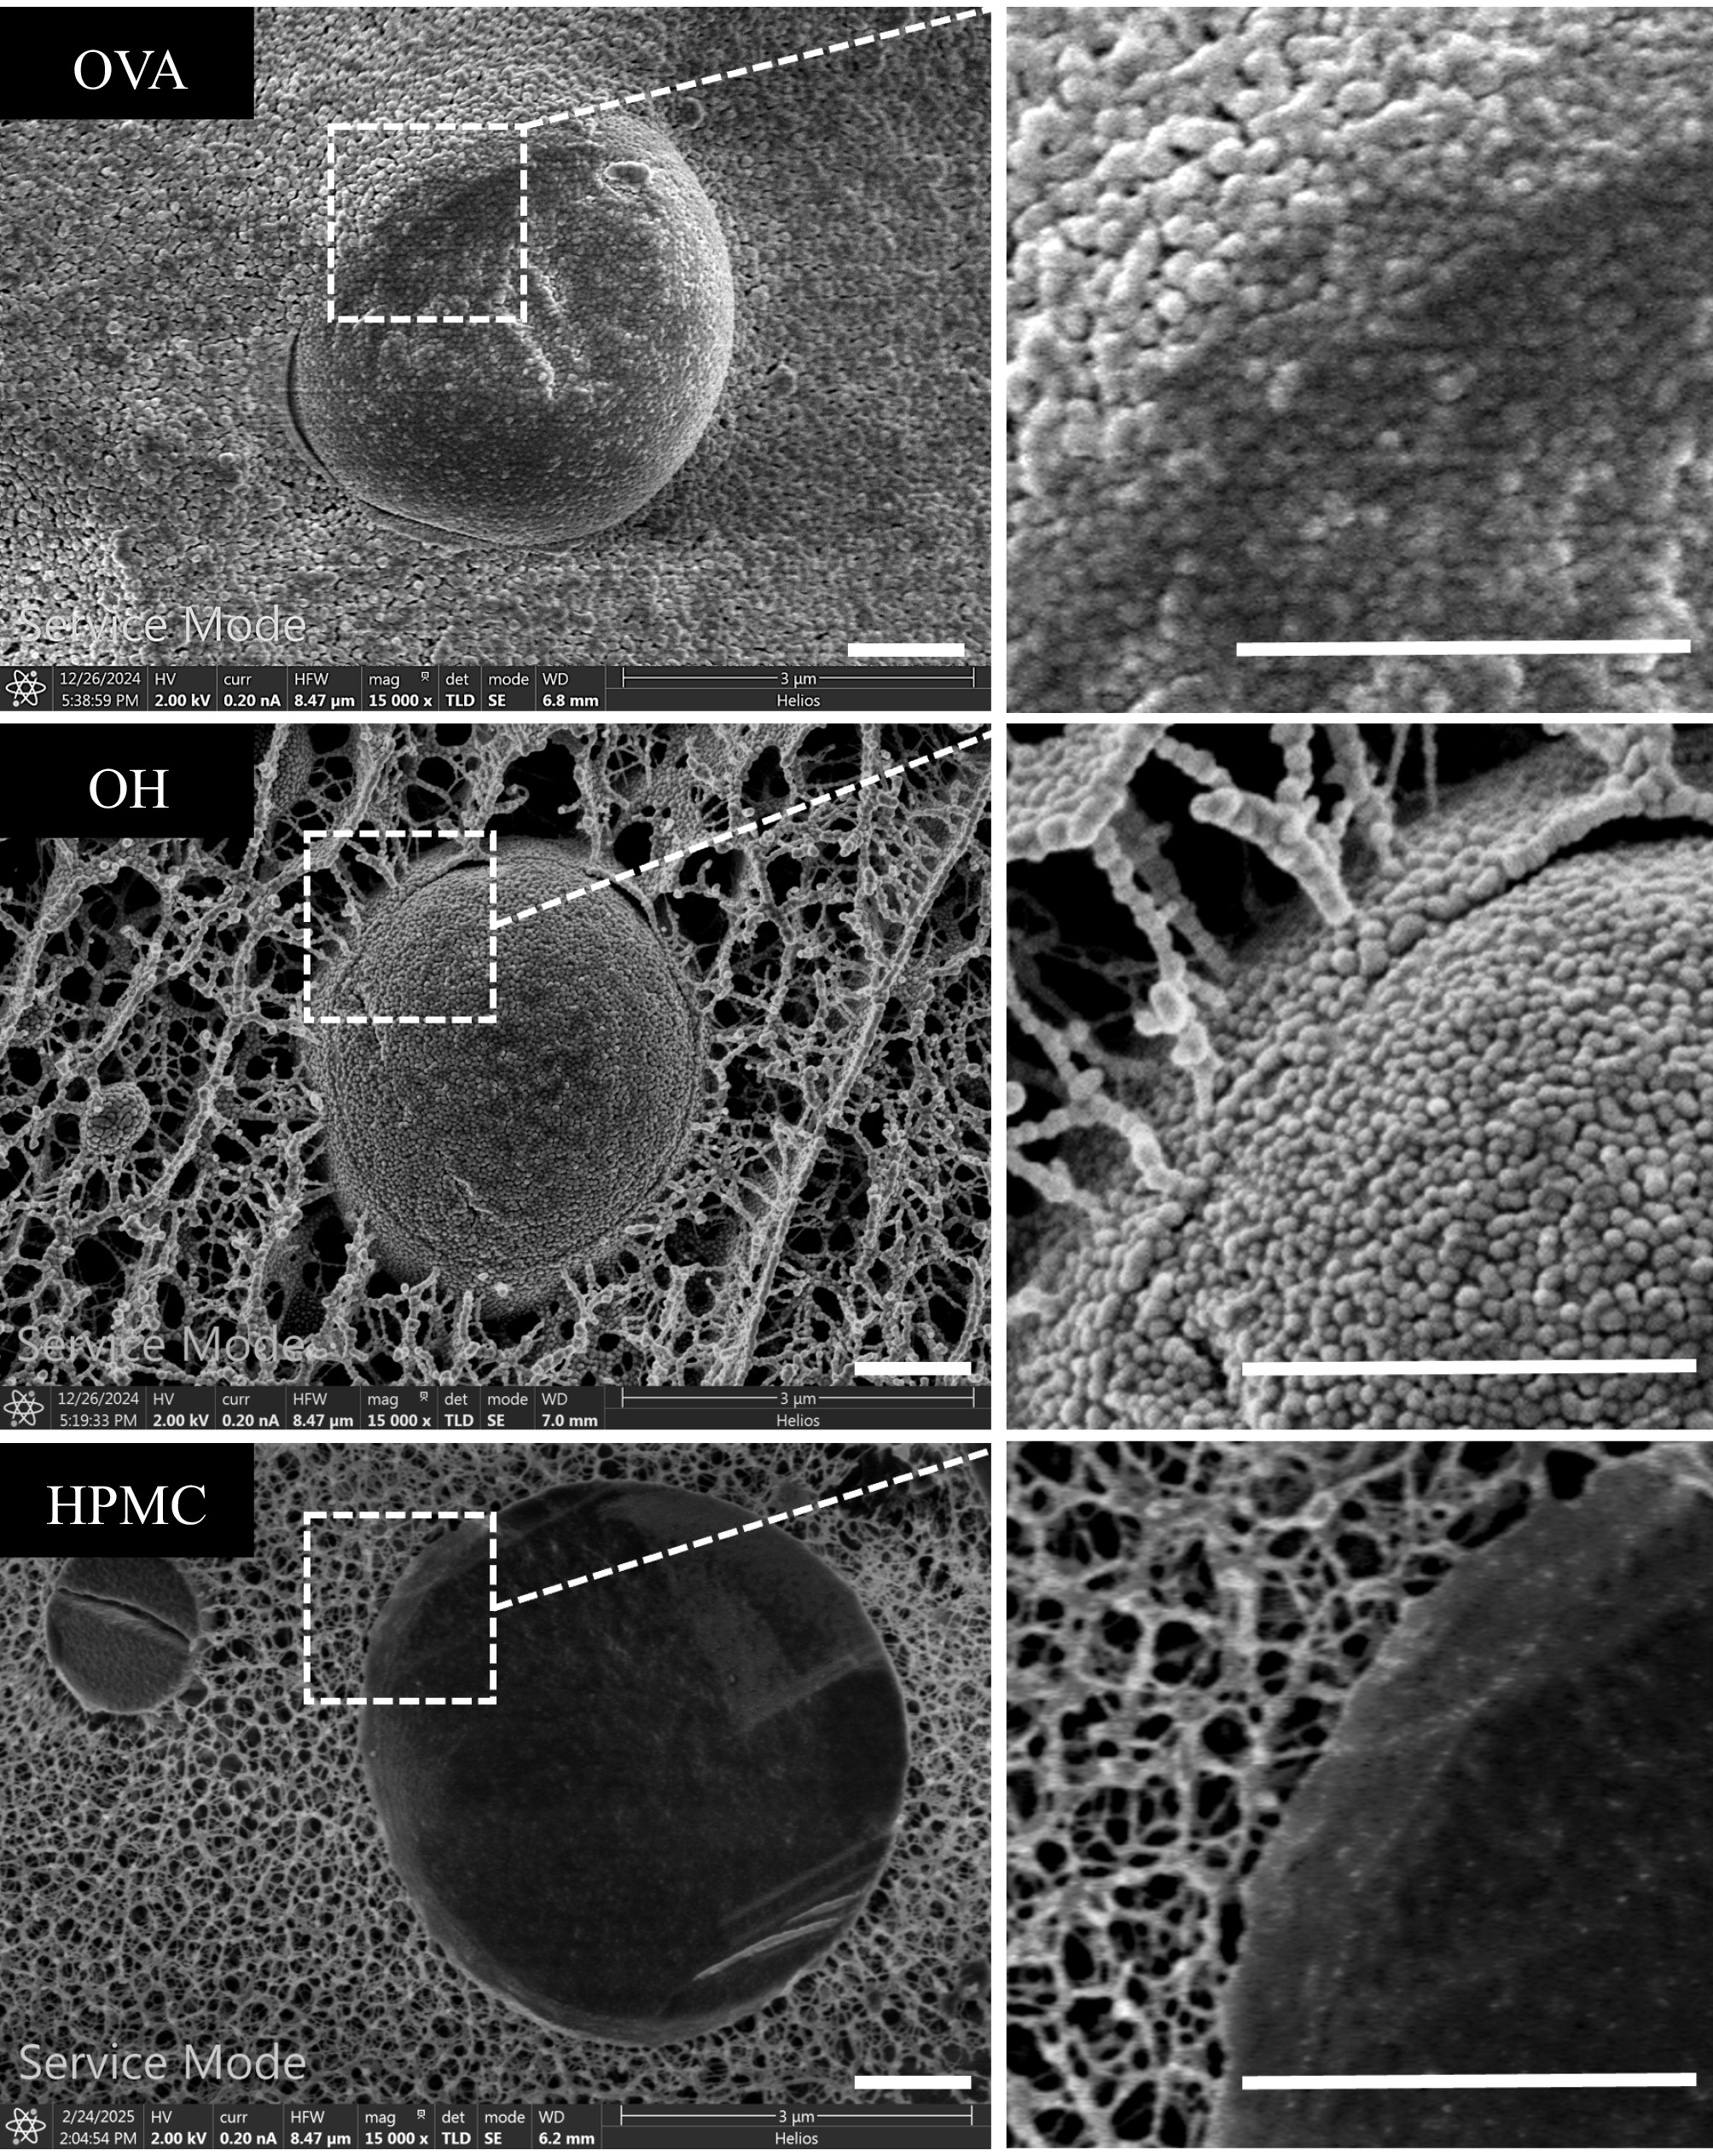
Figure 3.
Scanning electron micrographs (SEM) of bulk and surface structures in emulsions with different structuring agents (scale bar = 1 μm; using OVA50, OH50, and HPMC50 as examples).
-
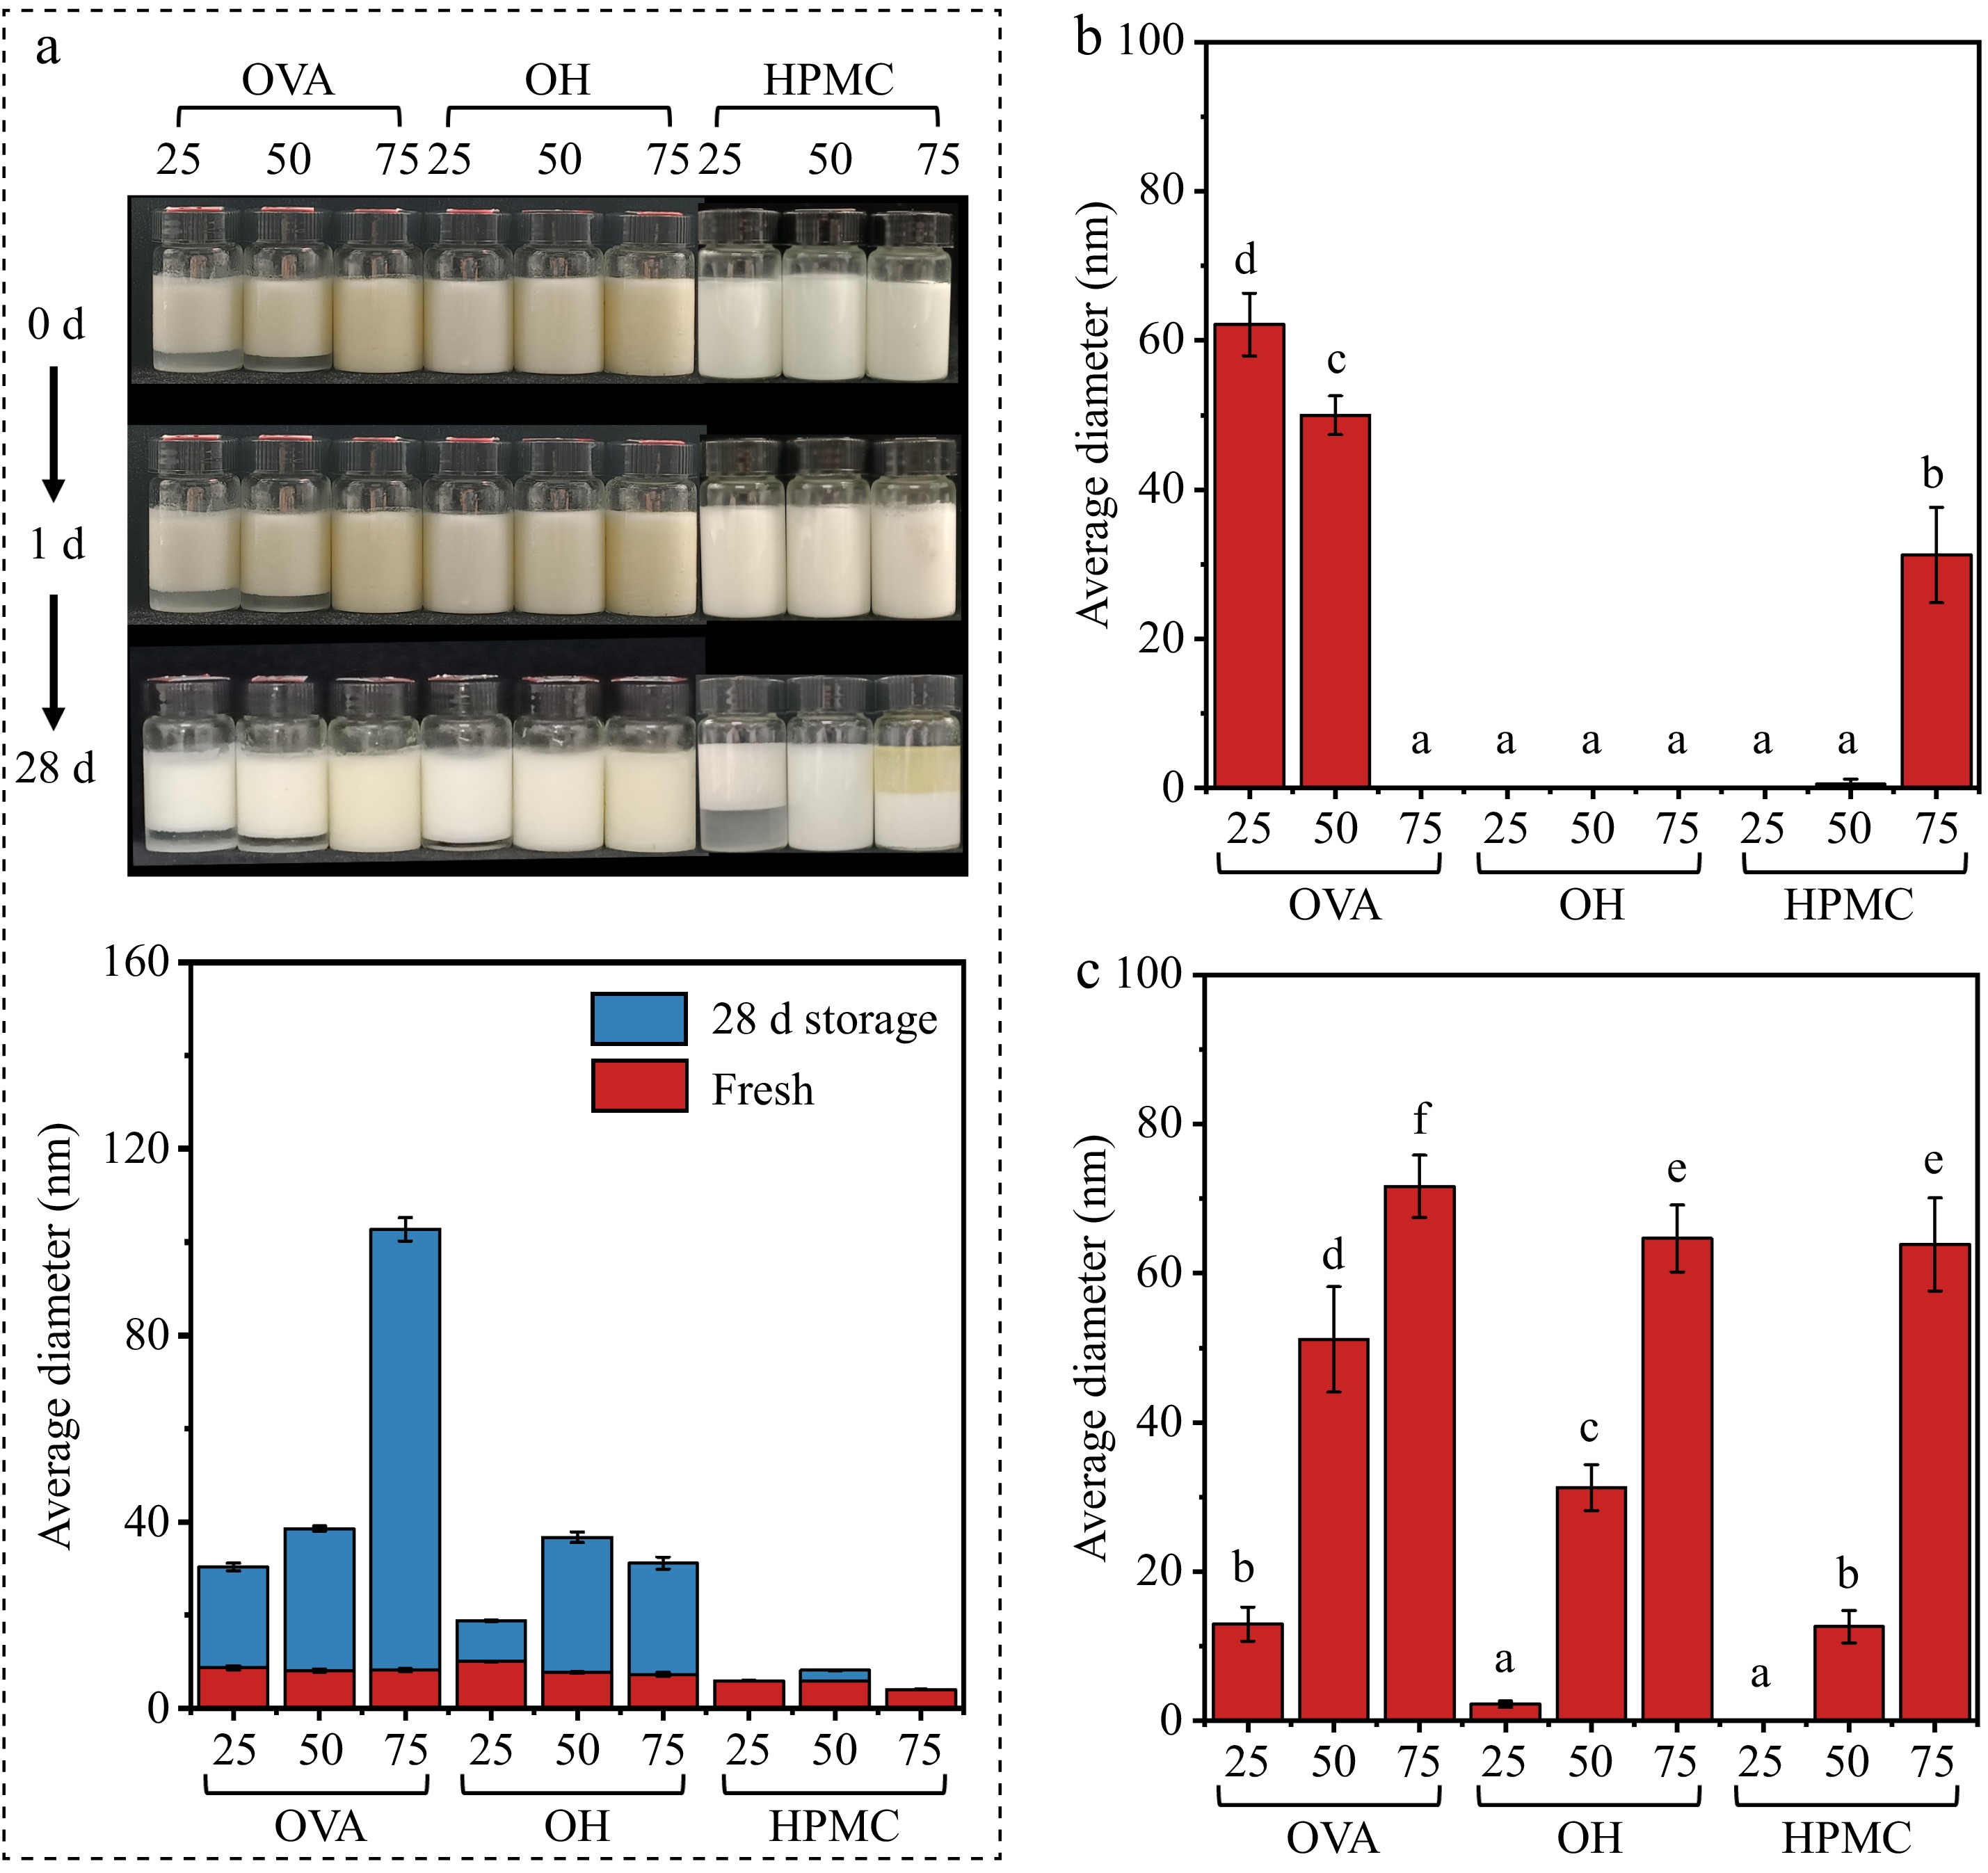
Figure 4.
Stability of emulsion with different HPMC-OVA and oil : water ratios. (a) Storage stability (top: photographs; bottom: changes in droplet size). (b) Freeze-thaw stability. (c) Centrifugal stability.
-
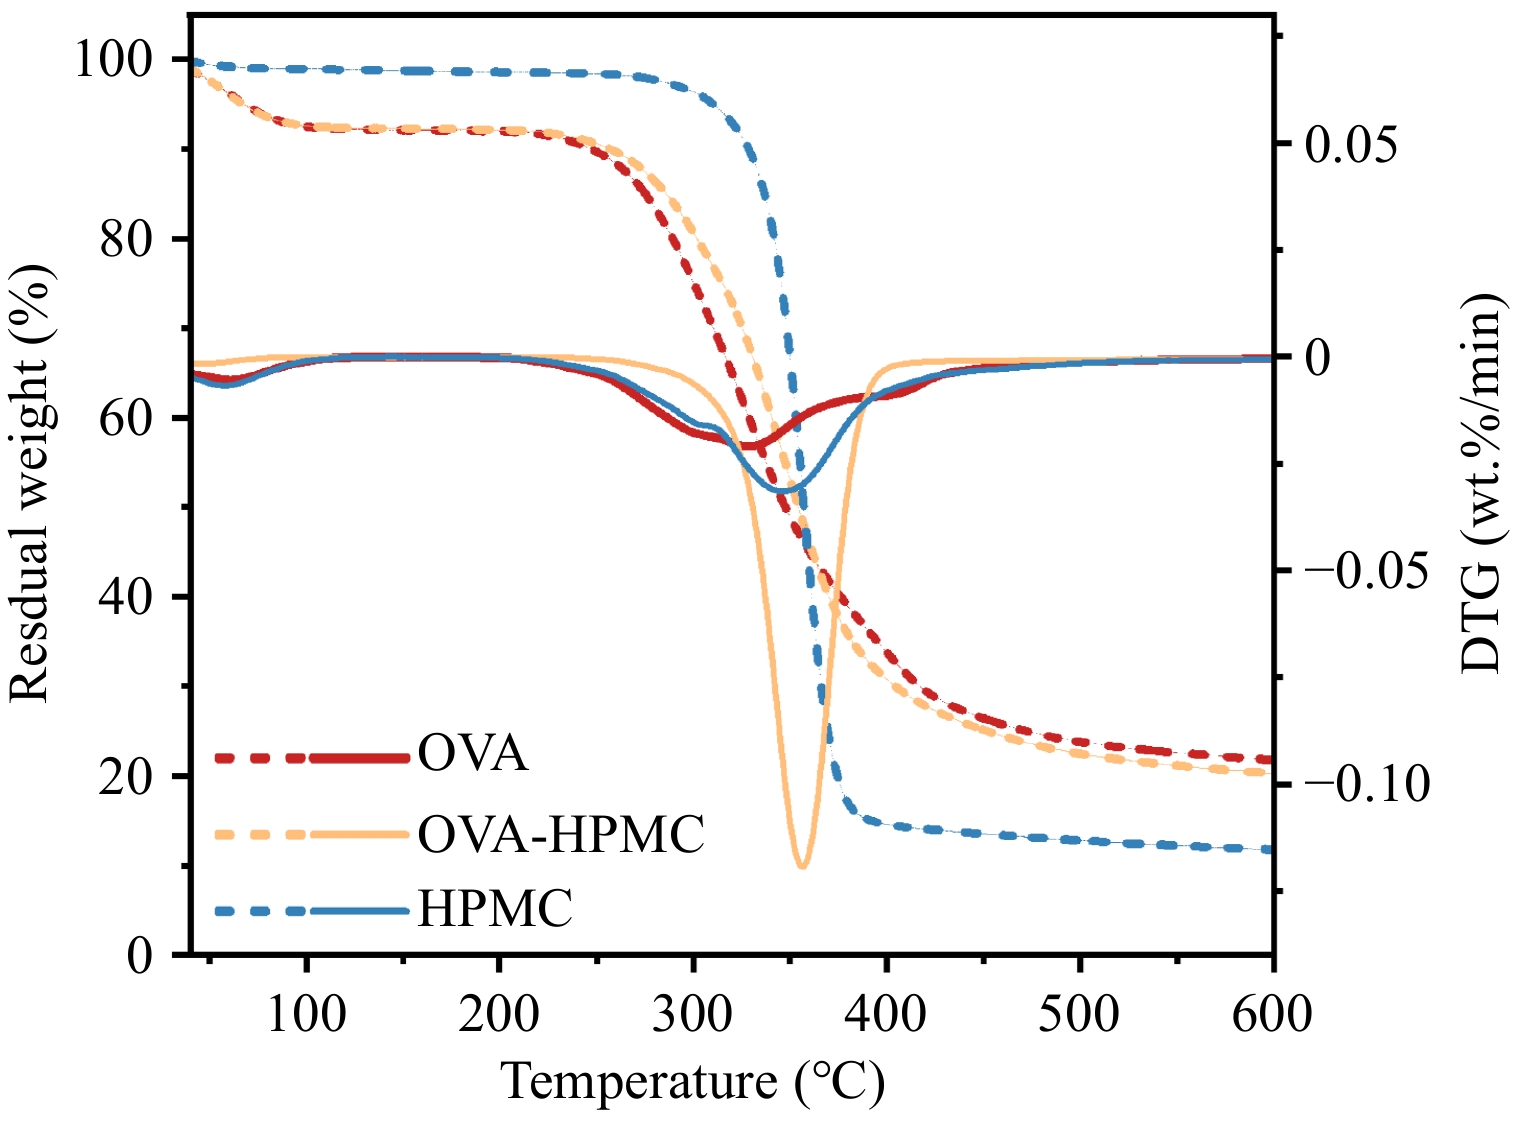
Figure 5.
Thermal properties of the dried aqueous phase contain pure OVA, OVA-HPMC complex (OVA : HPMC = 2:1 w/w), and pure HPMC.
-
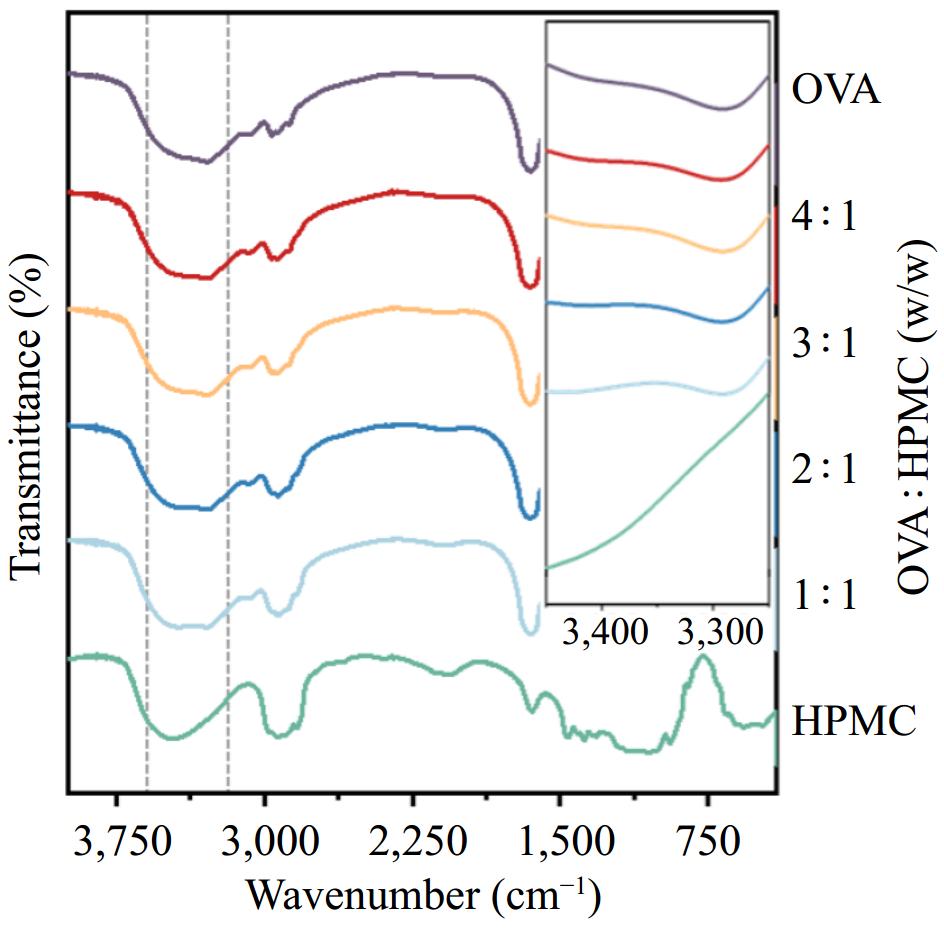
Figure 6.
The FTIR curve of dried emulsion stabilized with pure OVA, pure HPMC, and different ratios of OVA : HPMC (OVA : HPMC = 4:1, 3:1, 2:1, 1:1 w/w).
Figures
(6)
Tables
(0)