-
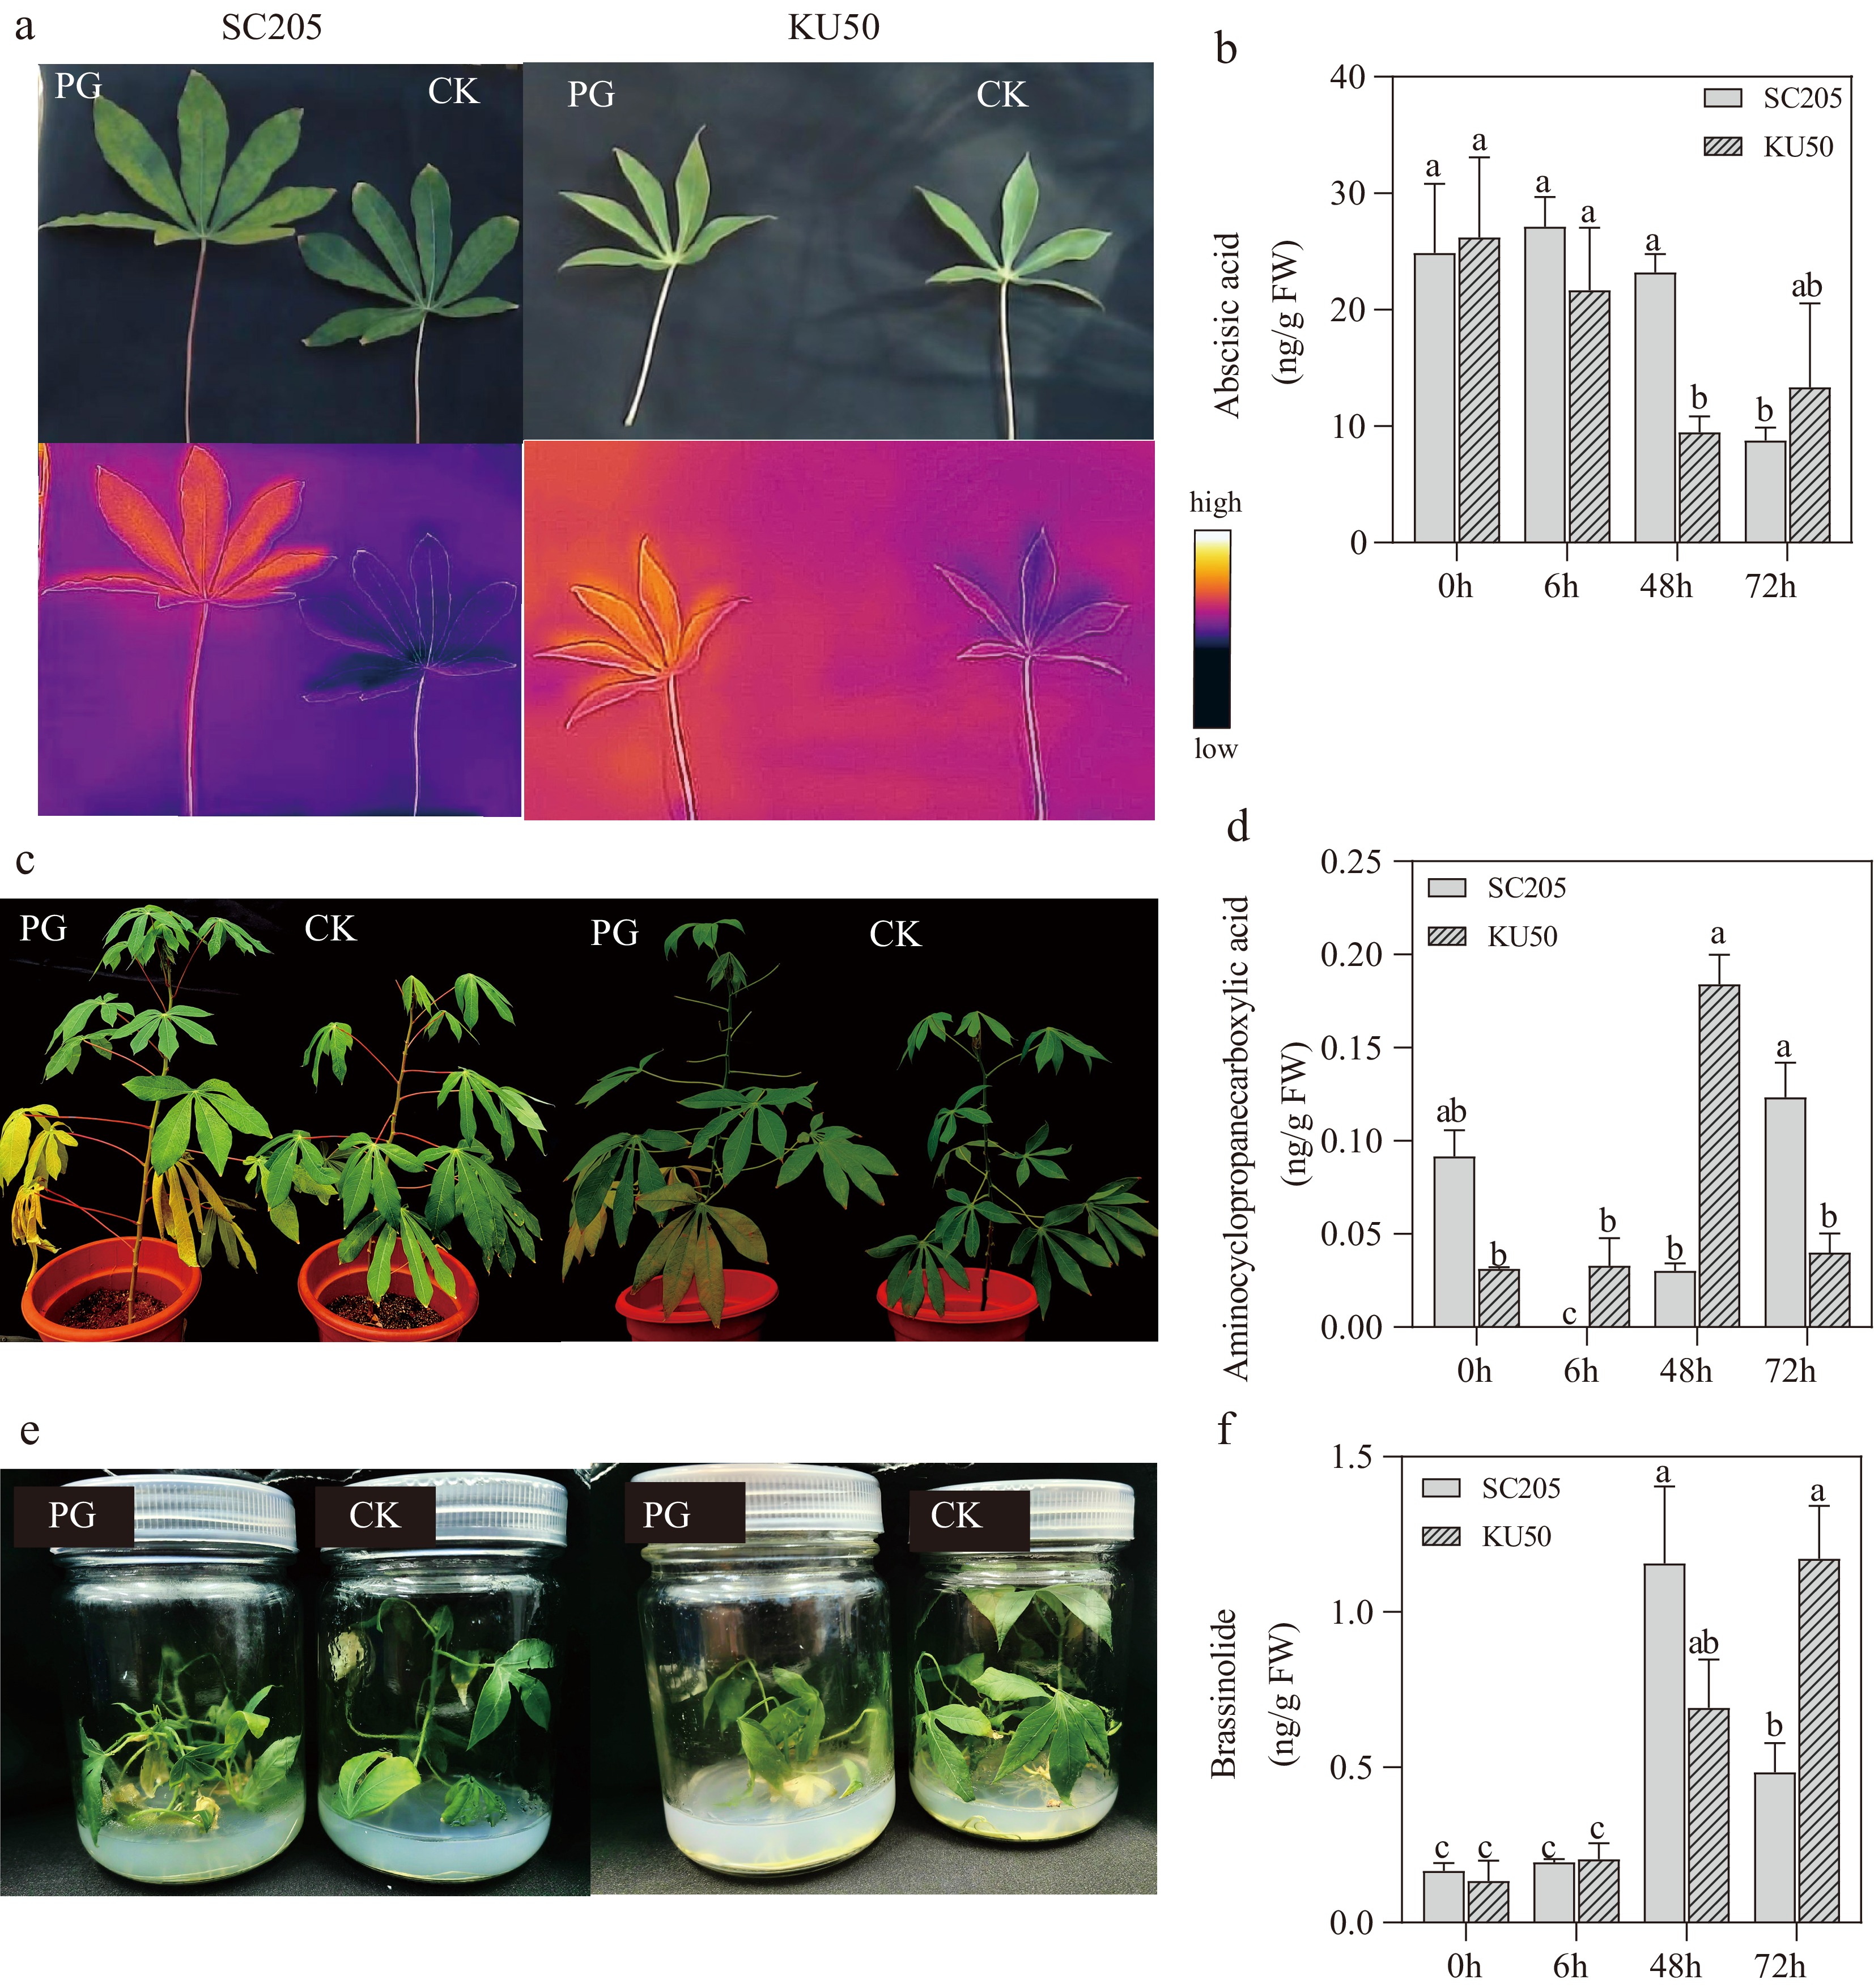
Figure 1.
Phenotypic changes in cassava under high-temperature treatment. (a) Infrared leaf temperature comparison between SC205 and KU50 under control (CK) and heat treatments (PG). (b) ABA content changes in SC205 and KU50 under high-temperature stress. (c) Phenotypic alterations of potted seedlings (control vs 72 h heat treatment) in SC205 and KU50. (d) ACC content changes in SC205 and KU50 under high-temperature stress. (e) Phenotypic alterations of tissue-cultured seedlings (control vs 72 h heat treatment) in SC205 and KU50. (f) BR content changes in SC205 and KU50 under high-temperature stress. Different lowercase letters indicate significant differences at p ≤ 0.05.
-
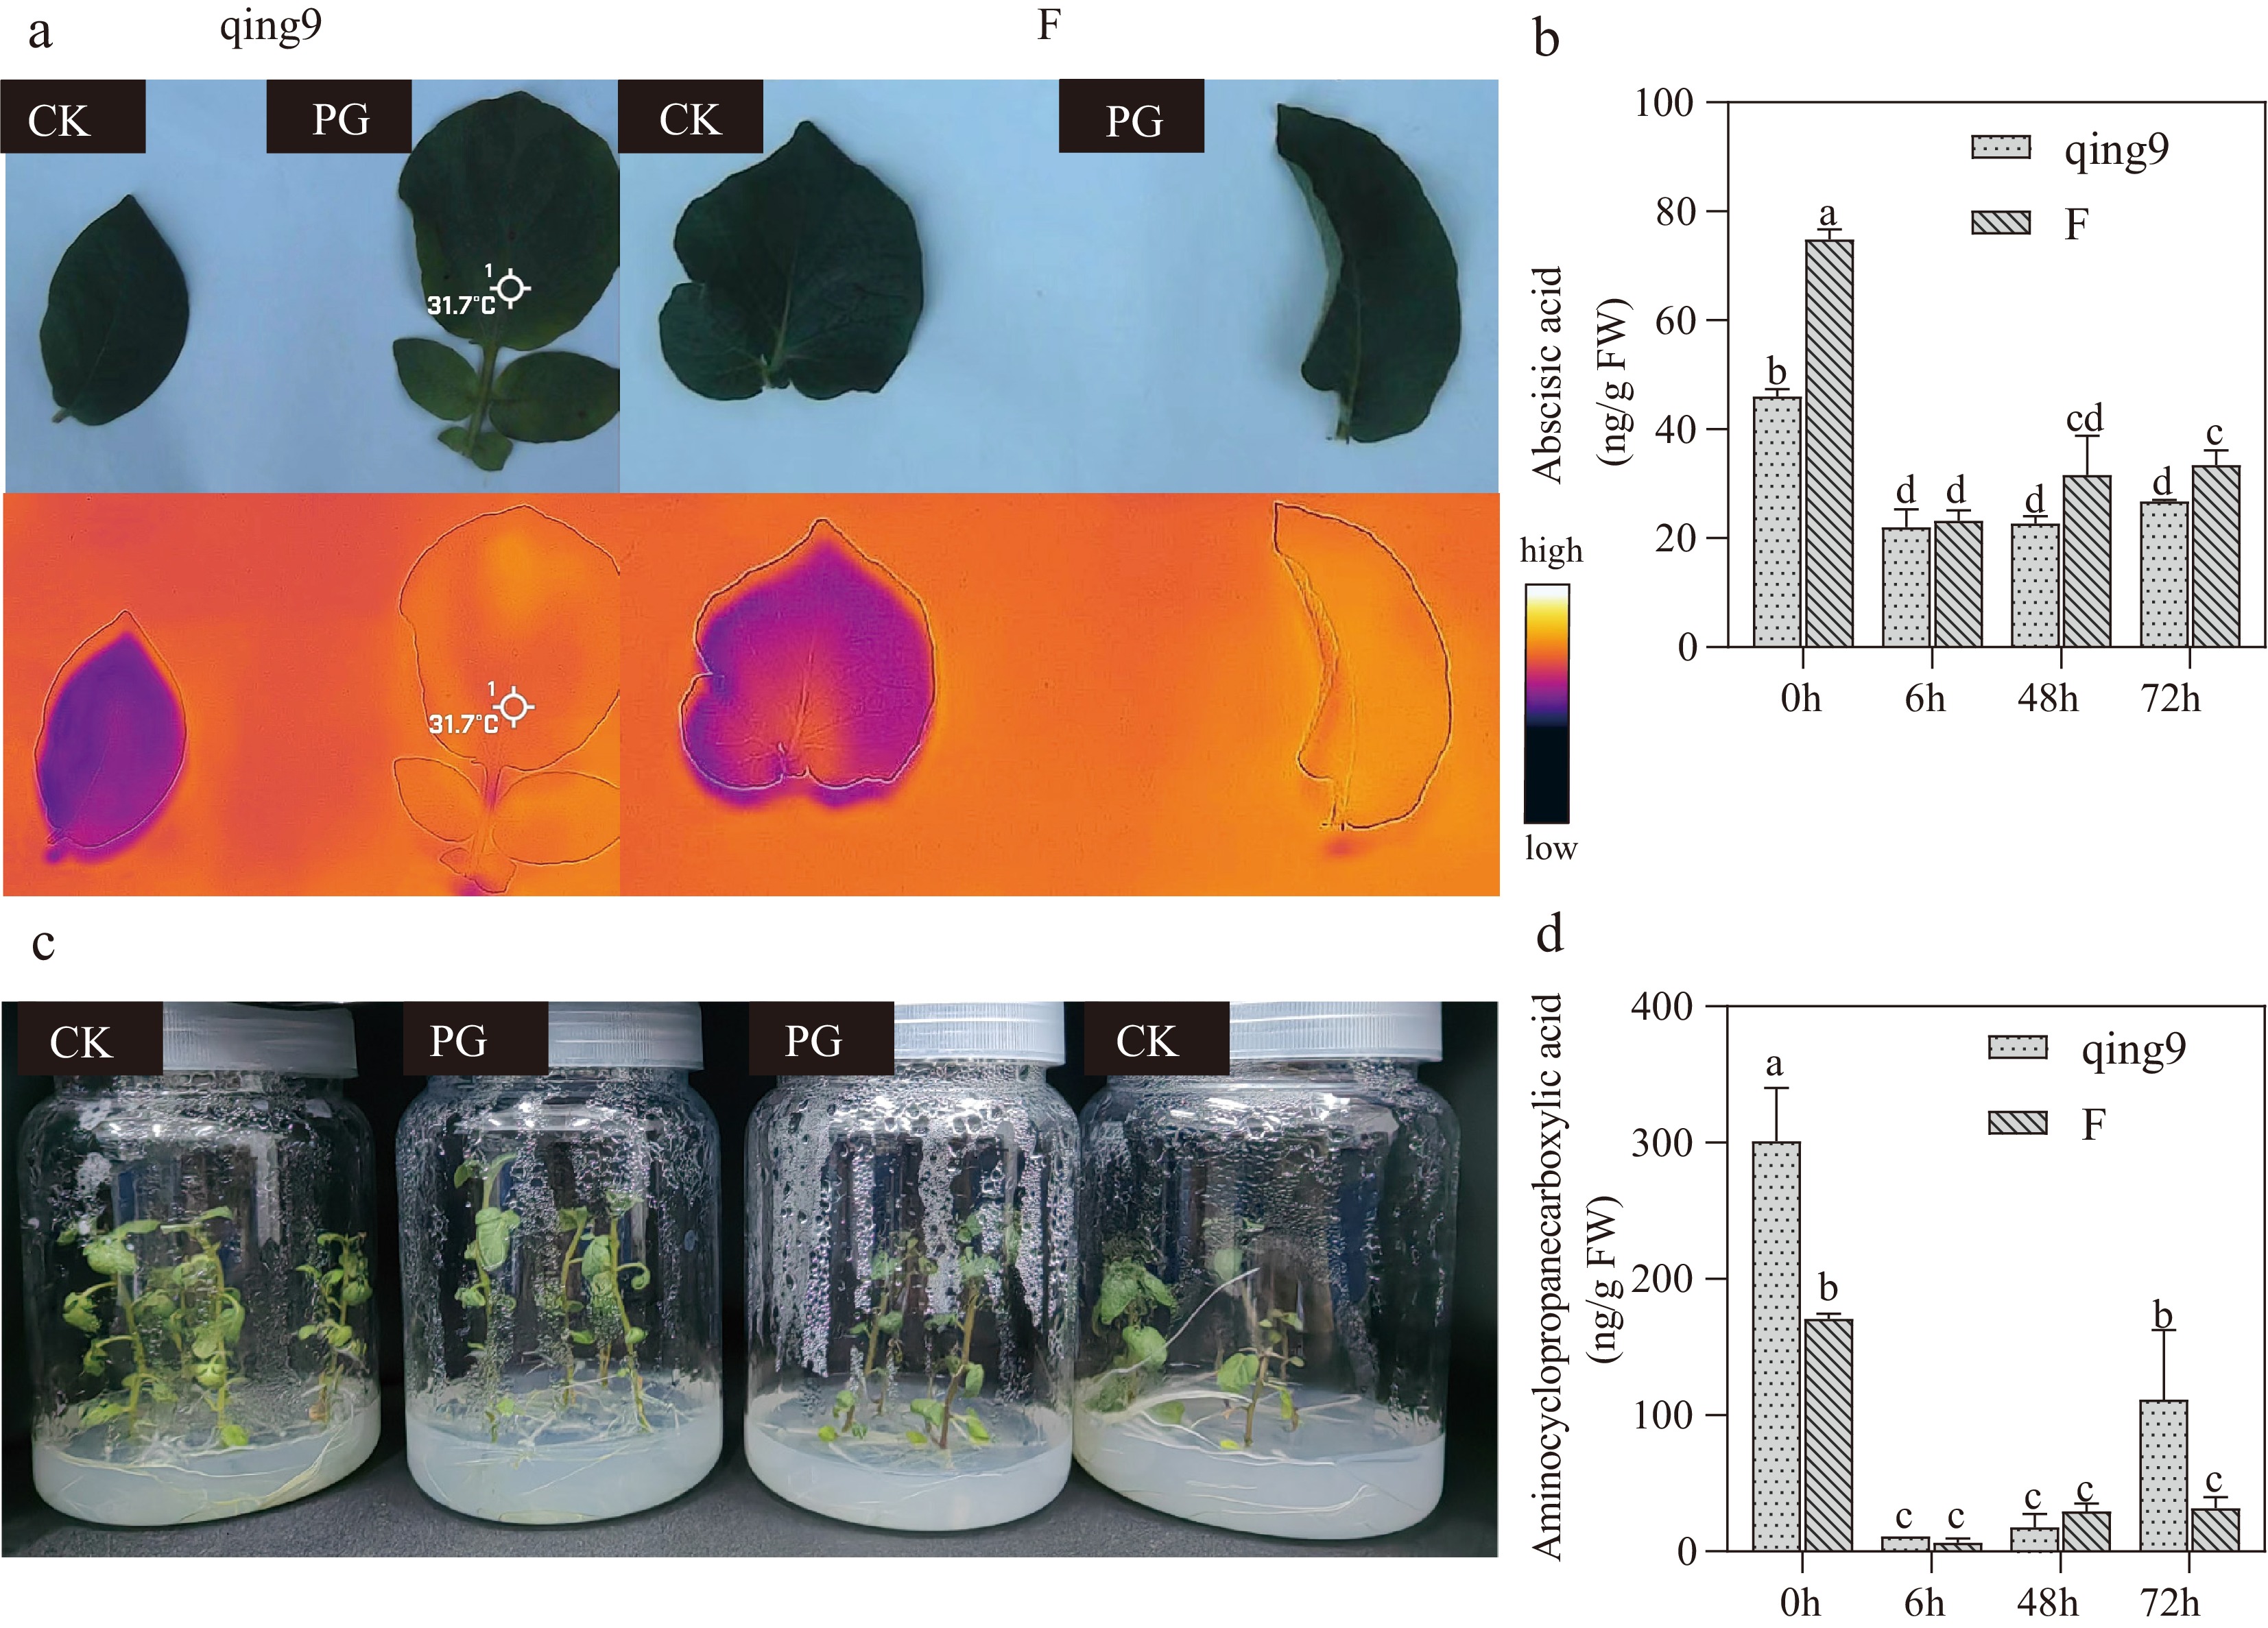
Figure 2.
Phenotypic changes in potato under high-temperature treatment. (a) Infrared leaf temperature comparison between Qingshu No. 9 and FAVORITA under control (CK) and heat treatments (PG). (b) ABA content changes in Qingshu No. 9 and FAVORITA under high-temperature stress. (c) Phenotypic alterations of tissue-cultured seedlings (control vs 72 h heat treatment) in Qingshu No. 9 and FAVORITA. (d) ACC content changes in Qingshu No. 9 and FAVORITA under high-temperature stress. Different lowercase letters indicate significant differences at p ≤ 0.05.
-
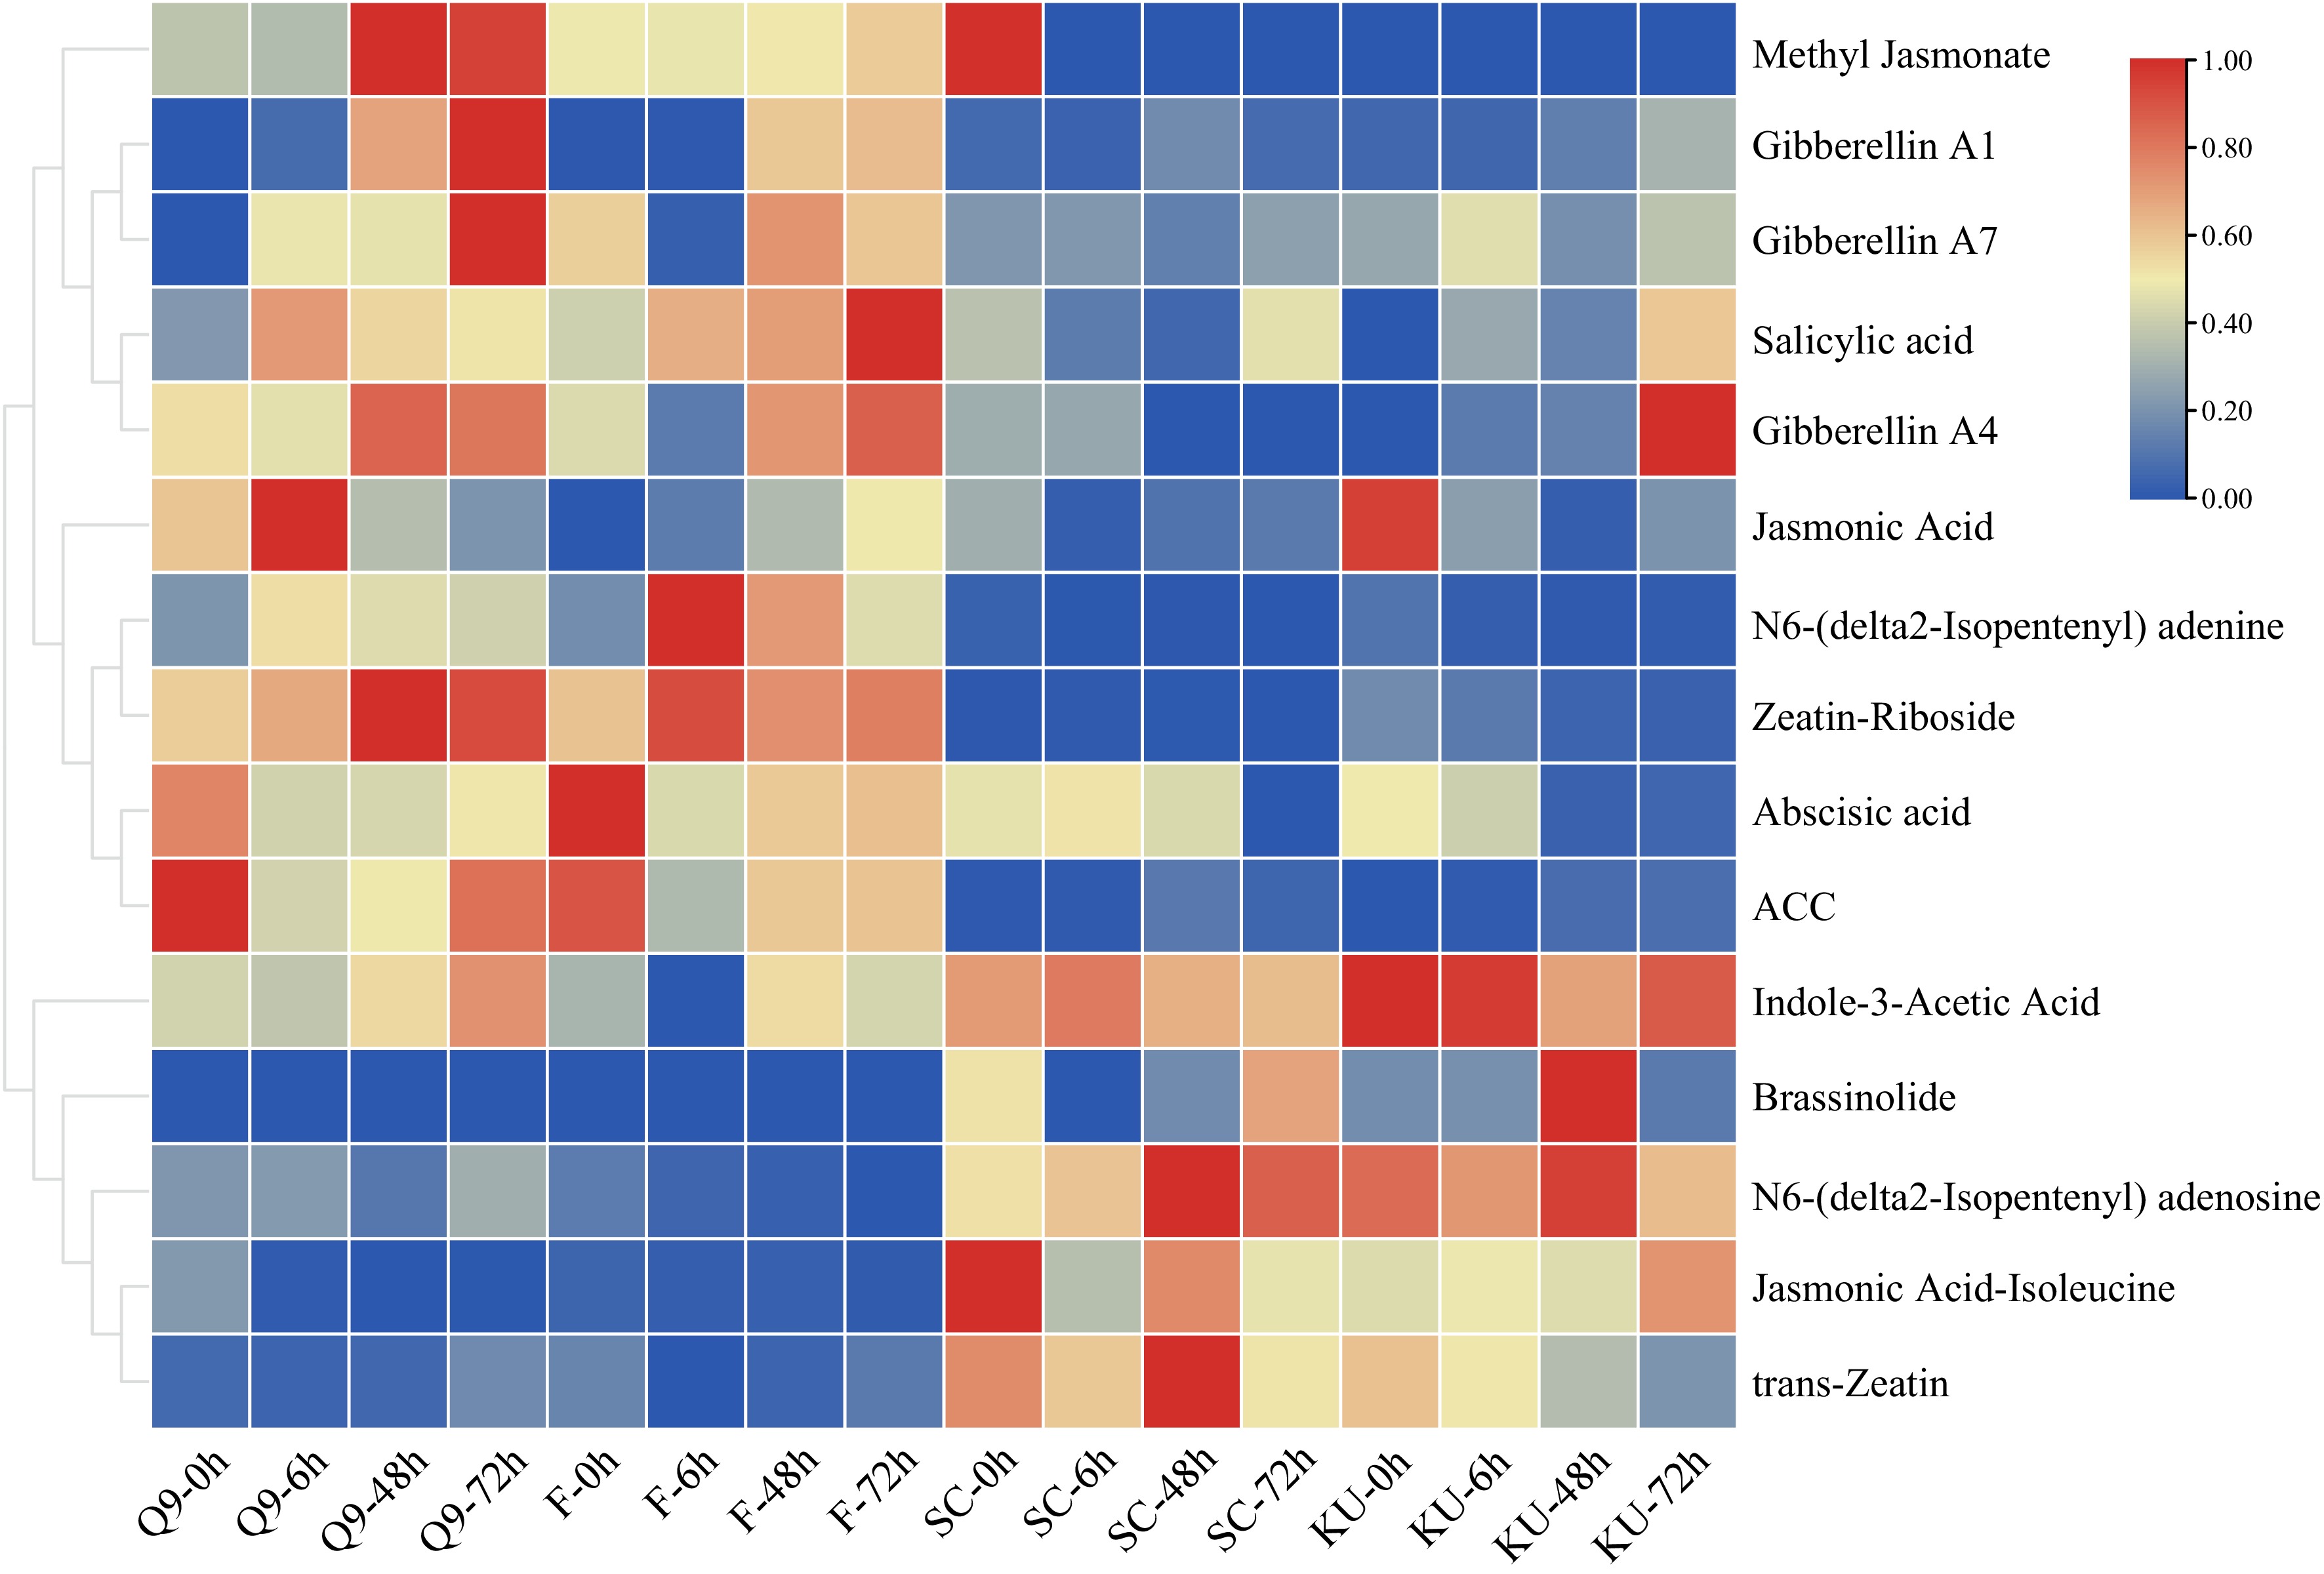
Figure 3.
Heatmap of hormone content changes in potato and cassava under high-temperature treatment. qing9 denotes Qingshu No. 9, F denotes FAVORITA, SC denotes cassava SC205, and KU denotes cassava KU50.
-
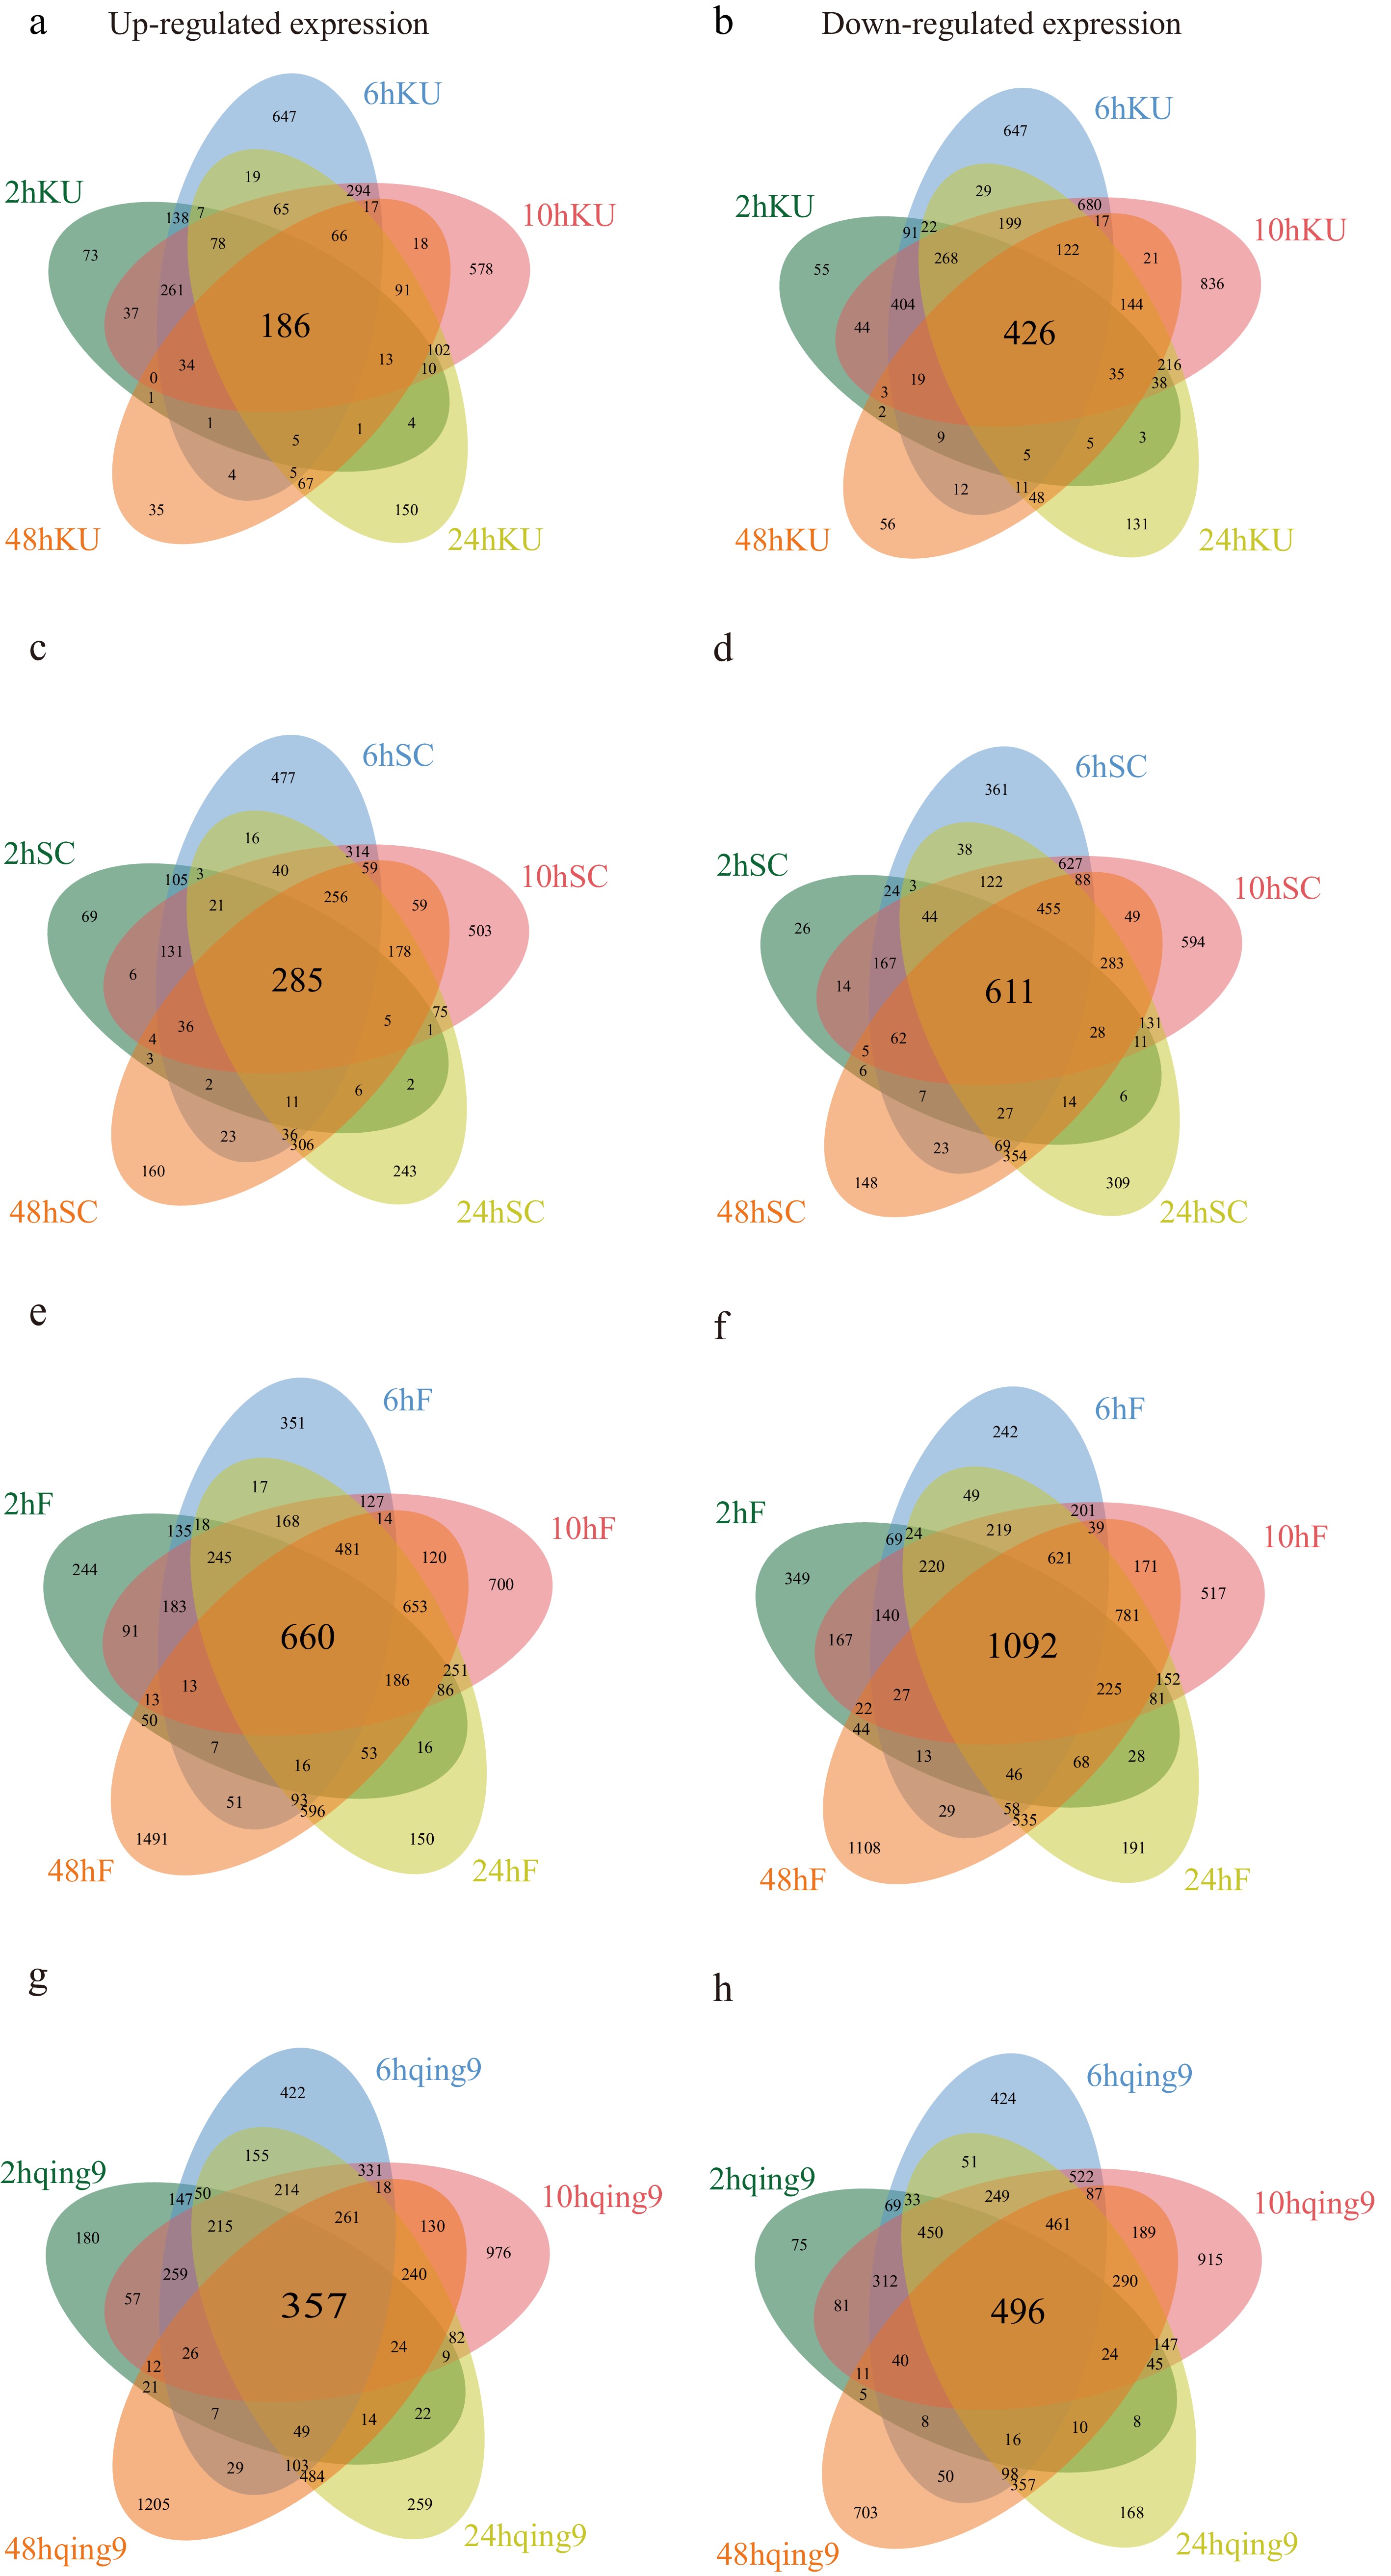
Figure 4.
Venn diagrams of differentially expressed genes (DEGs) in cassava and potato under heat treatment. (a) Venn diagram of up-regulated DEGs in KU50 (heat vs control). (b) Venn diagram of down-regulated DEGs in KU50 (heat vs control). (c) Venn diagram of up-regulated DEGs in SC205 (heat vs control). (d) Venn diagram of down-regulated DEGs in SC205 (heat vs control). (e) Venn diagram of up-regulated DEGs in FAVORITA (heat vs control). (f) Venn diagram of down-regulated DEGs in FAVORITA (heat vs control). (g) Venn diagram of up-regulated DEGs in Qingshu No. 9 (heat vs control). (h) Venn diagram of down-regulated DEGs in Qingshu No. 9 (heat vs control).
-
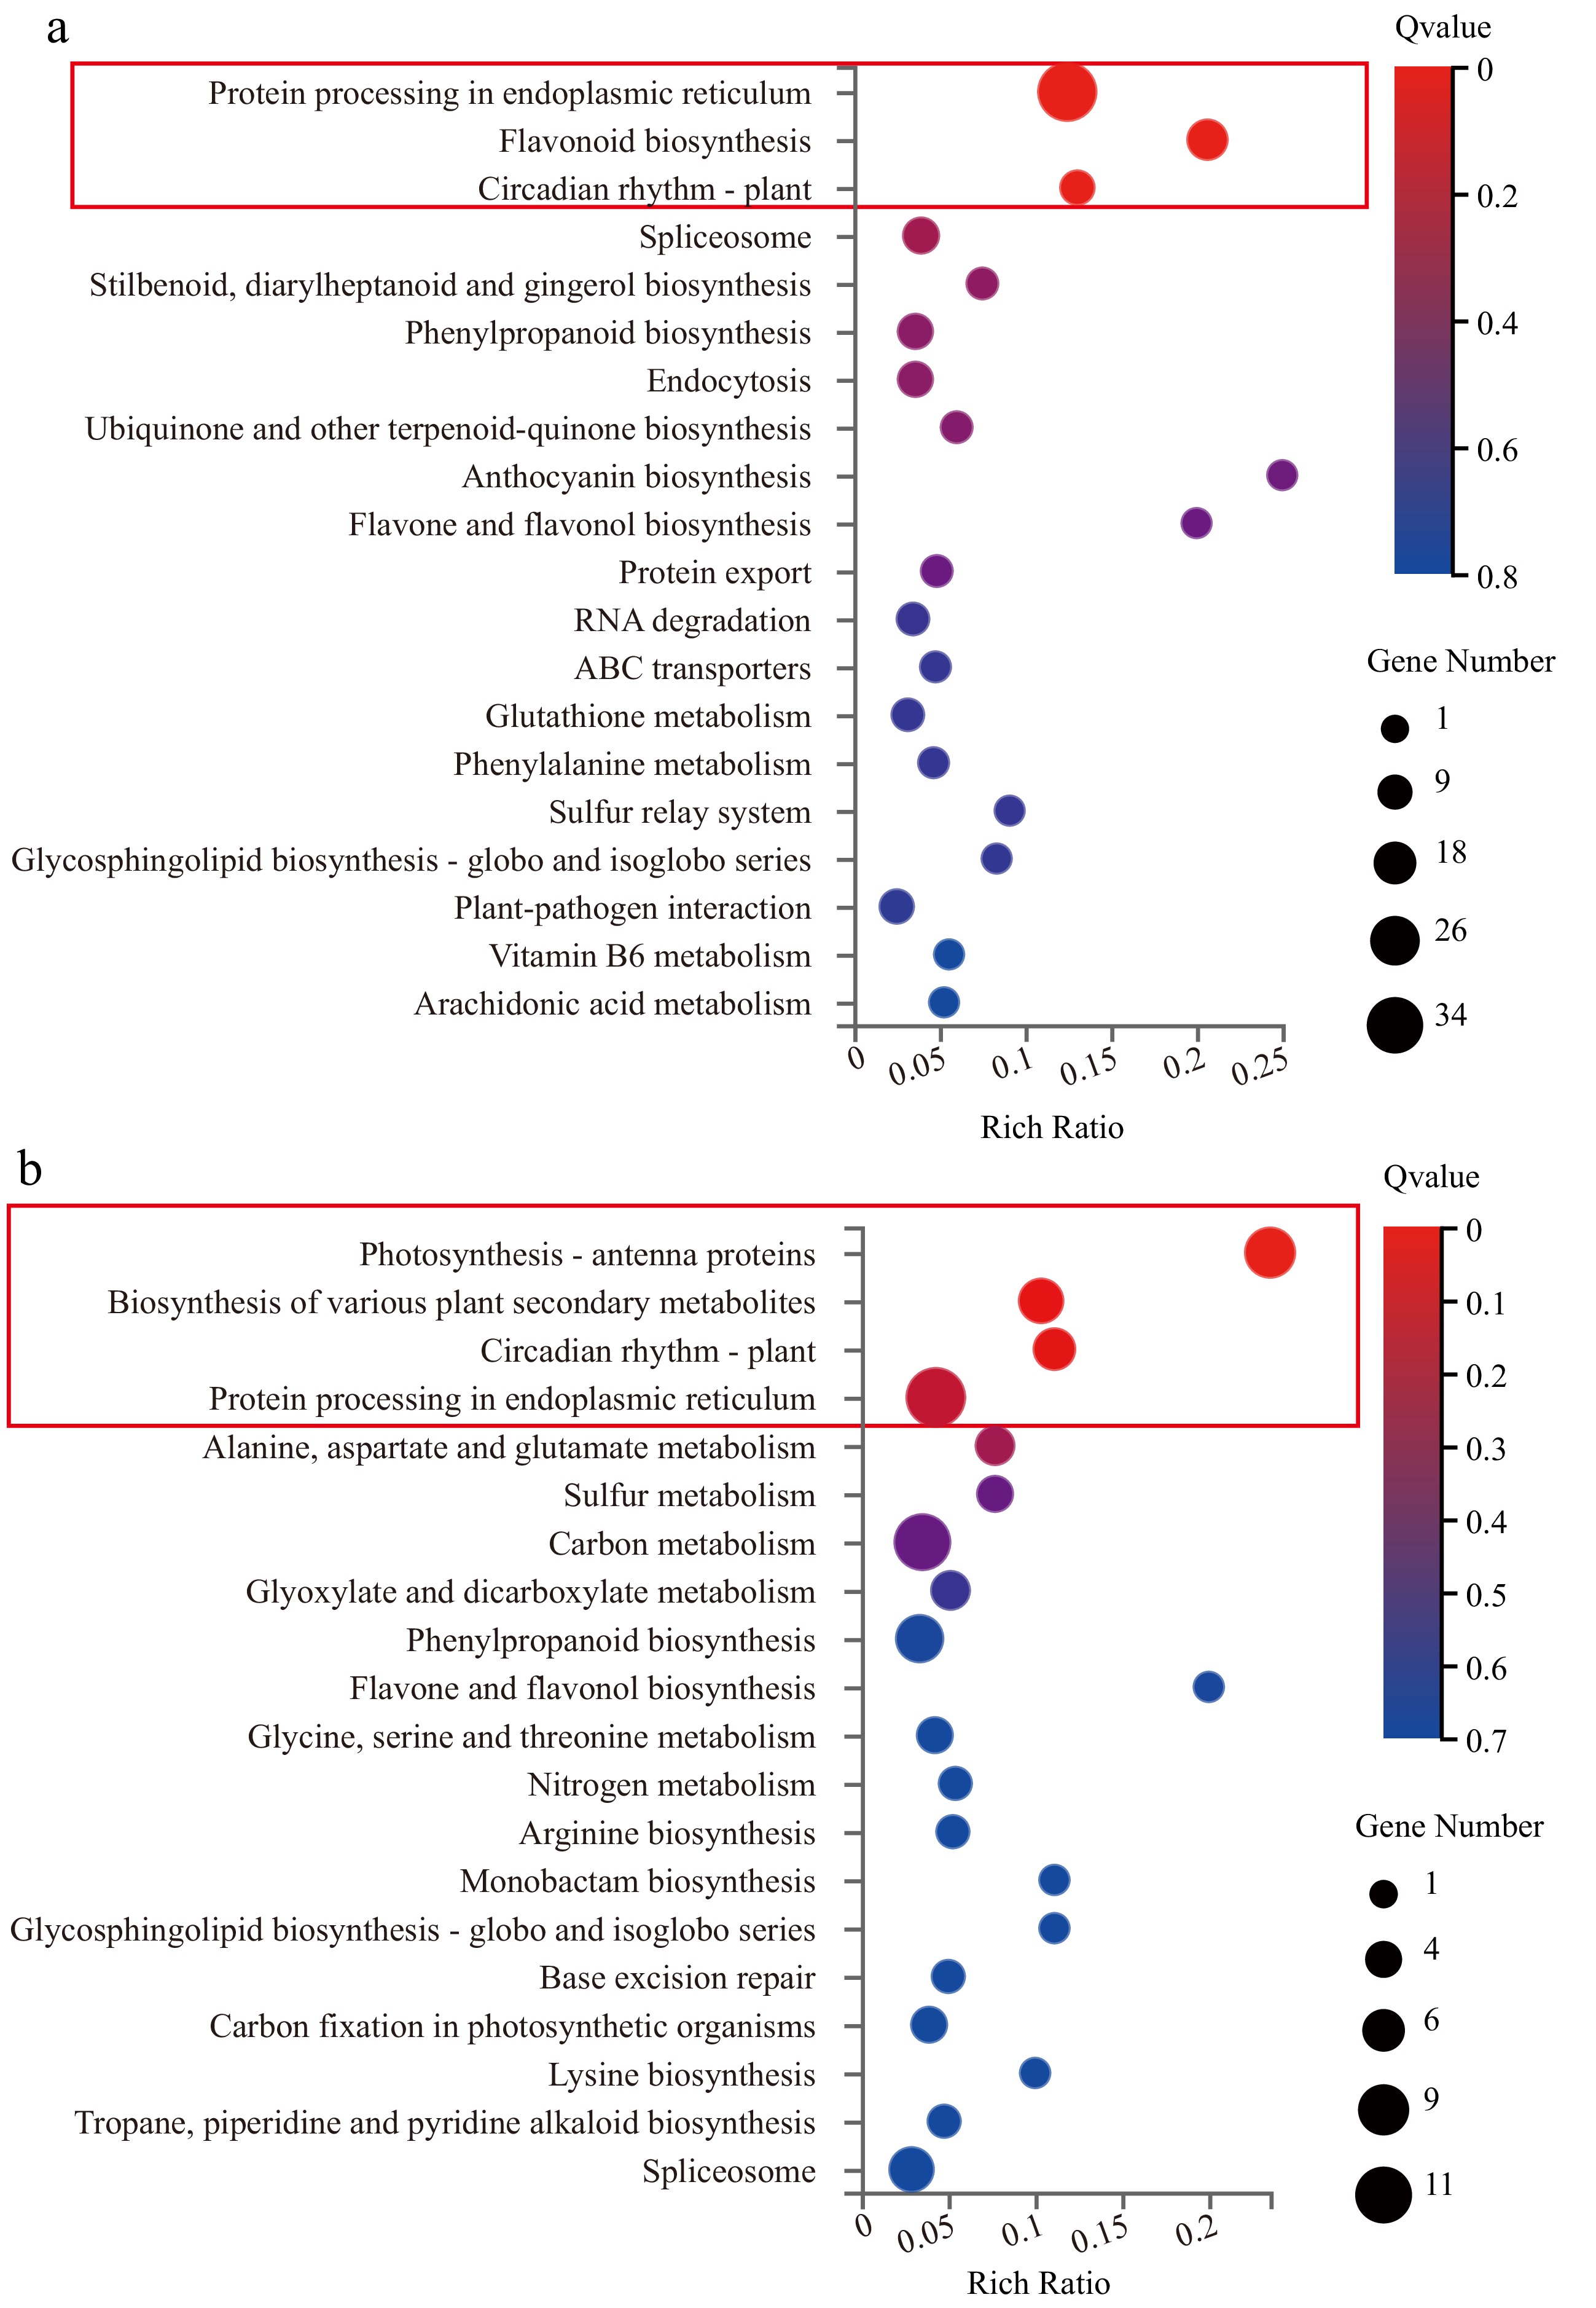
Figure 5.
Comparison of enriched KEGG metabolic pathways between cassava and potato. (a) KEGG enrichment of consistently expressed differential genes shared in cassava. (b) KEGG enrichment of consistently expressed differential genes shared in potato.
-

Figure 6.
Comparison of transcription factors under high-temperature stress between cassava and potato. (a) Statistical chart of transcription factors in cassava under heat stress. (b) Statistical chart of transcription factors in potato under heat stress.
-
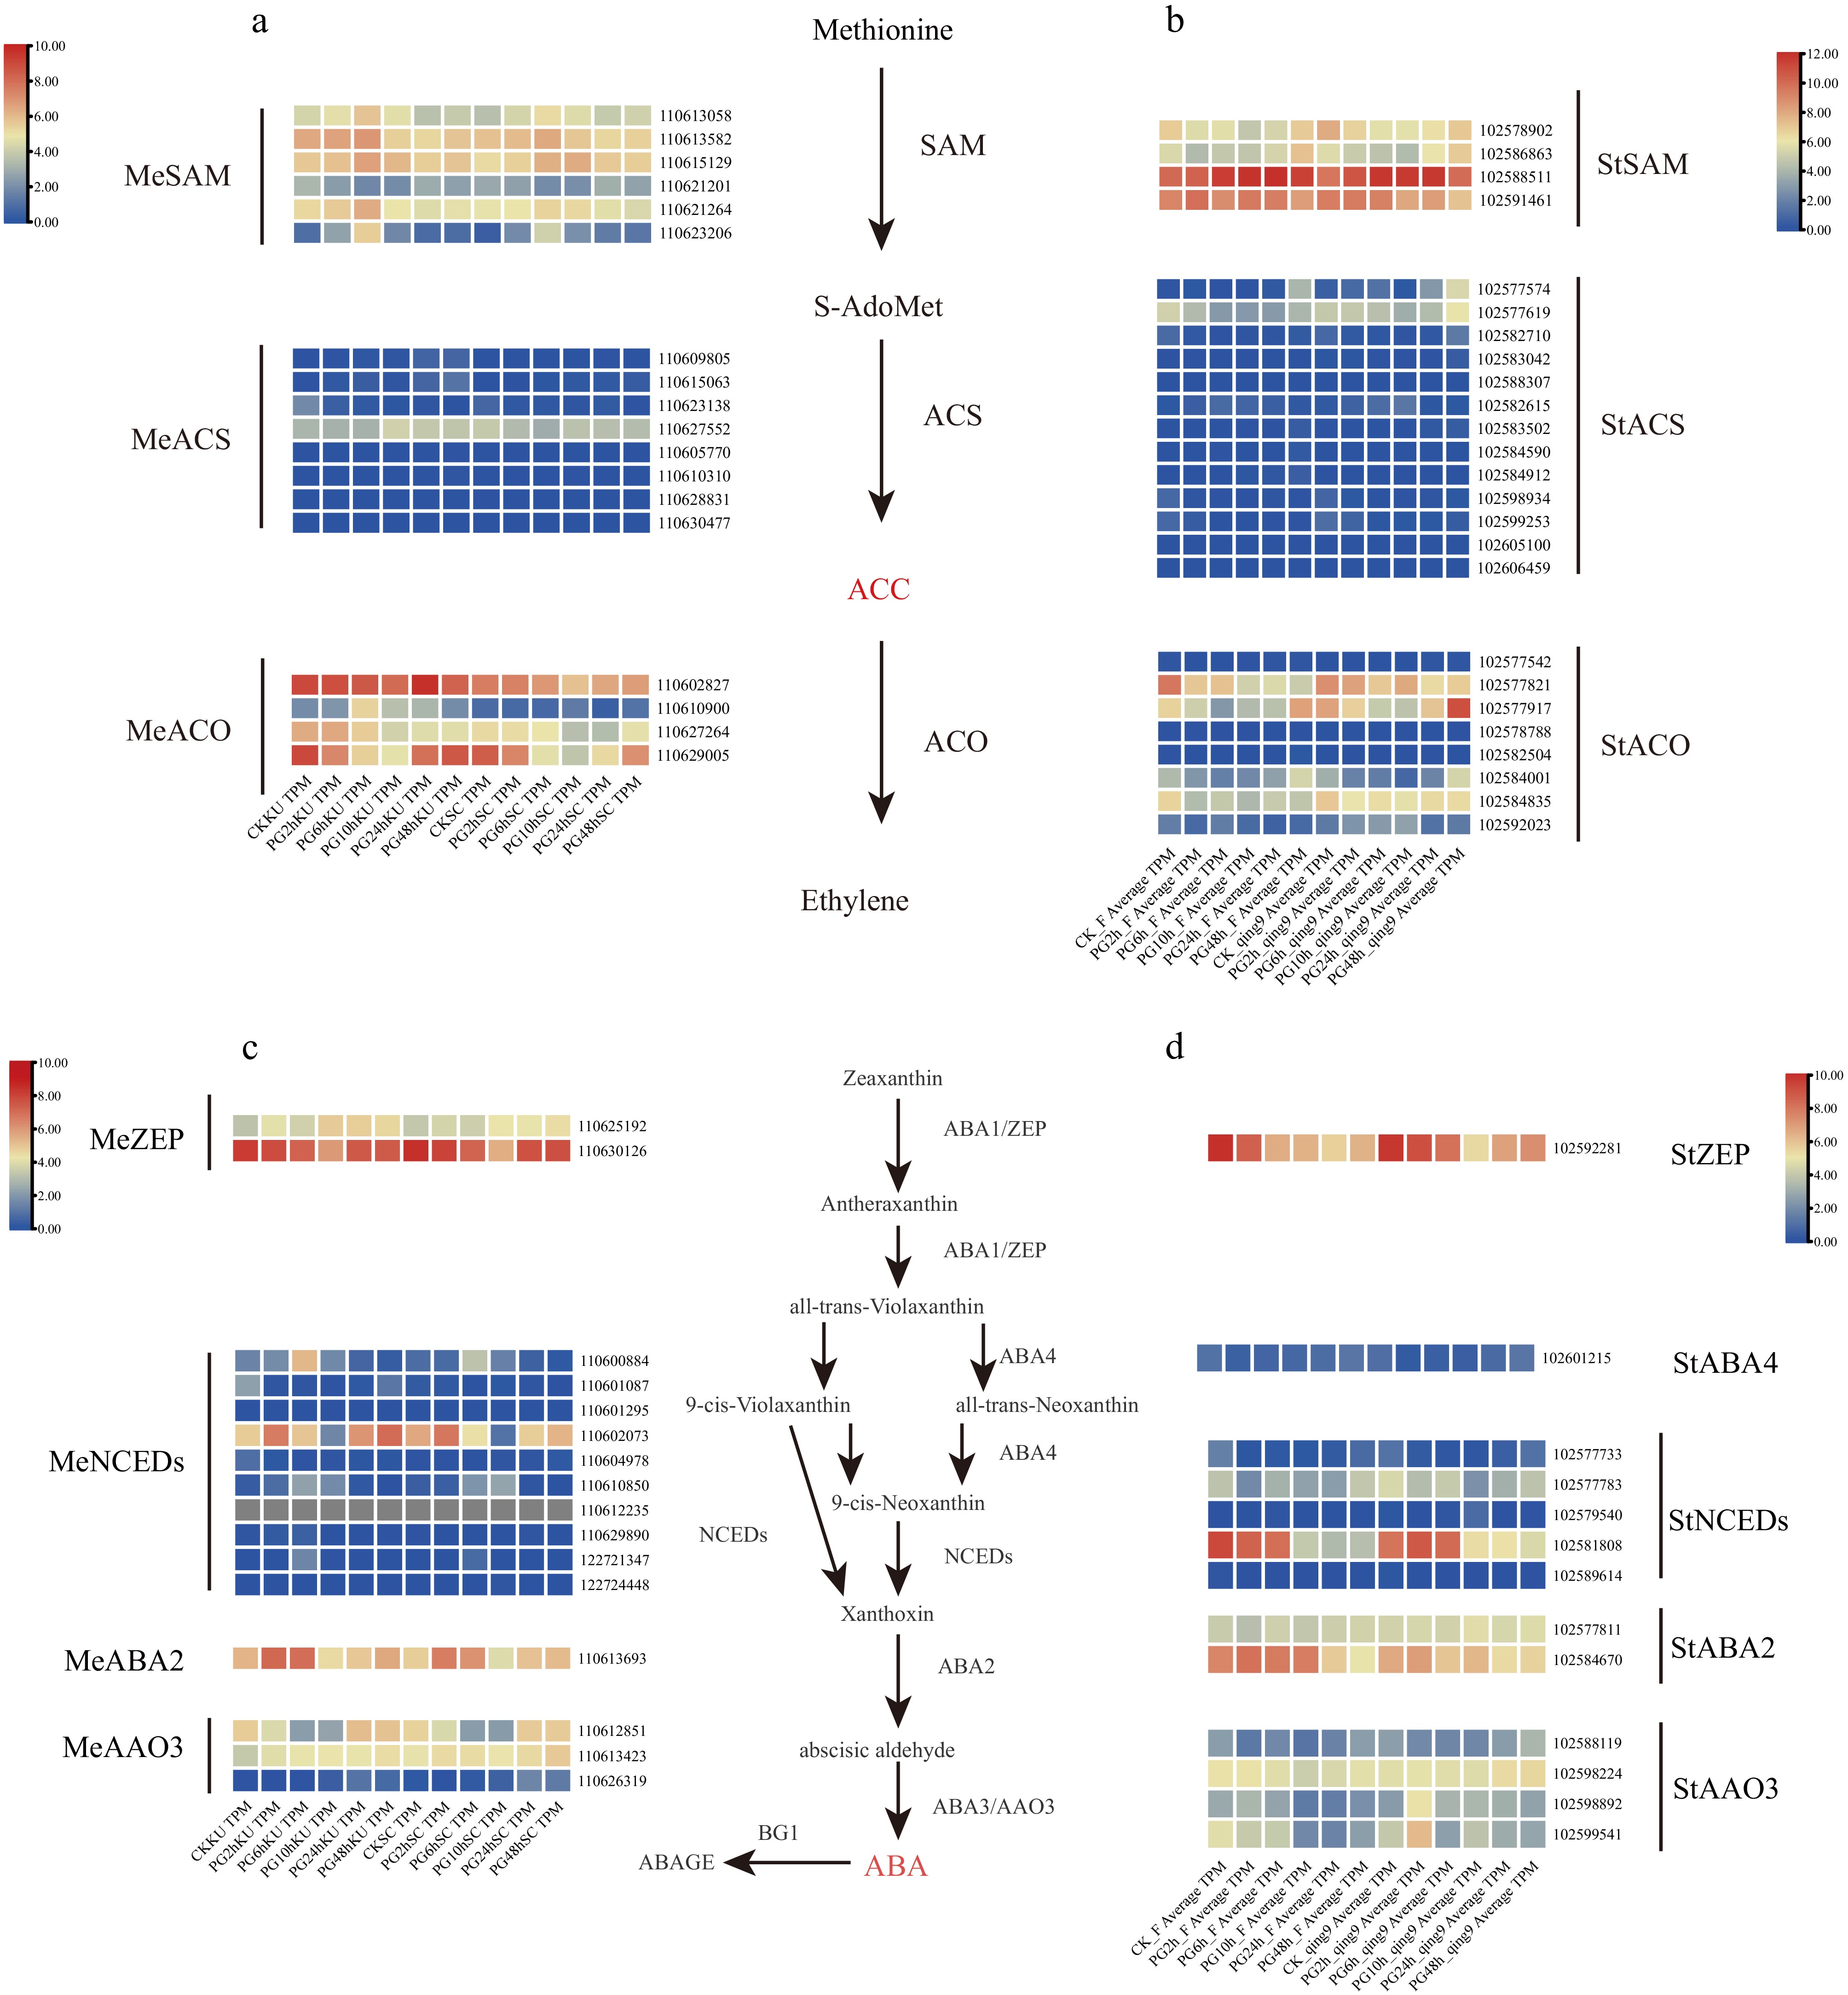
Figure 7.
Hormone biosynthesis pathway responses in cassava and potato under high-temperature stress (Heatmap: red, up-regulation; blue, down-regulation). (a) Ethylene biosynthesis pathway in cassava under heat stress. (b) Ethylene biosynthesis pathway in potato under heat stress. (c) ABA biosynthesis pathway in cassava under heat stress. (d) ABA biosynthesis pathway in potato under heat stress.
-
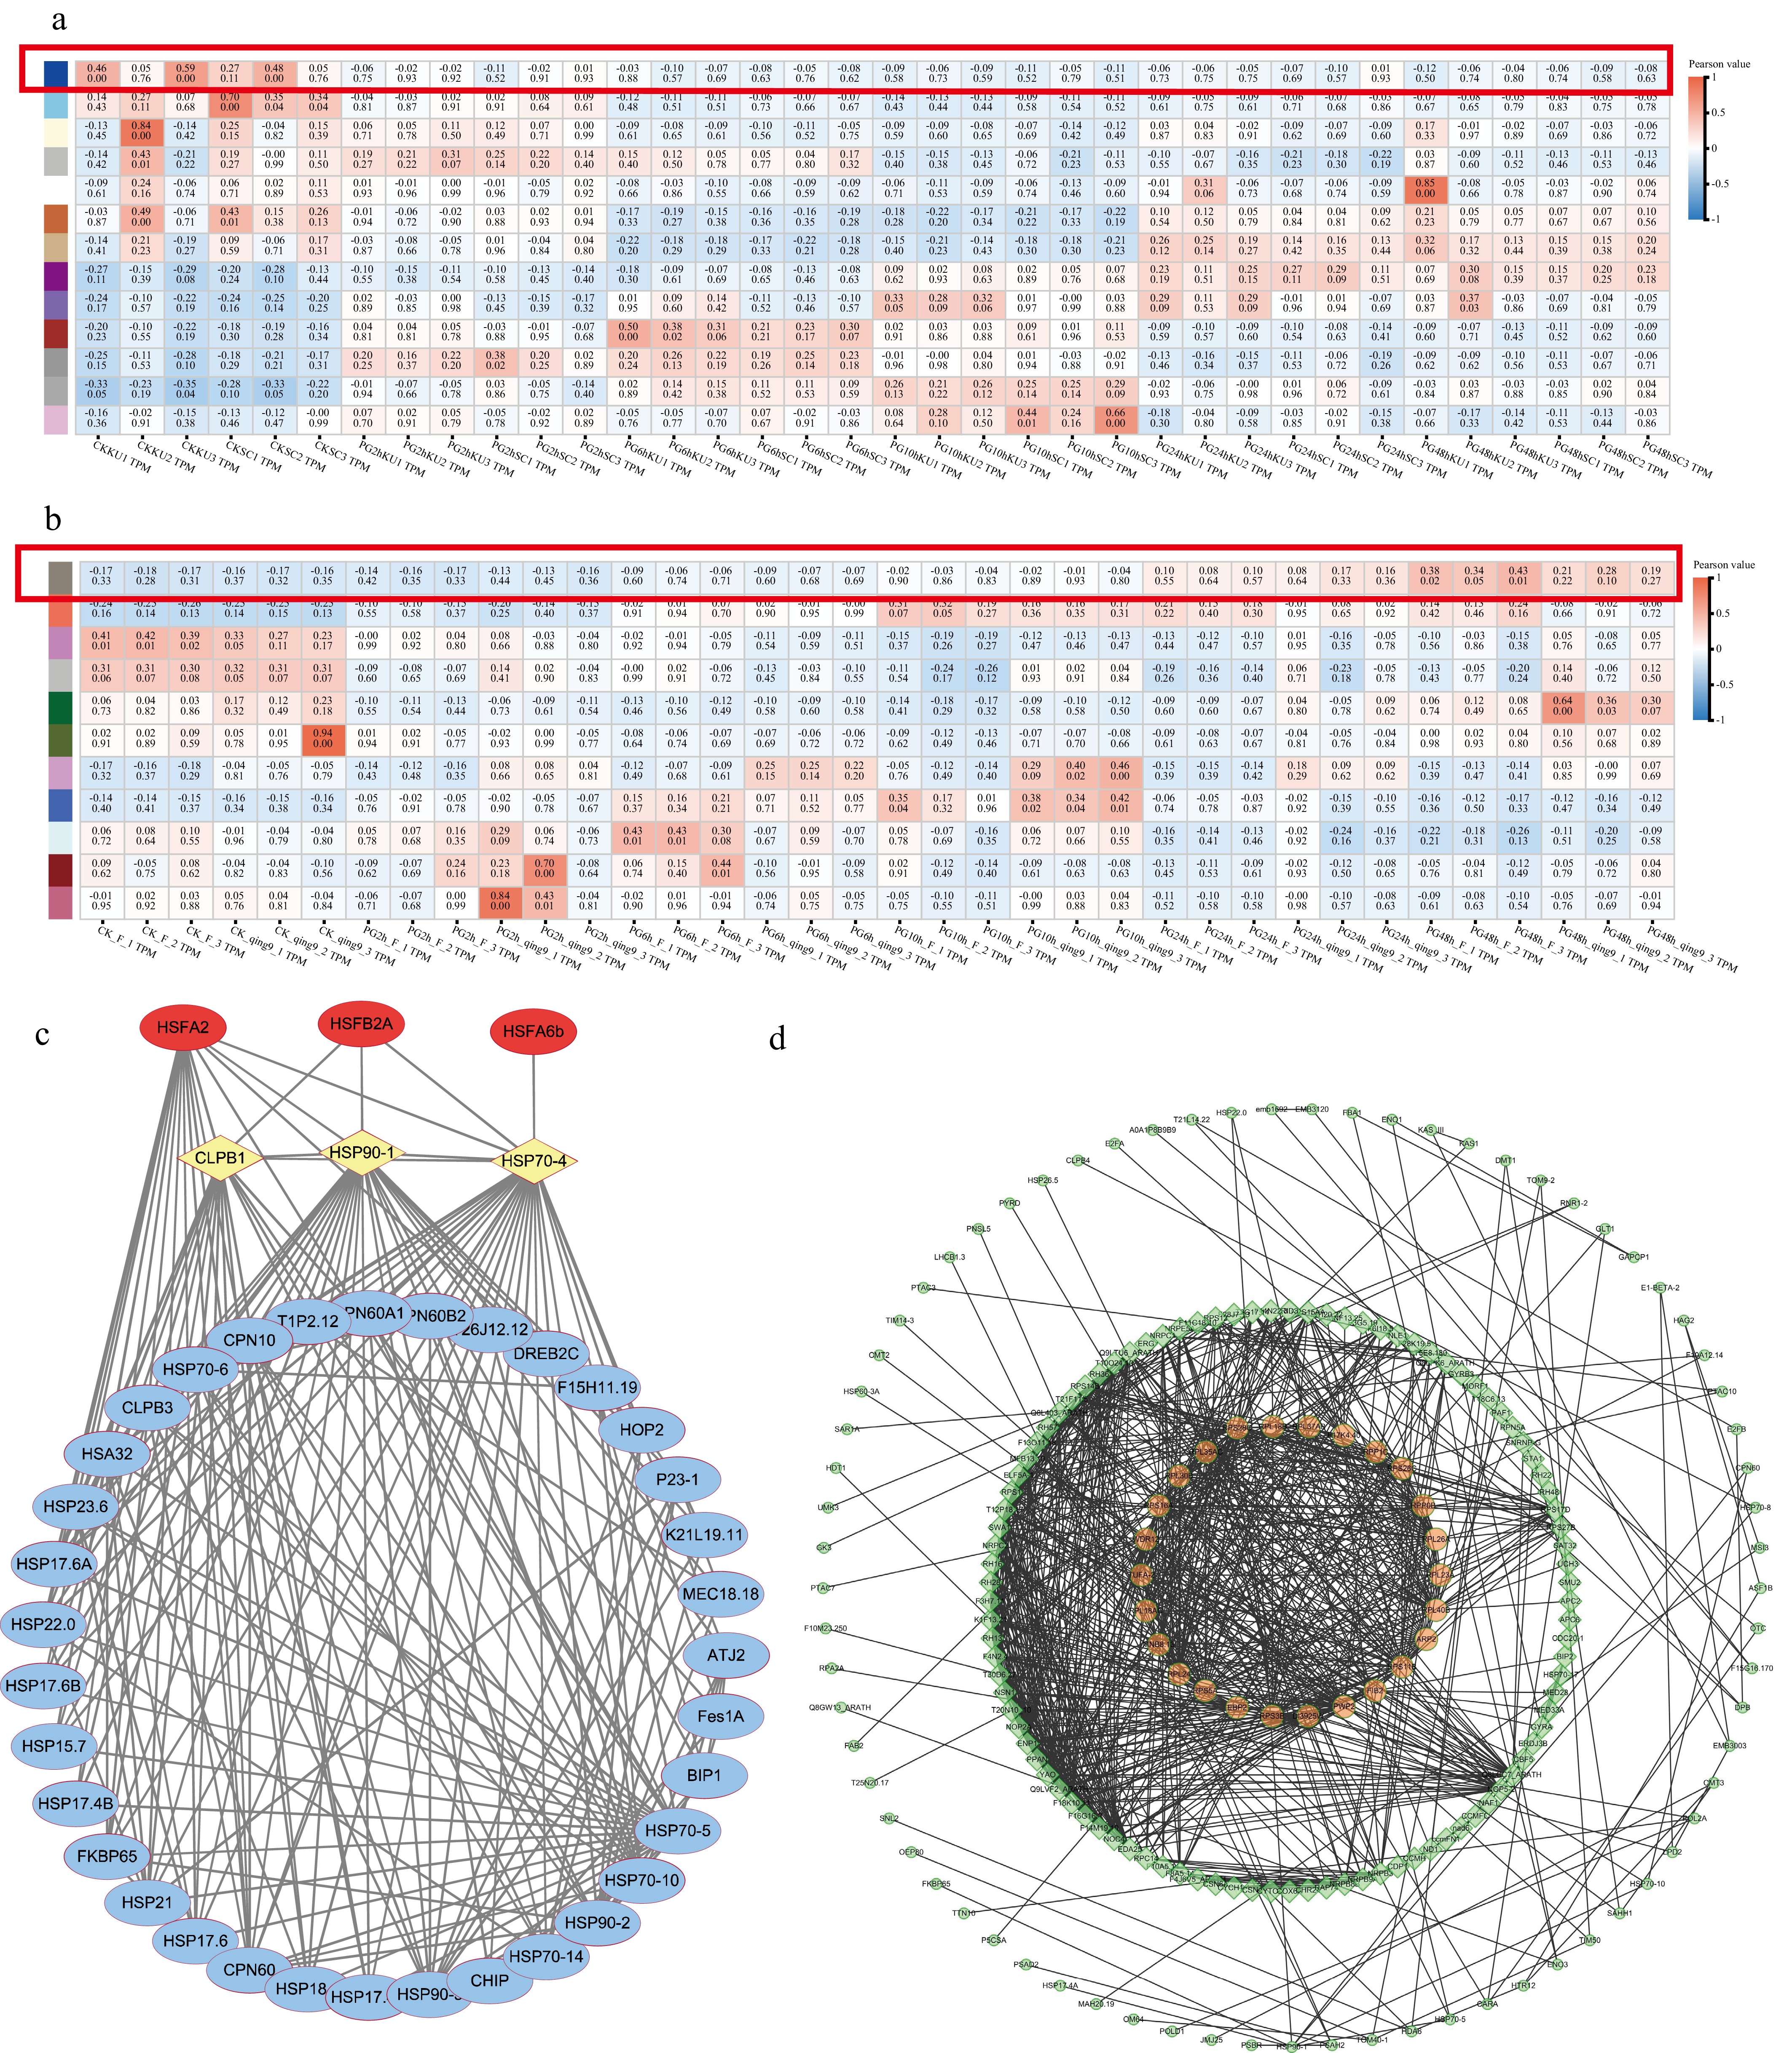
Figure 8.
Co-expression network construction of consistently expressed genes under high-temperature stress in cassava and potato. (a) Module partition of the co-expression network of consistently expressed genes in cassava under heat stress. (b) Module partition of the co-expression network of consistently expressed genes in potato under heat stress (blue, down-regulated genes; red, up-regulated genes). (c) Network construction of the cassava blue module. (d) Network construction of the potato antiquewhite4 module.
-
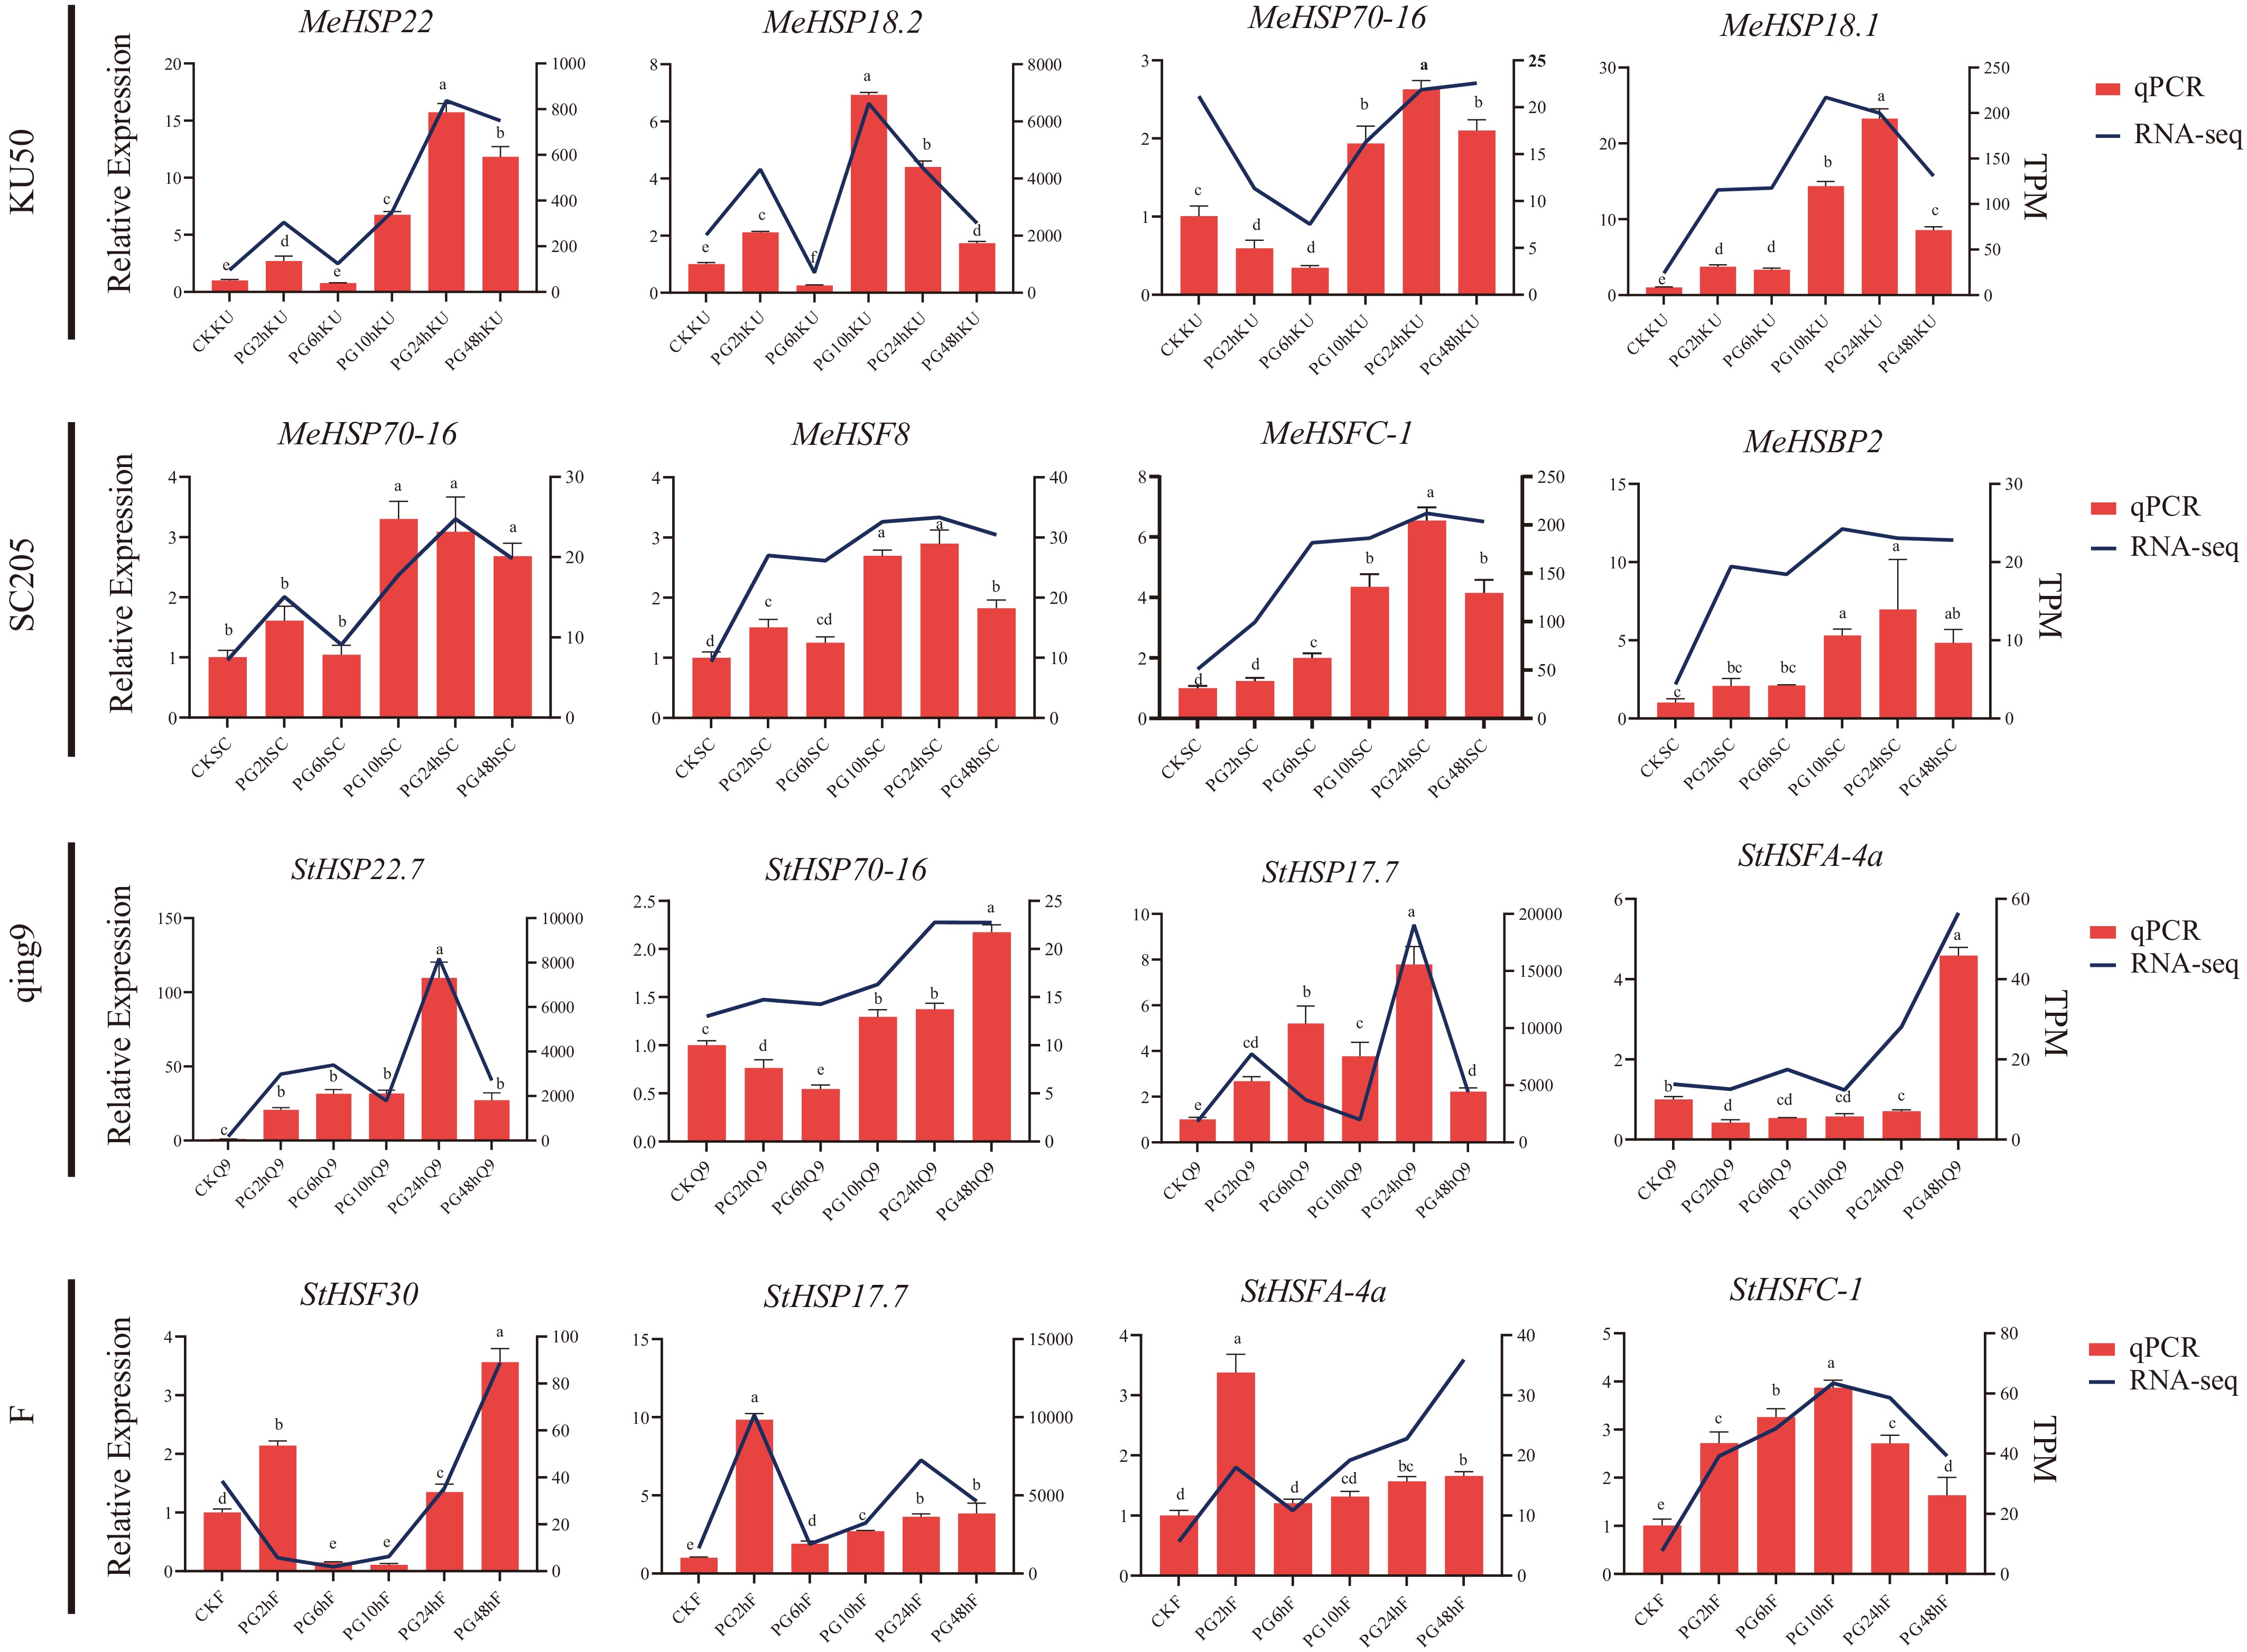
Figure 9.
RT-qPCR validation of differentially expressed genes in heat-stressed leaves of cassava and potato. Bars represent gene expression levels determined by RT-qPCR; lines indicate expression trends from RNA-seq data. Lowercase letters in the figures/tables were used to indicate the results of Tukey's HSD test; means bearing different letters differ significantly at p < 0.05.
Figures
(9)
Tables
(0)