-
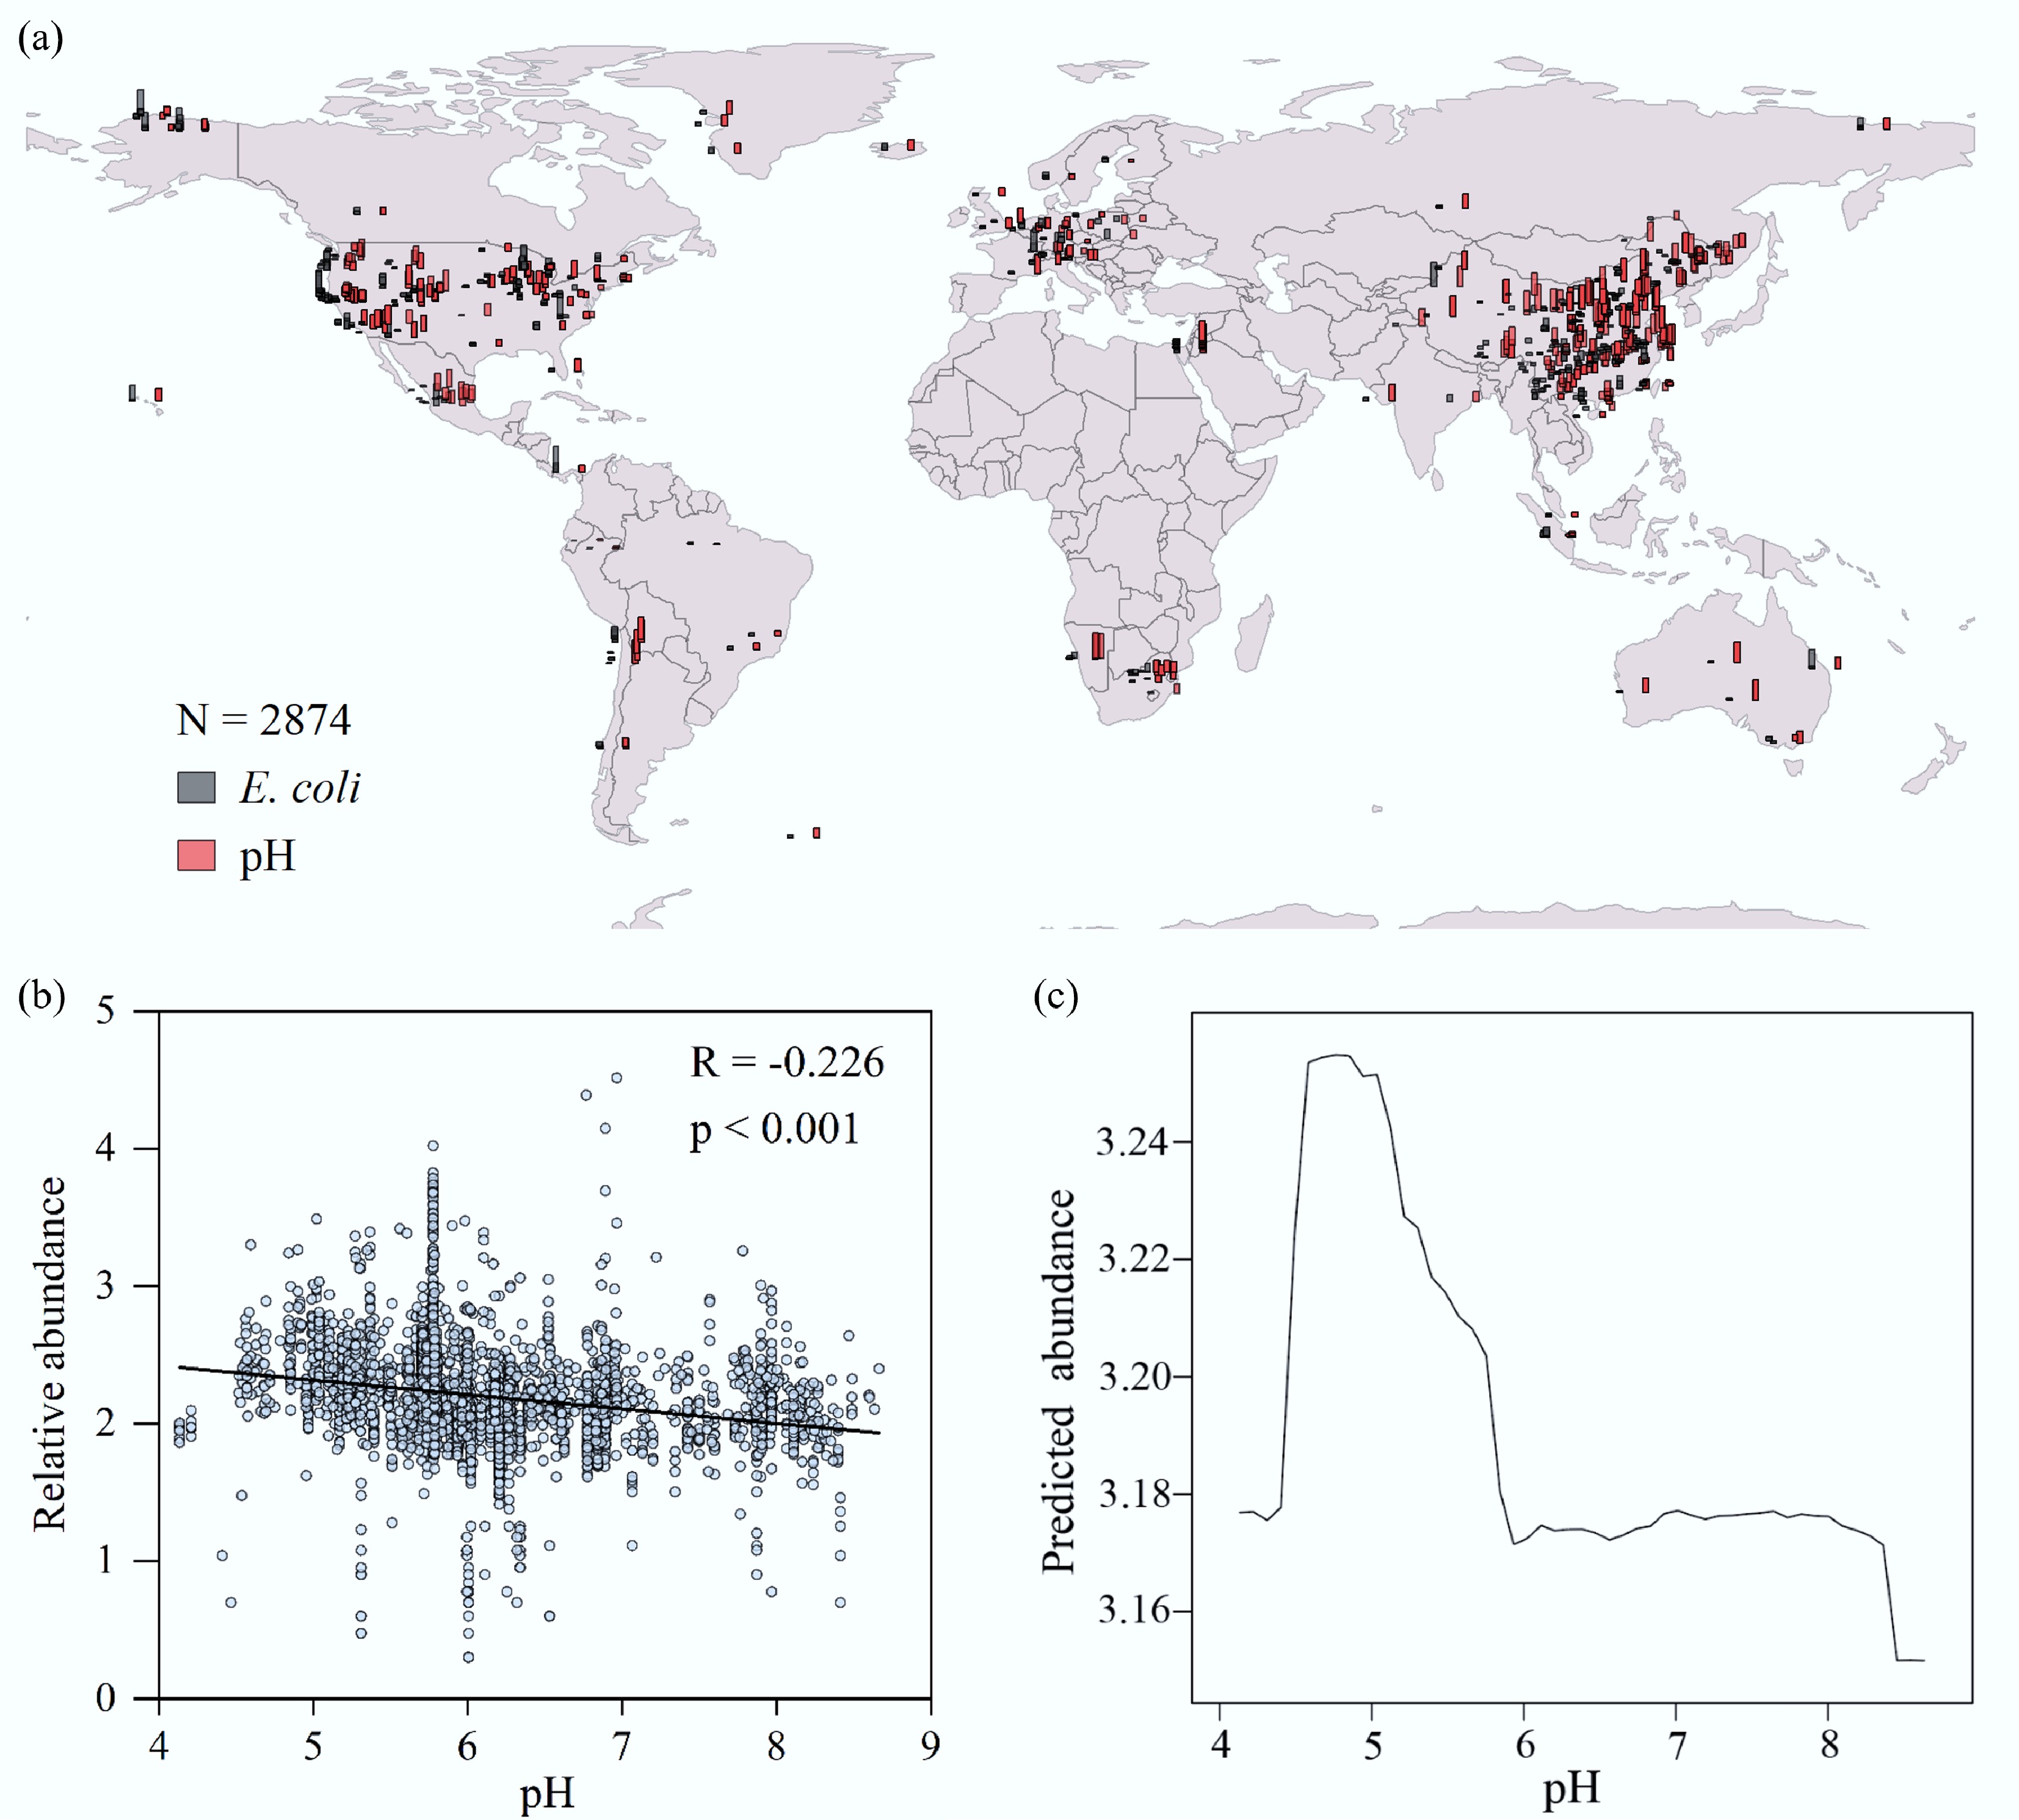
Figure 1.
The relationship between soil pH and E. coli abundance on a global scale. (a) Geographical distribution of the relative abundance of E. coli and pH levels in global soil samples. Data were normalized for visualization. (b) Linear regression analysis of the relationship between the relative abundance of E. coli and soil pH. (c) The non-linear relationship between the relative abundance of E. coli and soil pH as revealed by a Partial Dependence Plot (PDP).
-
Figure 2.
Effects of acid deposition and E. coli O157:H7 invasion on the soil microbial community. (a) Abundance of E. coli O157:H7, determined by plate counting on Sorbitol MacConkey agar and by qPCR targeting the rfbE antigen. (b) Fold change in E. coli O157:H7 abundance under simulated acid rain treatments (mild: pH = 4.5; severe: pH = 2.5) relative to normal rainfall conditions (pH = 6.5). Paired t-tests were performed; * and *** indicate p < 0.05 and p < 0.001, respectively. (c) Trend of E. coli O157:H7 abundance as a function of soil pH. (d) Relative abundances of the top 10 most abundant phyla in the soil. (e) Principal Coordinate Analysis (PCoA) based on Bray-Curtis distances. (f) Overview of soil microbial co-occurrence networks under different rainfall treatments, with or without E. coli O157:H7 invasion. AP: Average Path Length; PNE: Proportion of Negative Edges.
-
Figure 3.
Physiological and colonization differences between the ancestral and evolved strains. (a) Morphologies of the strains on LB agar, Congo Red agar, and soft agar (swimming) plates, and in LB broth. (b) Growth curves in LB broth and niche breadth of the strains. Niche breadth was calculated using Biolog ECO plates. Different letters indicate significant differences at p < 0.05. (c) Relationship between motility and the formation of submerged (liquid–solid interface) and pellicle (air–liquid interface) biofilms. Different letters indicate significant differences at p < 0.05. (d) Colonization abundance of the strains in soil over time. Paired two-tailed t-tests were performed; * and *** indicate p < 0.05 and p < 0.001, respectively. (e) Impact of biofilm formation and motility on soil colonization. Data for biofilm and motility were normalized. Colonization data from day 60 were used for the Variation Partitioning Analysis (VPA). (f) Principal Component Analysis (PCA) of strain characteristics.
-
Figure 4.
Genetic differences between the ancestral and evolved strains. (a) Transcriptional changes in motility-related genes. (b) Transcriptional changes in biofilm formation-related genes. (c) Transcriptional changes in quorum sensing-related genes. (d) Transcriptional changes in pathogenicity-related genes. Asterisks indicate a significant difference (p ≤ 0.05) between the evolved E. coli O157:H7 strains and the wild-type. (e) Spearman correlation network of gene expression. Connections with R > 0.7 and p < 0.05 are displayed. (f) Circular genomic maps of the ancestral and evolved E. coli O157:H7 strains AC-3 and AC-5. From the innermost to the outermost circle: the first circle represents the scale; the second, GC skew; the third, GC content; the fourth, fifth, and sixth circles show the sequence alignment results between the ancestral strain, AC-3, and AC-5, respectively. Details of deletions and inversions are shown below the map.
-
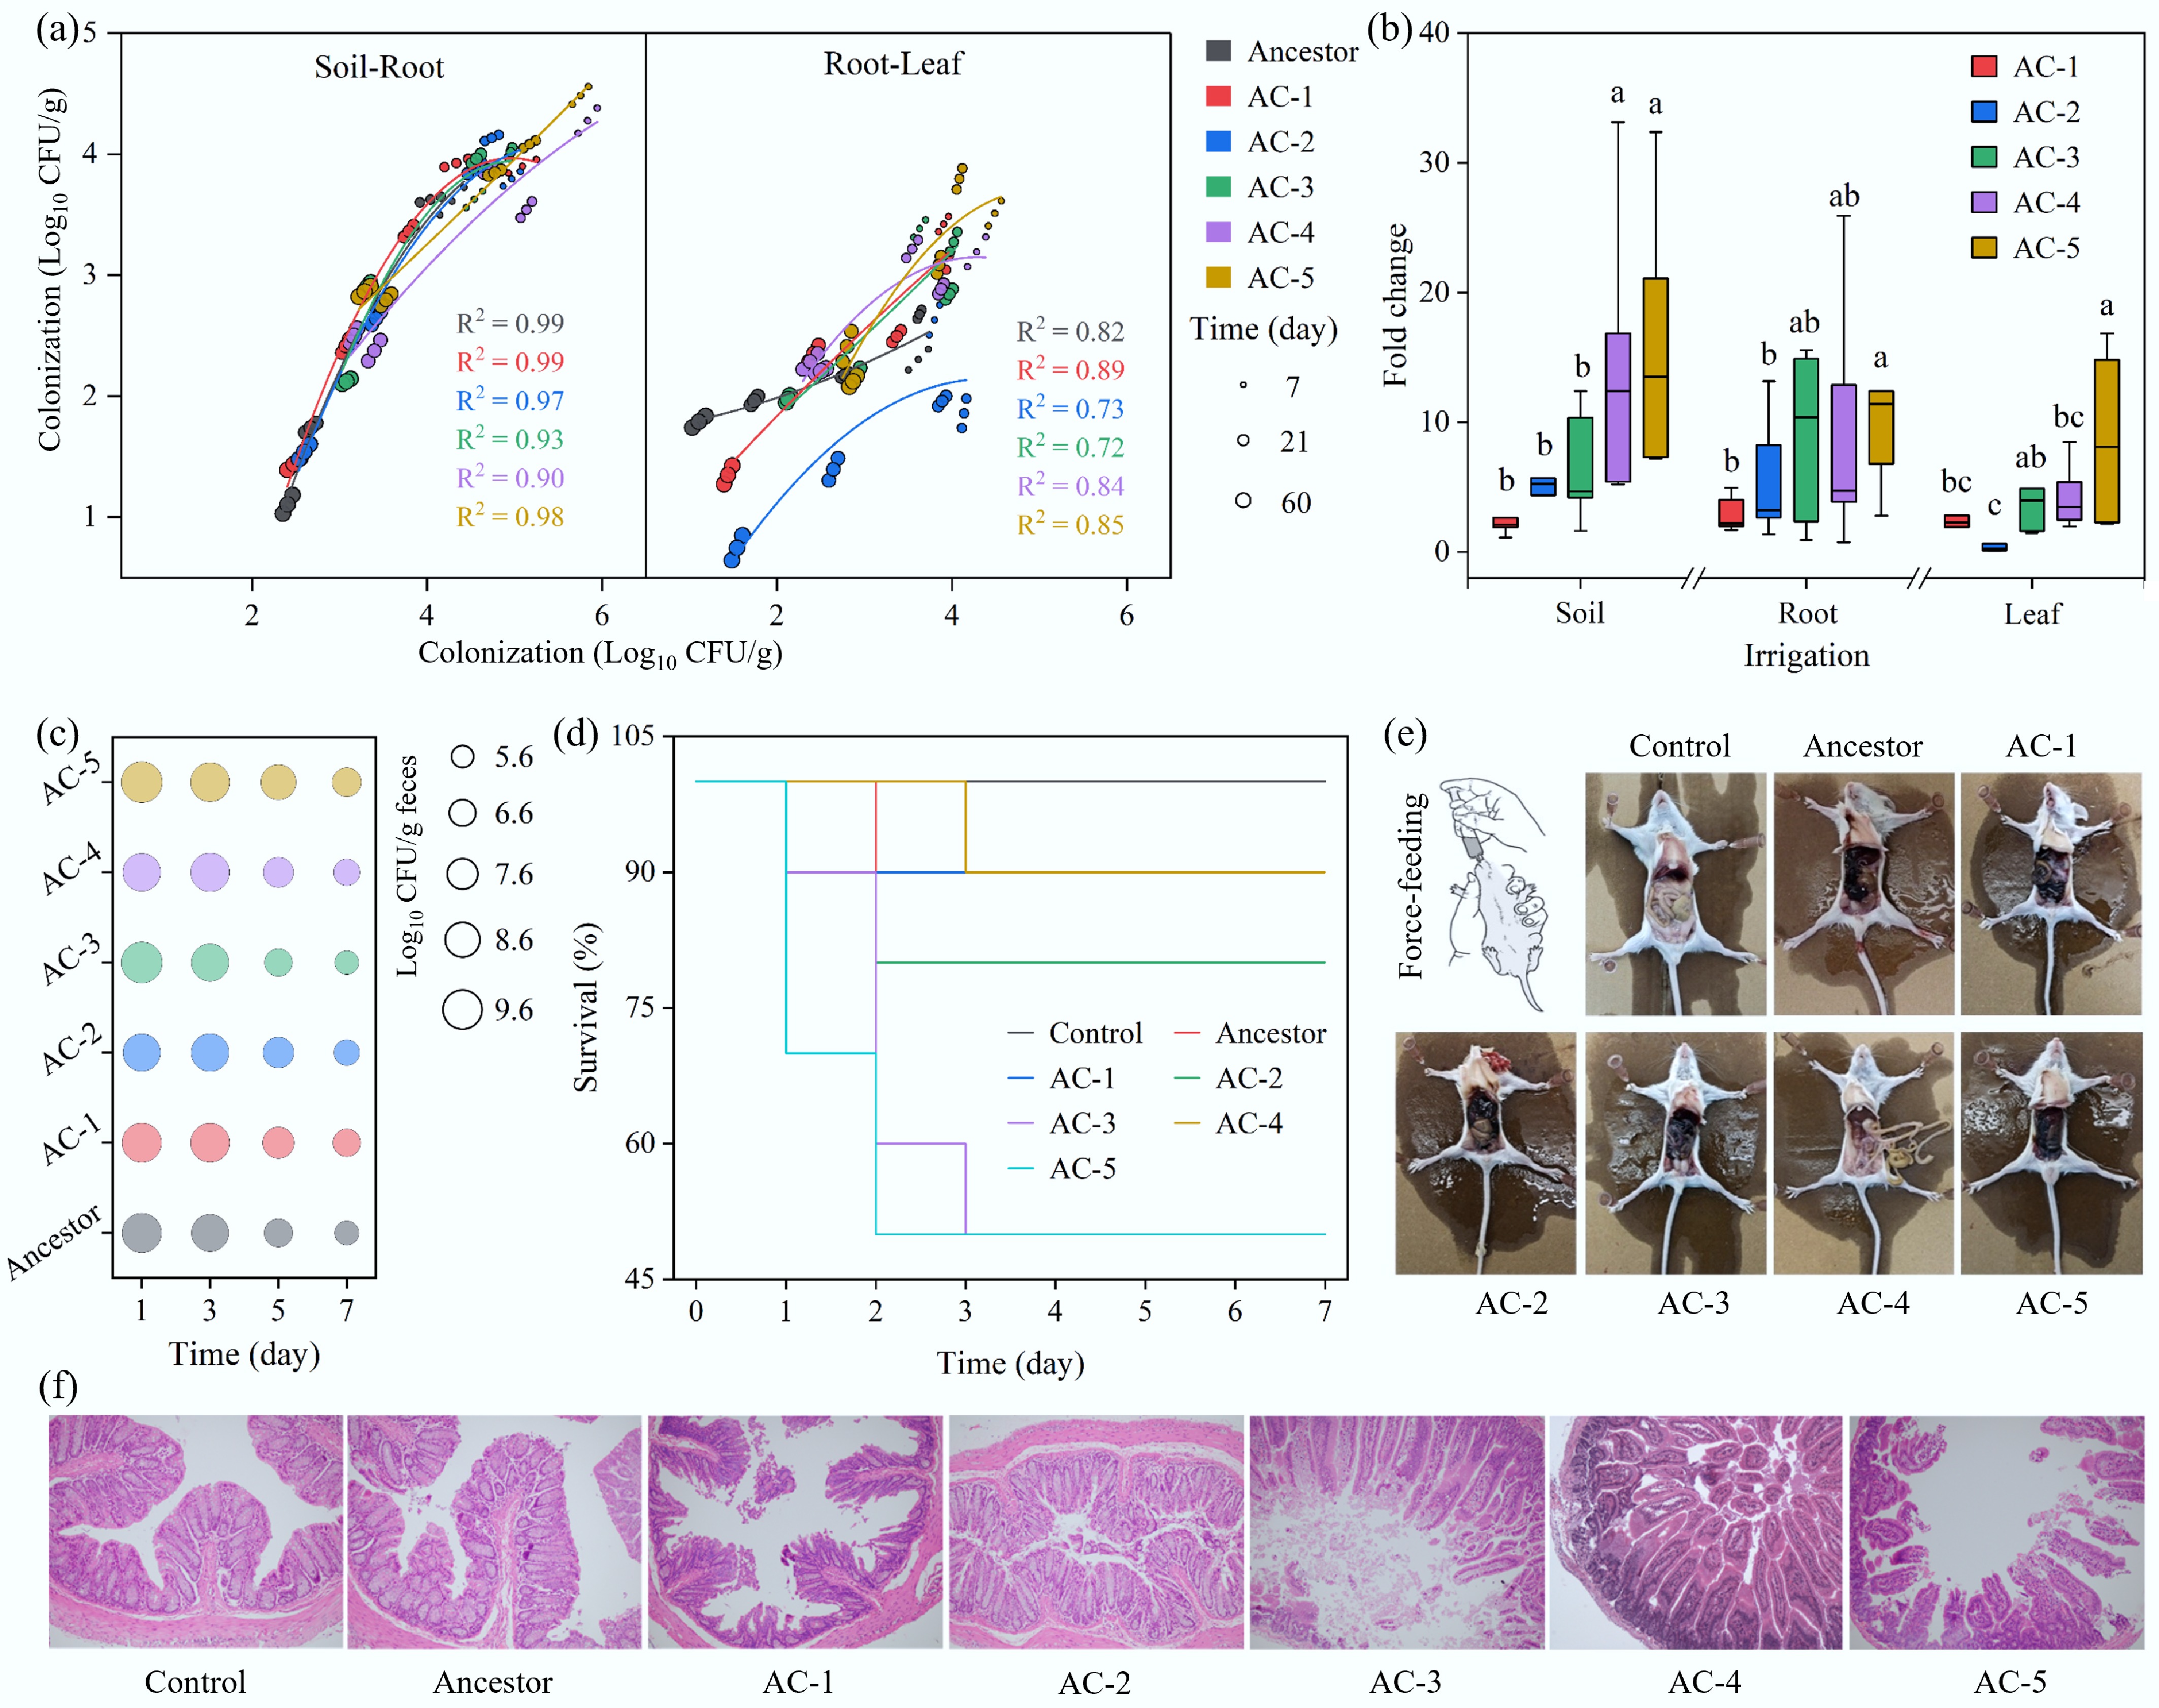
Figure 5.
Ecological risks of the evolved strains. (a) Dissemination of wild-type and evolved E. coli O157:H7 strains in rhizosphere soil, and on lettuce roots and leaves after simulated irrigation. (b) Differences in colonization ability between evolved and wild-type strains. Significant differences for rhizosphere soil, root surface, and leaves are indicated by different letters (p < 0.05). (c) Abundance of E. coli O157:H7 in mouse feces following oral gavage. (d) Lethality of E. coli O157:H7 strains in mice. (e) Anatomical comparison of a healthy mouse and an infected mouse, showing multiple instances of damage to visceral organs caused by an evolved strain. (f) Histopathological sections of mouse tissues.
Figures
(5)
Tables
(0)