-

Figure 1.
Full-spectrum light source under the light intensity level of 150 μmol·m−2·s−1.
-
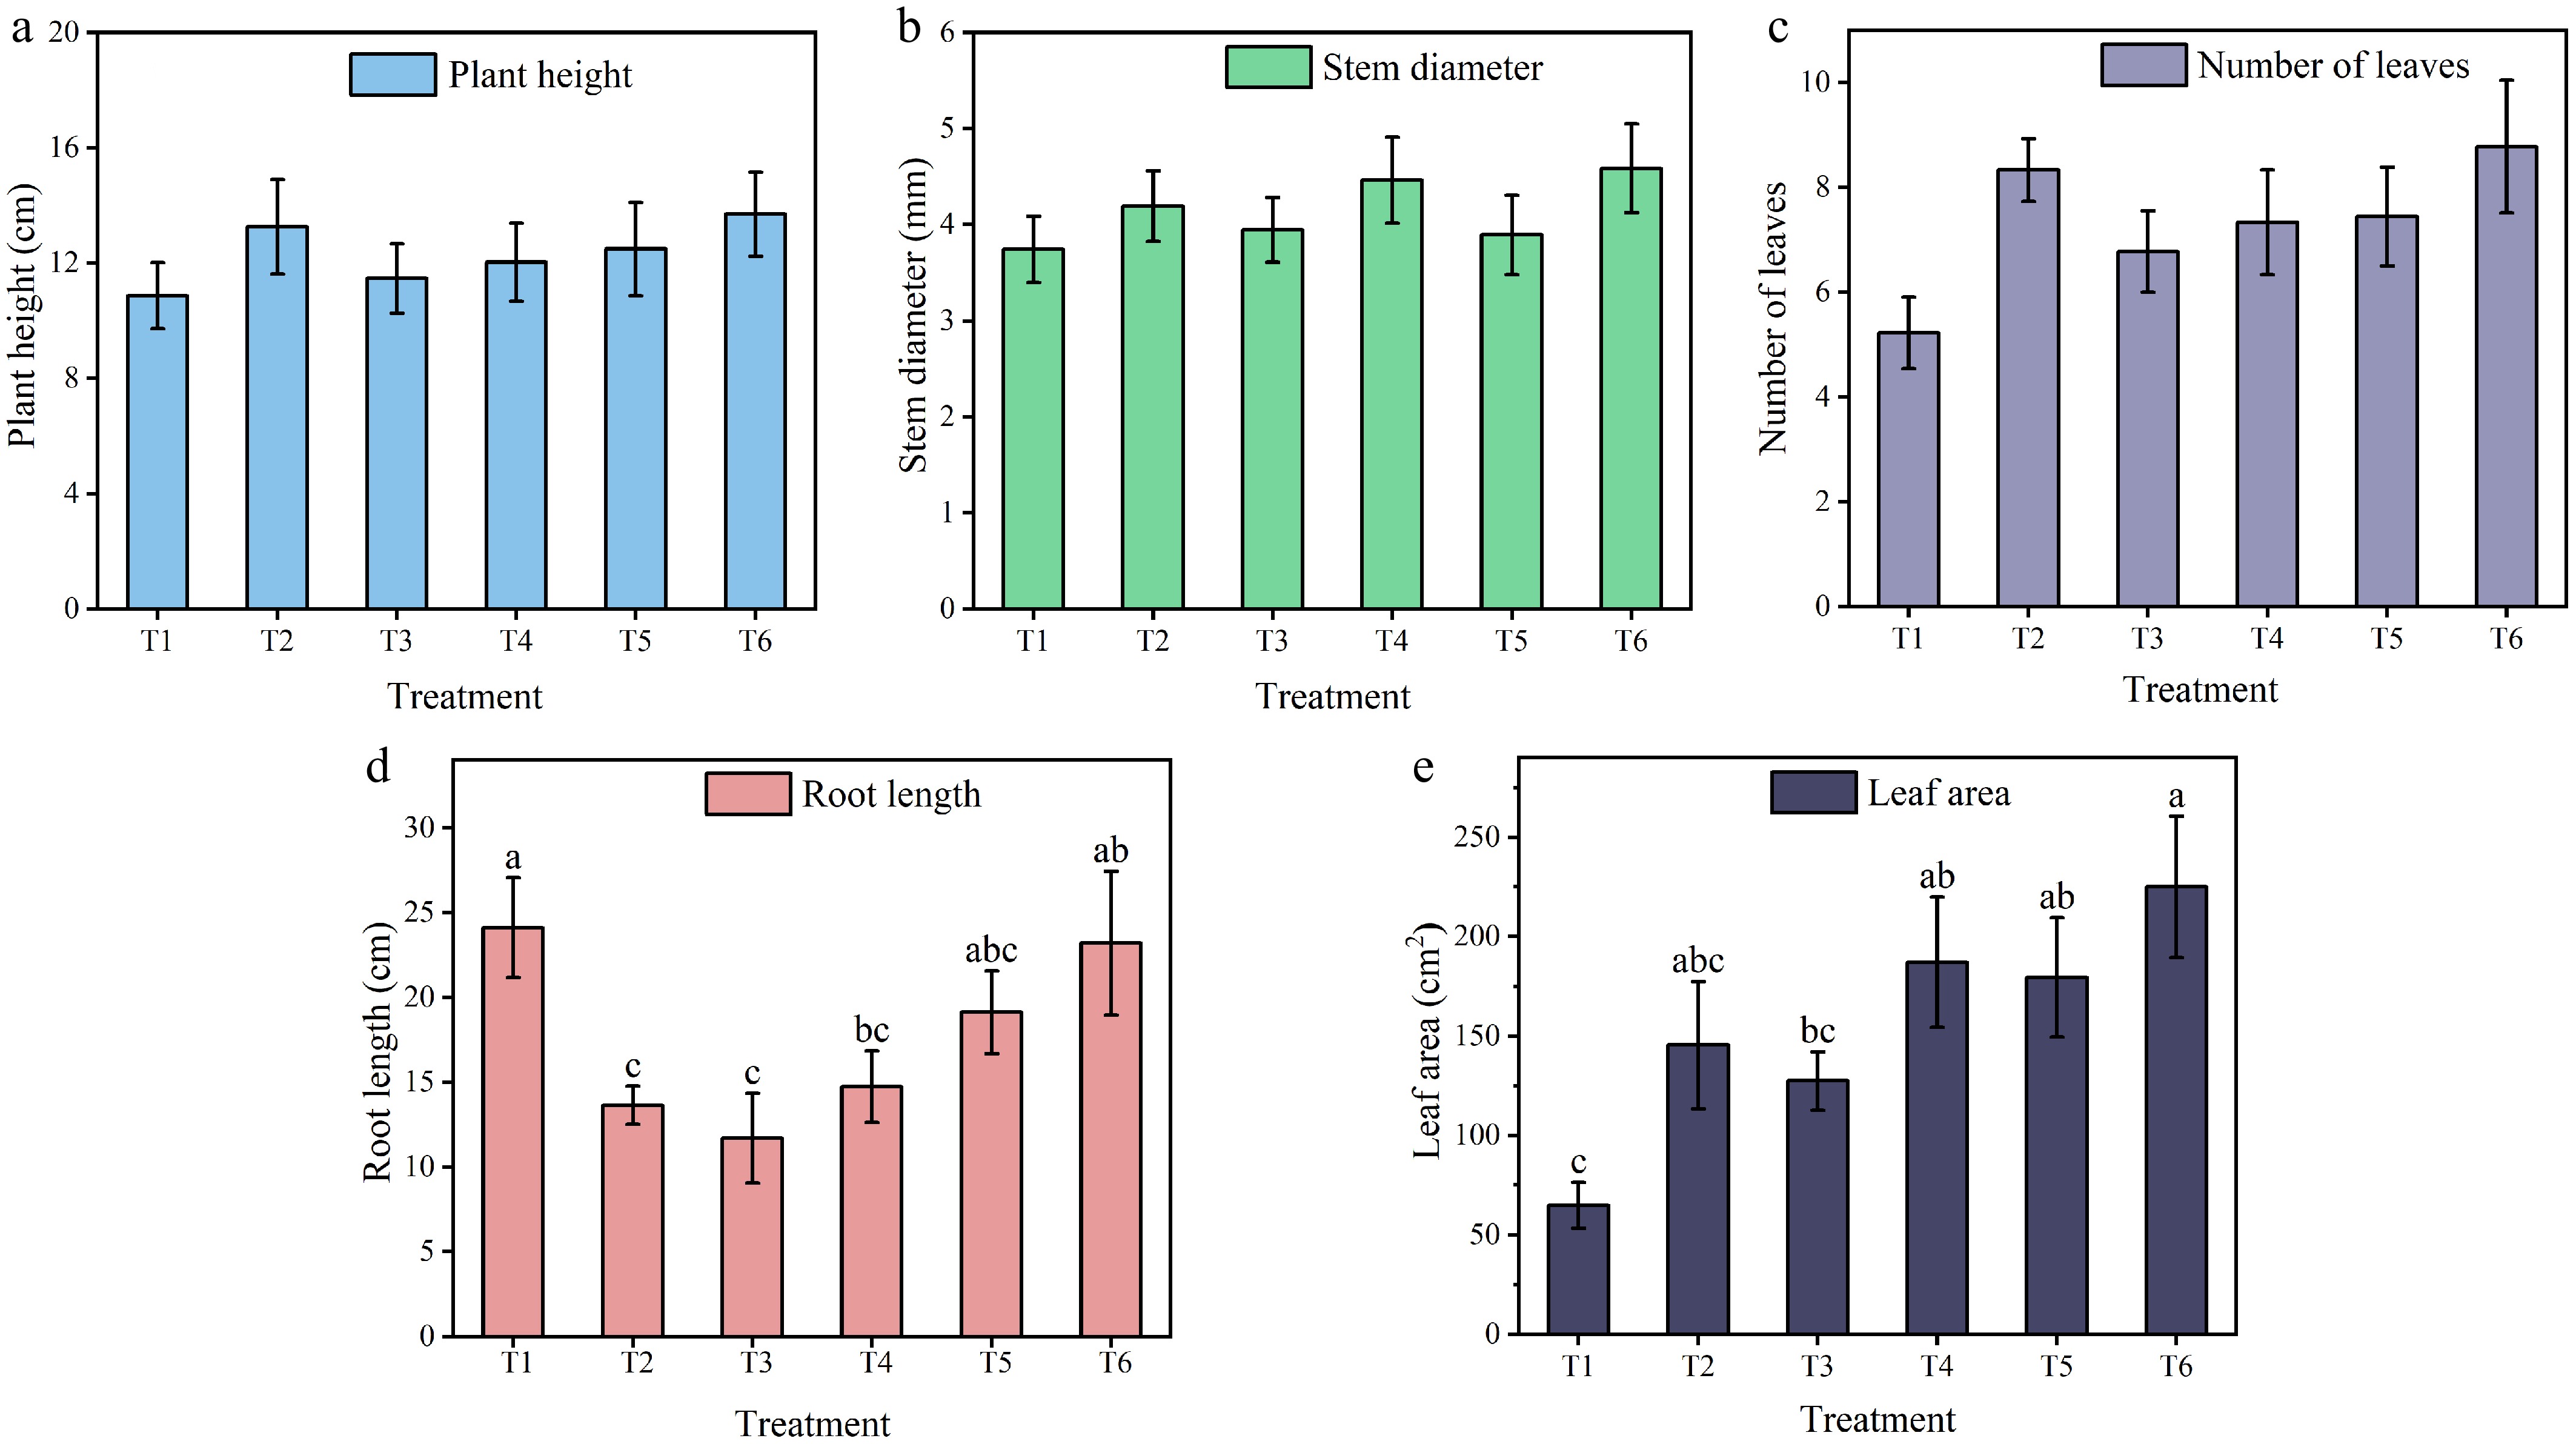
Figure 2.
(a) Plant height, (b) stem diameter, (c) number of leaves, (d) root length, and (e) leaf areaof tomato seedlings under different treatments. Different letters in the columna indicate significant differences at the p < 0.05 level (n = 9). The data are presented as the means ± standard error.
-
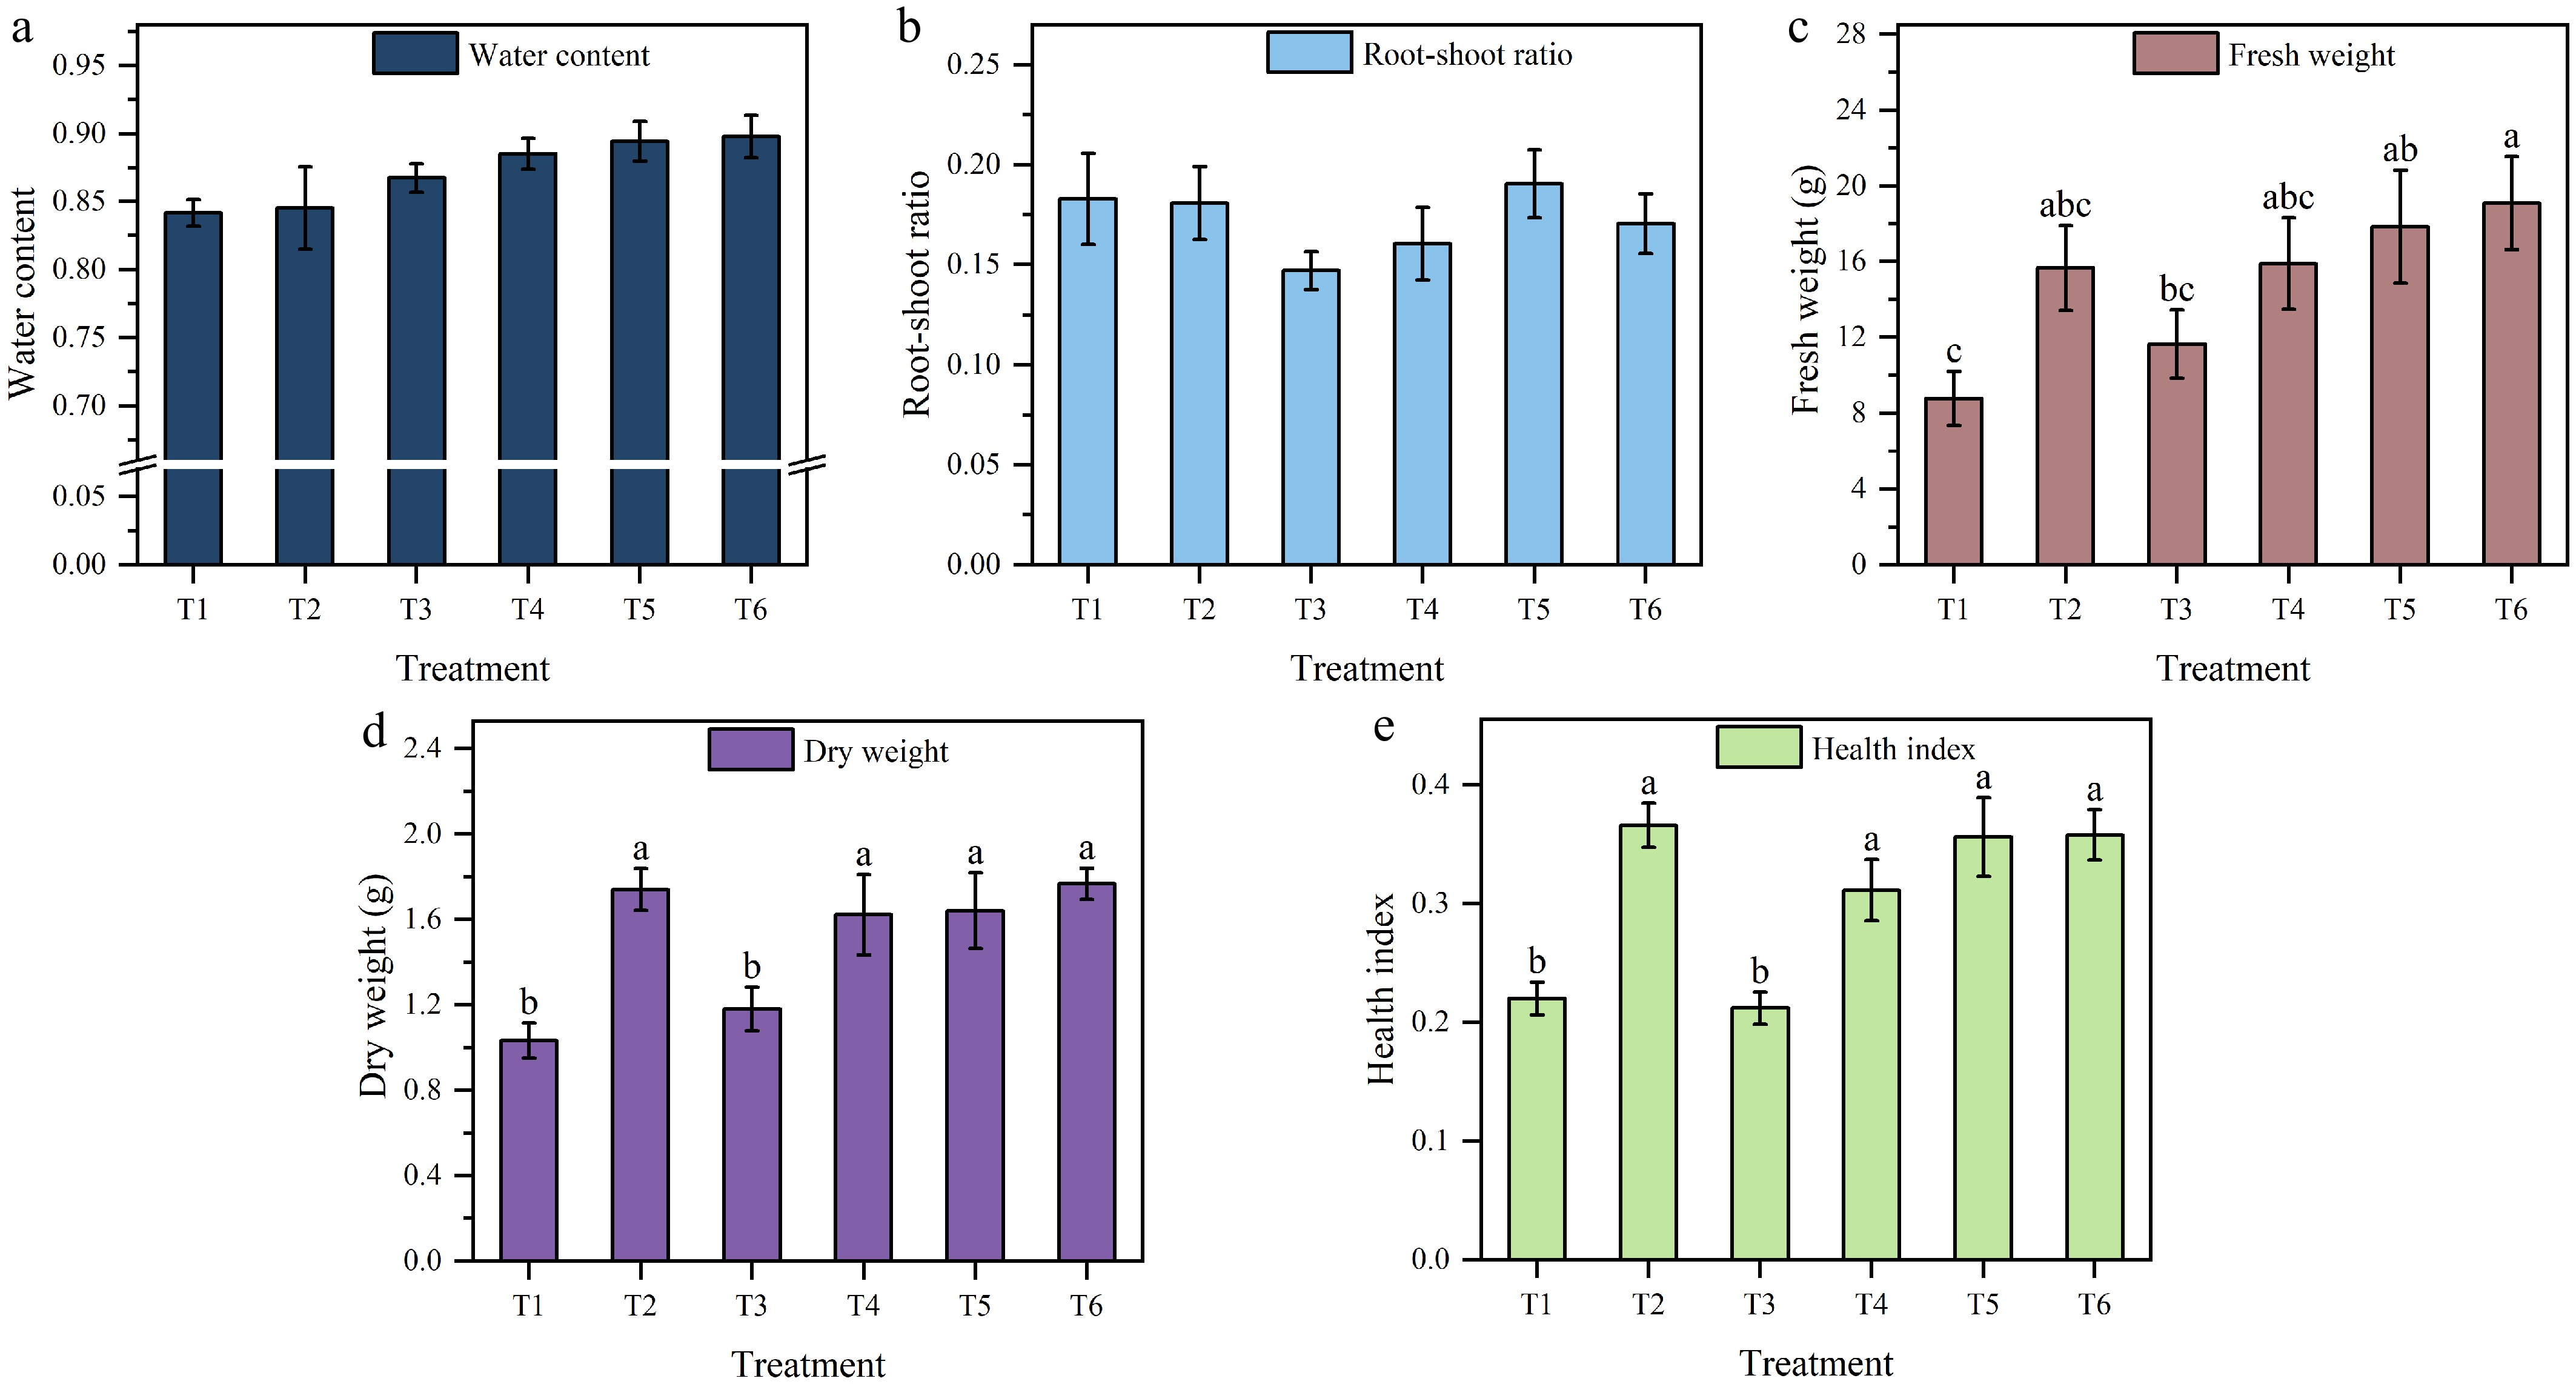
Figure 3.
Water content in the (a) stems and leaves, (b) root-shoot ratio, (c) fresh weight, (d) dry weight, and (e) health index of tomato seedlings under different treatments. Different letters in the vertical lines indicate significant differences at the p < 0.05 level (n = 9). The data are presented as the mean ± standard error.
-
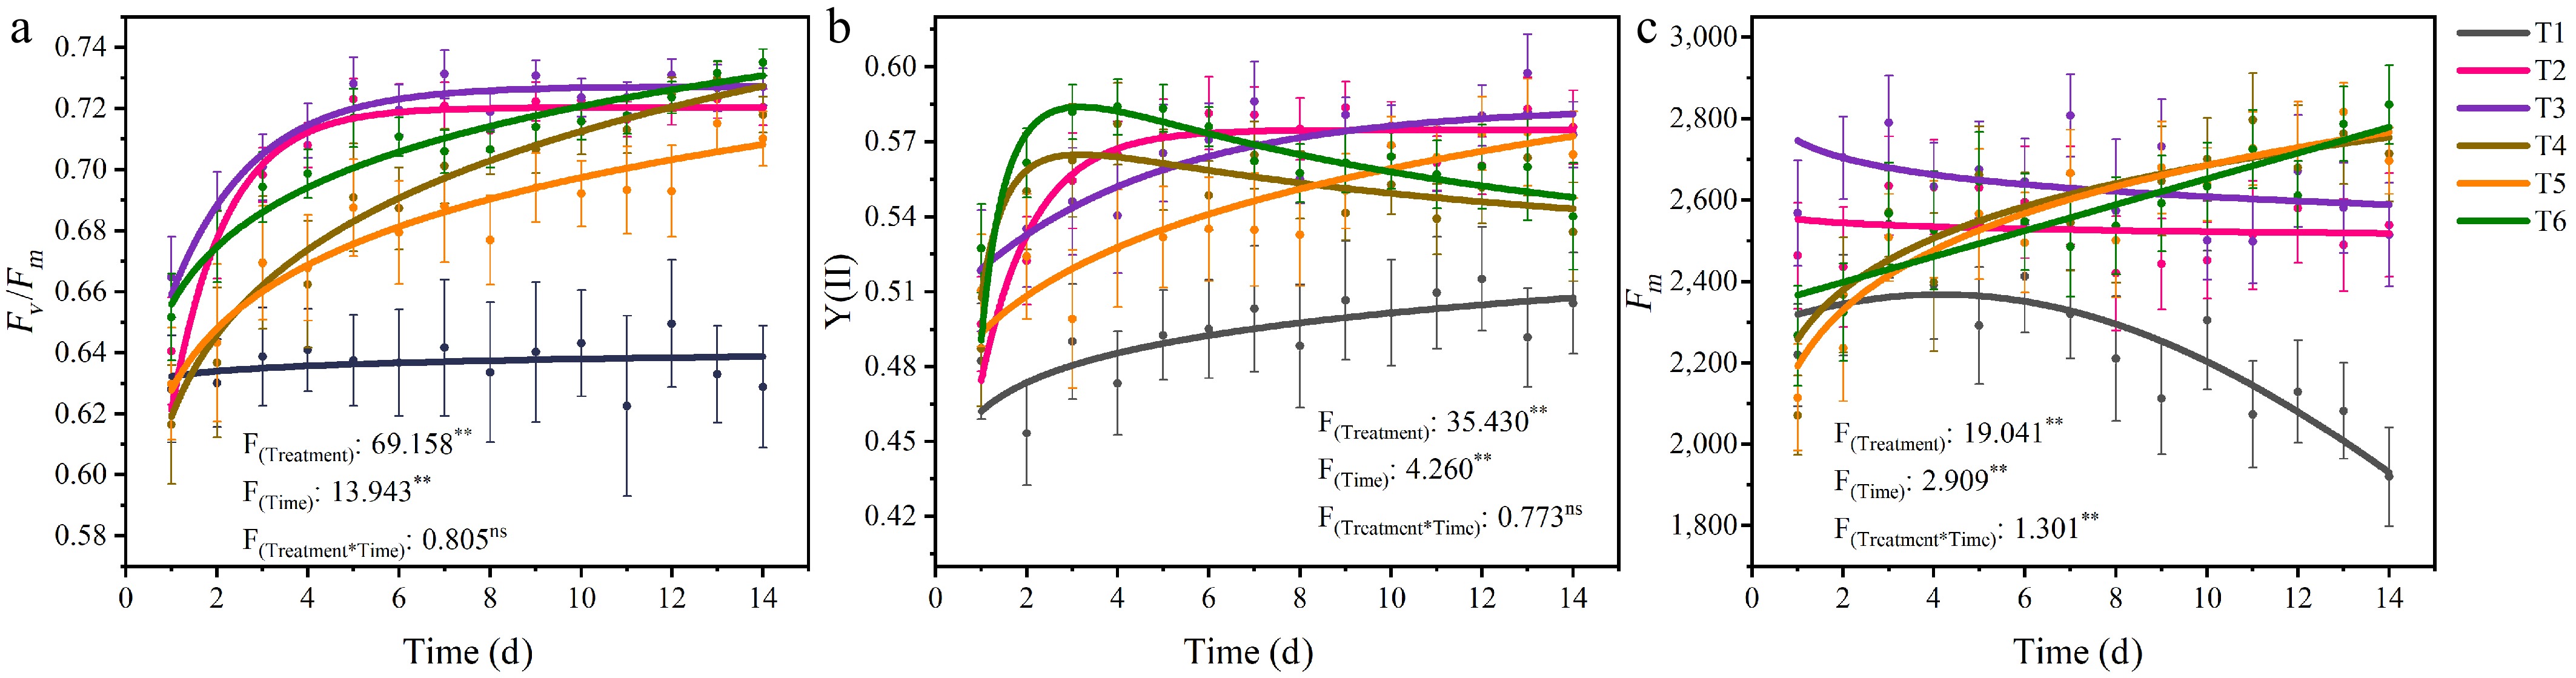
Figure 4.
The trend of (a) Fv/Fm, (b) Y(II), and (c) Fm changes over time under different treatments. Treatment refers to the different nutrient solution concentrations, and Time indicates the duration of the experiment. The points represent discrete original data points, which are the means of five replicate datasets. The lines illustrate the continuous trend after fitting the data. Asterisks (**) denote significant correlations at the p < 0.01 level (n = 25). Each parameter is based on the average of three repetitions. "Ns" indicates no significant correlation.
-

Figure 5.
The trend of (a) NPQt, (b) Y(NPQ), and (c) Y(NO) changes over time under different treatments. Treatment refers to the different nutrient solution concentrations, and Time indicates the duration of the experiment. The points represent discrete original data points, which are the means of five replicate datasets. The lines illustrate the continuous trend after fitting the data. Asterisks (**) denote significant correlations at the p < 0.01 level (n = 25). Each parameter is based on the average of three repetitions. "Ns" indicates no significant correlation.
-

Figure 6.
The trend of SPAD changes over time under different treatments. Treatment refers to the different nutrient solution concentrations. Time indicates the duration of the experiment. The points represent discrete original data points, which are the means of five replicate datasets. The lines illustrate the continuous trend after fitting the data. Asterisks (**) denote significant correlations at the p < 0.01 level (n = 25). Each parameter is based on the average of five repetitions. "ns" indicates no significant correlation.
-
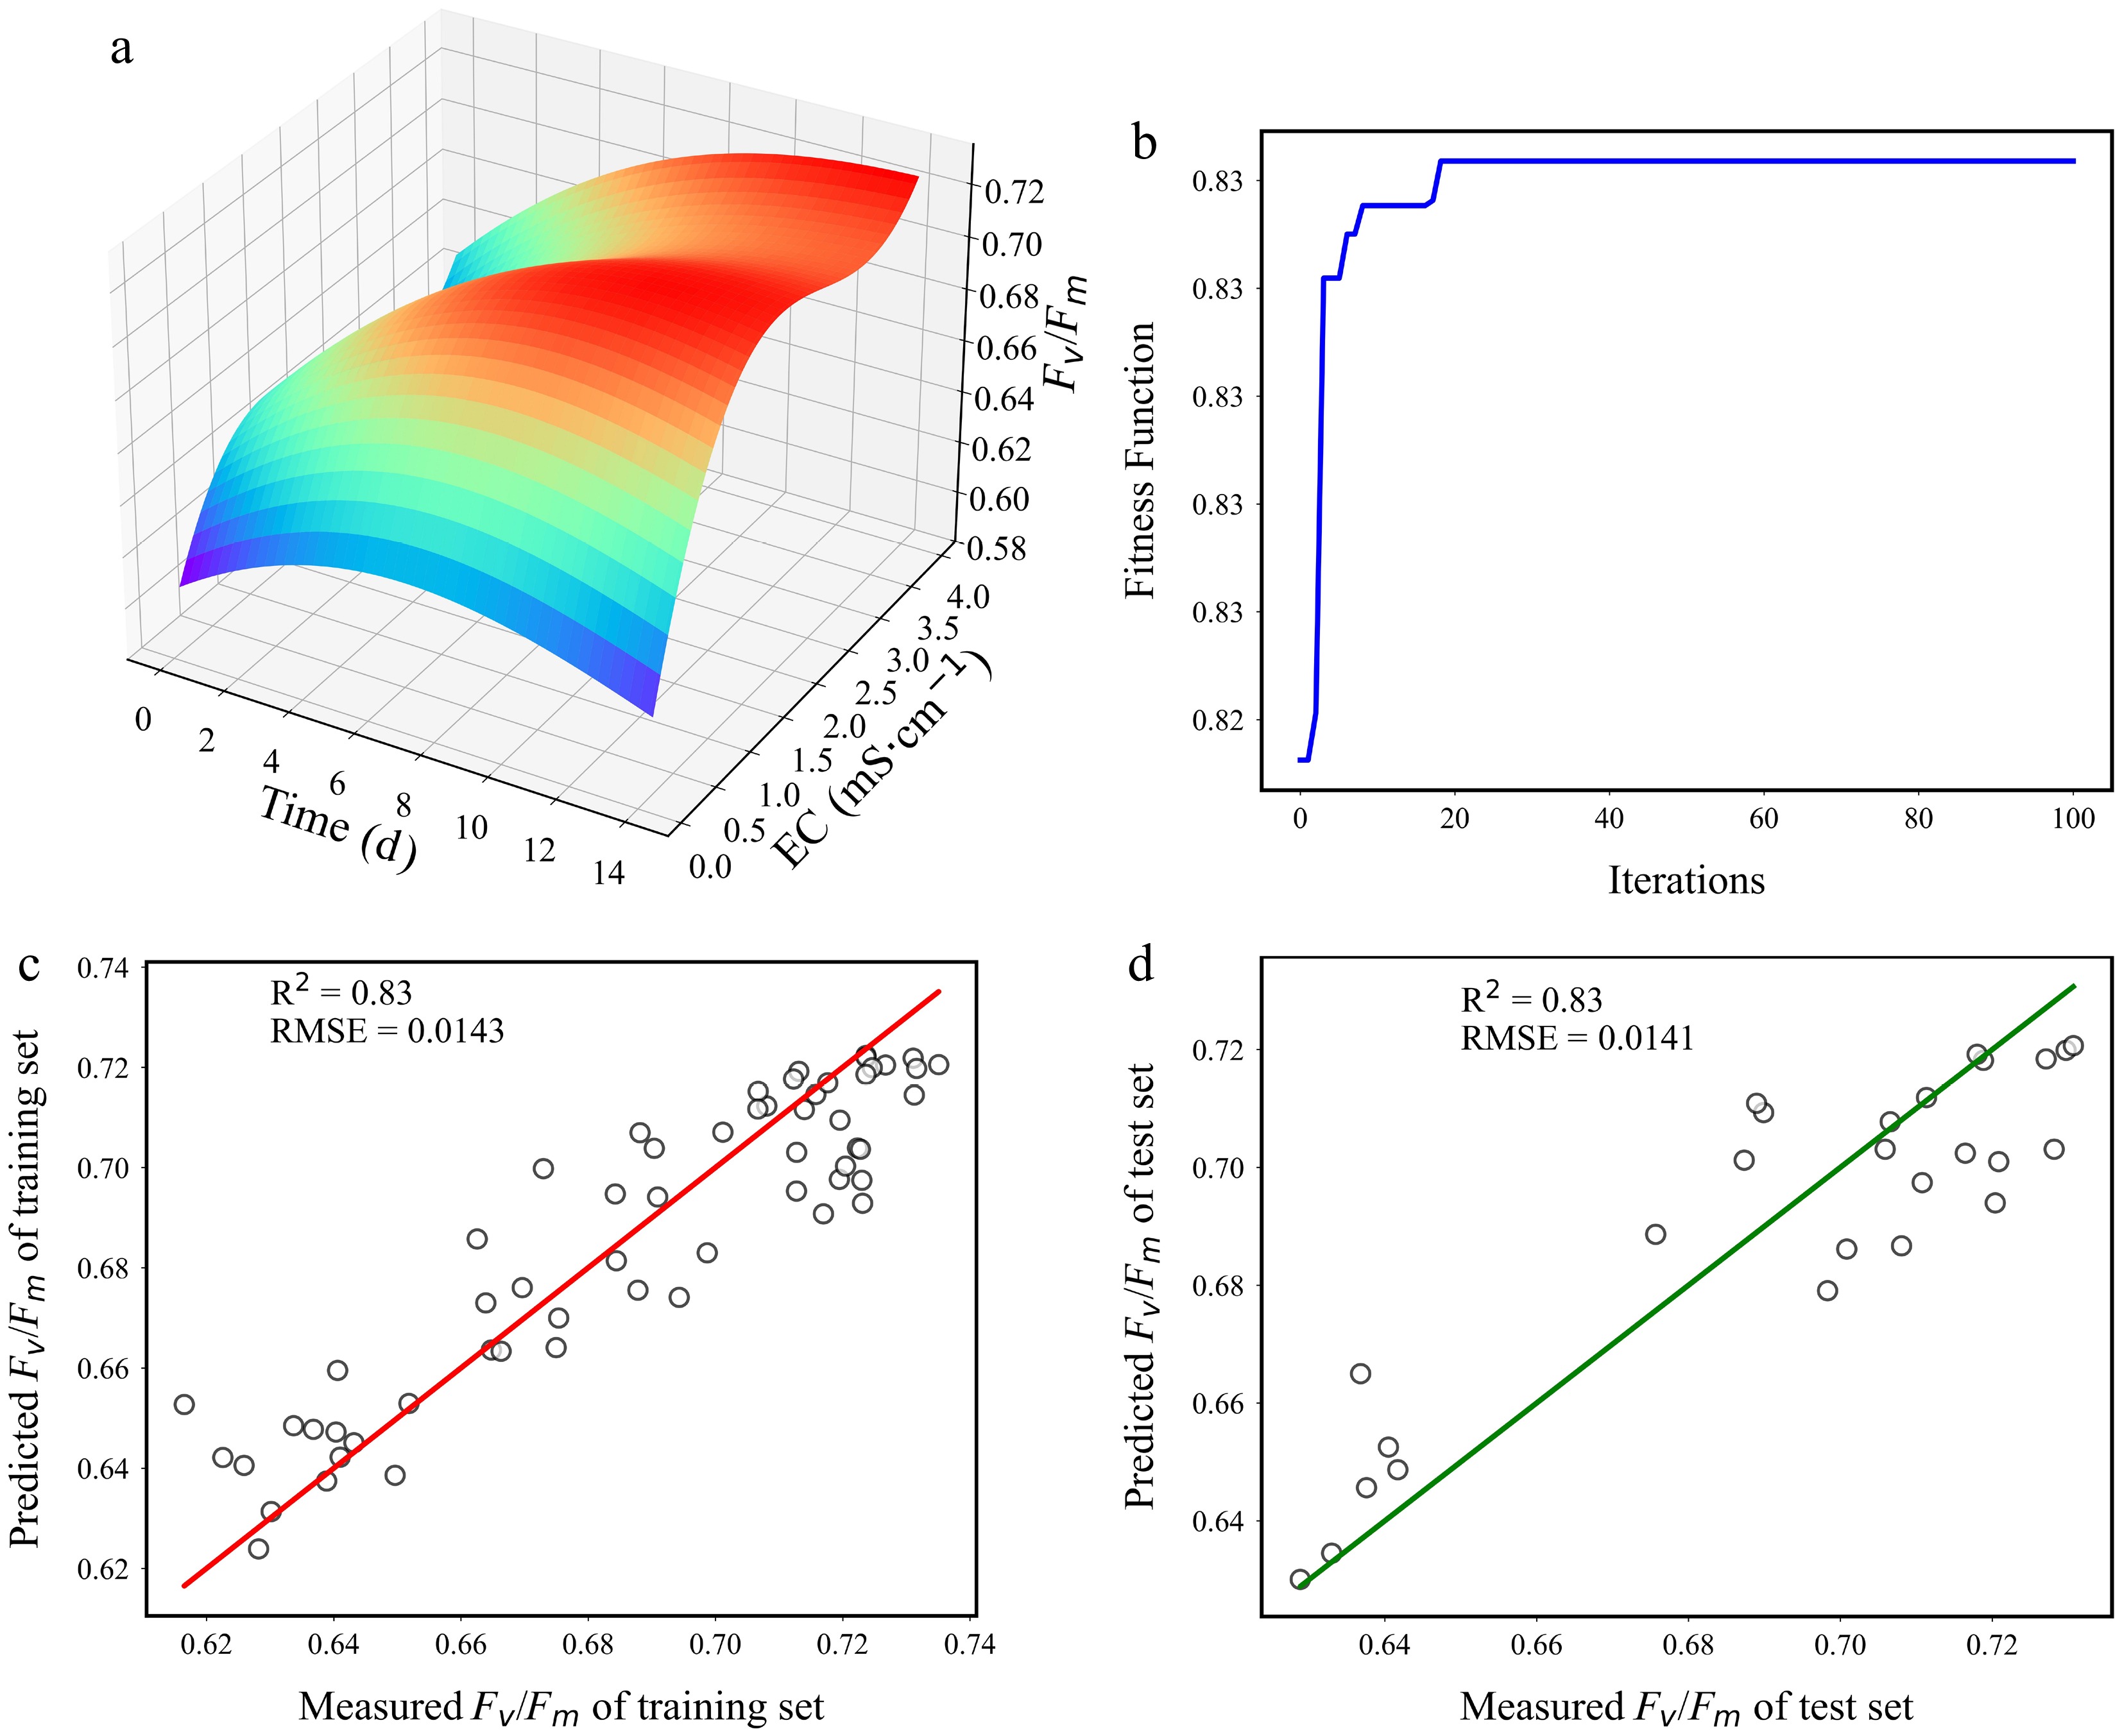
Figure 7.
Visualization of the (a) Fv/Fm model, (b) evolutionary process, and (c), (d) validations of the models.
-
Stock solution Chemical reagent Concentration in stock solution (g·L−1) Function A (100 × concentration) Ca(NO3)2·4H2O 94.5 Provides macronutrients
(N, Ca, K)KNO3 80.9 B (100 × concentration) KH2PO4 15.3 Provides macronutrients
(P, K, Mg, S)MgSO4·7H2O 49.3 C (1,000 × concentration) NaFe-EDTA 30 Provides microelements
(Fe, B, Mn, Zn, Cu, Mo)H3BO3 2.86 MnSO4·7H2O 2.13 CuSO4·5H2O 0.08 ZnSO4·7H2O 0.22 (NH4)6Mo7O24·4H2O 0.02 Table 1.
Composition of stock solutions for the Japanese garden test nutrient solution
-
Treatment Nutrient solution dosage EC (mS·cm−1) T1 0 0.22 T2 1/4 0.90 T3 1/2 1.56 T4 3/4 2.16 T5 1 2.78 T6 3/2 3.82 Table 2.
Different nutrient solution concentrations and their corresponding electrical conductivity (EC) values.
Figures
(7)
Tables
(2)