-
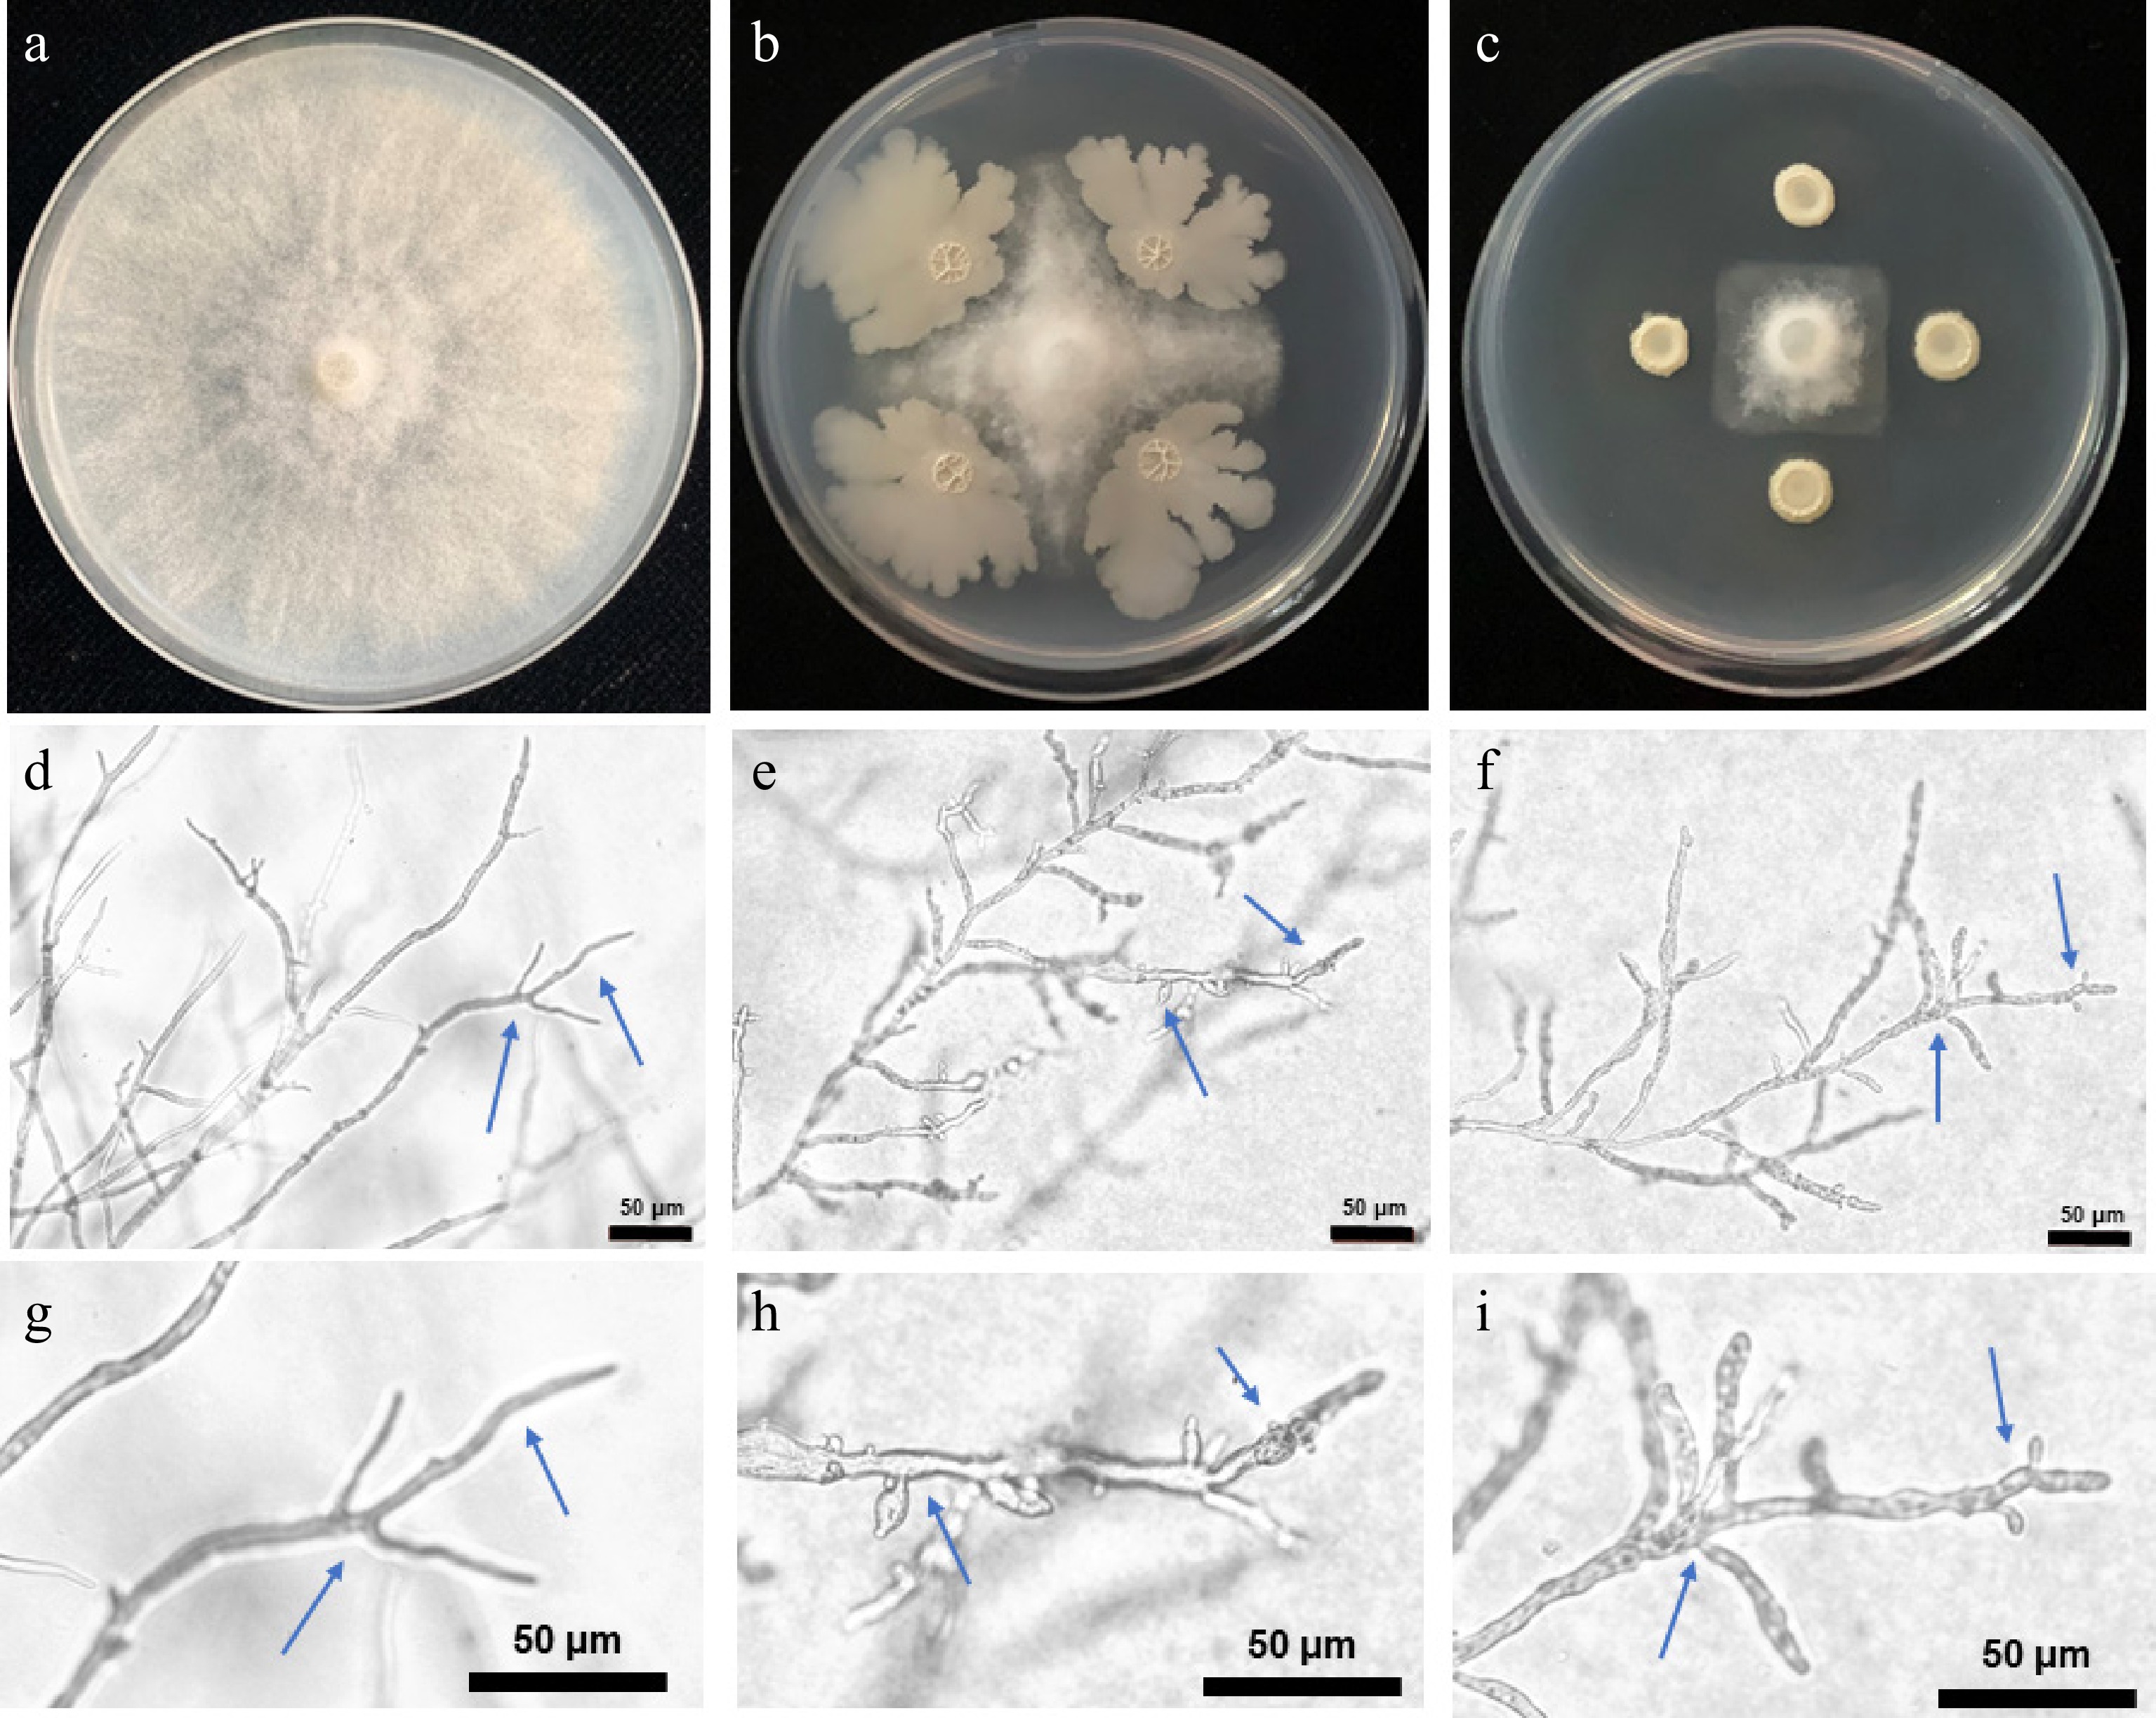
Figure 1.
Inhibition effect of the isolated strains against P. capsici in the dual cultures and the mycelial morphology. (a), (d), and (g): Control (SDW); (b), (e), and (h): H12 treatment; (c): H23 treatment. Pictures were recorded on the day when radial growth of the control treatment was middle (d)–(i), and full (a)–(c) of plate. The blue arrows indicate the different forms of hyphae.
-
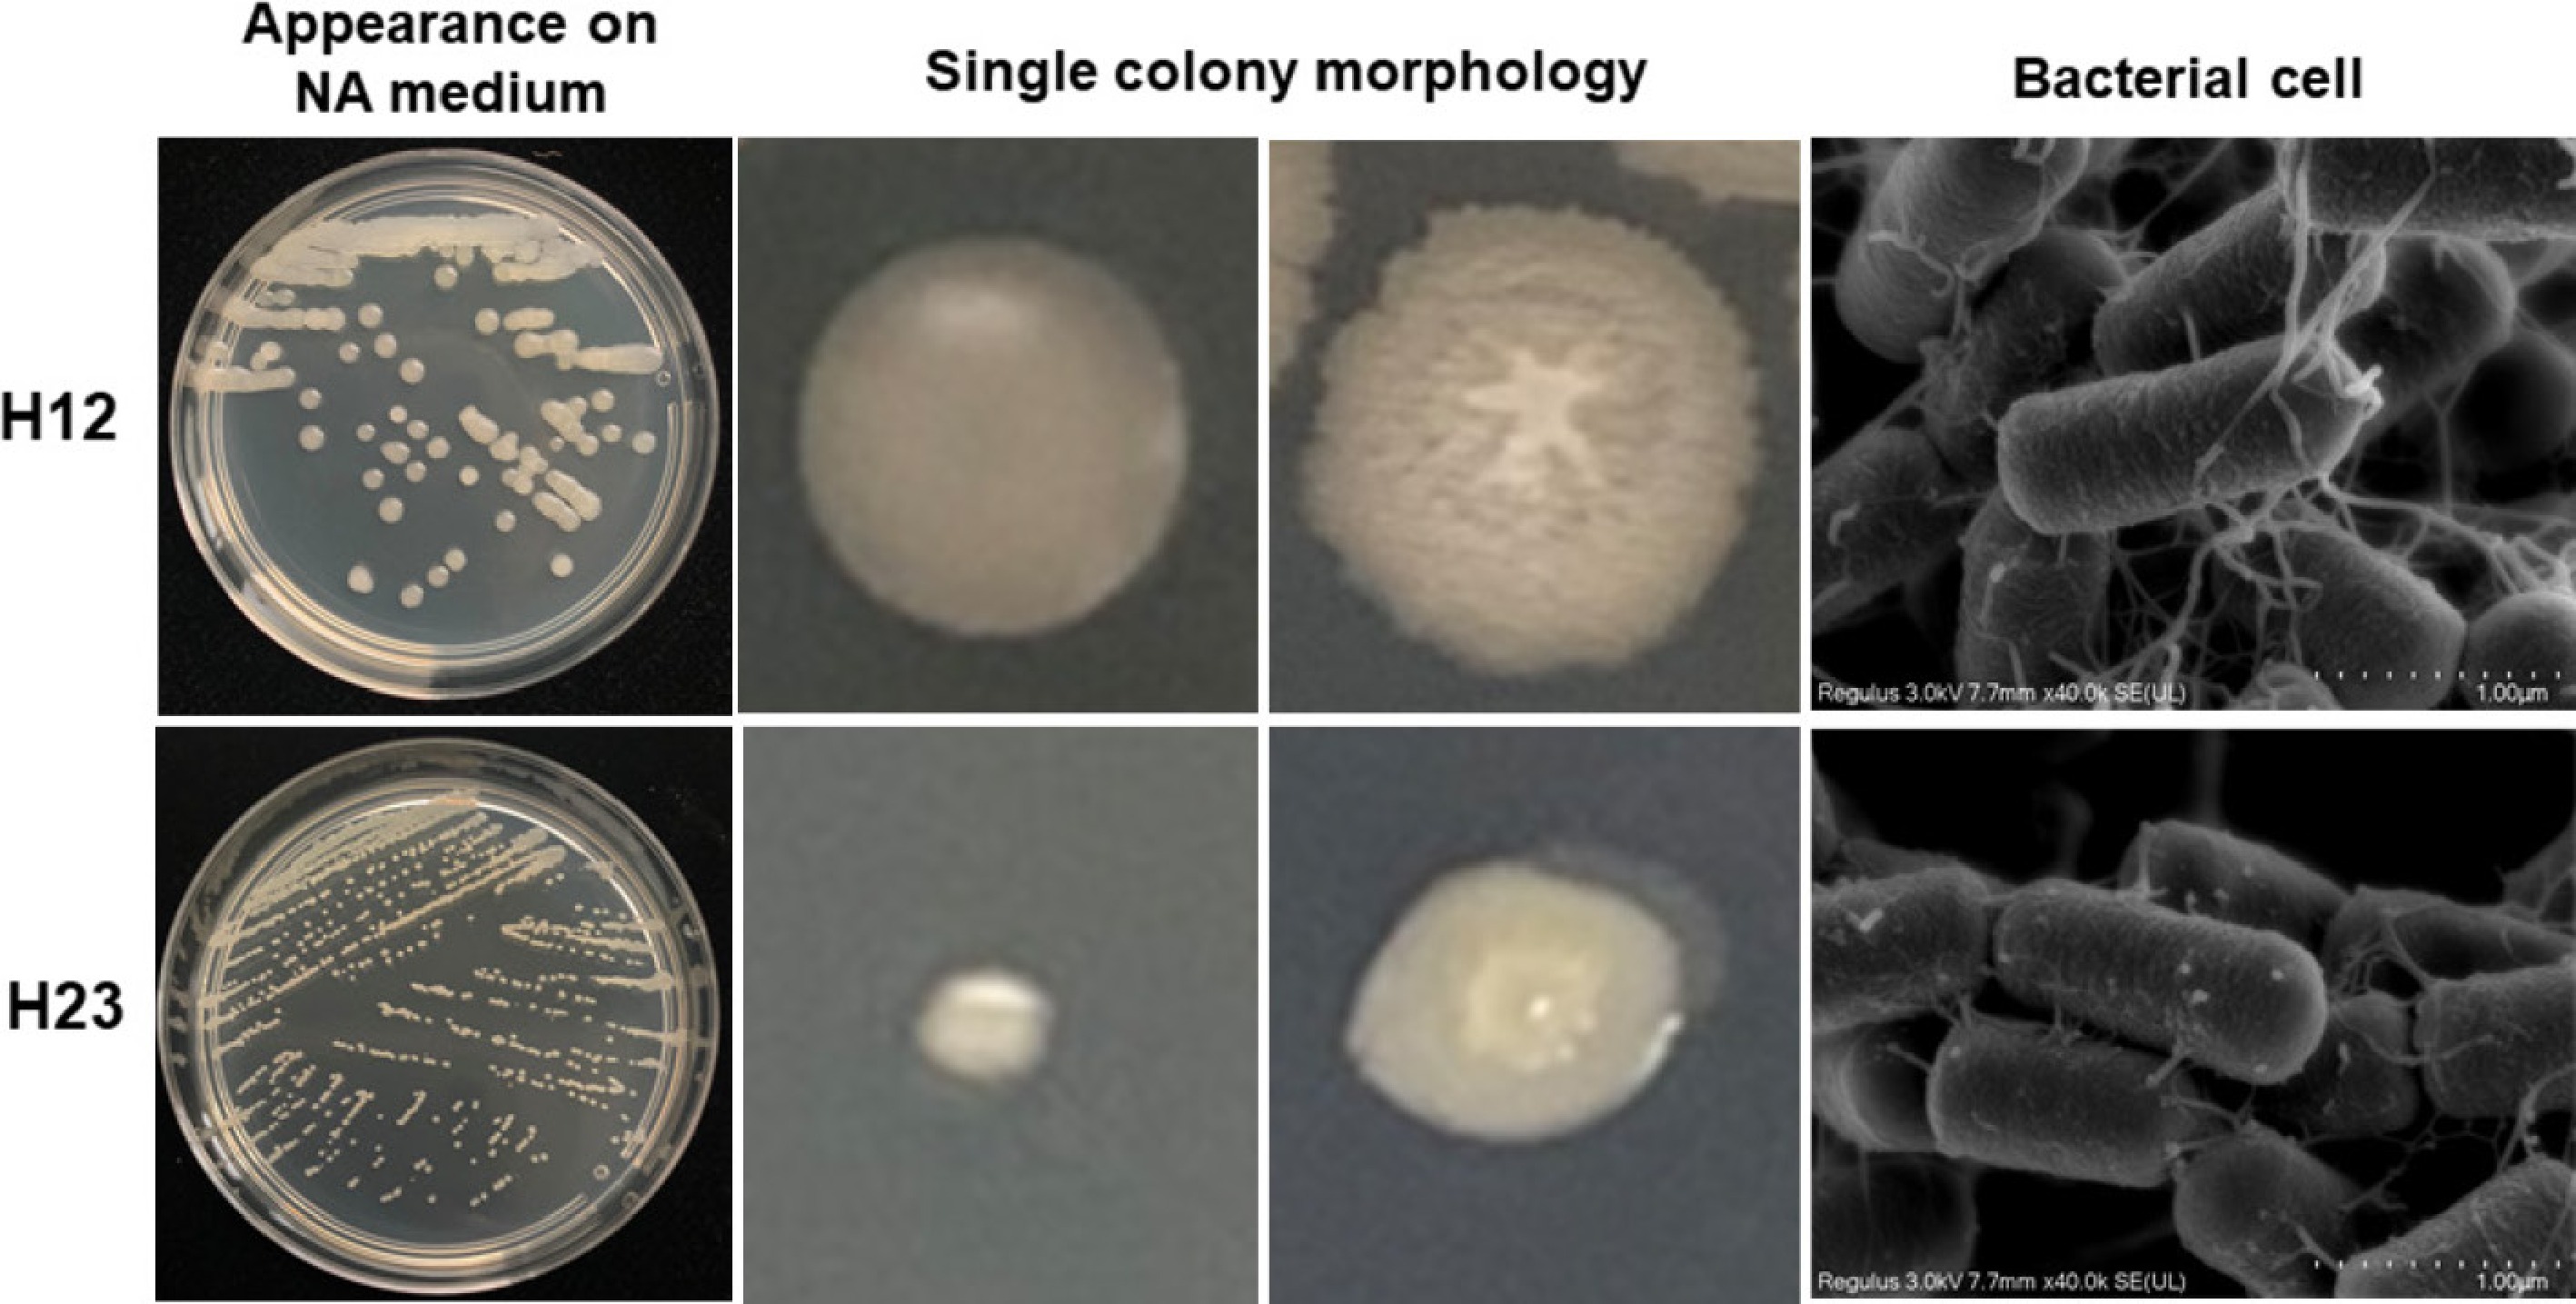
Figure 2.
Colony morphological characteristics of H12 and H23. From left to right are appearance on NA medium at 18 h. Single colony morphology at 18 and 24 h, scanning electron micrographs of bacterial cells.
-
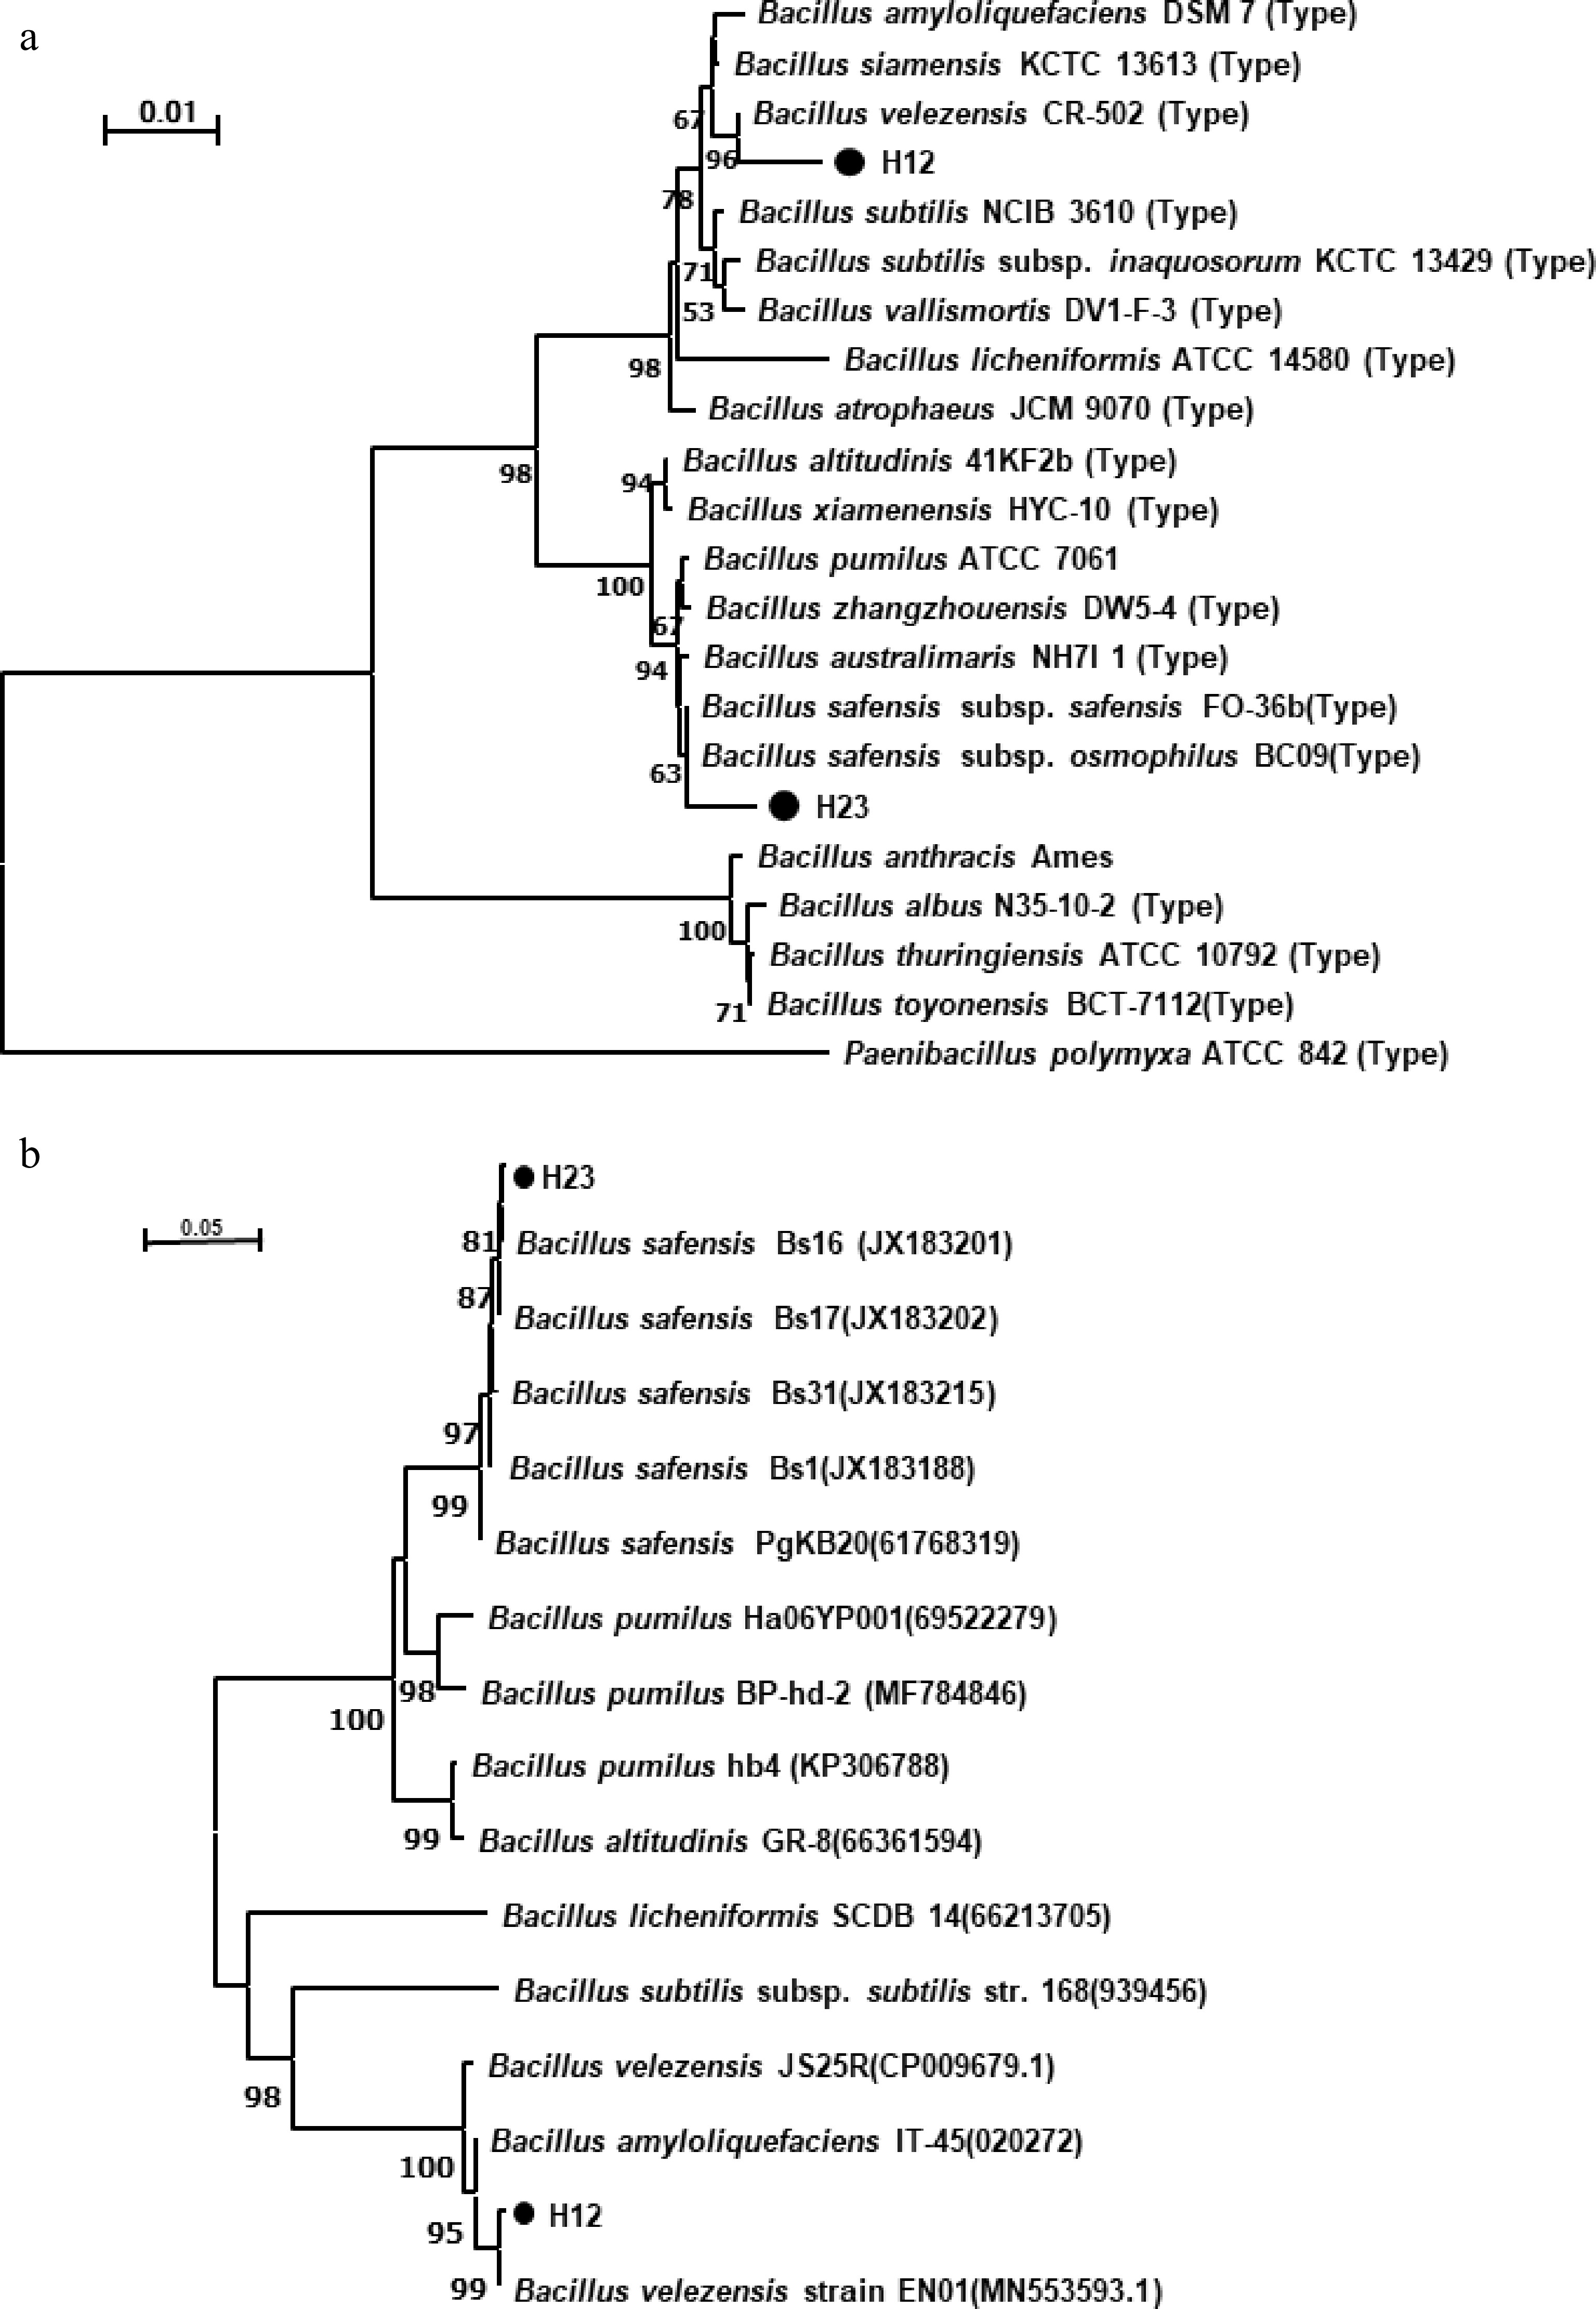
Figure 3.
Neighbour-joining phylogenetic trees based on (a) 16S rRNA, and (b) gyrB genes sequences of strains H12 and H23. Numbers in parentheses represent the sequences accession number in GenBank. The number at each branch point is the percentage supported by bootstrap (values expressed as percentages of 1,000 replicates). Bar 0.5% sequence divergence. Type indicates the type strain.
-

Figure 4.
Biocontrol effect of H12 and H23 on pepper blight under greenhouse conditions. (a) Disease severity of pepper blight under H12 and H23 treatments. (b) Pictures of Control, H12, and H23 treatments that were taken at 21 d post P. capsici inoculation. Disease severity (%) = ∑ (Number of diseased plants at each level × Disease grade value)/Total number of surveyed plants × Highest disease grade value × 100. Bars represent the mean ± standard error of three biological replicates per treatment. Different letters indicate significant difference between treatment and control according to Tukey's t-test at p < 0.05.
-
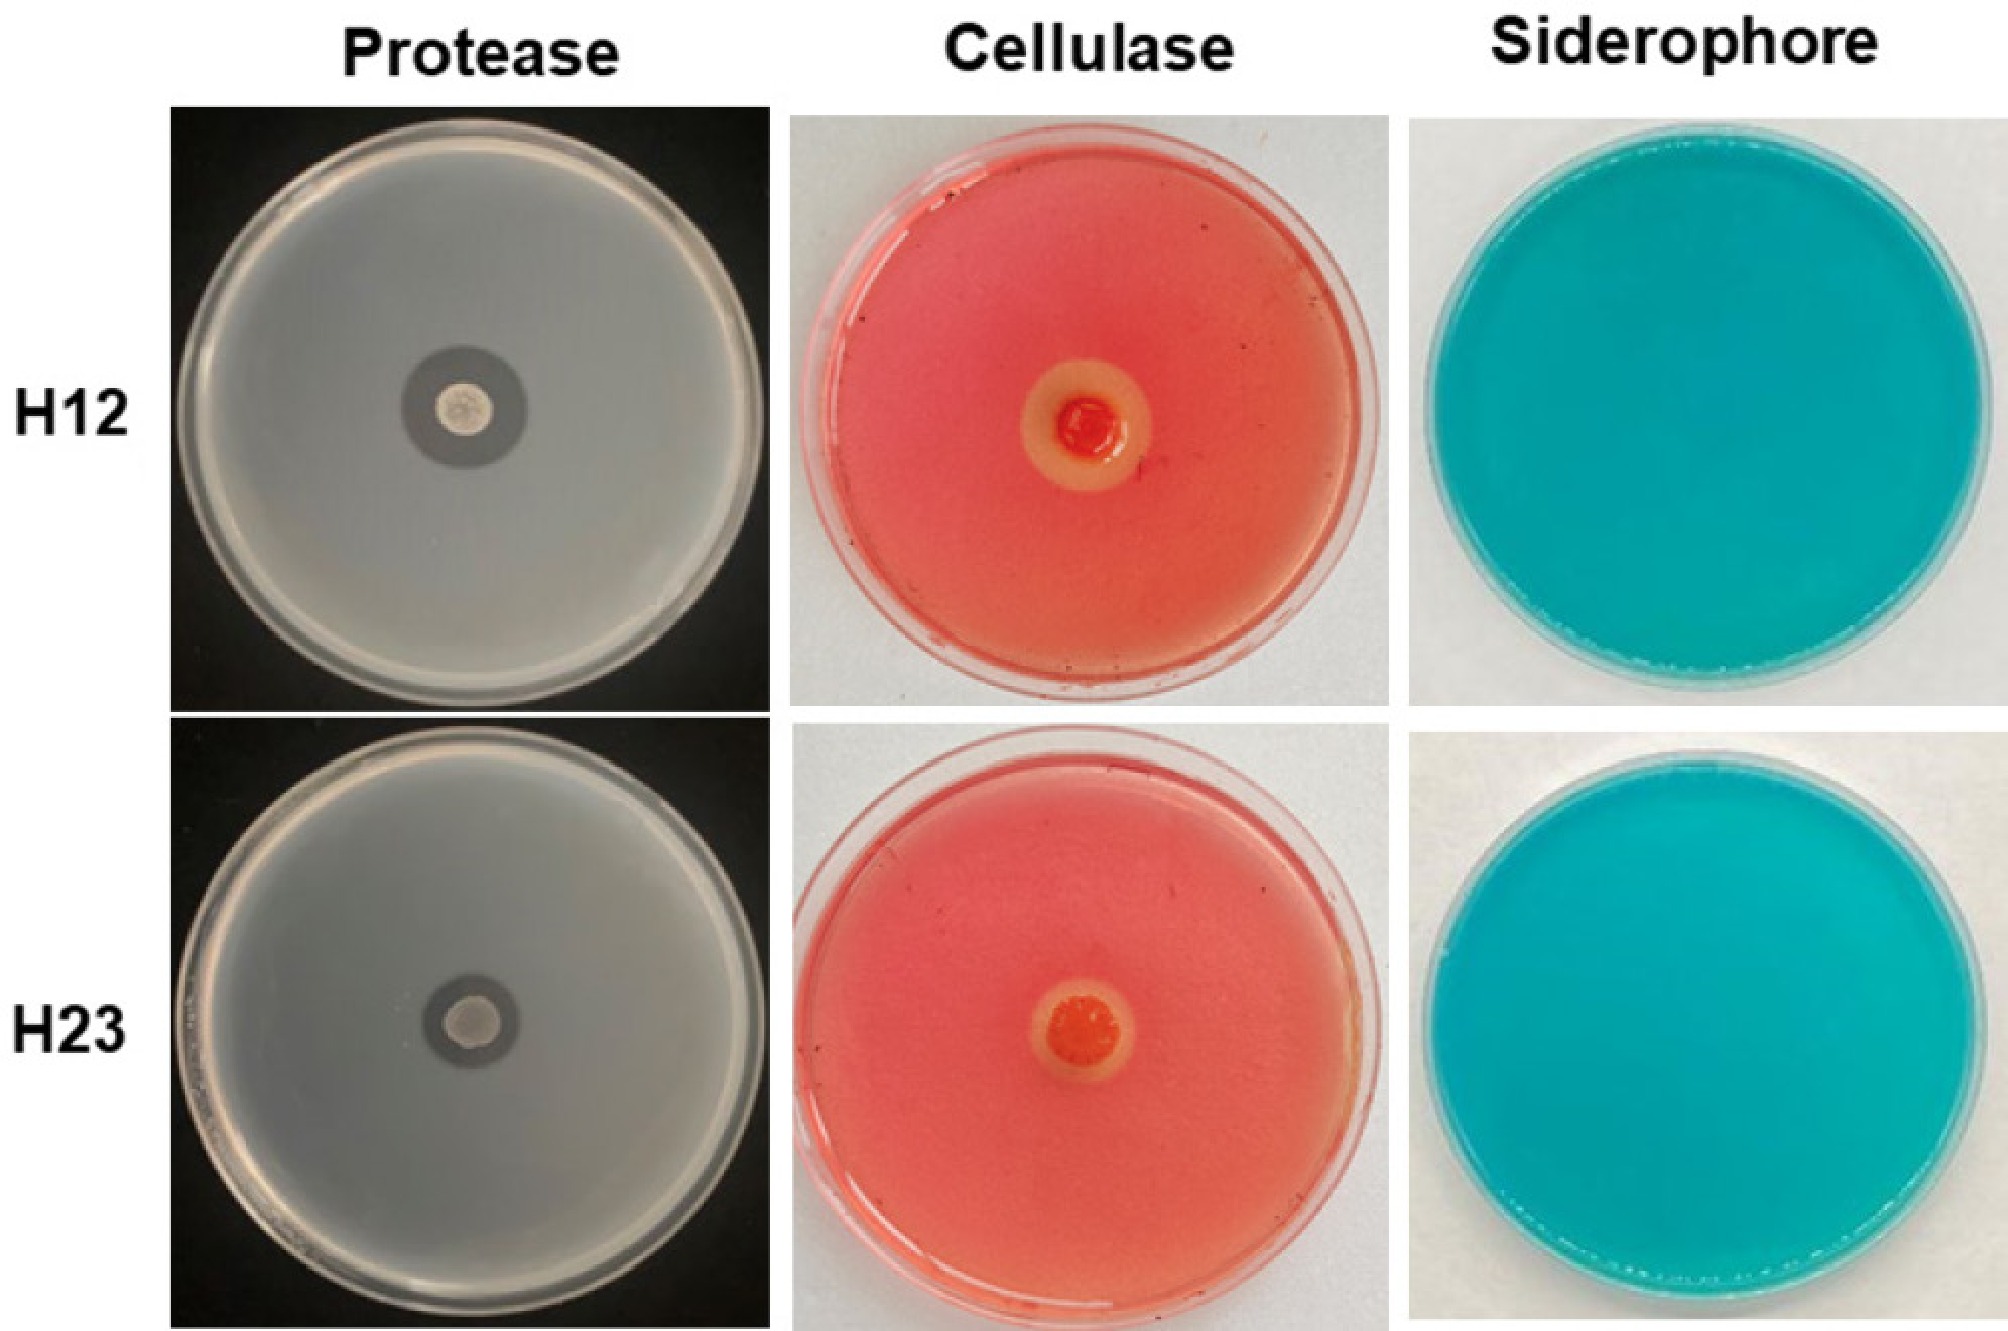
Figure 5.
The extracellular enzymatic activity of strains H12 and H23, where there were proteases, cellulases, and iron carriers from left to right.
-
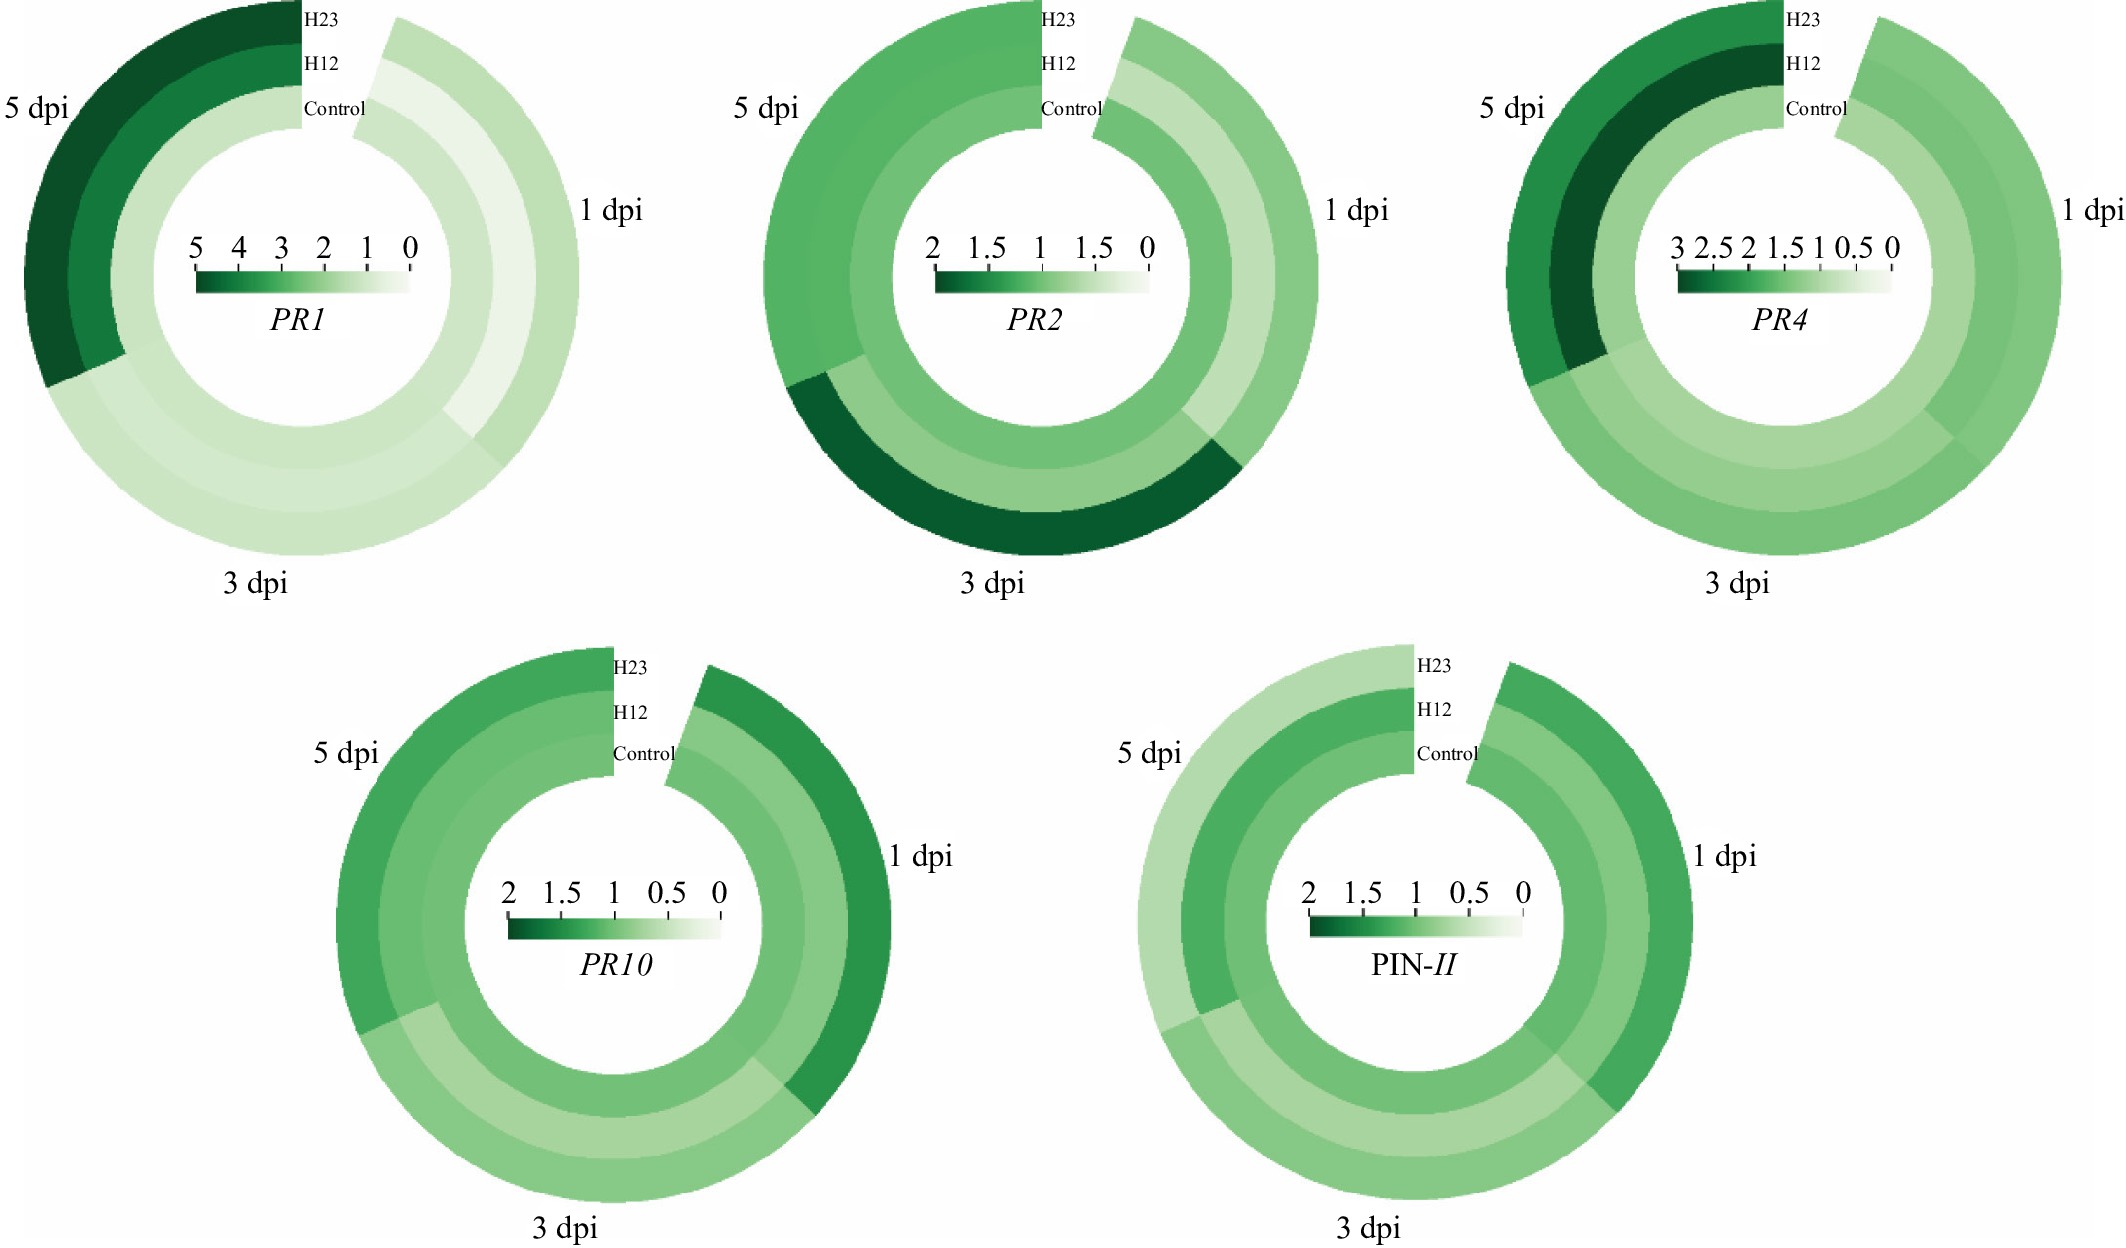
Figure 6.
Expression of PR1, PR2, PR4, PR10, and PIN-II in pepper at 1 d, 3 d, and 5 d after inoculation with P. capsici under H12 and H23 pre-treatment. The circular cluster plot of different colors based on the data range (displayed in the middle of each circle) showed the variations in each treatment.
-
Strain number Radial growth (cm)δ Inhibition efficiency (%)ε Control 7.8 ± 0.1aφ − H12 1.9 ± 0.3b 75.6% H23 1.4 ± 0.2b 82.1% δ The mean values of three independent measurements of radial growth (± standard deviation) of P. capsici, which were recorded on the day when radial growth of the control treatment was a full plate. ε Inhibition efficiency (%) = (1 – R1/R2) × 100, where, R1 and R2 = P. capsici mycelial radial growth on treatment and control plates, respectively. φ Different lowercase letters within the same column indicate significant differences between the different strains at the 0.05 level. Table 1.
Inhibition effect of the isolated strains against Phytophthora capsici.
Figures
(6)
Tables
(1)