-
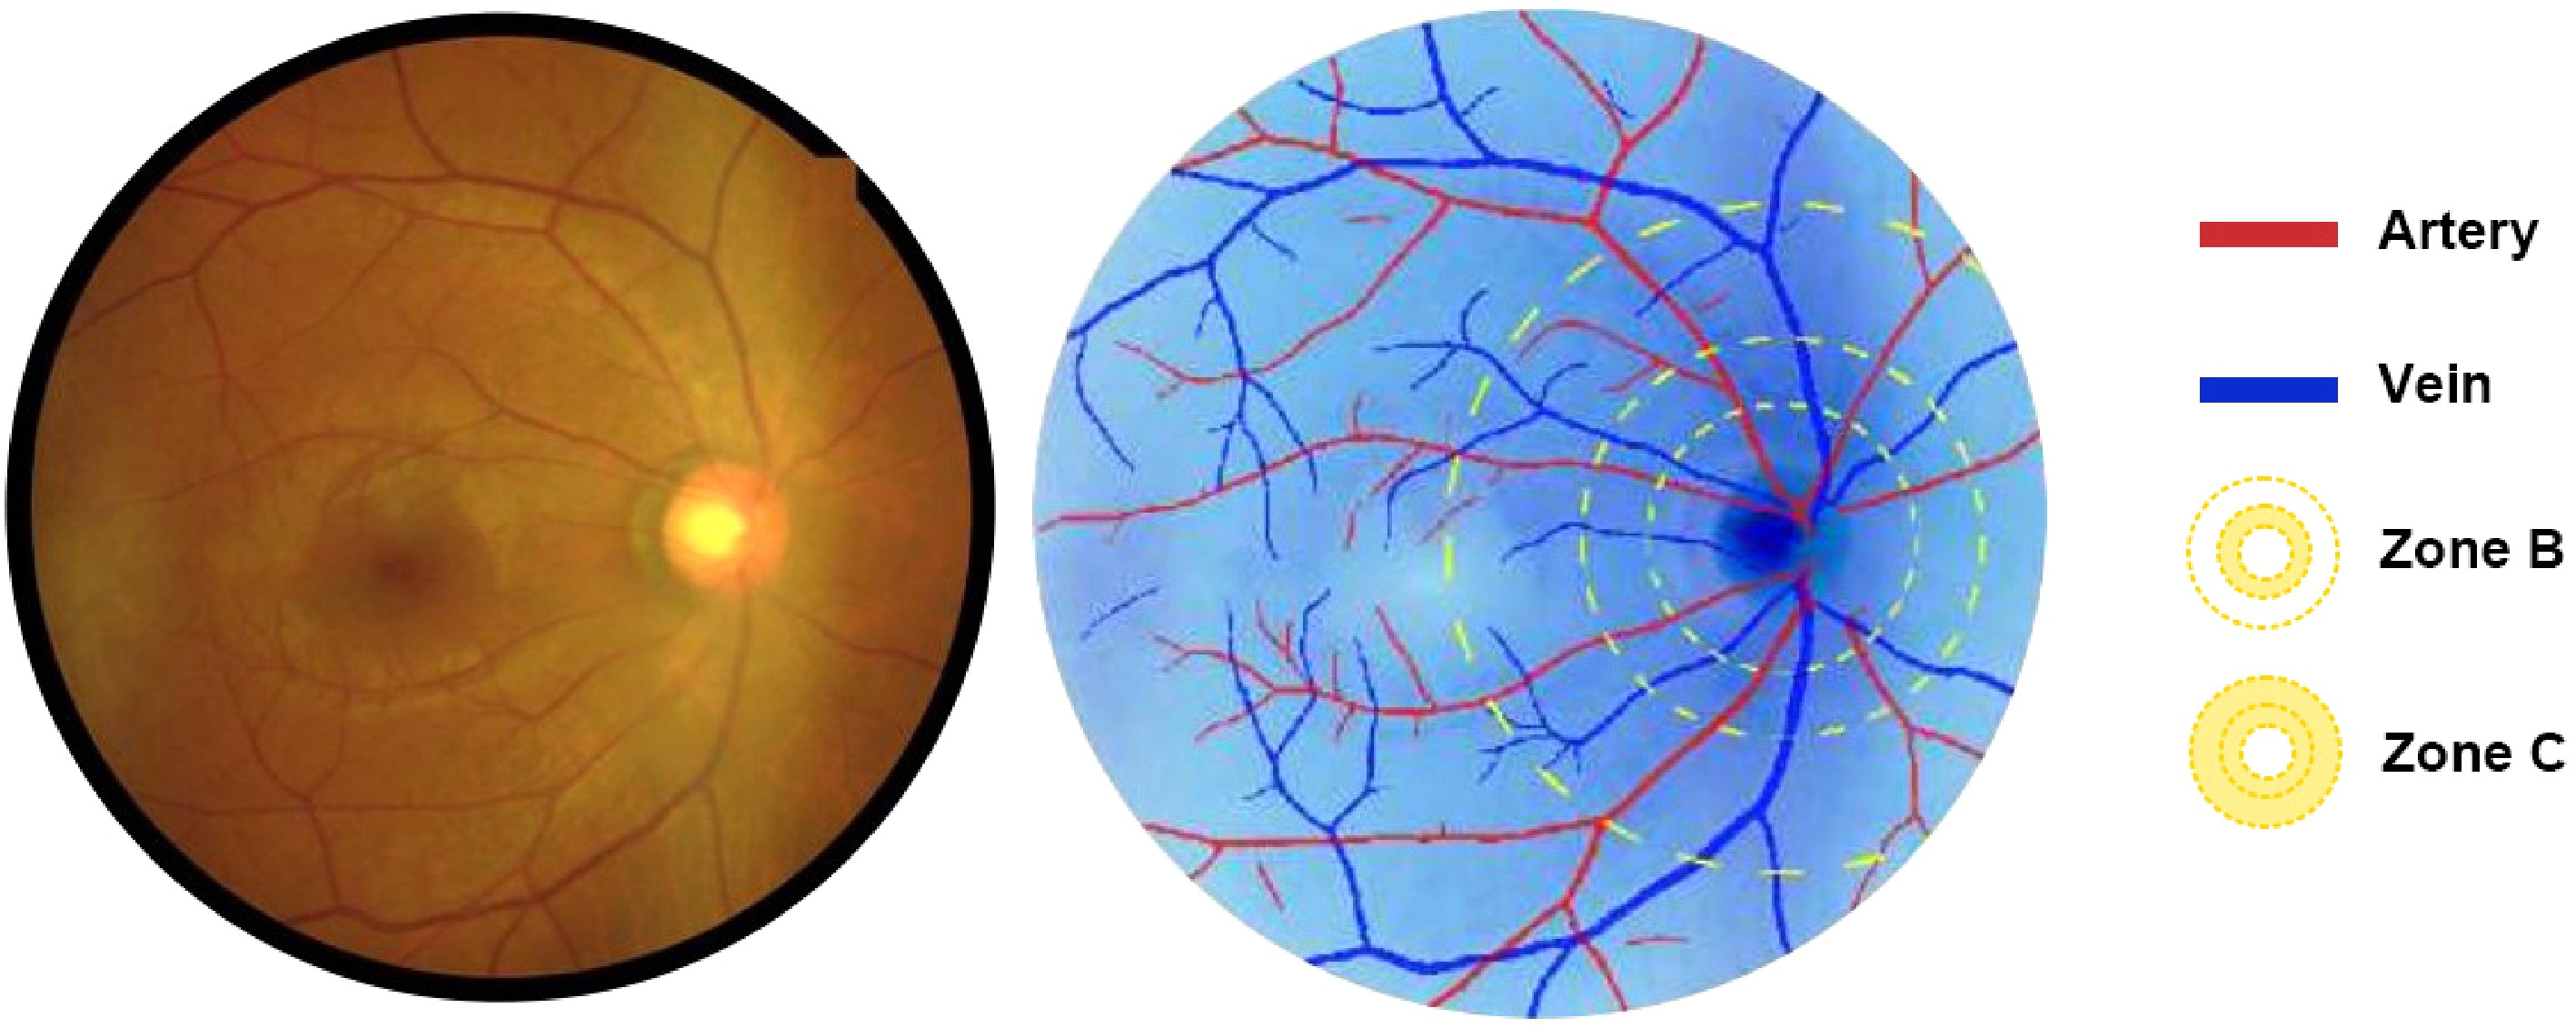
Figure 1.
The SIVA-DLS automatically identifies arterioles (marked in red) and venules (marked in blue) within two concentric zones: Zone B (0.5–1.0 papillary diameter [PD] from the optic disc margin) and Zone C (0.5–2.0 PD from the optic disc margin), from which CRAE and CRVE are calculated.
-
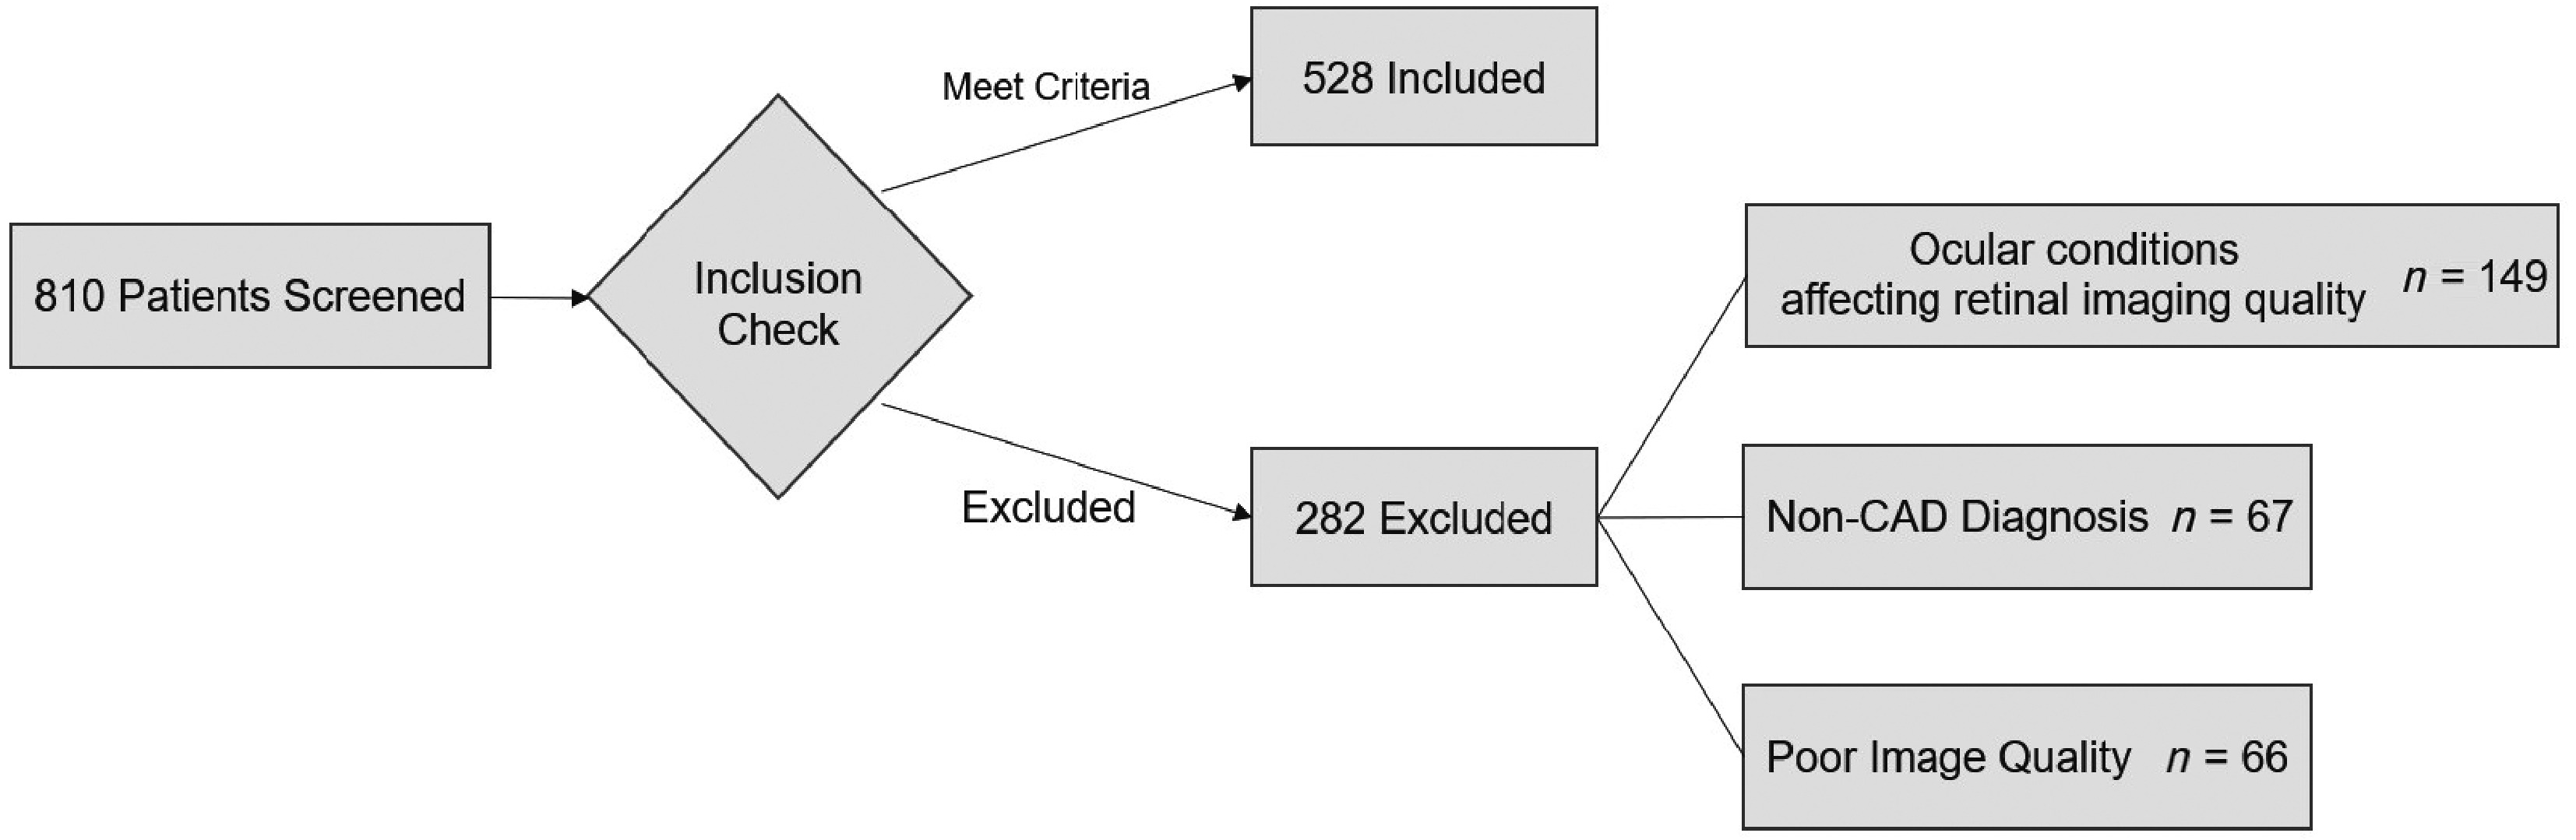
Figure 2.
The participant screening process, including the distribution of excluded patients.
-
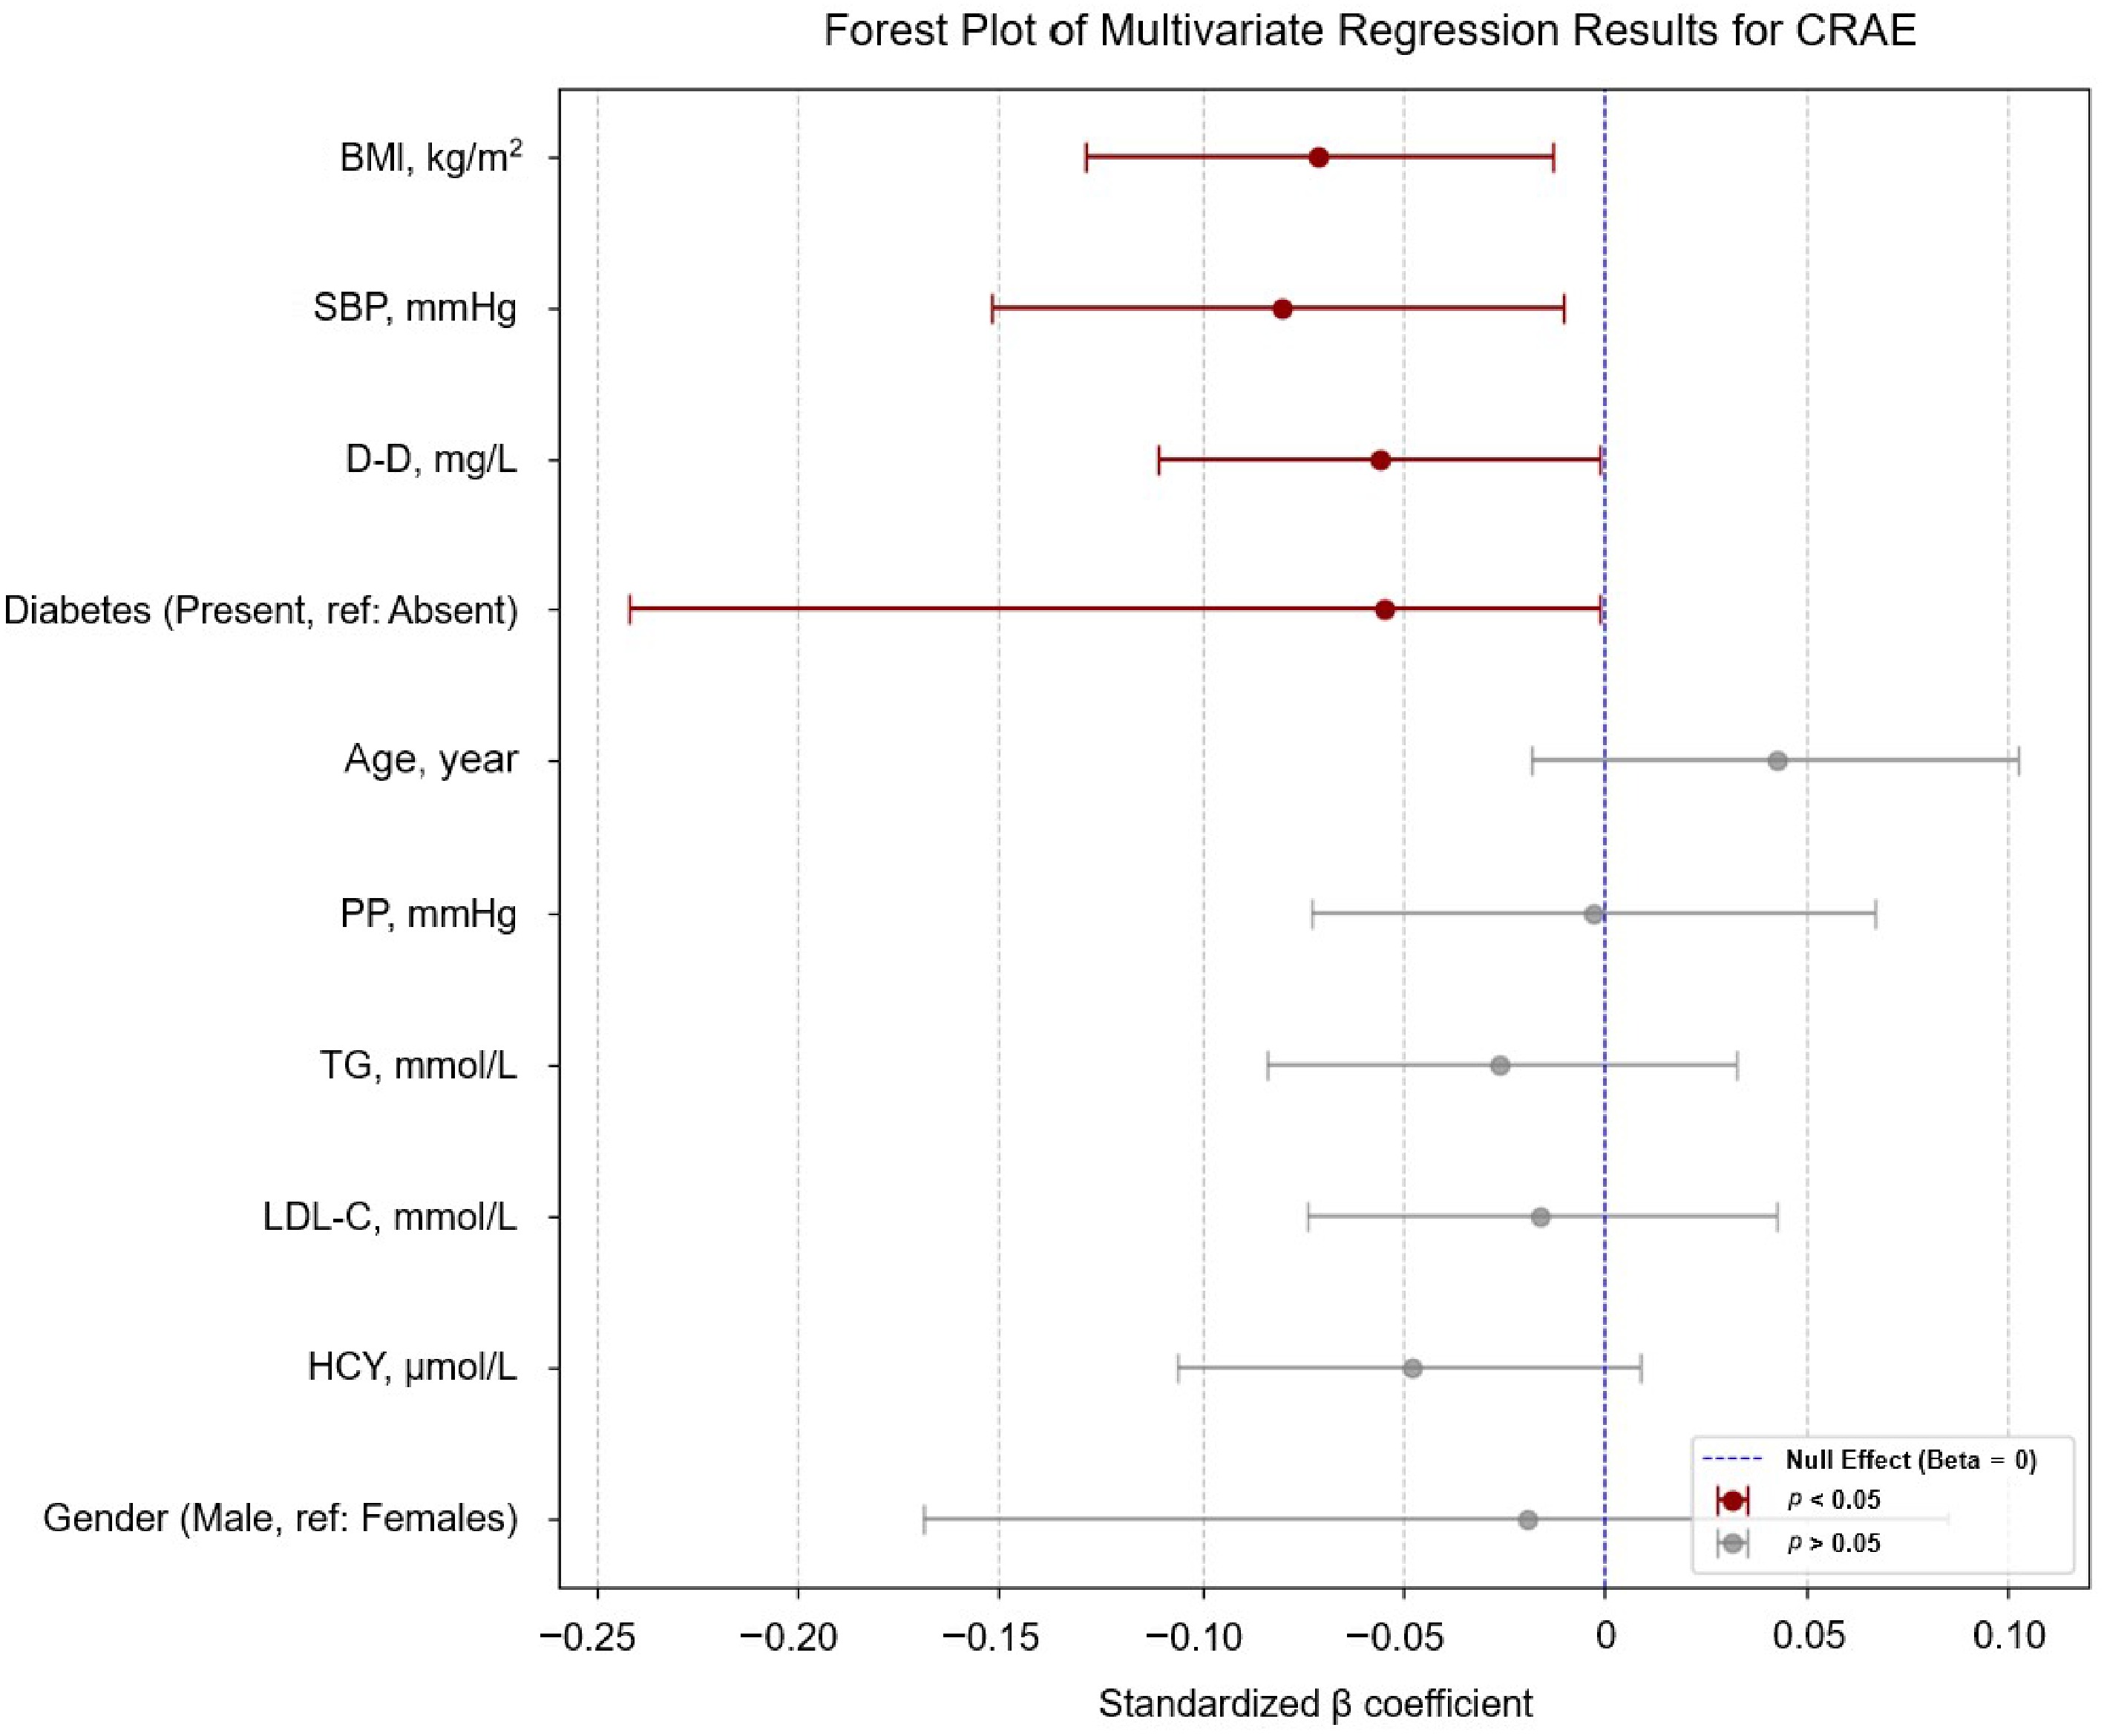
Figure 3.
Forest plot of the multivariable linear regression results for CRAE. Significant inverse associations with SBP (β = −0.080, 95% CI: −0.152 to −0.010), BMI (β = −0.071, −0.129 to −0.013), D-dimer (β = −0.056, −0.111 to −0.001), and diabetes status (β = −0.055, −0.242 to −0.001). Variables with p < 0.05 are emphasized with dark red; a legend indicates the significance levels (p < 0.05 and p > 0.05) and the null effect line (β = 0). We removed CRAE or CRVE from the vertical coordinates to maintain a clear focus on how other systemic health markers relate to the retinal vessel caliber.
-
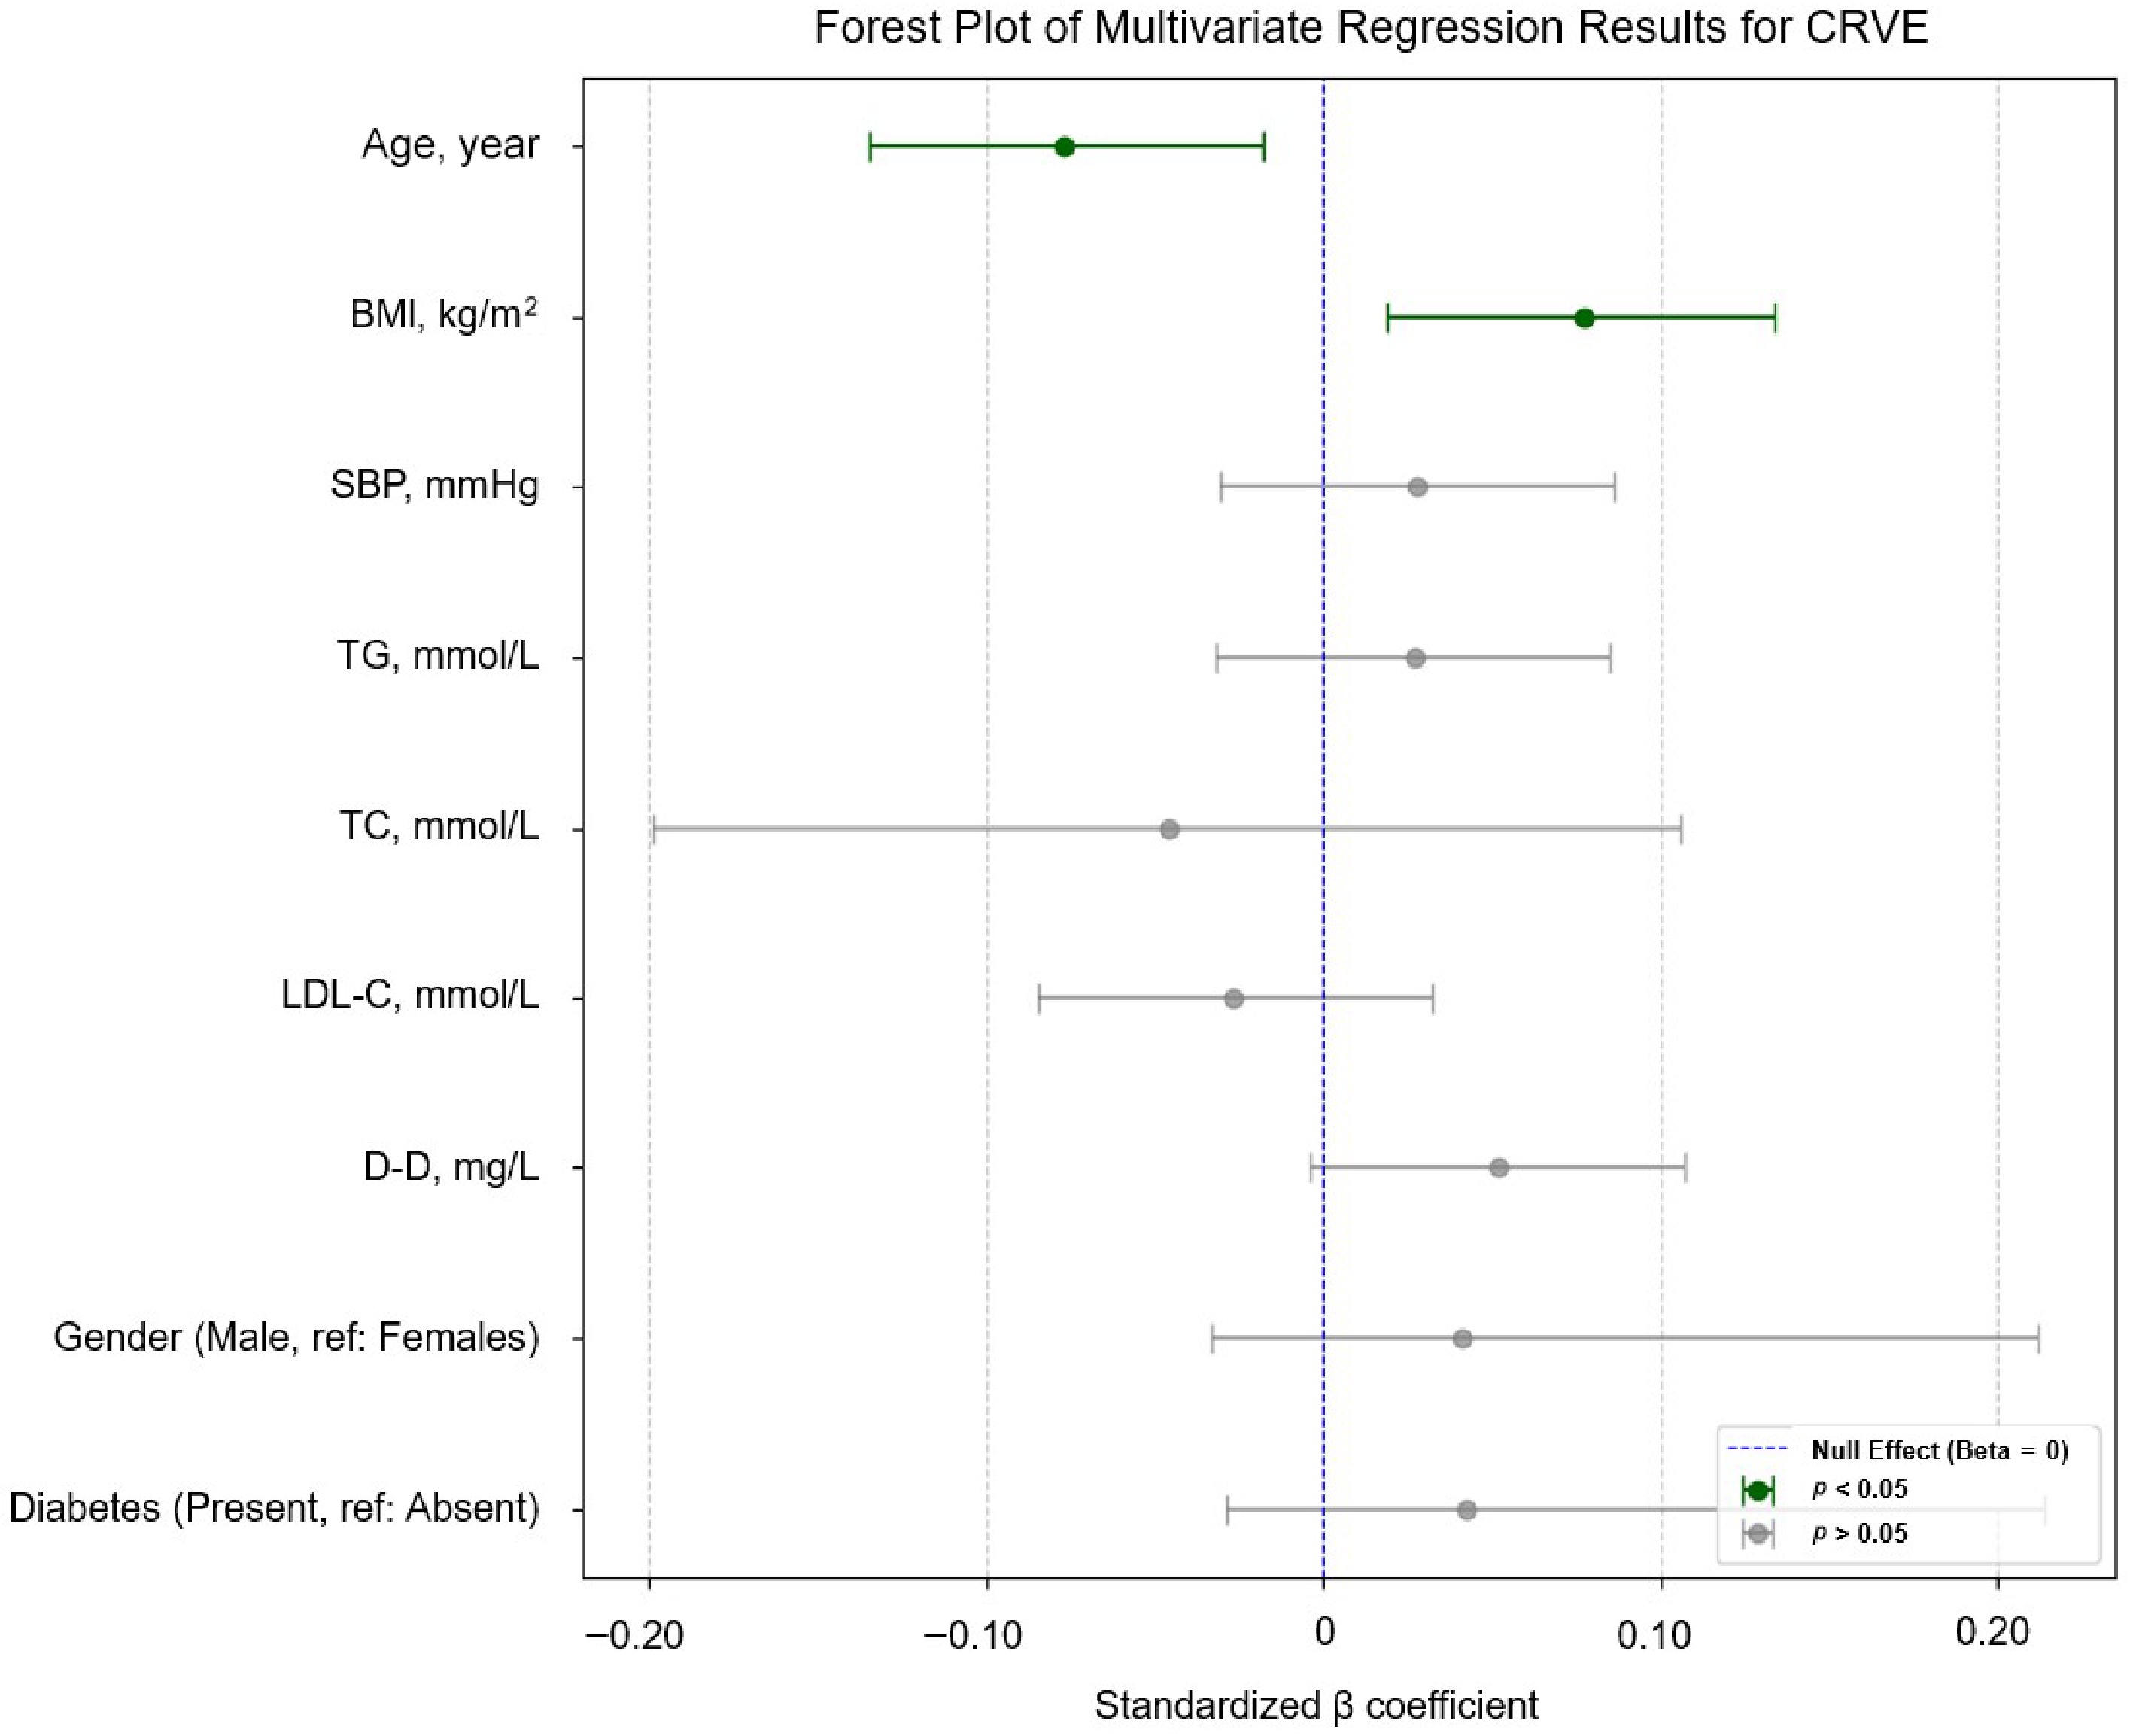
Figure 4.
Forest plot of the multivariable linear regression results for CRVE, showing an independent negative correlation with age (β = –0.077, –0.135 to –0.018) and a positive correlation with BMI (β = 0.077, 0.019–0.134) Variables with p < 0.05 are indicated in dark green; the legend indicates the significance levels (p < 0.05 and p > 0.05) and the null effect line (β = 0). We removed CRAE or CRVE from the vertical coordinates to maintain a clear focus on how the other systemic health markers relate to the respective retinal vessel caliber.
-
Mean SD Age, year 62.13 10.68 BMI, kg/m2 24.43 3.82 SBP, mmHg 126.31 13.20 DBP, mmHg 76.54 8.24 MAP, mmHg 92.69 10.05 PP, mmHg 49.77 14.18 Pulse, beats/minute 71.25 6.92 TG, mmol/L 1.54 0.84 TC, mmol/L 4.17 1.21 HDL-C, mmol/L 1.08 0.25 LDL-C, mmol/L 2.69 0.95 FBG, mmol/L 5.32 1.14 ALB, mmol/L 39.95 3.68 Creatinine, umol/L 93.87 36.59 hs-CRP,mg/L 6.36 9.99 α-HBDH, U/L 134.33 58.07 CK, U/L 131.79 163.44 CK-MB, U/L 7.82 11.96 LDH, U/L 202.26 73.29 cTnT, μg/L 0.21 0.91 Myo, ng/mL 38.63 32.09 NT-proBNP, pg/mL 609.08 1,301.76 HCY, μmol/L 11.09 3.04 D-D, mg/L 0.56 0.69 CRAE, PD 0.023 0.006 CRVE, PD 0.031 0.008 Gender Female n = 151 28.6% Male n = 377 71.4% Hypertension Absent n = 376 71.2% Present n = 152 28.8% Diabetes Absent n = 195 36.9% Present n = 333 63.1% Smoking Never n = 315 59.7% Current or former n = 213 40.3% Continuous variables are presented as the mean ± SD; categorical variables as counts (percentages). PD, papillary diameter. Hypertension was defined as a prior diagnosis with antihypertensive medication use, SBP ≥ 140 mmHg, or DPB ≥ 90 mmHg. Diabetes mellitus was defined as a prior physician diagnosis or the use of antidiabetic medications. Smoking was defined as current or former smoking. Table 1.
Baseline characteristics of participants.
-
β 95% CI p Age, year −0.096 (−0.181, −0.010) 0.028* BMI, kg/m2 −0.020 (−0.106, 0.065) 0.640 SBP, mmHg −0.157 (−0.242, −0.073) < 0.001* DBP, mmHg −0.077 (−0.162, 0.009) 0.078 MAP, mmHg −0.083 (−0.169, 0.002) 0.056 PP, mmHg −0.131 (−0.216, −0.046) 0.002* Pulse, beats/min −0.077 (−0.162, 0.009) 0.078 TG, mmol/L −0.044 (−0.130, 0.041) 0.308 TC, mmol/L −0.102 (−0.187, −0.016) 0.020* HDL-C, mmol/L −0.019 (−0.105, 0.066) 0.656 LDL-C, mmol/L −0.104 (−0.189, −0.019) 0.017* FBG, mmol/L −0.074 (−0.160, 0.011) 0.088 ALB, mmol/L 0.028 (−0.058, 0.113) 0.525 Creatinine, μmol/L −0.051 (−0.137, 0.034) 0.239 hs-CRP, mg/L −0.007 (−0.093, 0.078) 0.866 α−HBDH, U/L −0.027 (−0.113, 0.059) 0.534 CK, U/L −0.018 (−0.103, 0.068) 0.684 CK-MB, U/L −0.056 (−0.141, 0.030) 0.201 LDH, U/L −0.037 (−0.122, 0.049) 0.398 cTnT, μg/L −0.041 (−0.127, 0.045) 0.347 Myo, ng/mL −0.009 (−0.094, 0.077) 0.842 NT-proBNP, pg/mL −0.004 (−0.090, 0.081) 0.924 HCY, μmol/L −0.101 (−0.187, −0.016) 0.020* D-D, mg/L −0.054 (−0.139, 0.032) 0.218 Gender Male (reference: Females) 0.045 (−0.144, 0.234) 0.642 Hypertension Present (reference: Absent) −0.146 (−0.323, 0.031) 0.105 Diabetes Present (reference: Absent) −0.172 (−0.360, 0.017) 0.074 Smoking Current or former (reference: Never) −0.057 (−0.252, 0.139) 0.570 CRVE, PD 0.769 (0.714, 0.824) < 0.001* * indicates p < 0.05. PD, papillary diameter; CI, confidence interval. Hypertension was defined as a prior diagnosis with antihypertensive medication use, SBP ≥ 140 mmHg, or DBP ≥ 90 mmHg. Diabetes mellitus was defined as a prior physician diagnosis or use of antidiabetic medications. Smoking was defined as current or former smoking. Table 2.
Univariate linear regression analysis of participants' clinical data and CRAE.
-
β 95% CI p VIF Age, year 0.043 (−0.018, 0.103) 0.166 1.250 BMI, kg/m² −0.071 (−0.129, −0.013) 0.016* 1.133 SBP, mmHg −0.080 (−0.152, −0.010) 0.026* 1.714 PP, mmHg −0.003 (−0.073, 0.067) 0.935 1.684 TG, mmol/L −0.026 (−0.084, 0.033) 0.391 1.169 LDL-C, mmol/L −0.016 (−0.074, 0.043) 0.599 1.156 HCY, μmol/L −0.048 (−0.106, 0.009) 0.101 1.145 D-D, mg/L −0.056 (−0.111, −0.001) 0.047* 1.061 Gender Male (reference: Females) −0.019 (−0.169, 0.085) 0.513 1.134 Diabetes Present (reference: Absent) −0.055 (−0.242, −0.001) 0.048* 1.030 CRVE, PD 0.761 (0.706, 0.817) < 0.001* 1.044 This multivariable model was adjusted for all variables listed in the table: Age, BMI, SBP, PP, TG, LDL-C, HCY, D-D, gender, diabetes status, and CRVE. * indicates p < 0.05. The coefficient of determination (R2) for the multivariate regression model was 0.611. CI, confidence interval; VIF, variance inflation factor; PD, papillary diameter. Diabetes mellitus was defined as a prior physician diagnosis or use of antidiabetic medications. Table 3.
Multivariable linear regression analysis of participants' clinical data and CRAE.
-
β 95% CI p Age, y −0.131 (−0.216, −0.046) 0.003* BMI, kg/m² 0.025 (−0.061, 0.110) 0.571 SBP, mmHg −0.157 (−0.208, −0.038) 0.004* DBP, mmHg −0.035 (−0.121, 0.050) 0.417 MAP, mmHg −0.061 (−0.146, 0.025) 0.162 PP, mmHg −0.122 (−0.207, −0.037) 0.055 Pulse, beats/min −0.045 (−0.131, 0.041) 0.303 TG, mmol/L −0.008 (−0.094, 0.078) 0.856 TC, mmol/L −0.092 (−0.177, −0.006) 0.035* HDL-C, mmol/L −0.019 (−0.105, 0.067) 0.665 LDL-C, mmol/L −0.089 (−0.174, −0.003) 0.041* FBG, mmol/L −0.053 (−0.138, 0.033) 0.227 ALB, mmol/L 0.032 (−0.053, 0.118) 0.459 Creatinine, μmol/L −0.010 (−0.096, 0.075) 0.812 hs-CRP, mg/L 0.010 (−0.076, 0.096) 0.819 α−HBDH, U/L −0.028 (−0.114, 0.057) 0.516 CK, U/L 0.004 (−0.082, 0.090) 0.925 CK-MB, U/L −0.024 (−0.109, 0.062) 0.585 LDH, U/L −0.035 (−0.121, 0.050) 0.417 cTnT, μg/L −0.062 (−0.147, 0.024) 0.157 Myo, ng/mL −0.016 (−0.102, 0.069) 0.705 NT-proBNP, pg/mL −0.015 (−0.101, 0.071) 0.729 HCY, μmol/L −0.058 (−0.143, 0.028) 0.185 D-D, mg/L −0.003 (−0.088, 0.083) 0.953 Gender Male (reference: Females) 0.060 (−0.056, 0.322) 0.167 Hypertension Present (reference: Absent) −0.048 (−0.277, 0.078) 0.271 Diabetes Present (reference: Absent) −0.019 (−0.230, 0.147) 0.666 Smoking Current or former (reference: Never) 0.035 (−0.116, 0.275) 0.426 CRAE, PD 0.769 (0.714, 0.824) <0.001* * indicates p < 0.05. PD, papillary diameter; CI, confidence interval. Hypertension was defined as a prior diagnosis with antihypertensive medication use, SBP ≥ 140 mmHg, or DBP ≥ 90 mmHg. Diabetes mellitus was defined as a prior physician diagnosis or use of antidiabetic medications. Smoking was defined as current or former smoking. Table 4.
Univariate linear regression analysis of participants' clinical data and CRVE.
-
β 95% CI p VIF Age, y −0.077 (−0.135, −0.018) 0.011* 1.168 BMI, kg/m2 0.077 (0.019, 0.134) 0.009* 1.132 SBP, mmHg 0.028 (−0.031, 0.086) 0.355 1.158 TG, mmol/L 0.027 (−0.032, 0.085) 0.373 1.164 TC, mmol/L −0.046 (−0.199, 0.106) 0.550 1.820 LDL-C, mmol/L −0.027 (−0.085, 0.032) 0.367 1.148 D-D, mg/L 0.052 (−0.004, 0.107) 0.068 1.050 Gender Male (reference: Females) 0.041 (−0.033, 0.212) 0.151 1.040 Diabetes Present (reference: absent) 0.042 (−0.029, 0.214) 0.136 1.025 CRAE, PD 0.772 (0.716, 0.827) < 0.001* 1.050 This multivariable model was adjusted for all variables listed in the table: Age, BMI, SBP, TG, TC, LDL-C, D-D, gender, diabetes status, and CRAE. * indicates p < 0.05. The coefficient of determination (R2) for the multivariate regression model was 0.598. CI, confidence interval; VIF, variance inflation factor; PD, papillary diameter. Diabetes mellitus was defined as a prior physician diagnosis or use of antidiabetic medications. Table 5.
Multivariable linear regression analysis of participants' clinical data and CRVE.
Figures
(4)
Tables
(5)