-
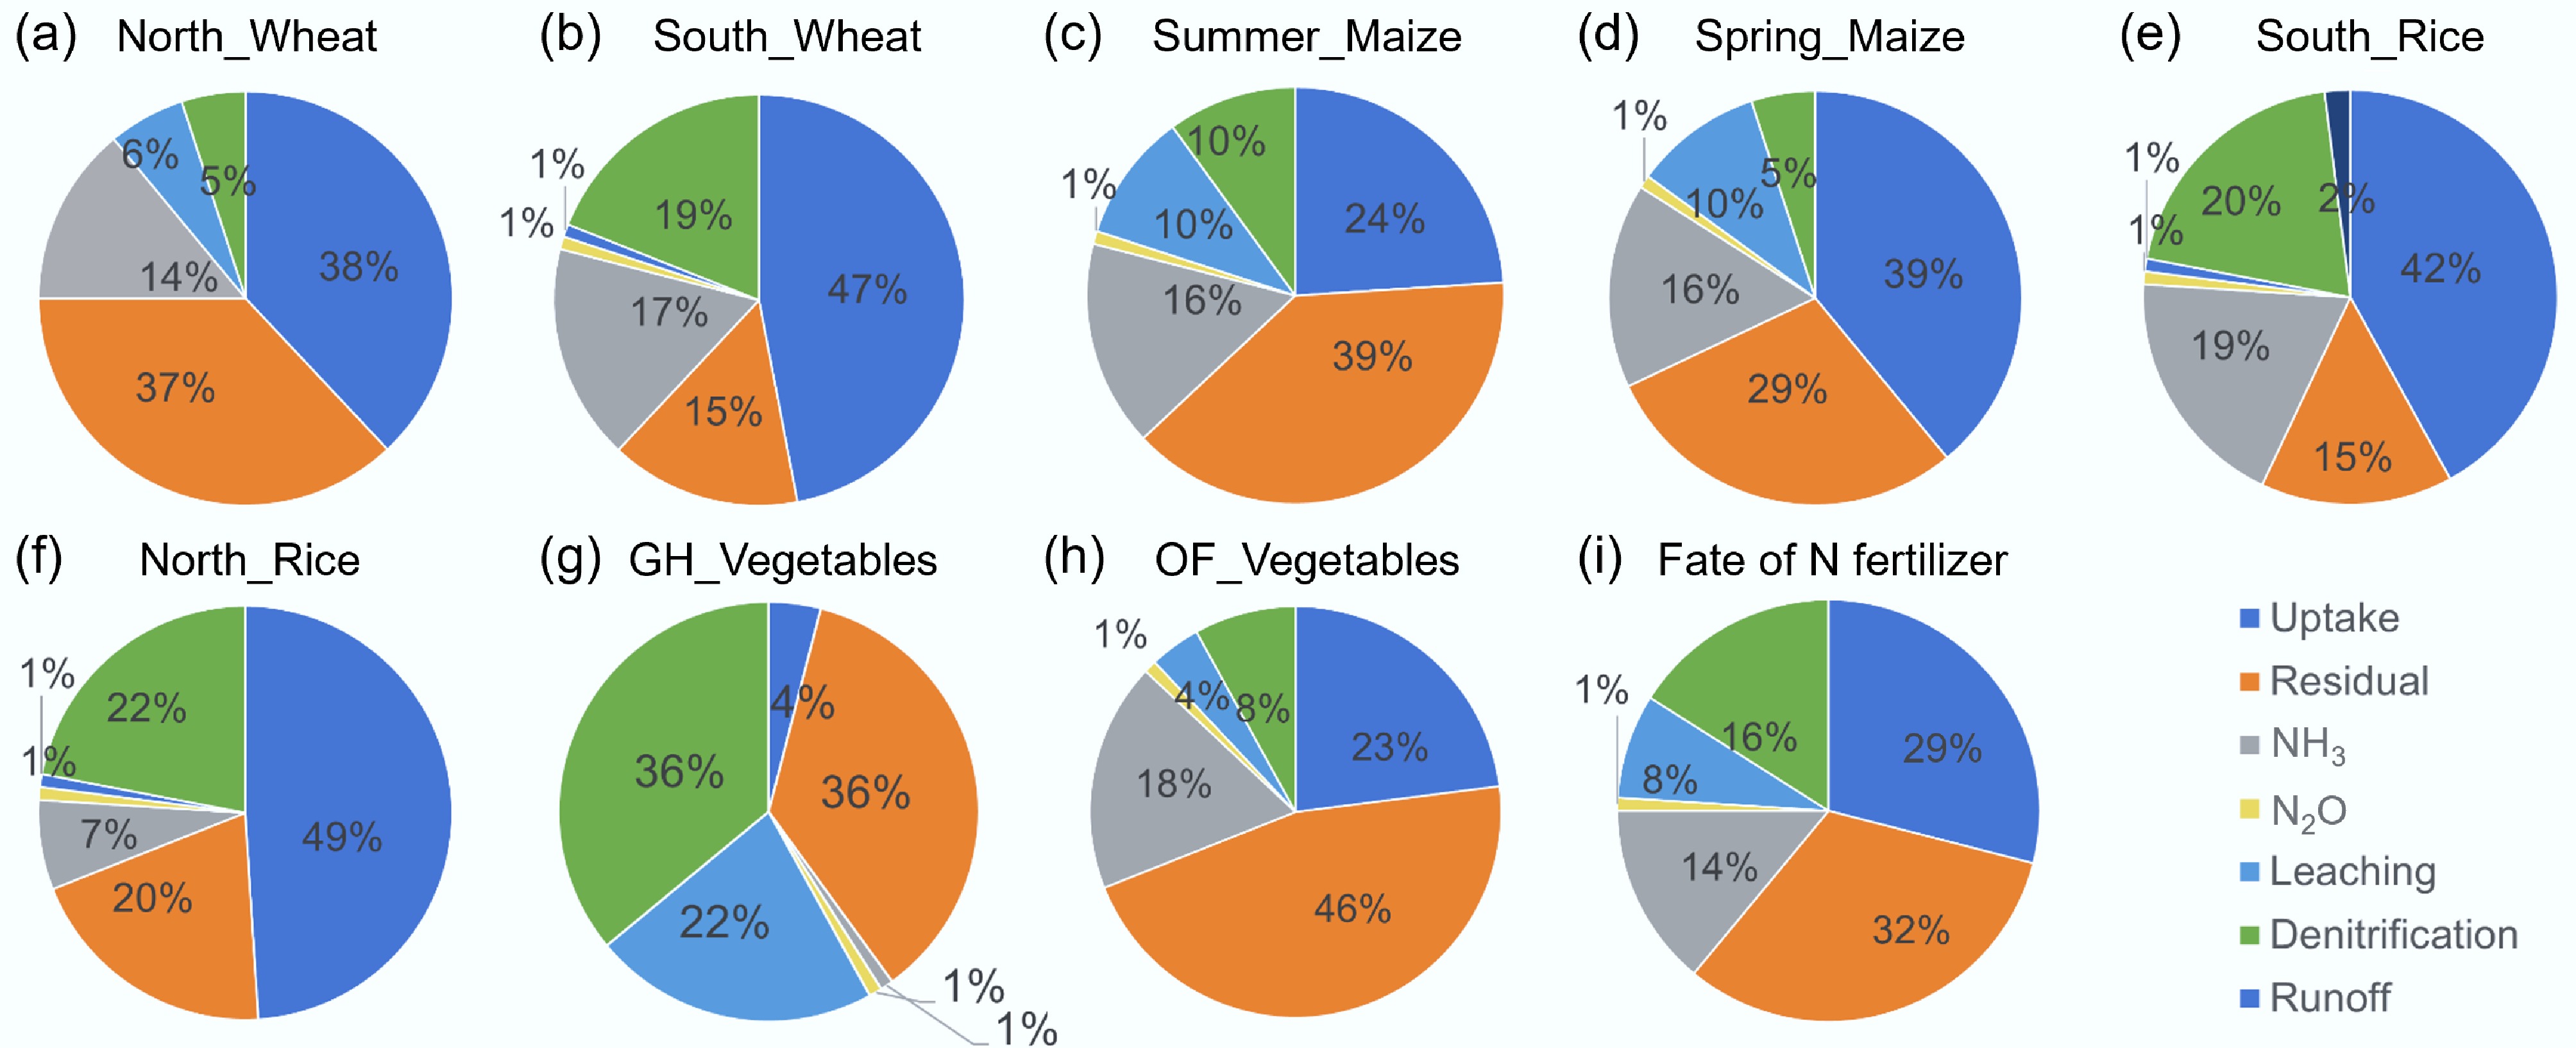
Figure 1.
Fate of fertilizer N in different crops. (a) North_Wheat. (b) South_Wheat. (c) Summer_Maize. (d) Spring_Maize. (e) South_Rice. (f) North_Rice. (g) Greenhouse(GH)_Vegetables. (h) Openfield(OF)_Vegetables and the overall fate of N fertilizer in China's crop production (i). Data were summarized from literature and introduced for details in the Material and methods section as well as the supplementary information.
-
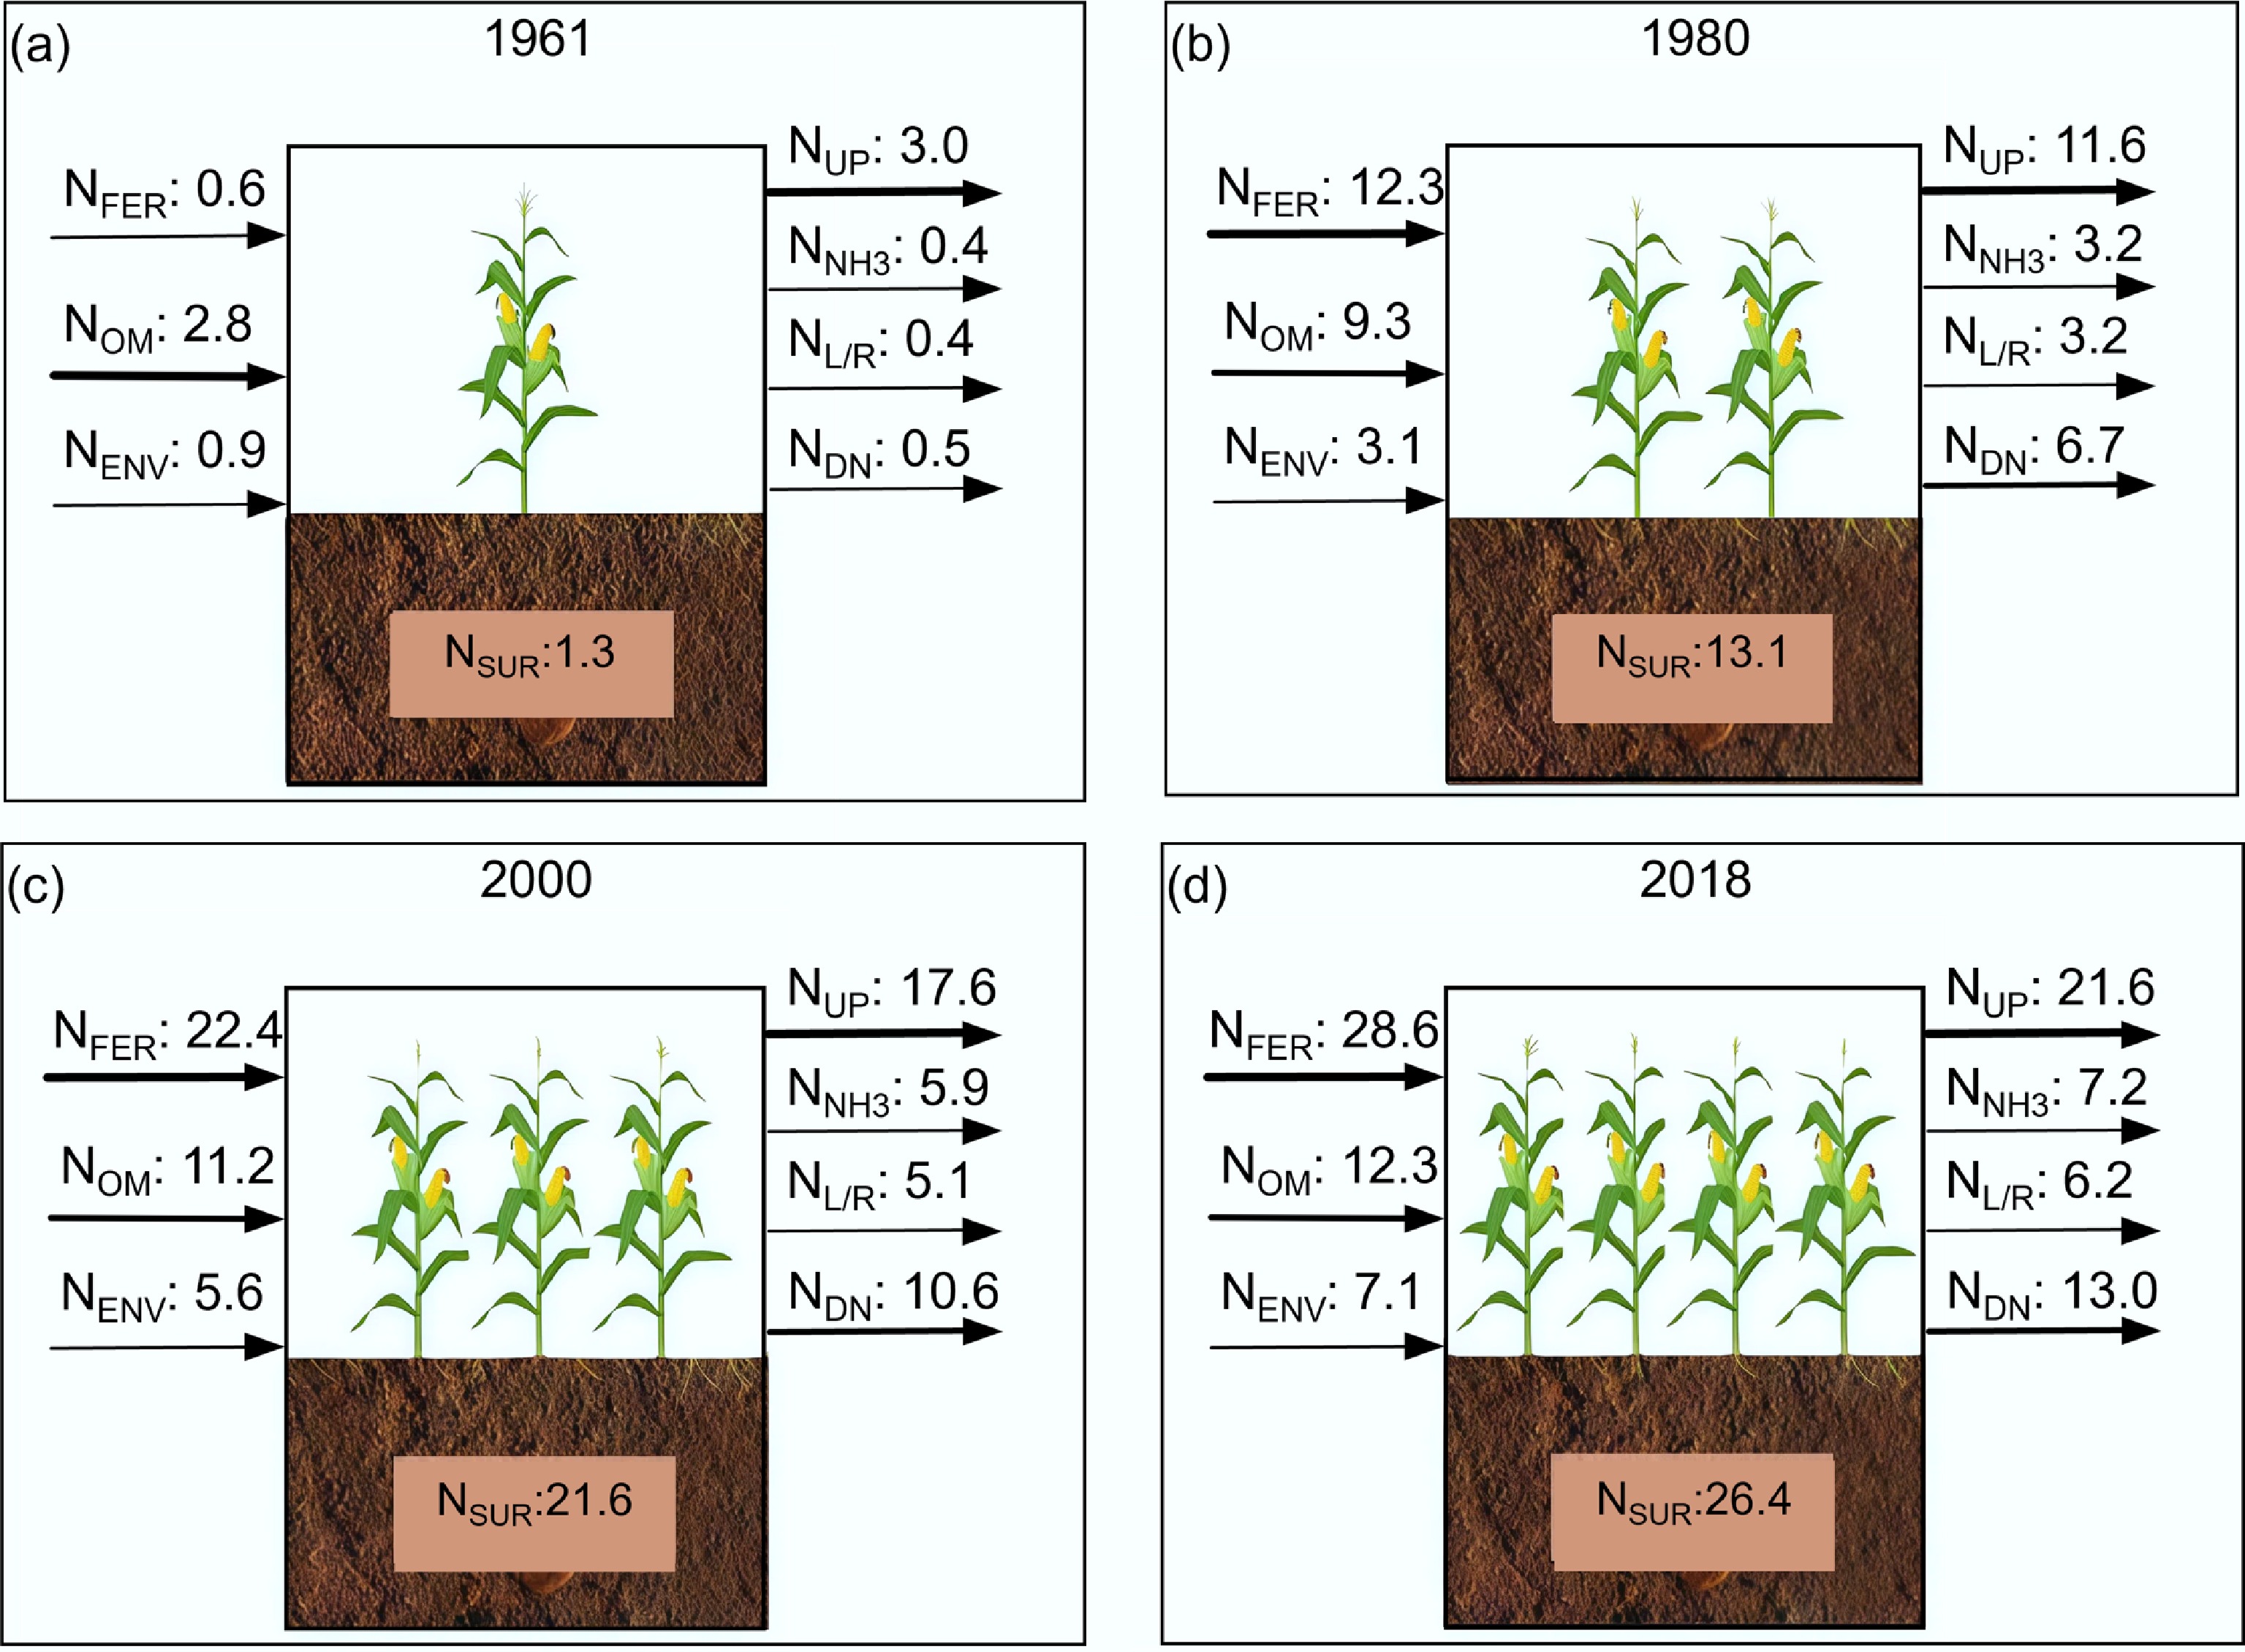
Figure 2.
Nitrogen inputs and losses to the environment in China's crop production systems: (a)−(d), N flows (Tg N yr−1) in 1961, 1980, 2000, and 2018; (e) and (f) changes of total N inputs and outputs. Abbreviations: NFER, N from fertilizer; NENV, N from environment (sum of N fixation, deposition and irrigation); NOM, N from manure; NUP, N uptake by crop; NNH3, N loss from NH3 emission; NL/R, N loss from leaching and runoff; NDN, N loss from denitrification and nitrification (N2, NO and N2O); NSUR, N surplus equals the sum of all N losses to air and water (sum of NNH3, NL/R and NDN).
-
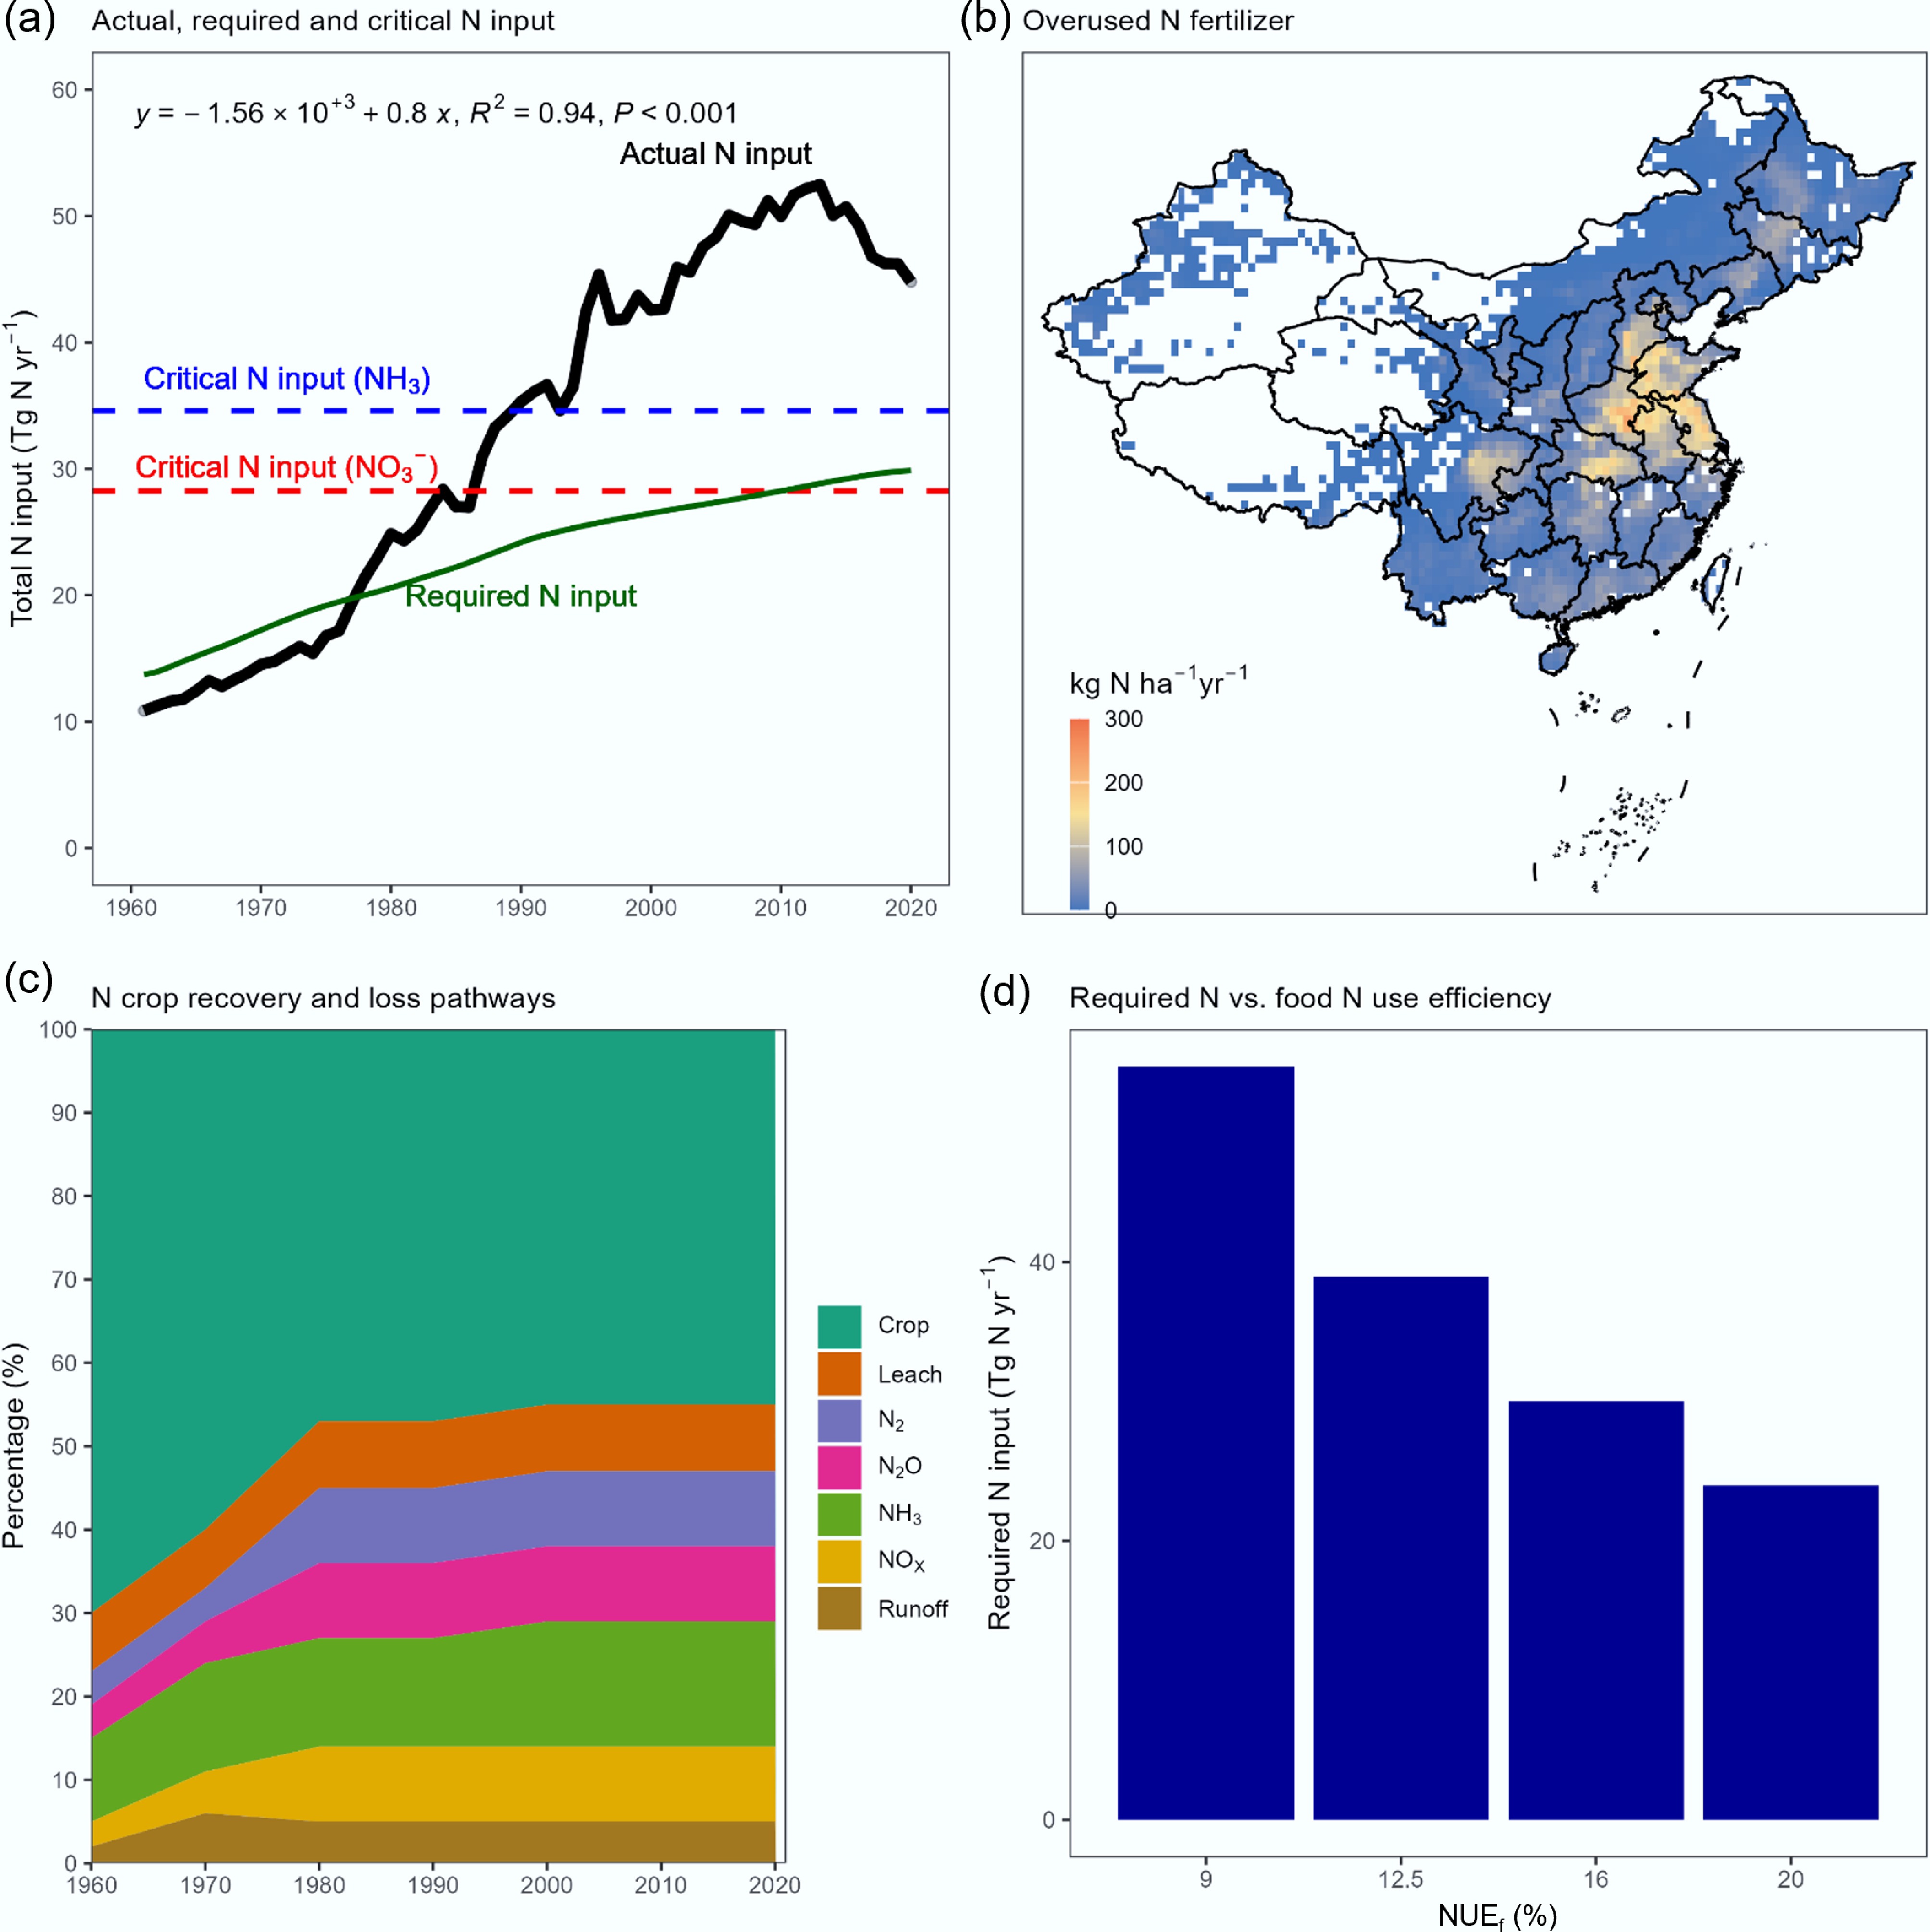
Figure 3.
Actual, required and critical N inputs. (a) Annual changes in actual, required and critical N inputs. The required N input to cropland is calculated based on the human requirement for daily protein intake and N use efficiency in the food chain. (b) The spatial distribution of fertilizer N overuse for 16 major crops in China. (c) The contribution of N output by each pathway in China between 1961 and 2018. (d) Required N inputs under different food N use efficiency levels in China.
-
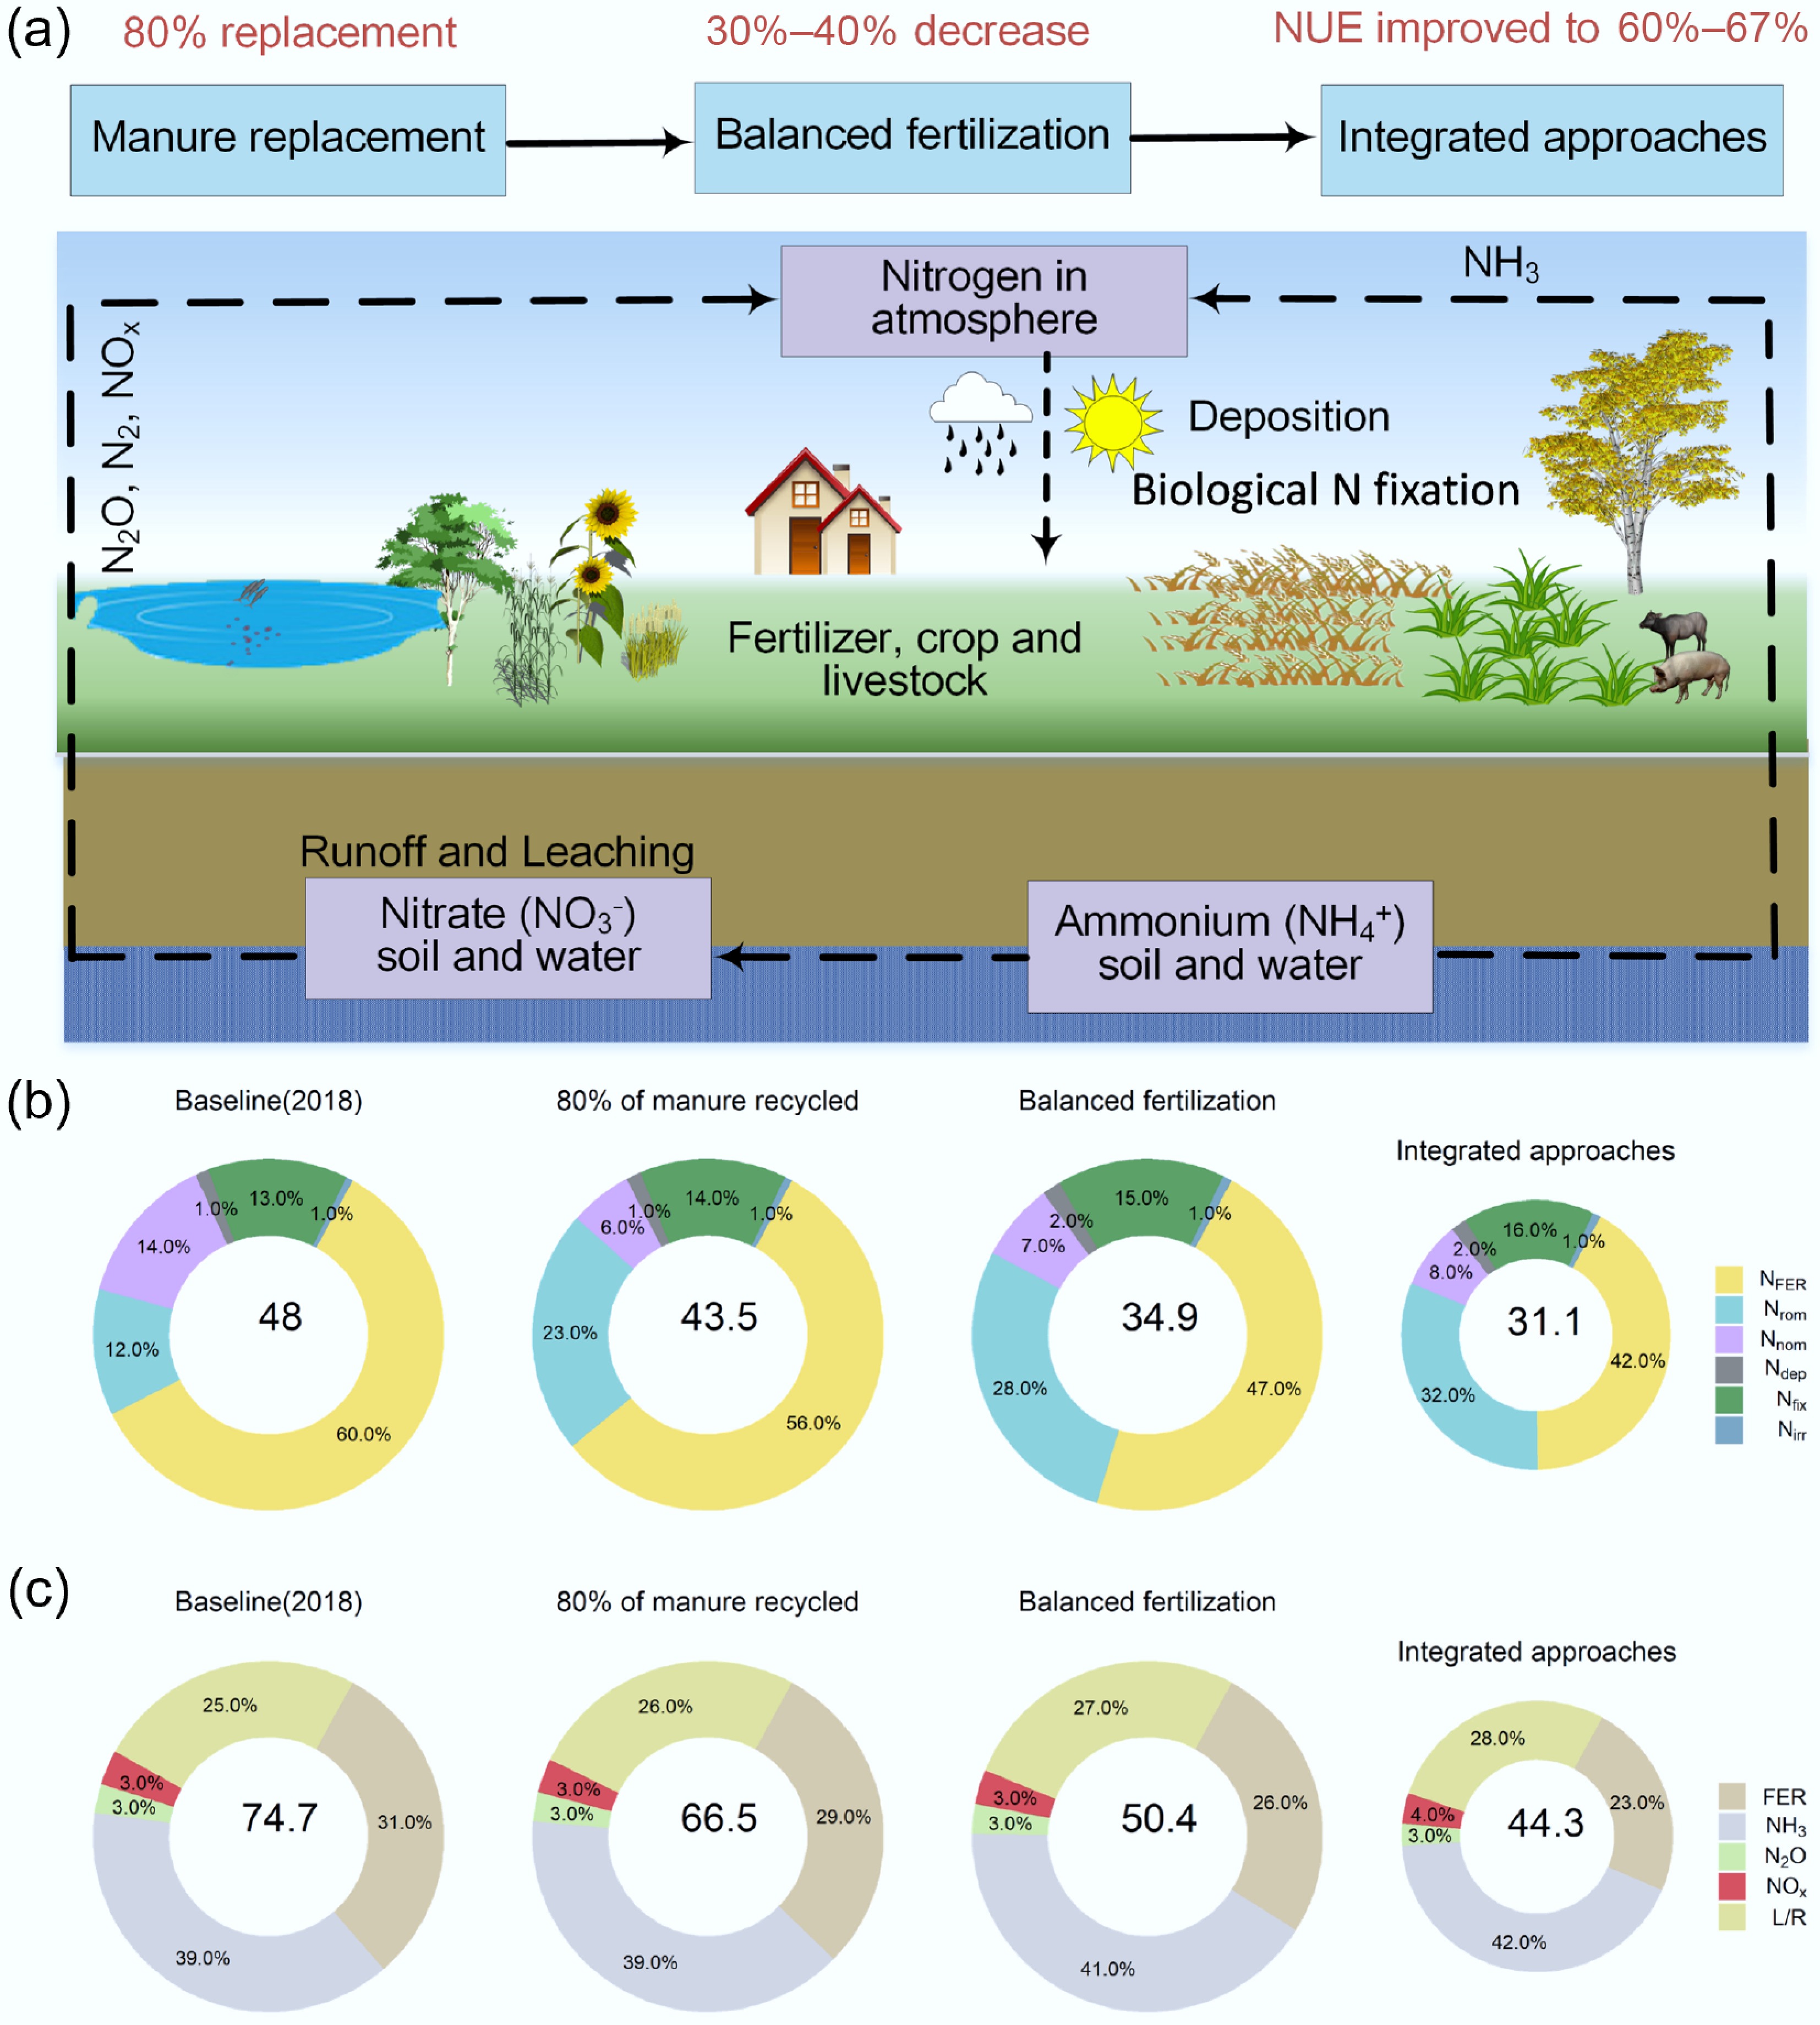
Figure 4.
Reduction of N inputs and associated costs through improved nutrient management practices: (i) 80% of manure recycled; (ii) option (i) + balanced fertilization; (iii) options (i) + (ii) + integrated approaches through soil-crop system management. (a) A scheme of N flows and steps to reduce N fertilizer use and N loss. (b) Reduction in N inputs by improved recycling of manure, plus balanced fertilization (Right amount), plus integrated management (Right time, Right place and Right product with soil-crop management). (c) Cost-benefit analysis induced by N fertilizer saving and by lower Nr losses to water and air. Notes: (1) NFER, NROM, NNOM, NDEP, NFIX, and NIRR in sub-chart B denote fertilizer N, recycled manure, non-recycled manure, N deposition, biological N fixation, and N from irrigation, respectively; (2) FER, NH3, N2O, NOx and L/R in sub-chart C denote direct and indirect costs induced by fertilizer N use, and by NH3, N2O, NOx, and N leaching/runoff losses, respectively.
Figures
(4)
Tables
(0)