-
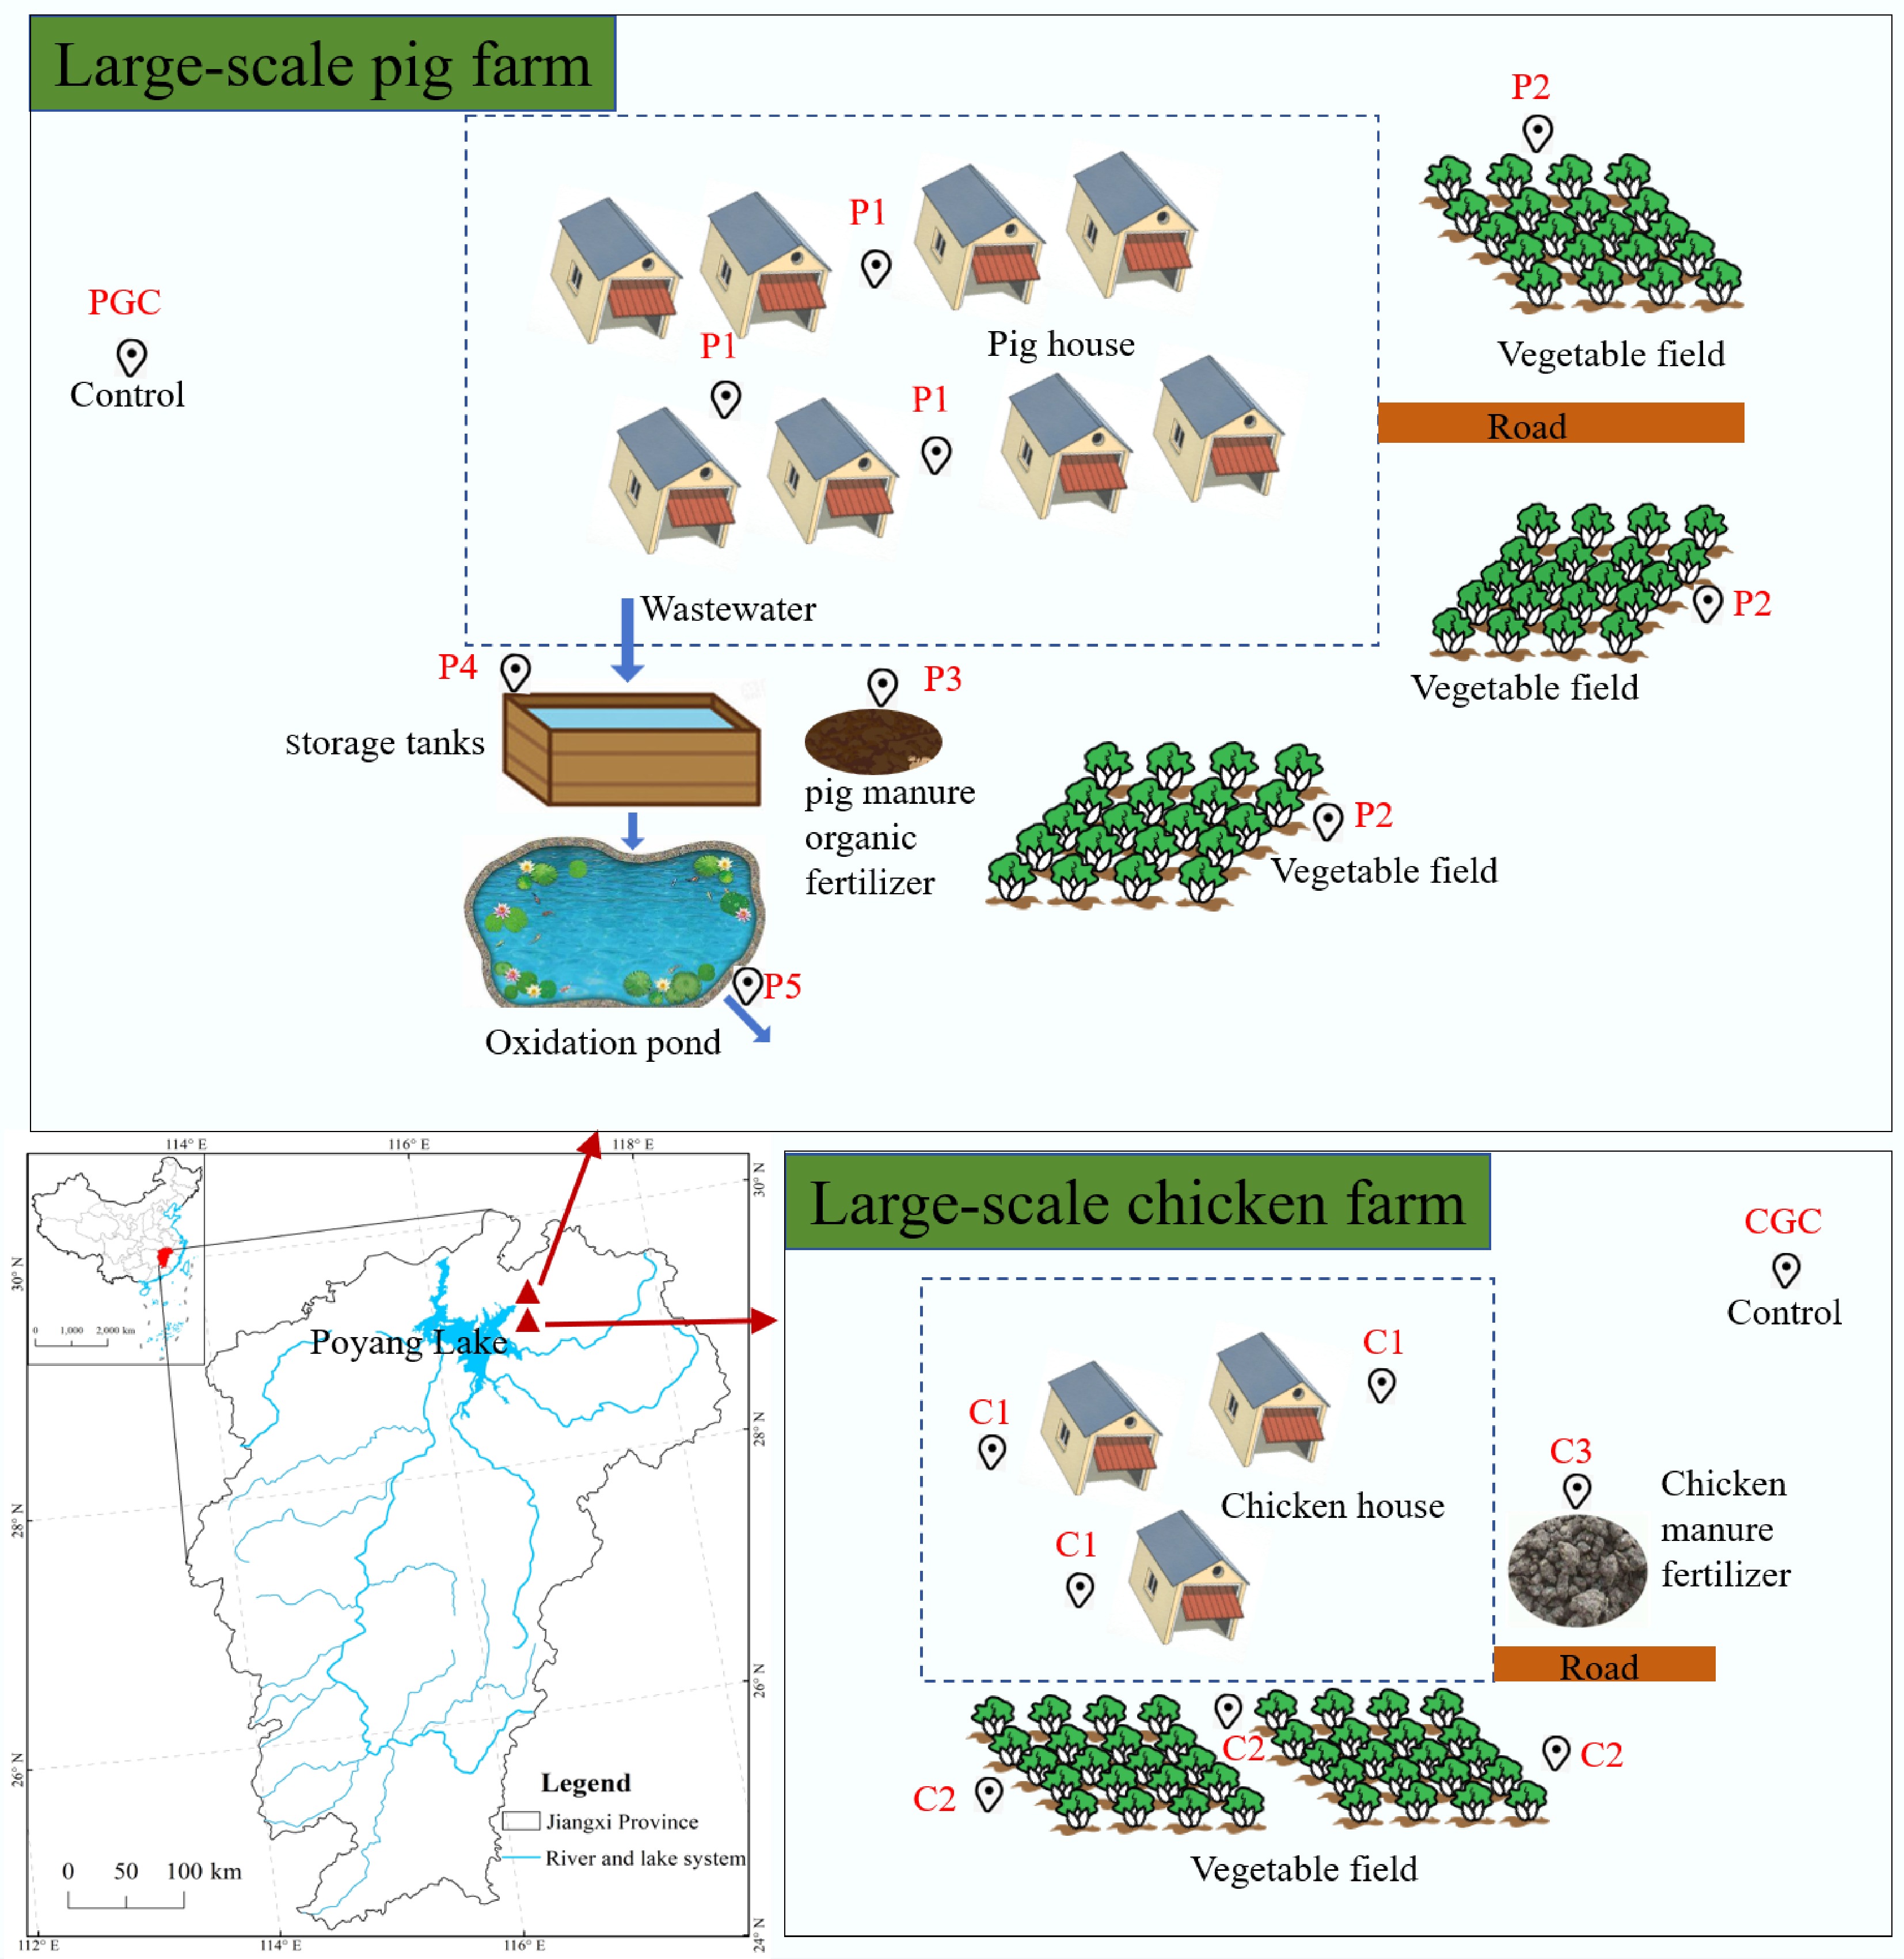
Figure 1.
Schematic diagram of the sampling site next to Poyang Lake. PGC, P1, P2, and P3 are soil samples from the pig farm control, pig house, vegetable field, and pig manure organic fertilizer, respectively; P4 and P5 are water samples from the pig farm storage tank influent and oxidation pond effluent. CGC, C1, C2, and C3 are soil samples from chicken farm control, chicken house, vegetable field, and chicken manure fertilizer, respectively.
-
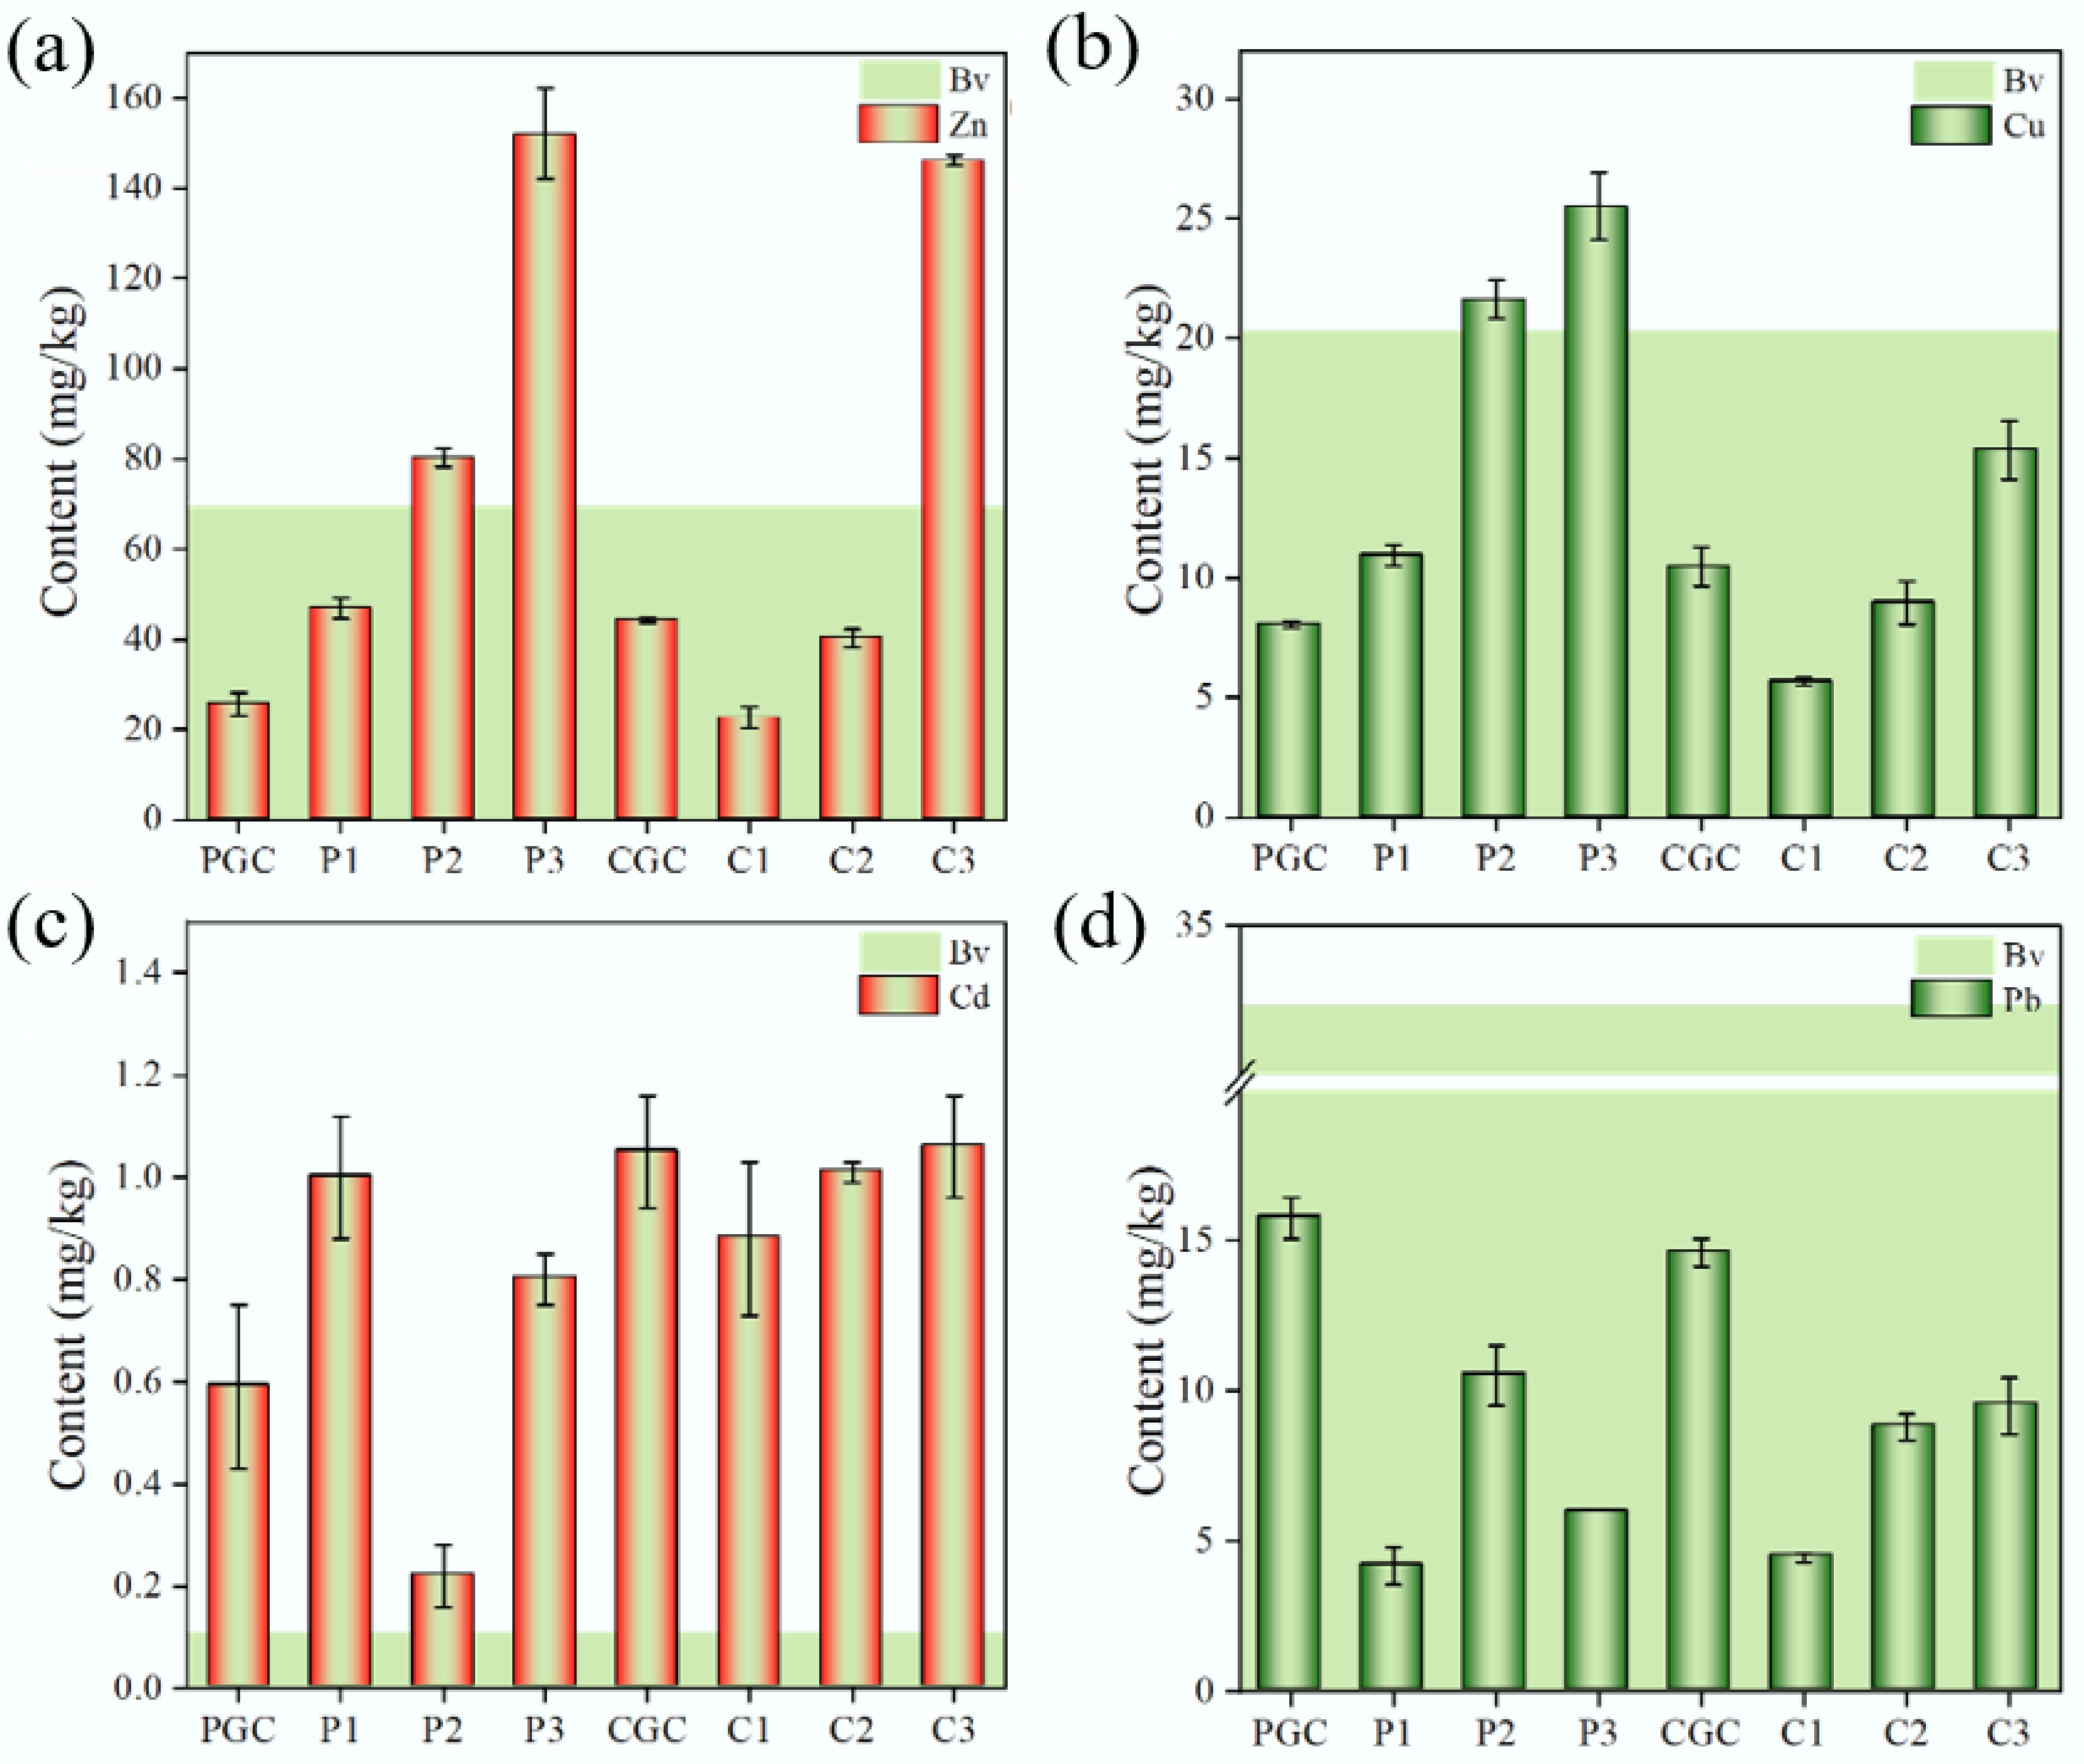
Figure 2.
Concentrations of heavy metals in different soil samples. Light green (Bv) indicates the soil's backgroundvalues.
-
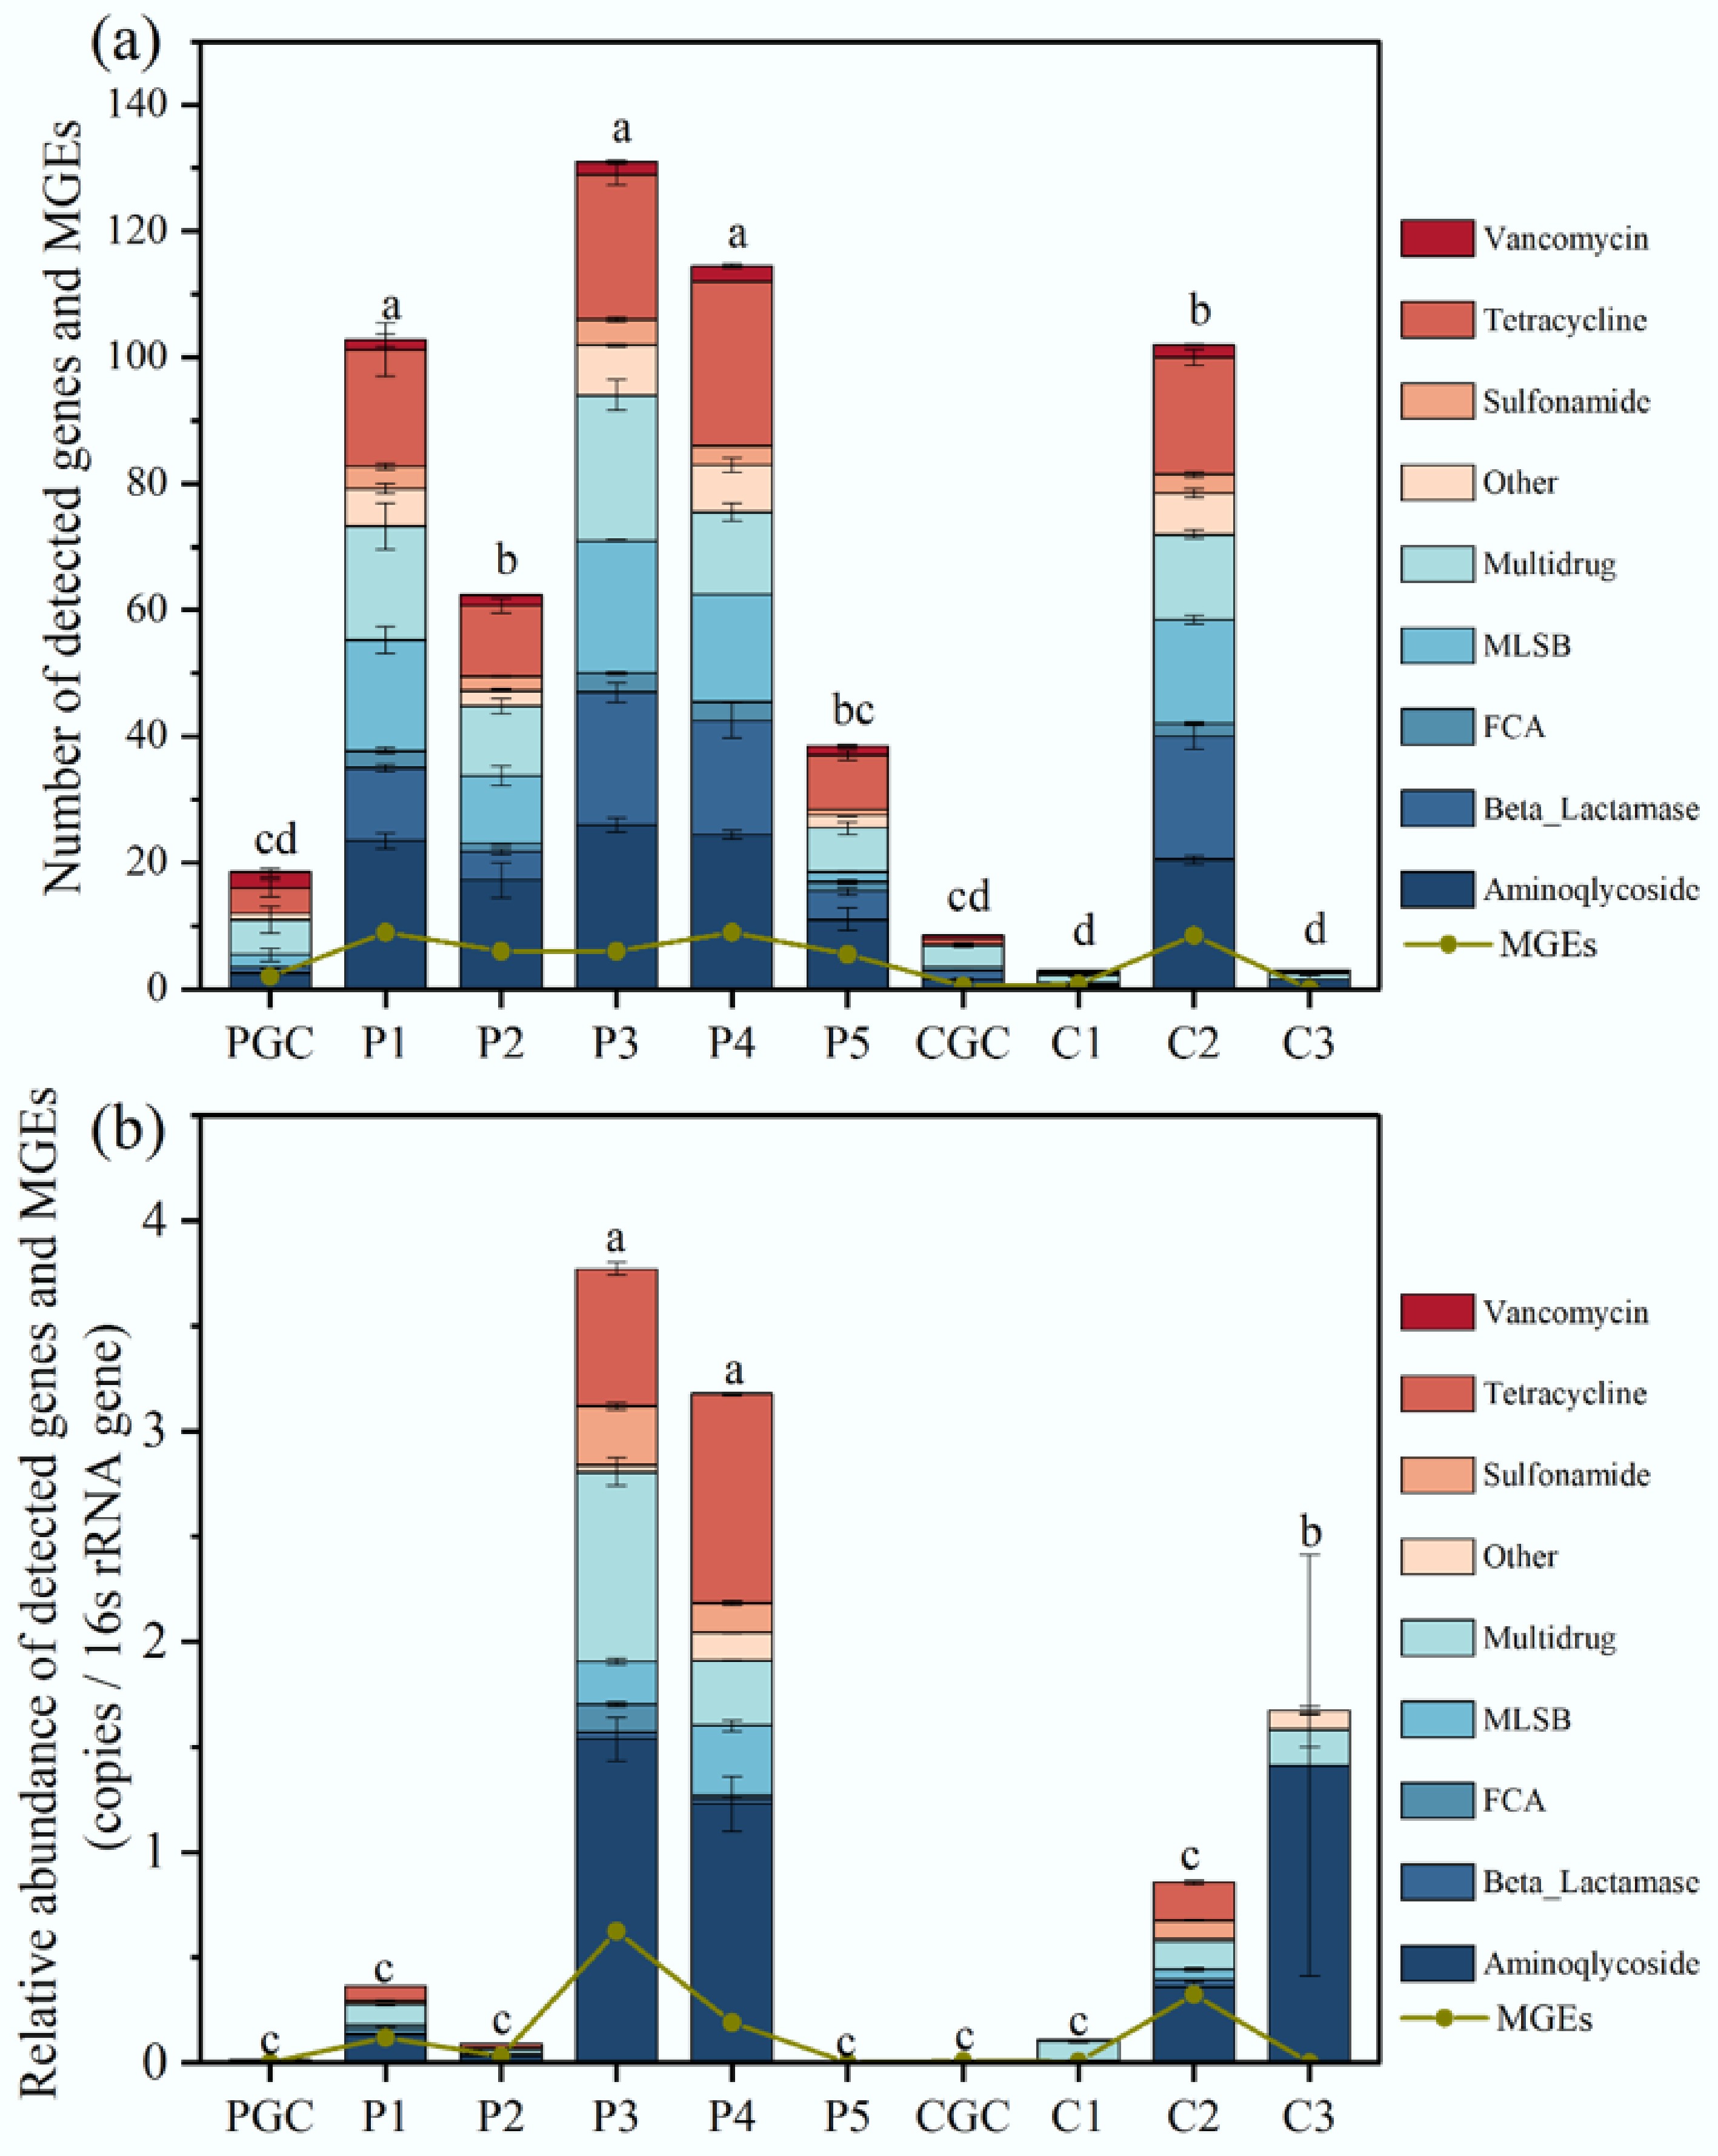
Figure 3.
(a) Number of ARGs and MGEs detected in each sample. (b) Relative abundance of ARGs and MGEs detected in each sample. ANOVA was performed for each sample. Tukey's test was performed for two different samples. Different letters indicate significant differences at p < 0.05.
-
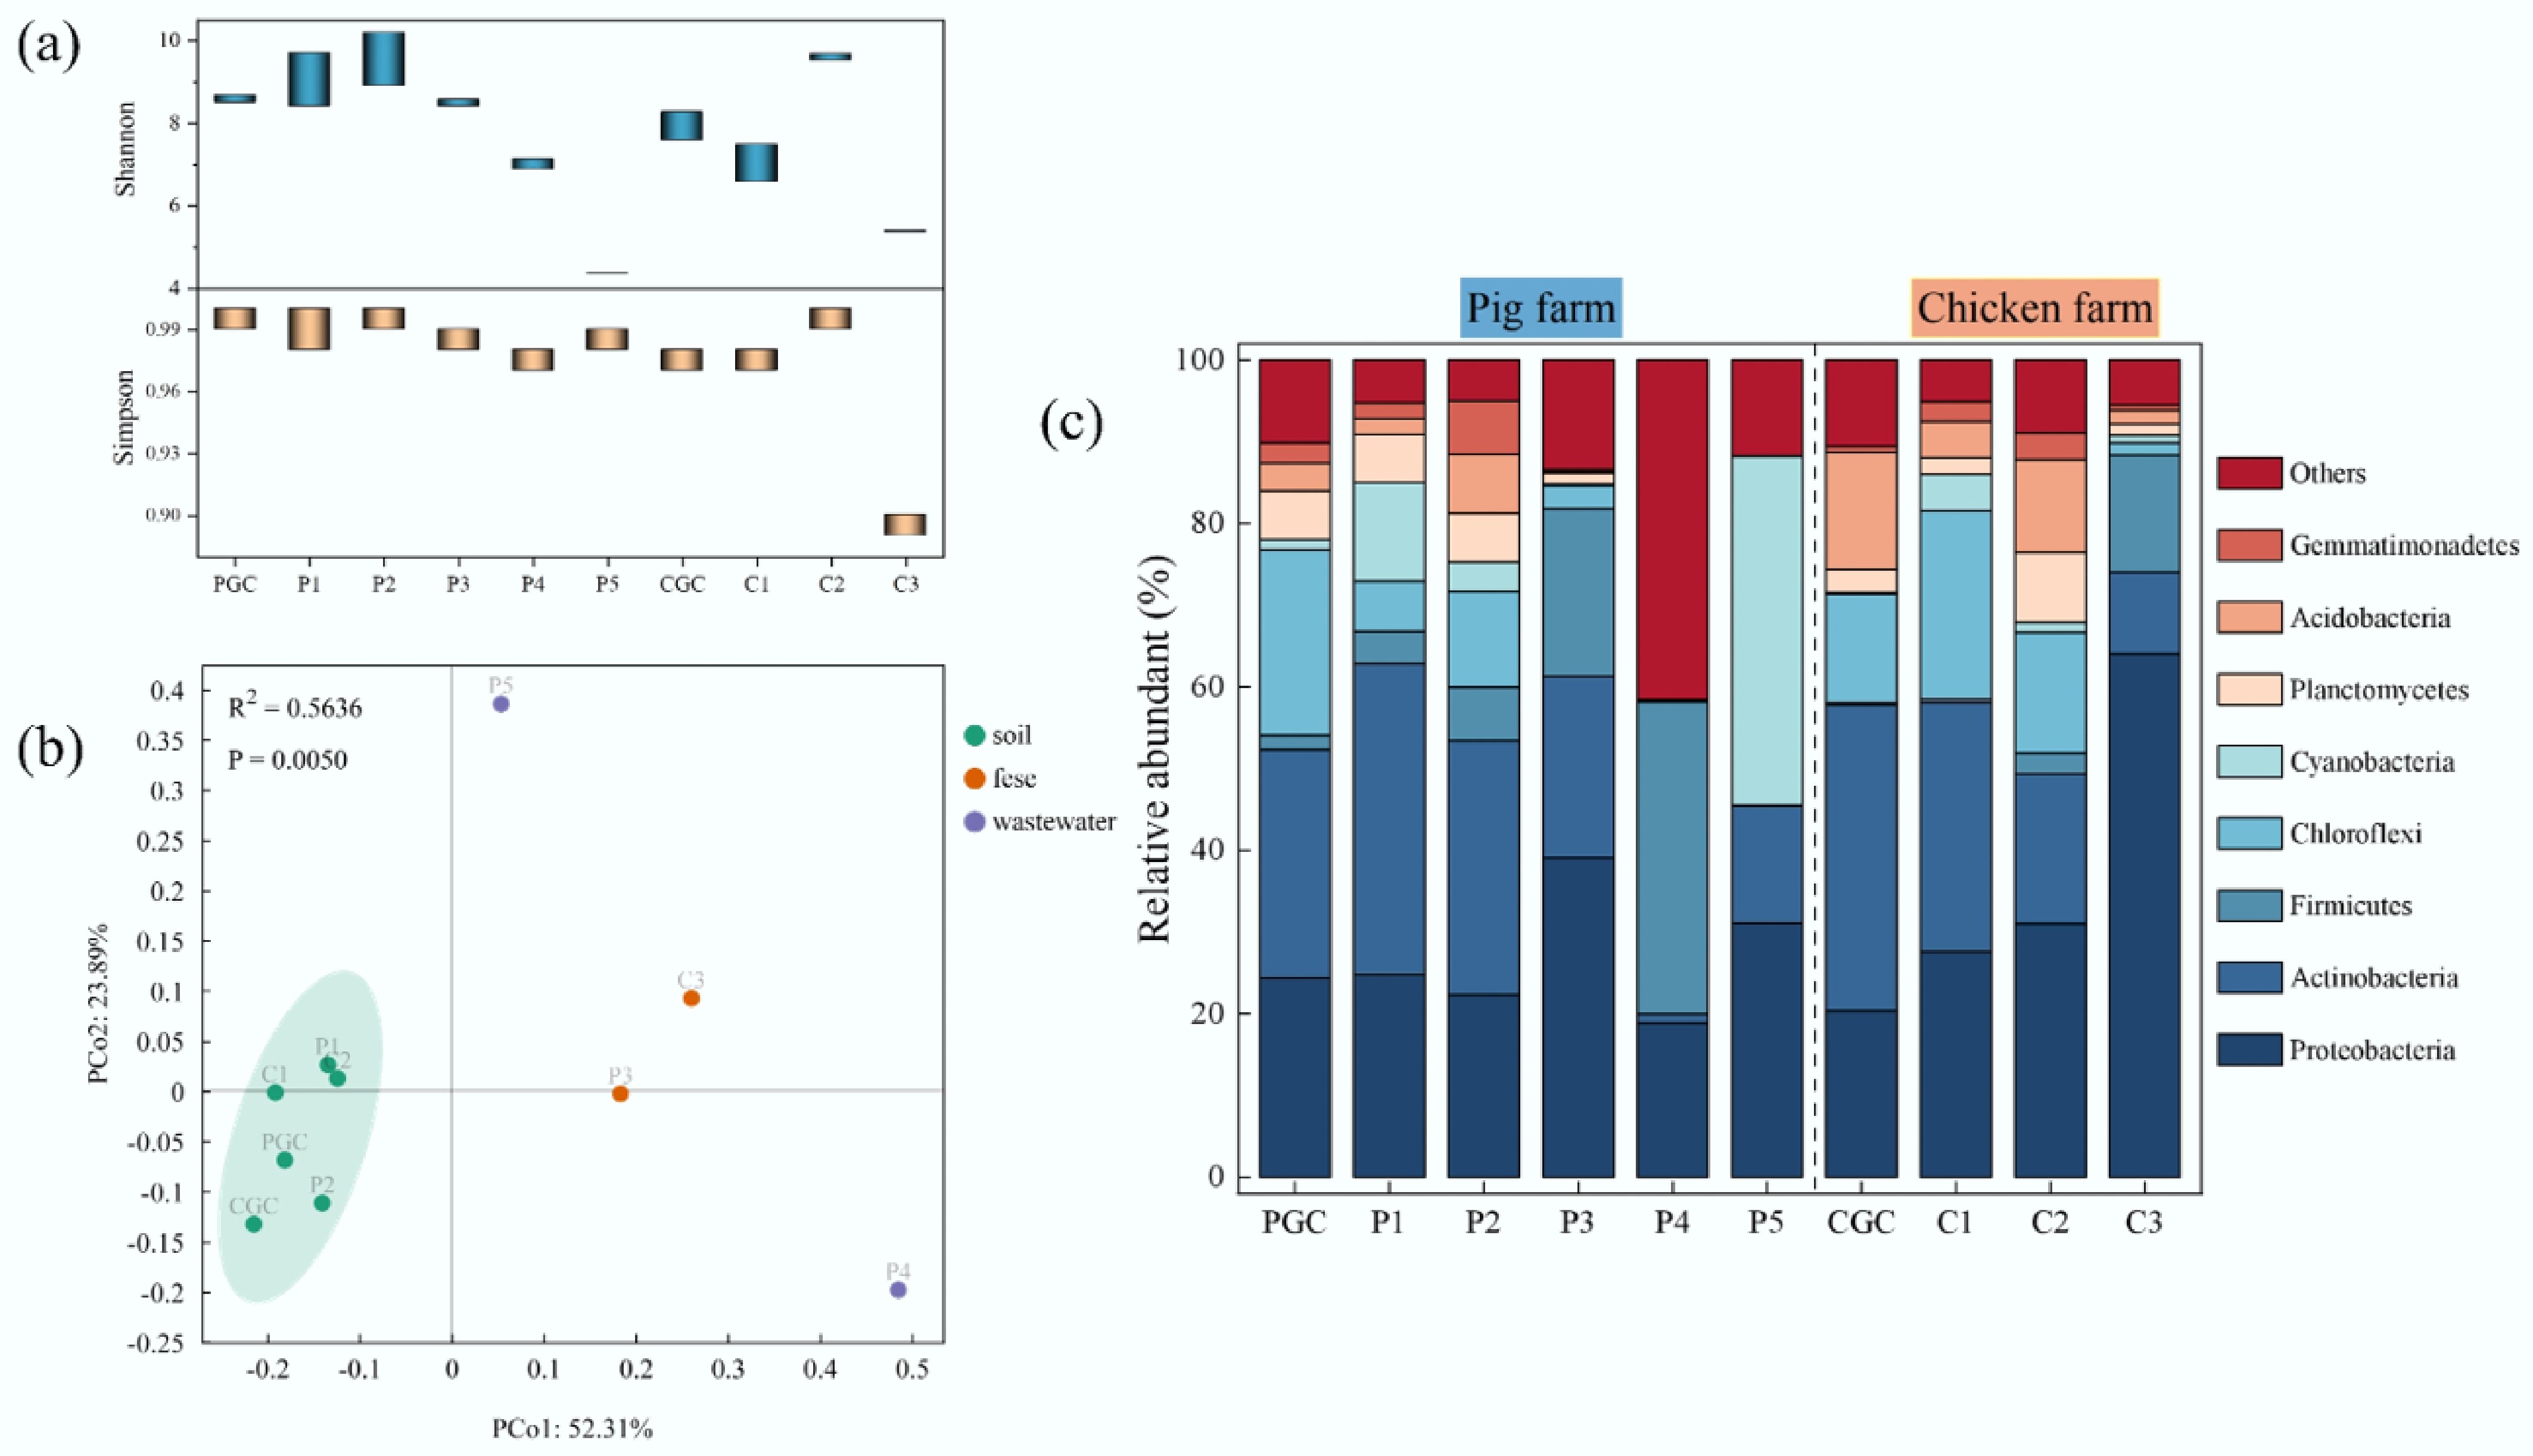
Figure 4.
Microbial communities in samples from the pig farm and the chicken farm. (a) Shannon and Simpson indices; the bar represents the range of values. (b) PCA based on Bray–Curtis distance used to assess beta diversity. (c) Percentage of bacterial community abundance at the phylum level.
-
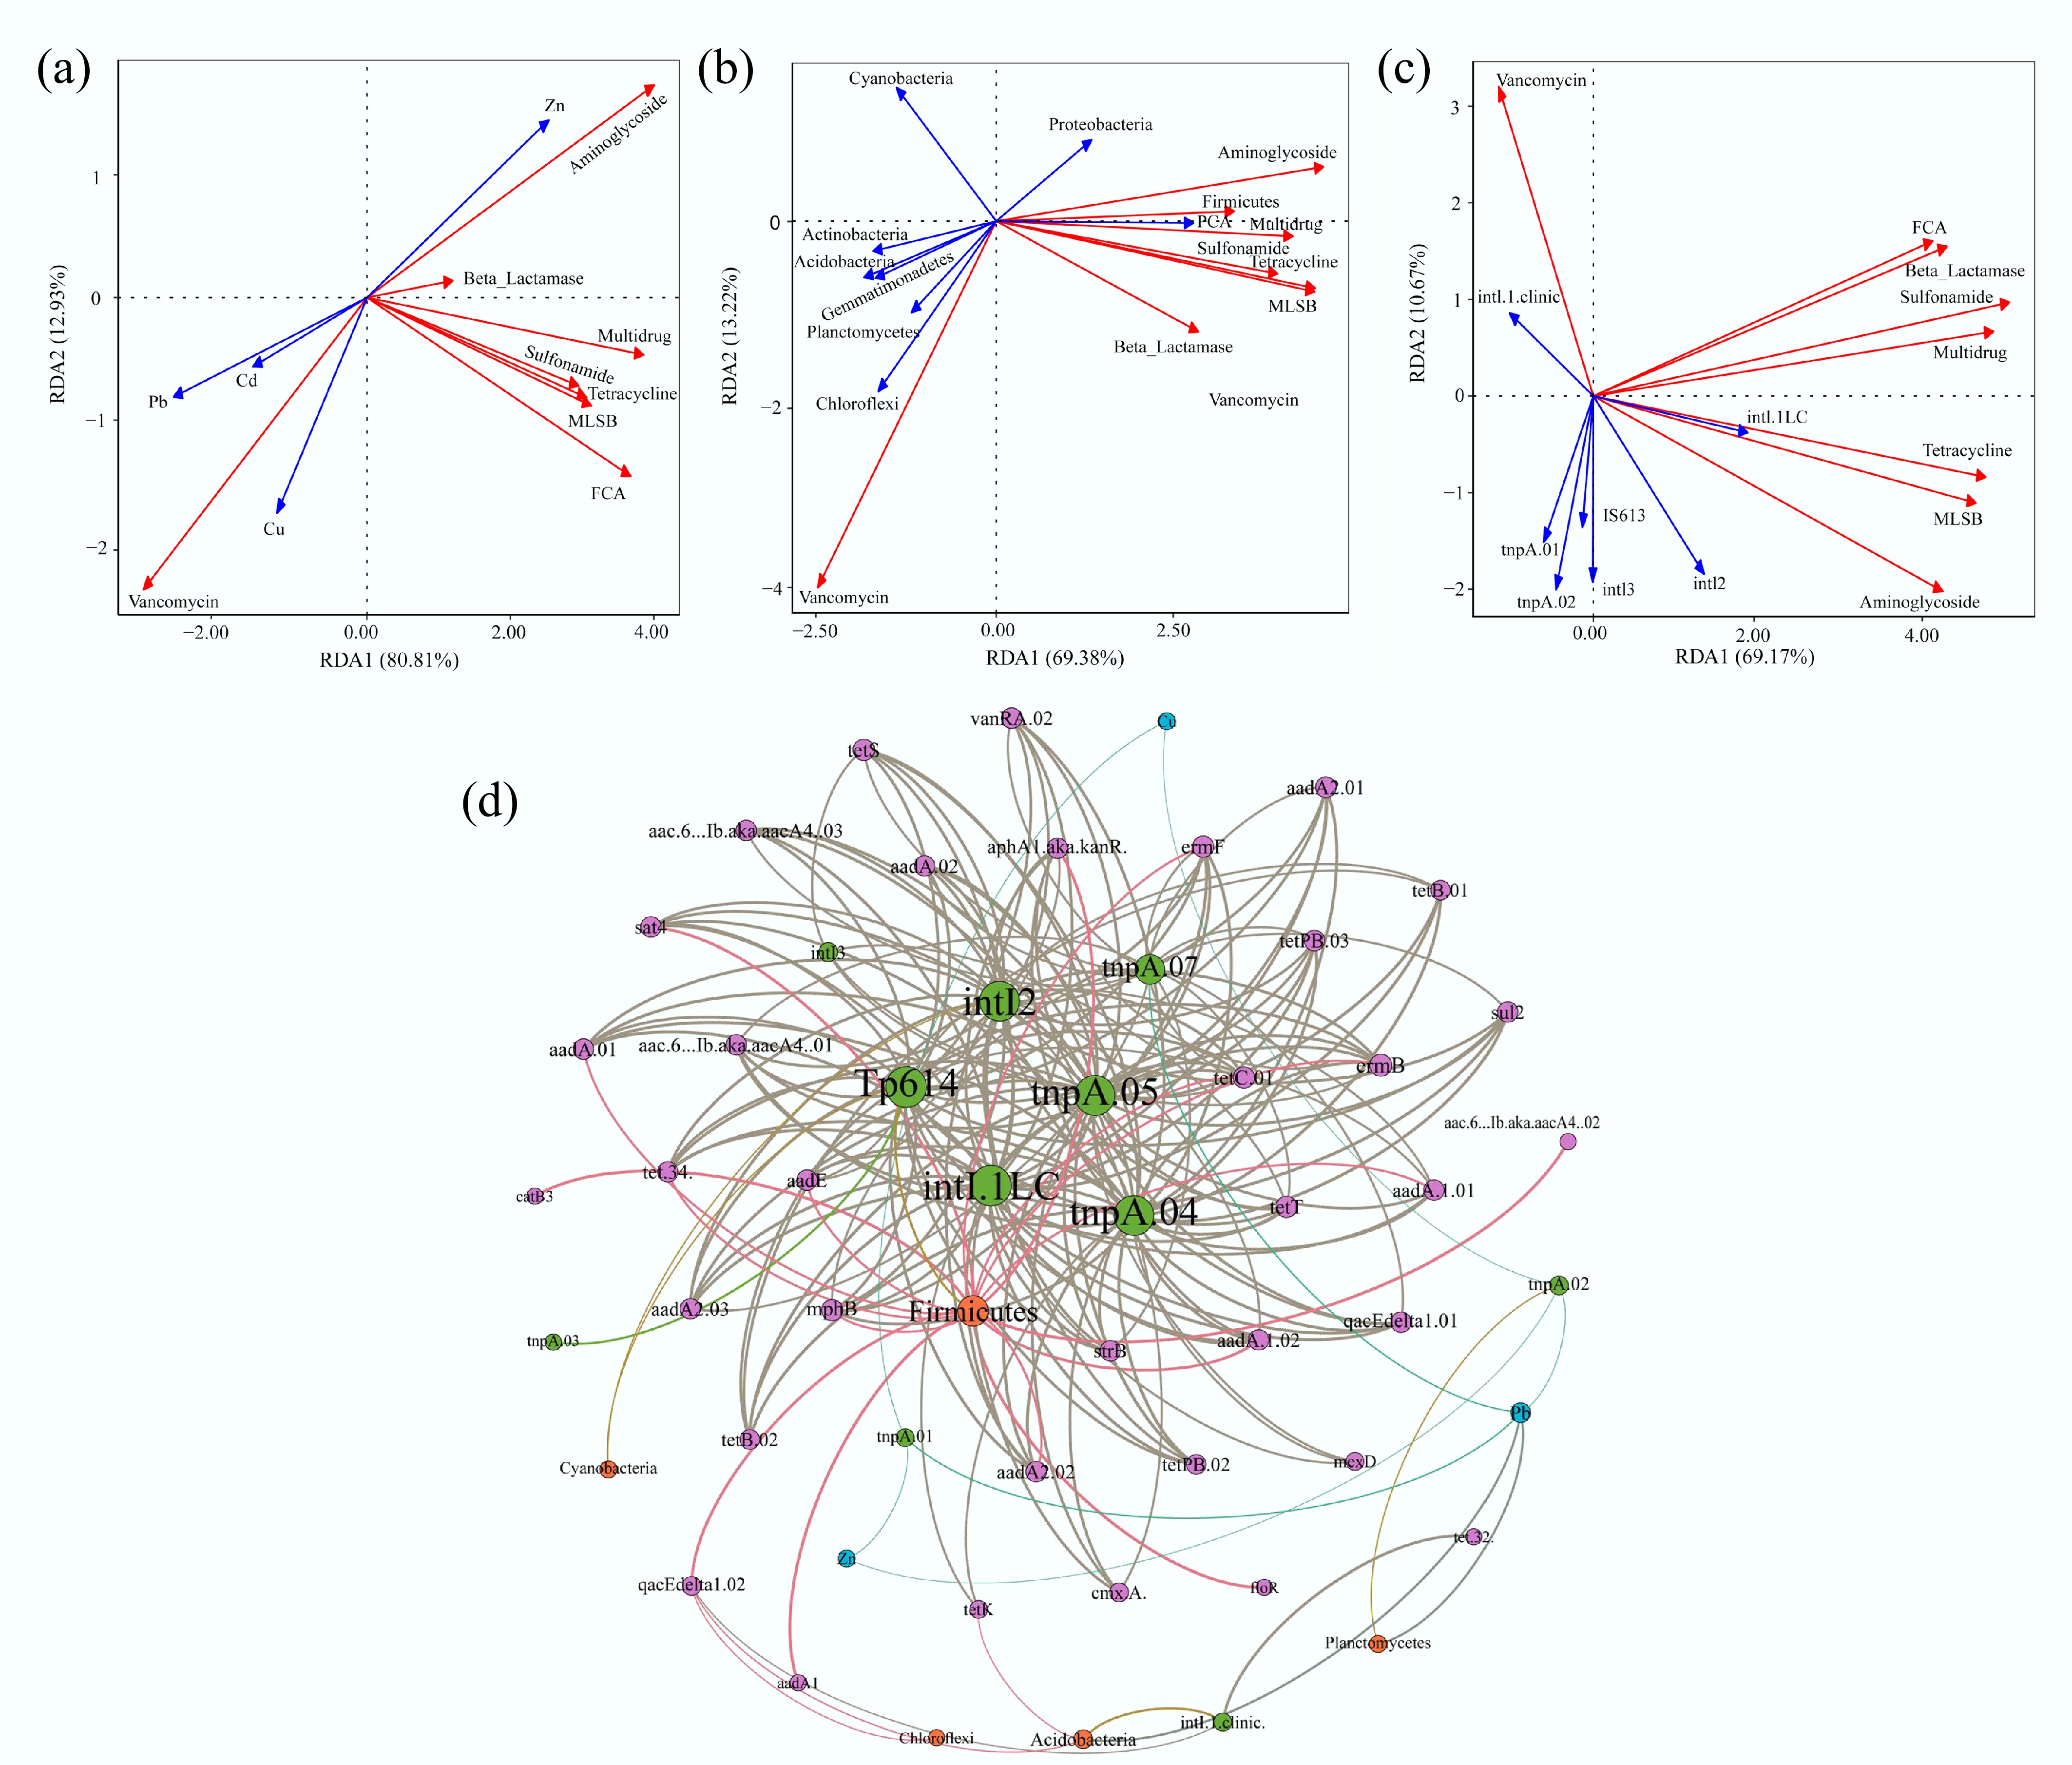
Figure 5.
RDA and network analysis of the correlations among the samples collected from the selected farms. (a) Heavy metals vs. ARGs. (b) Bacterial phyla vs. ARGs. (c) MGEs vs. ARGs. The red arrows represent different types of ARGs. The blue arrows represent the factors that influence ARGs. (d) Network analysis reveals patterns of co-occurrence of ARGs, MGEs, heavy metals, and bacteria at the phylum level. Nodes and edges are colored according to the ARG classification. Node size is proportional to the number of connections, and edges are weighted according to the correlation coefficient. Connections showed strong (Spearman correlation coefficient > 0.7) and significant (p < 0.01) correlations.
-
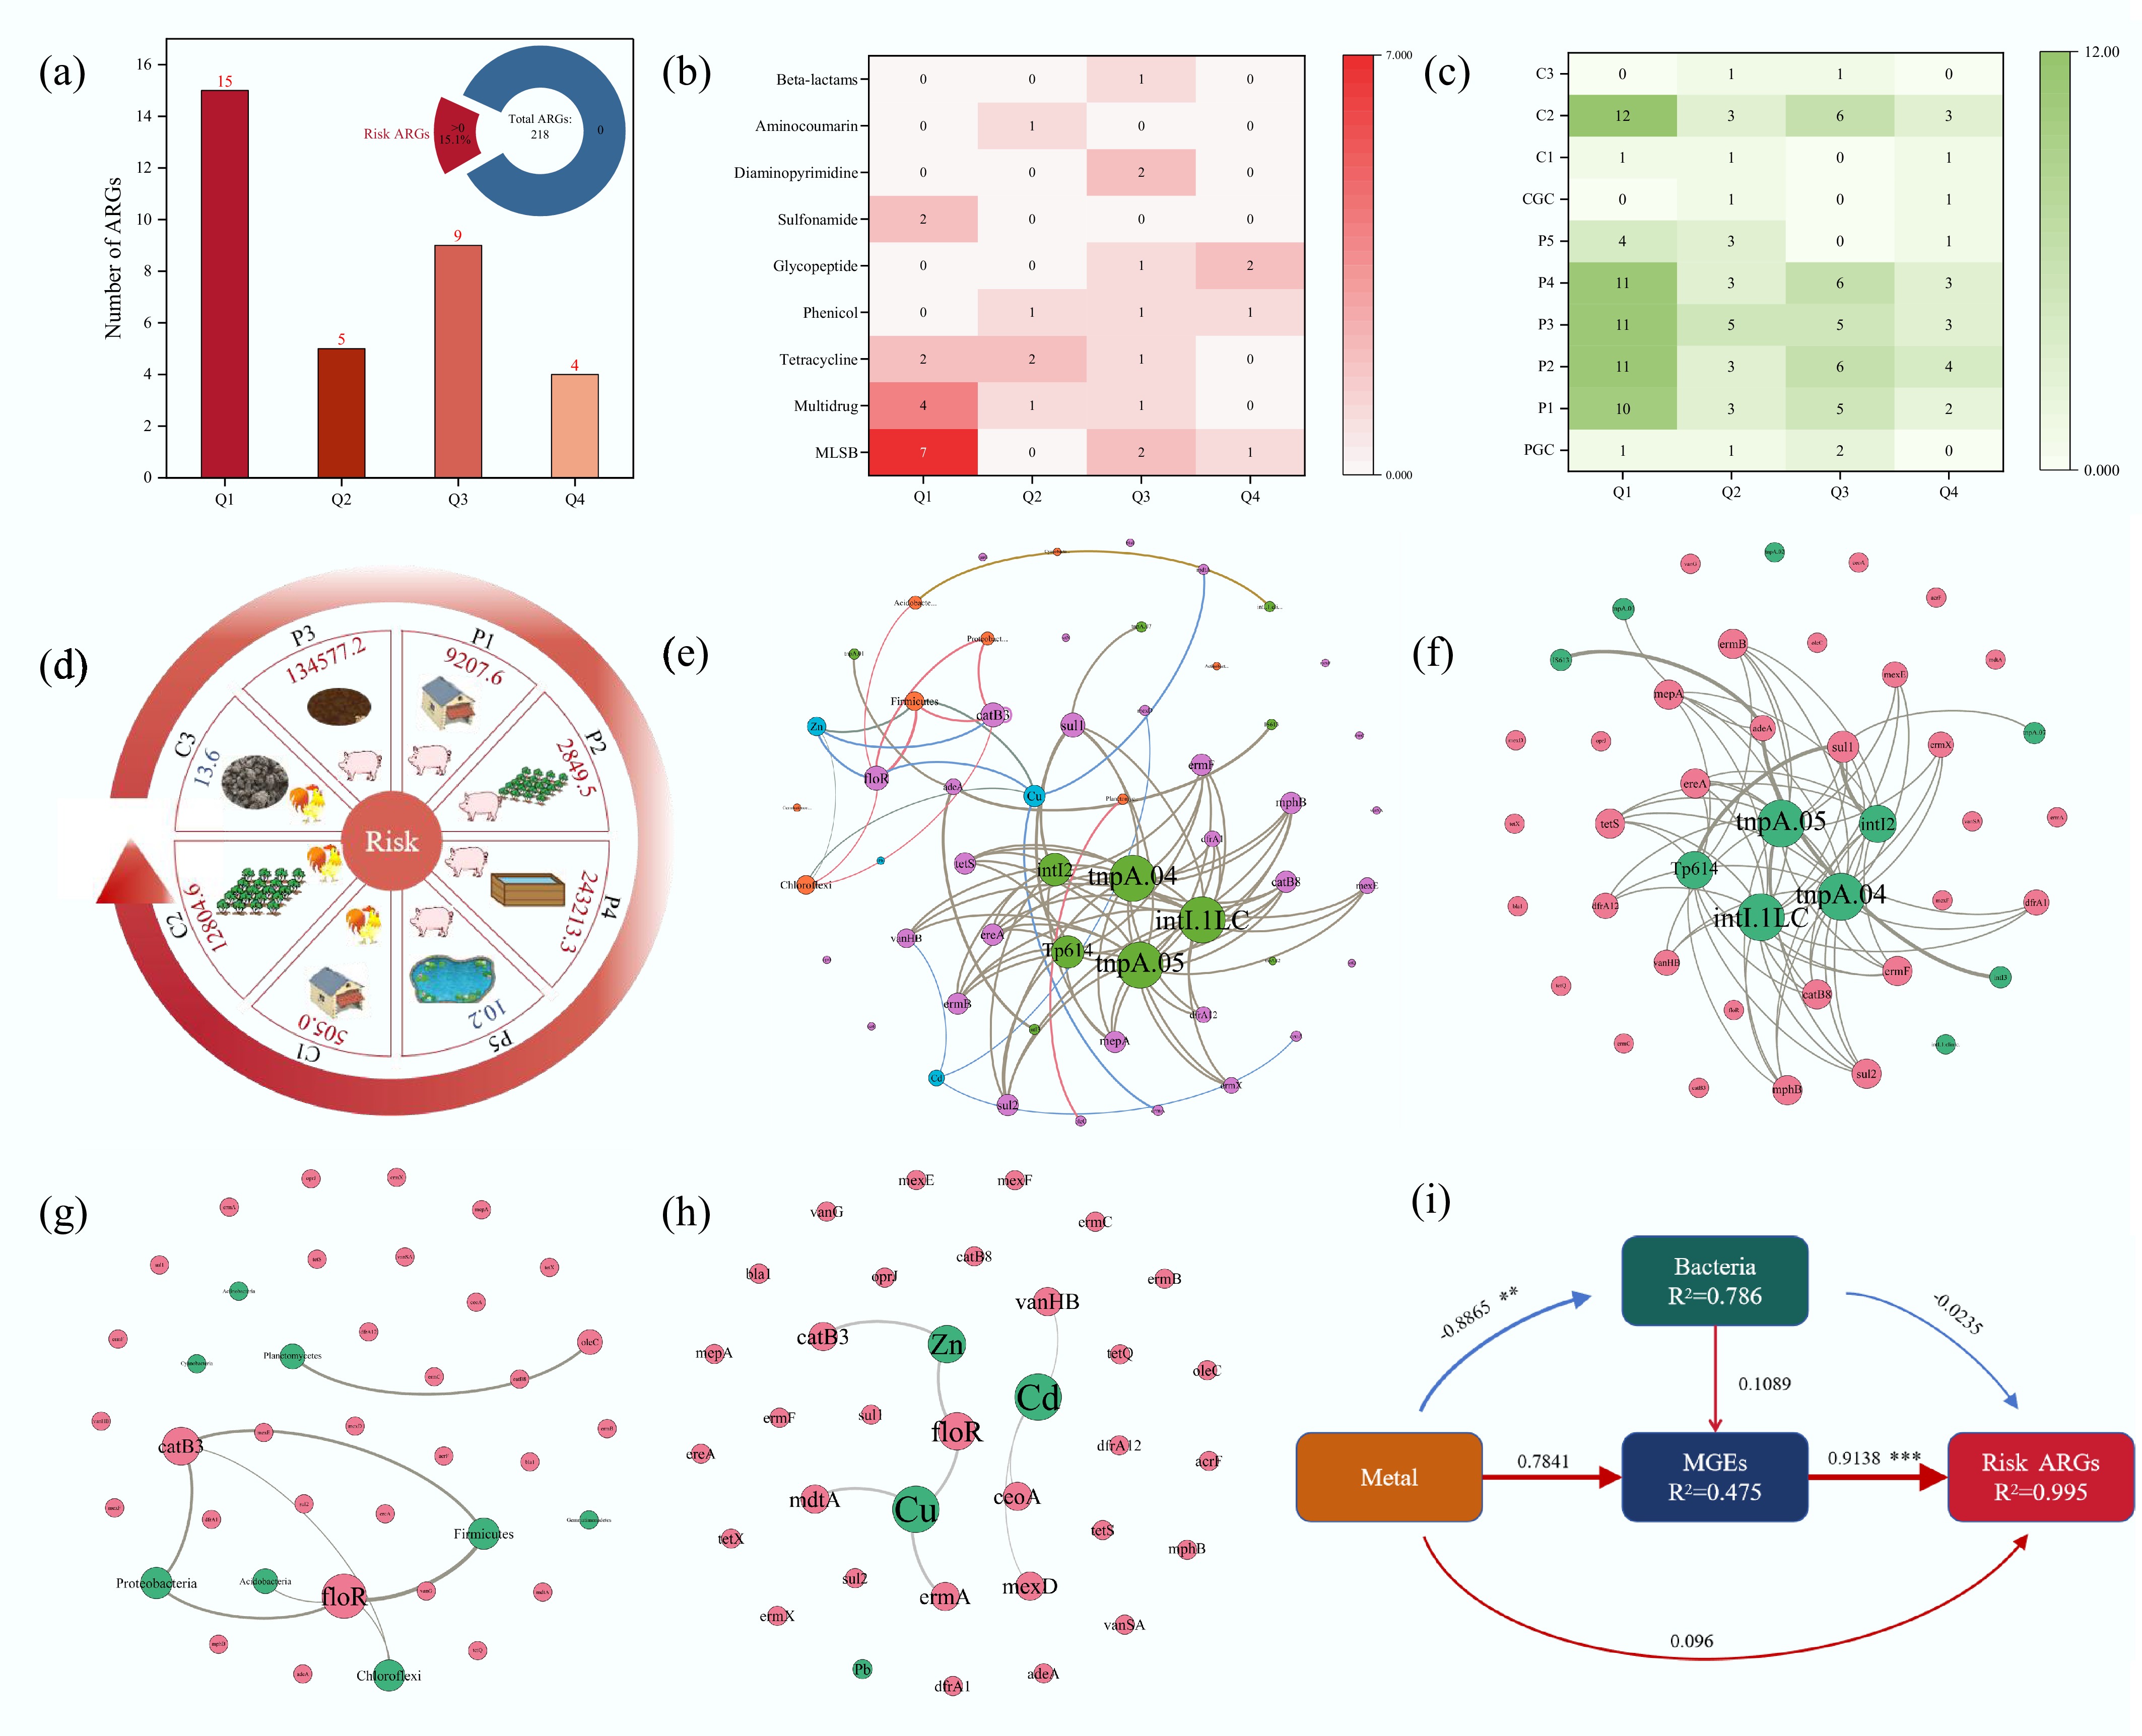
Figure 6.
Risky ARGs in the samples and their influencing factors. (a) Detection rate of risky ARGs and the number of detected risky ARGs by risk ranking. (b) Different categories of risky ARGs. (c) Detection of risky ARGs in different samples. (d) Risk values for each sample. (e) Network analysis revealing patterns of co-occurrence of risky ARGs, MGEs, heavy metals, and bacteria at the phylum level. Correlation network diagram of (f) MGEs, (g) bacteria, and (h) heavy metals with risky ARGs. Nodes and edges are colored according to the ARGs' classification. Node size is proportional to the number of connections, and edges are weighted according to the correlation coefficient. Connections showed strong (Spearman correlation coefficient > 0.7) and significant (p < 0.01) correlations. (i) Influences on the risk level of ARGs were analyzed using PLSPM (**, p < 0.01, ***, p < 0.001).
Figures
(6)
Tables
(0)