-
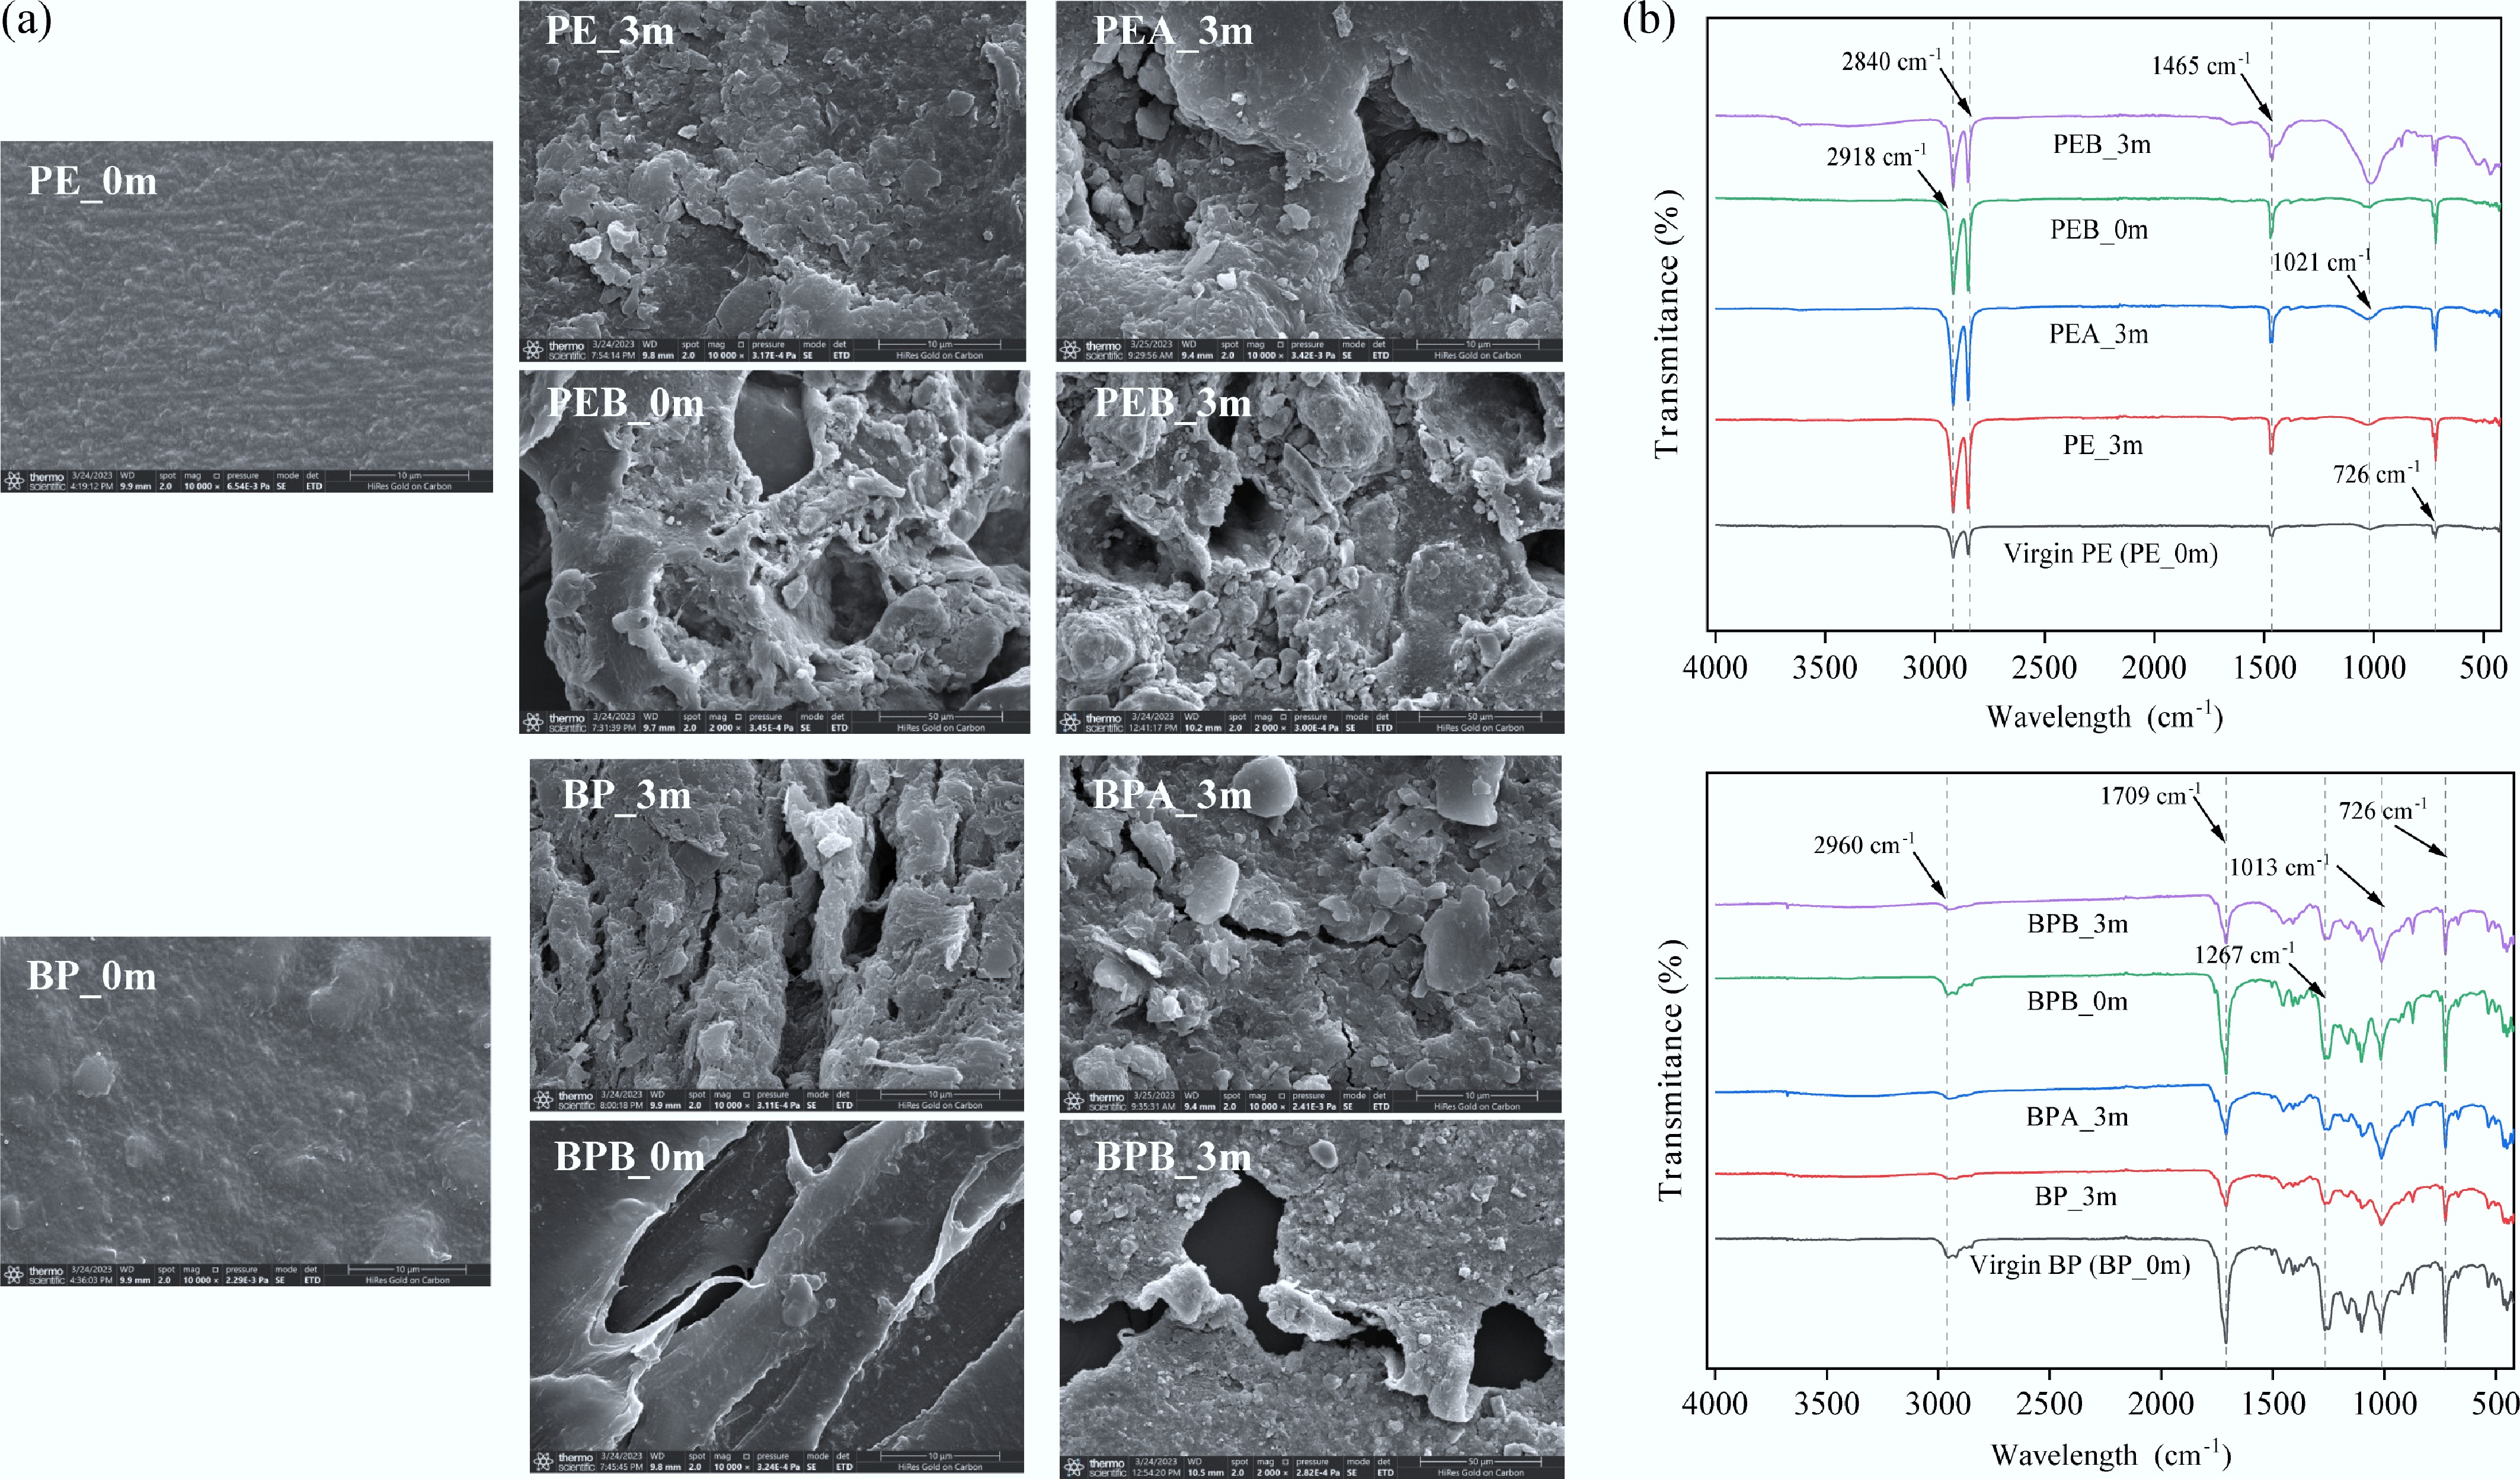
Figure 1.
Characterization of PMFs. (a) Scanning electron microscope (SEM) images, and (b) Fourier transform infrared spectra (FTIR) of PMF (PE and BP) under different treatments.
-
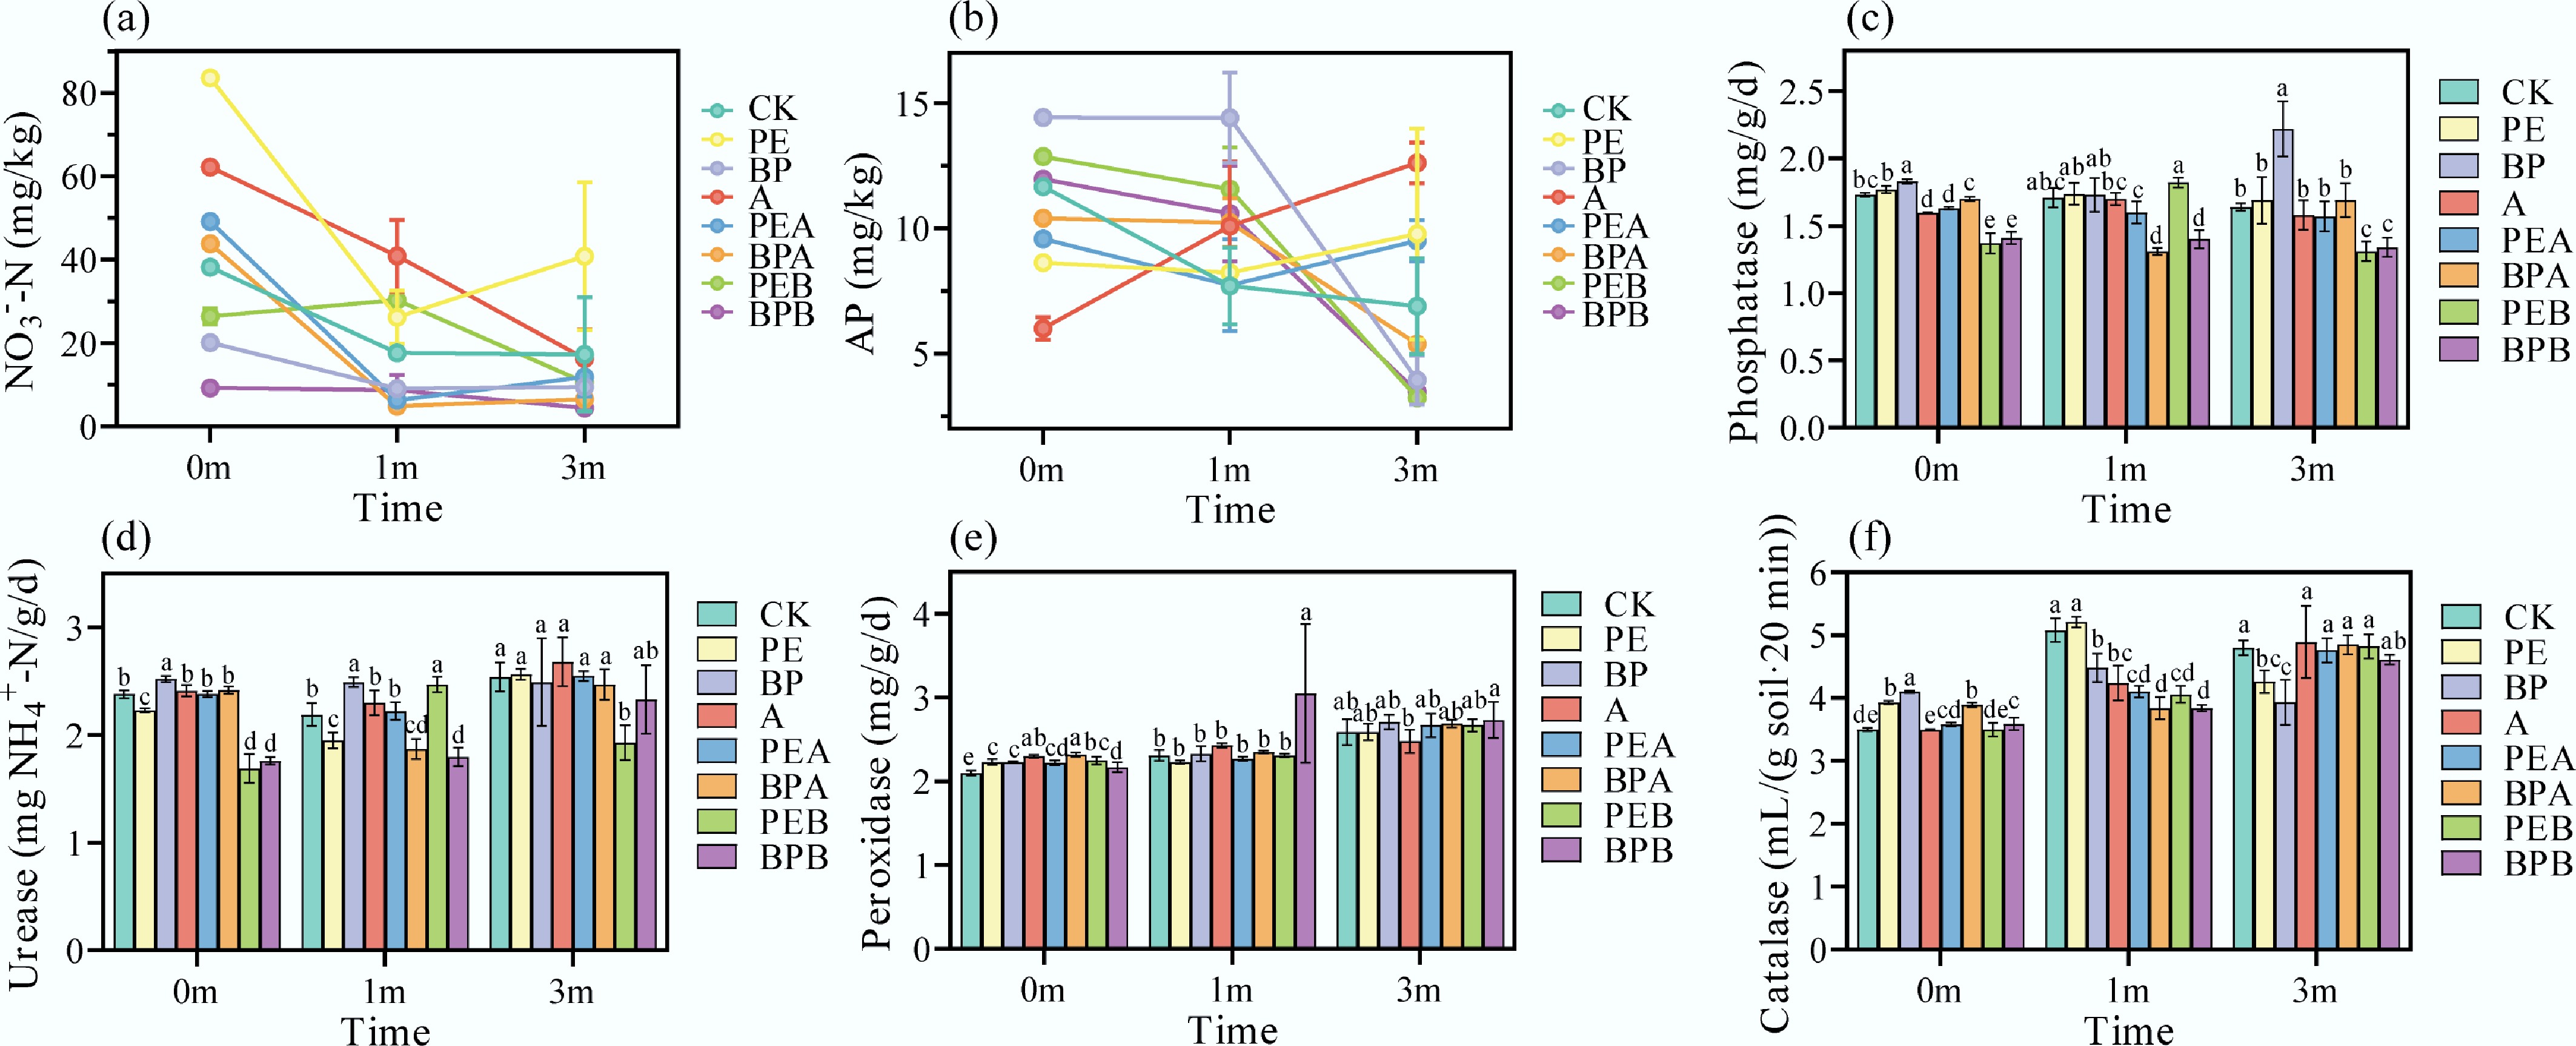
Figure 2.
(a), (b) Soil physical-chemical properties, and (c)–(f) enzymatic activities under different treatments at the beginning of the experiment (0m), and after incubation for 1 month (1m), and 3 months (3m). The error bar represents the standard deviation (n = 3). Lowercase letters indicate significant differences between treatments.
-
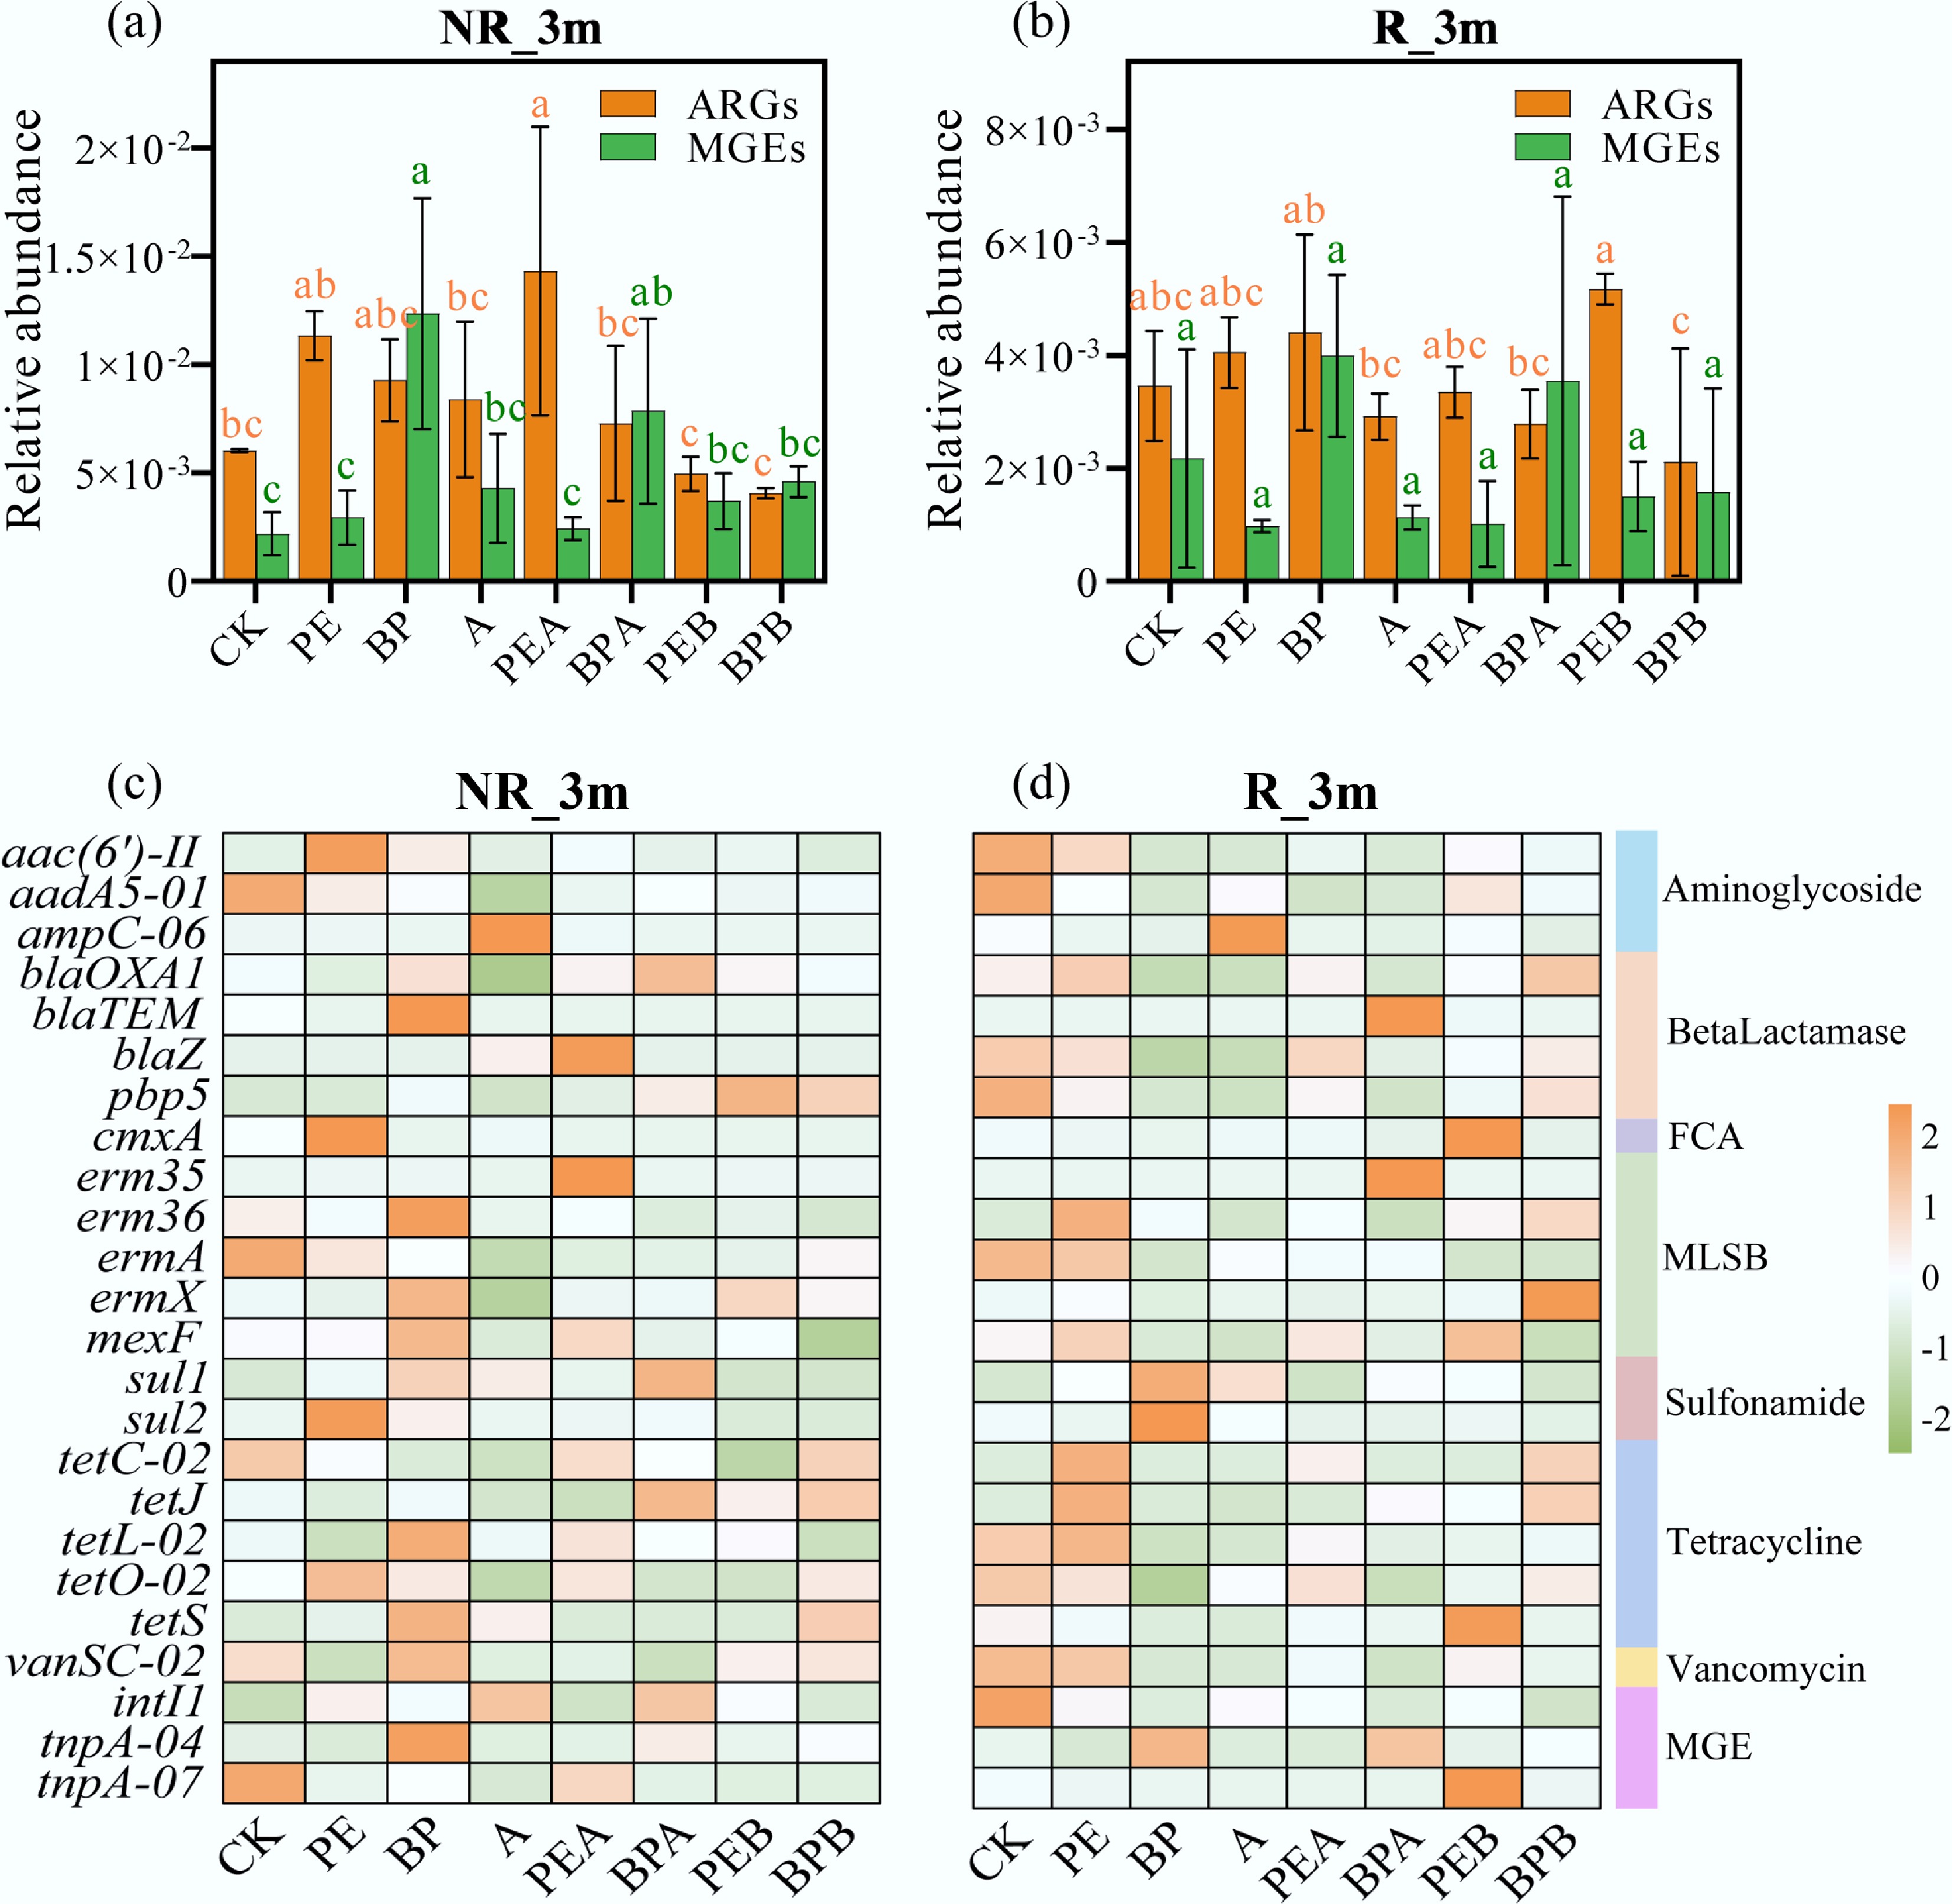
Figure 3.
Relative abundance of antibiotic resistance genes (ARGs) and mobile genetic elements (MGEs) in (a) and (c) non-rhizosphere soil (NR_3m), and (b) and (d) rhizosphere soil (R_3m) under different treatments after incubation for three months. Error bars represent standard deviations (n = 3). Lowercase letters indicate significant differences between treatments.
-
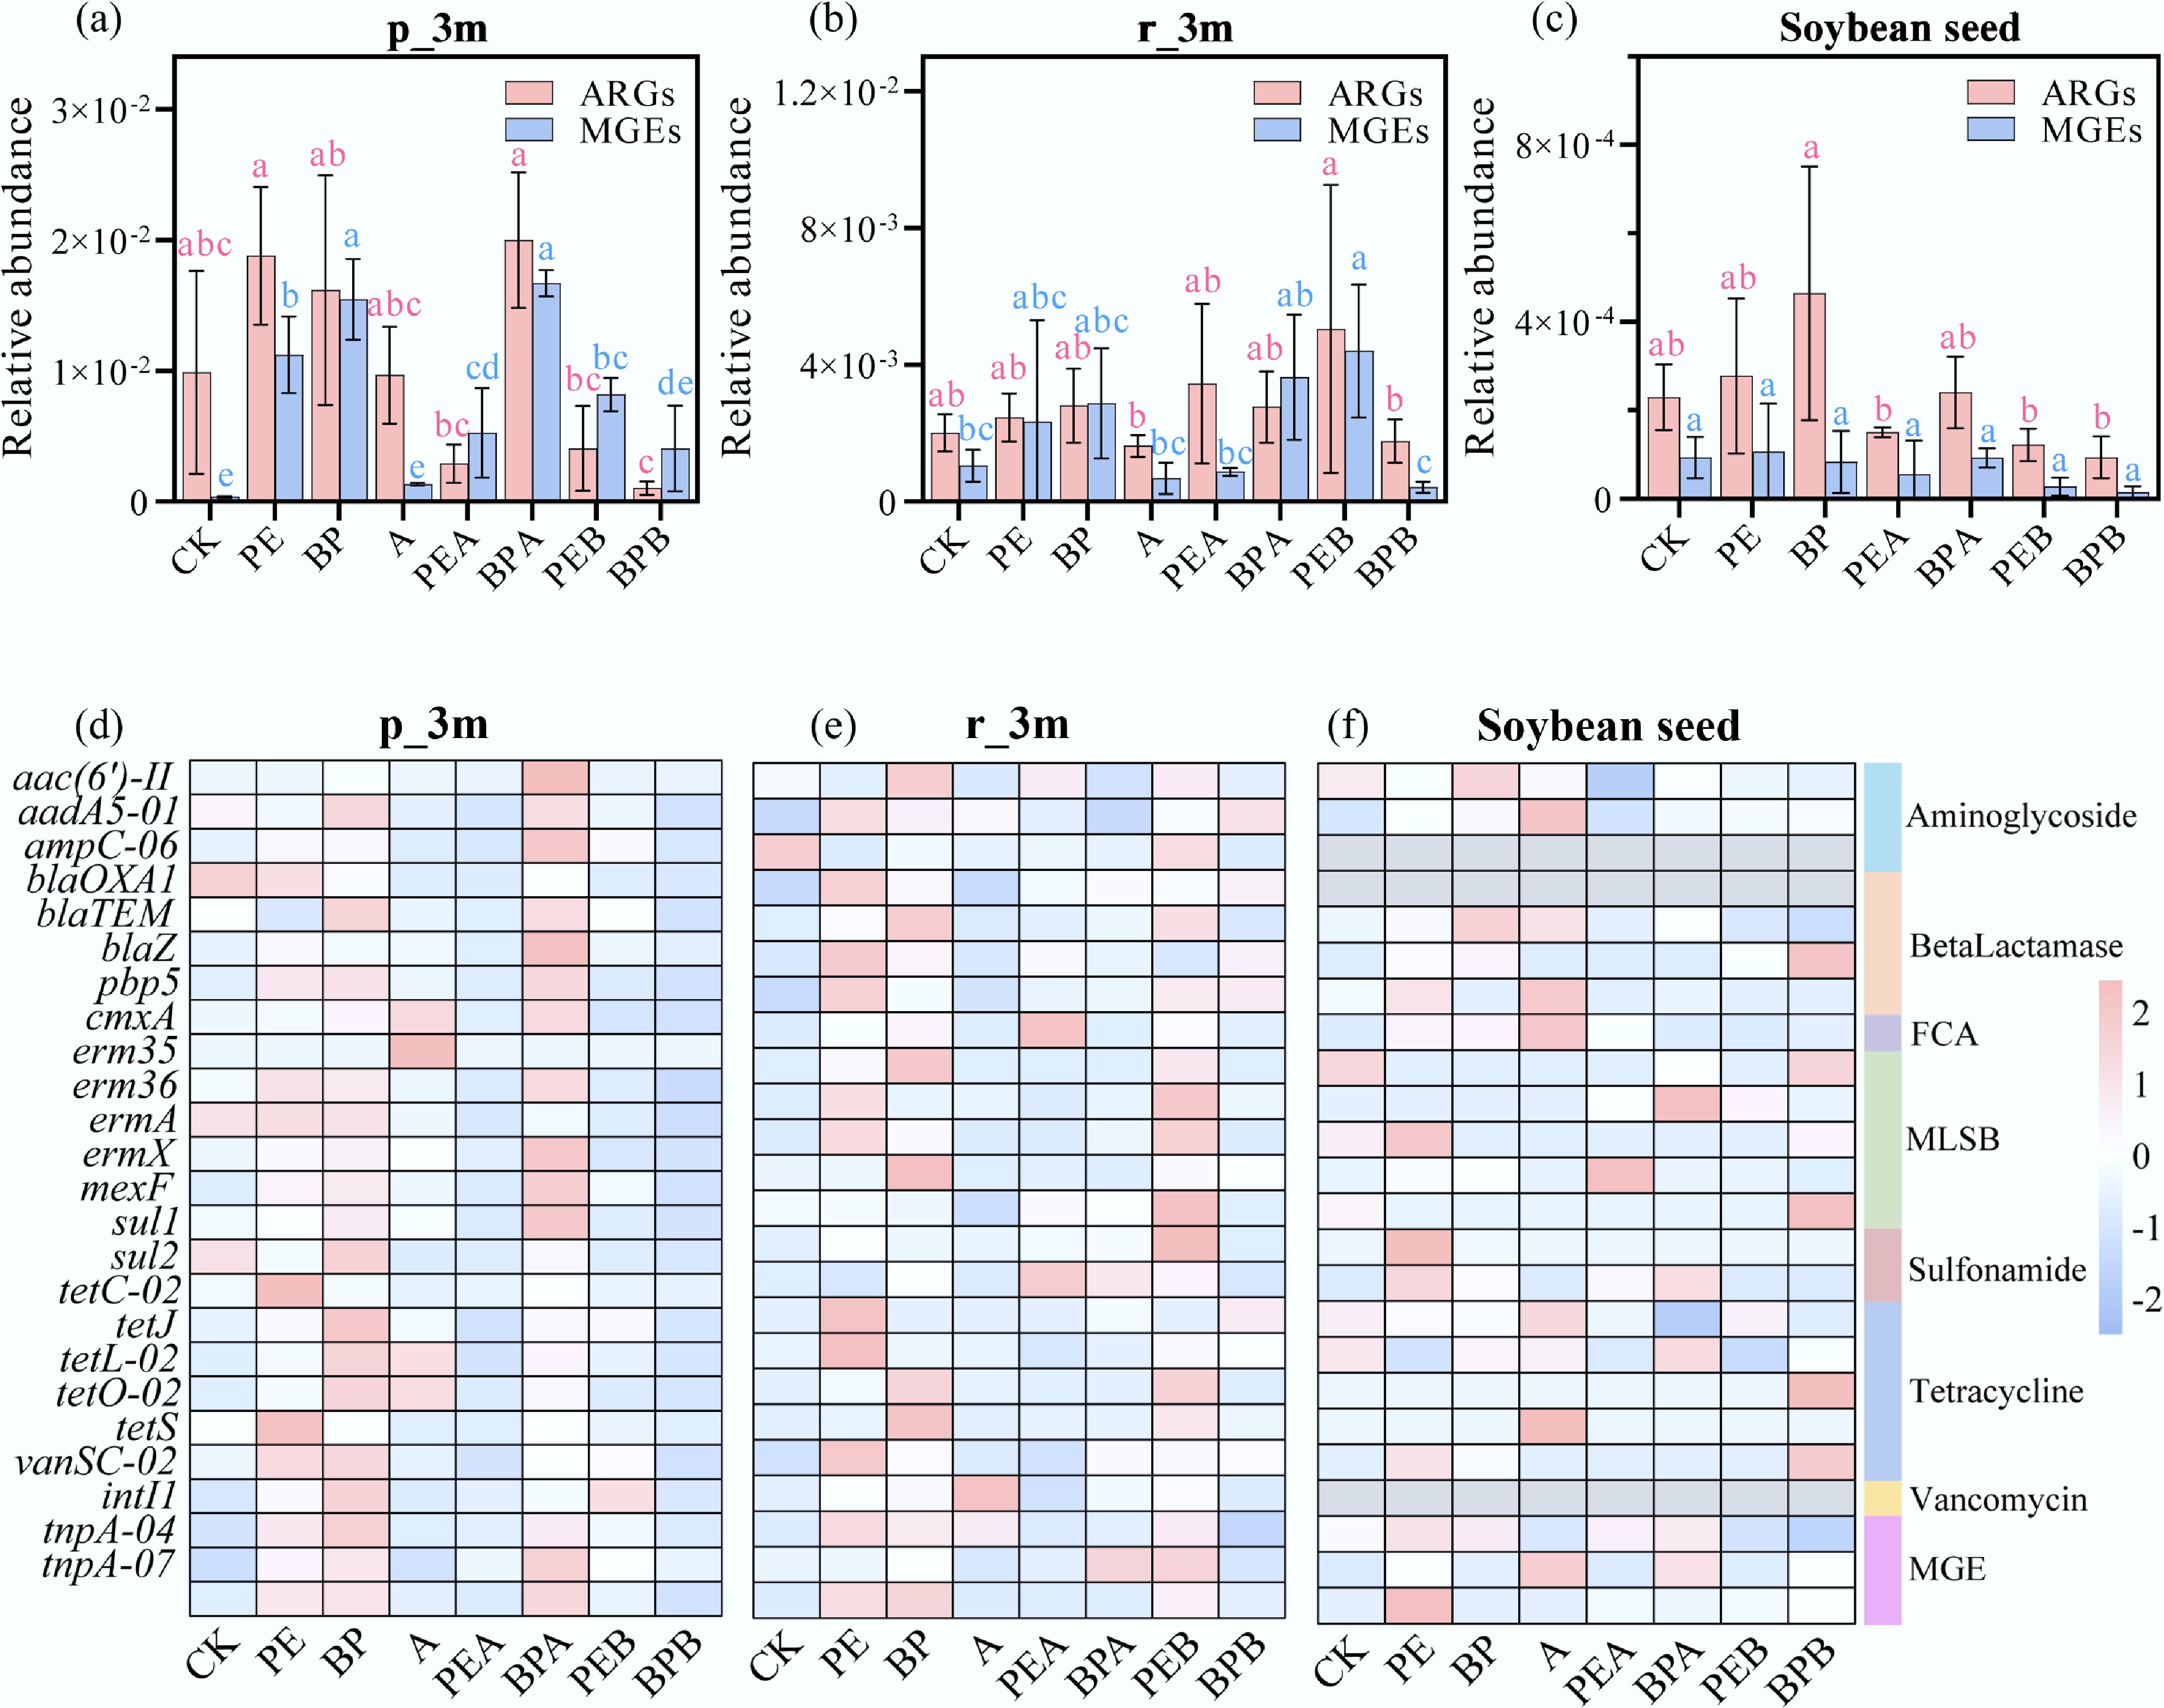
Figure 4.
Relative abundance of antibiotic resistance genes (ARGs) and mobile genetic elements (MGEs) in soybean phyllosphere [p_3m, (a) and (d)], rhizoplane [r_3m, (b) and (e)], and seed (c) and (f) under different treatments after incubation for three months (3m). Error bars represent standard deviations (n = 3). Lowercase letters indicate significant differences between treatments.
-
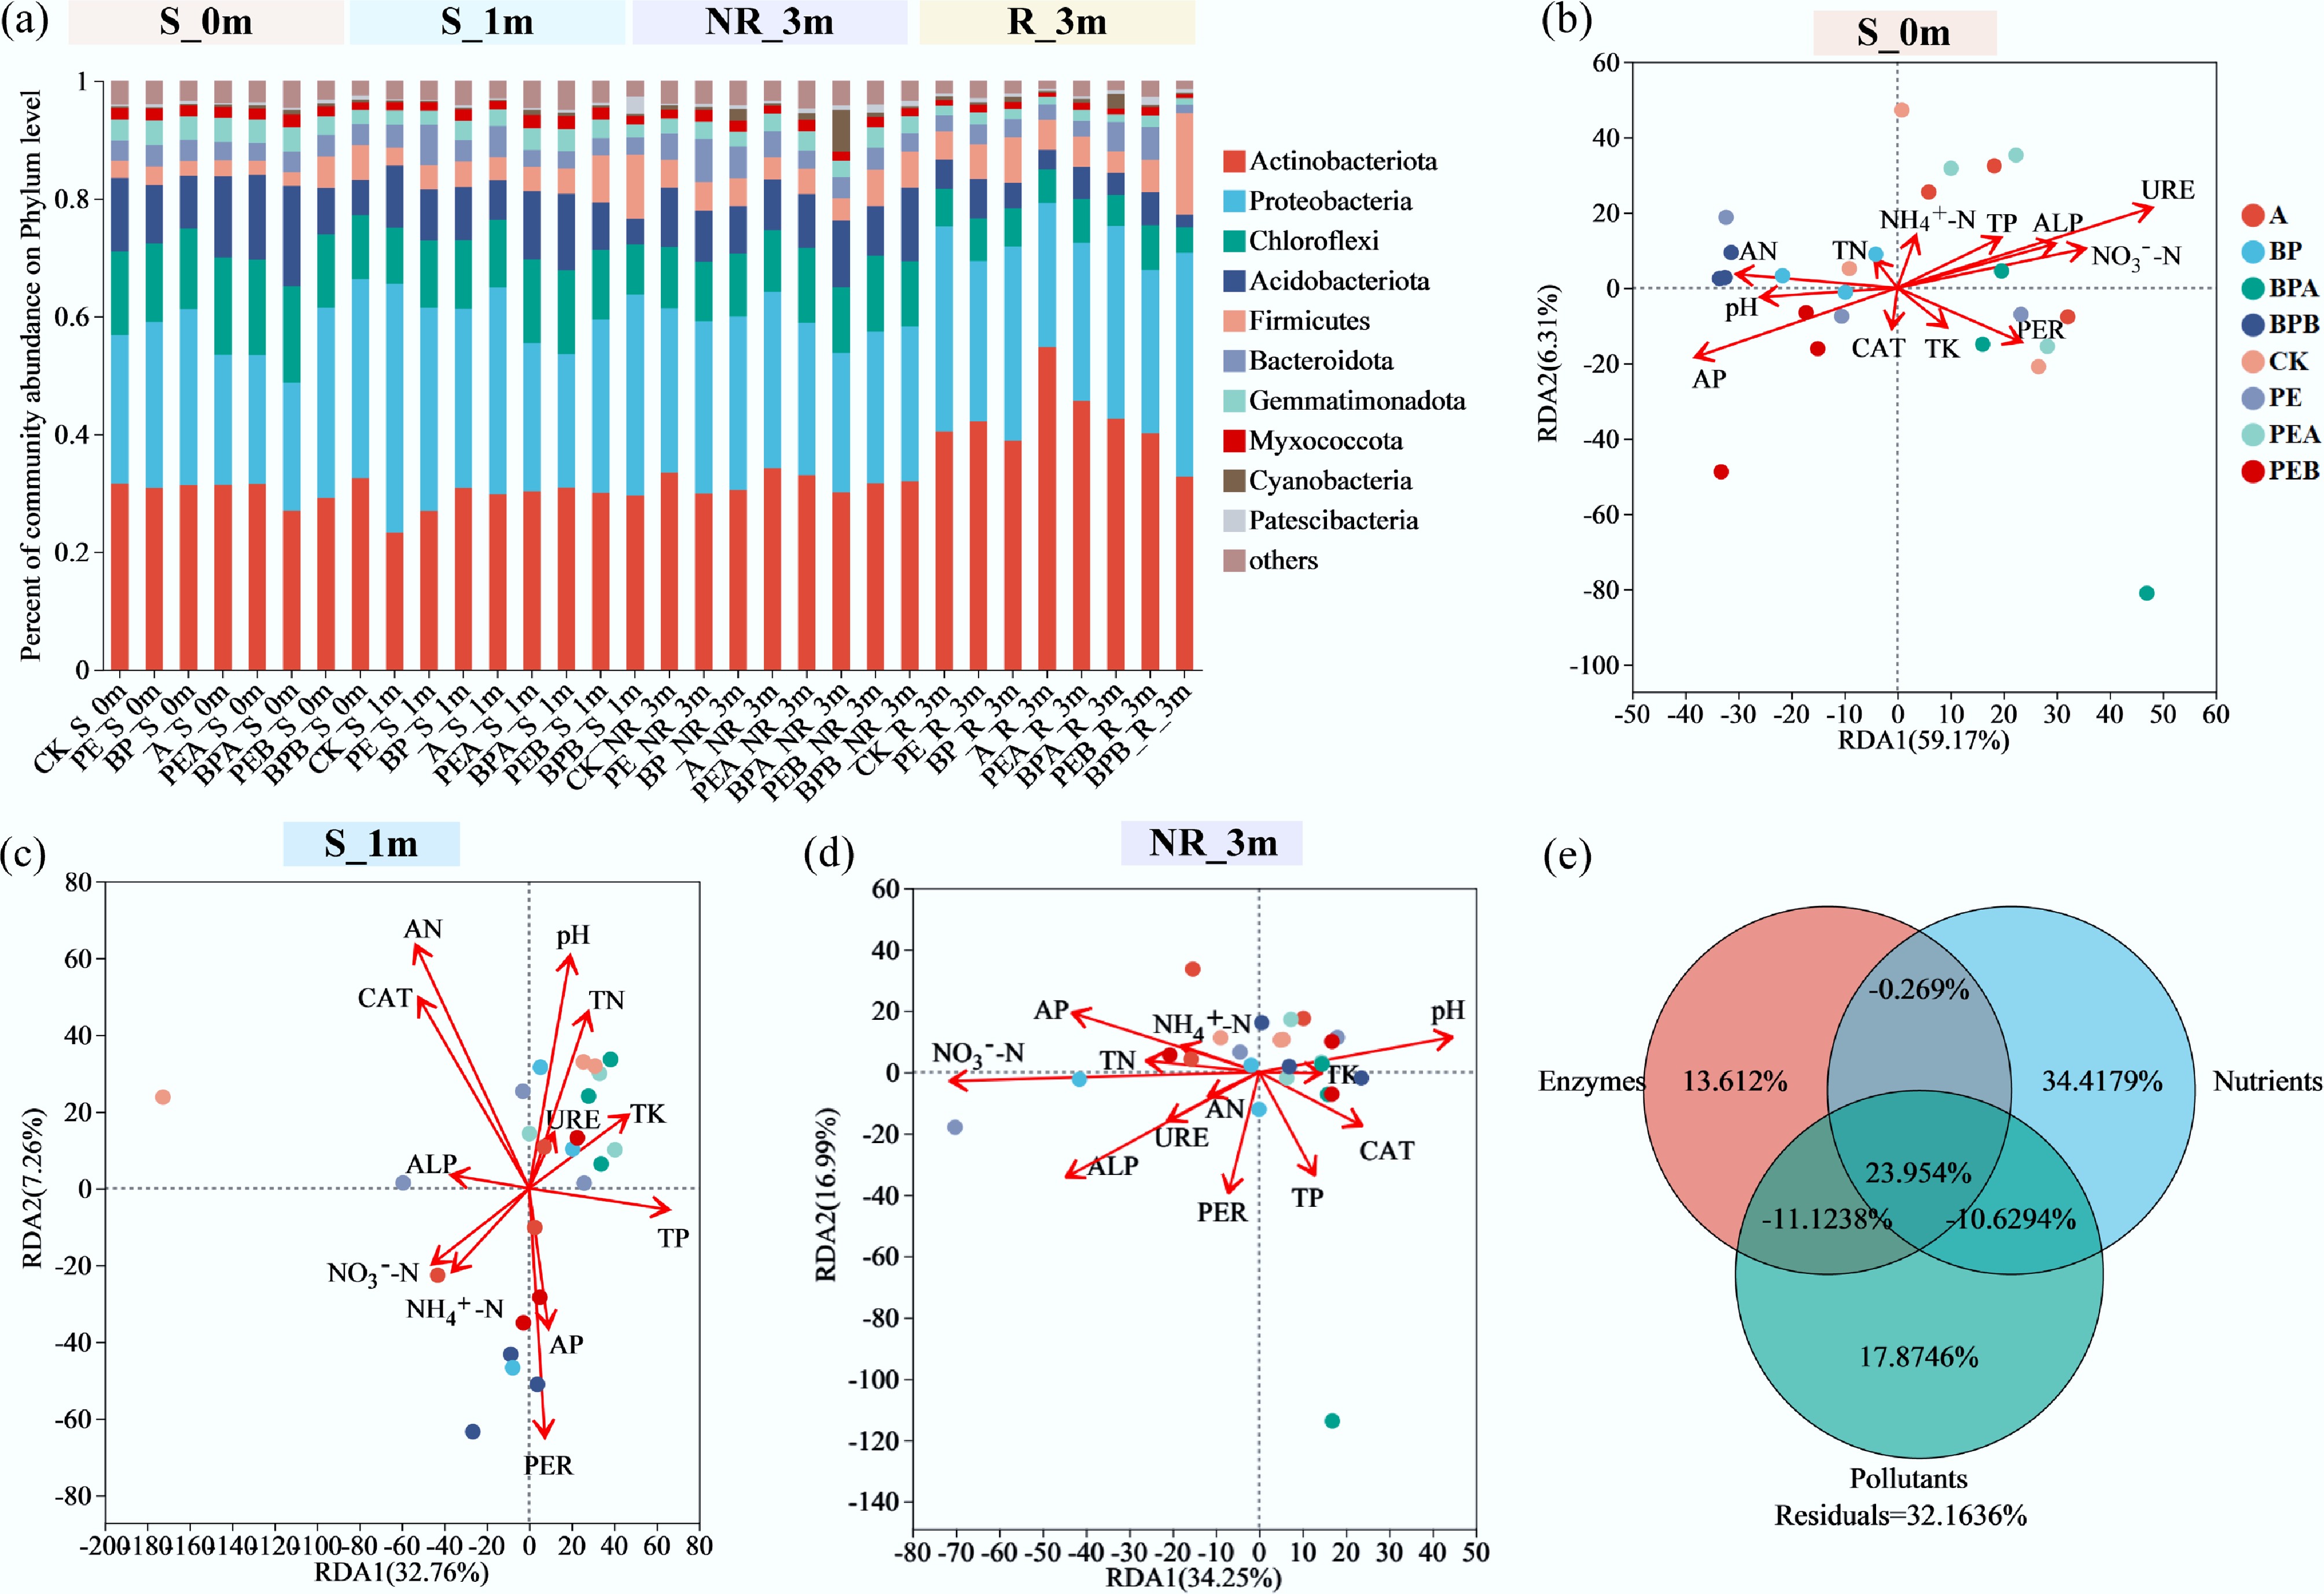
Figure 5.
(a) Soil bacterial communities of different treatments at phylum levels at the beginning of the experiment (0m), and after incubation for 1 month (1m) and 3 months (3m). (b)–(d) Redundancy analysis (RDA) reflects the relationship between environmental variables and soybean non-rhizosphere soil bacterial communities. (e) Variance partitioning analysis (VPA) shows the explanation of enzymes, nutrients, and pollutants to the difference in bacterial communities of soybean non-rhizosphere soil.
-
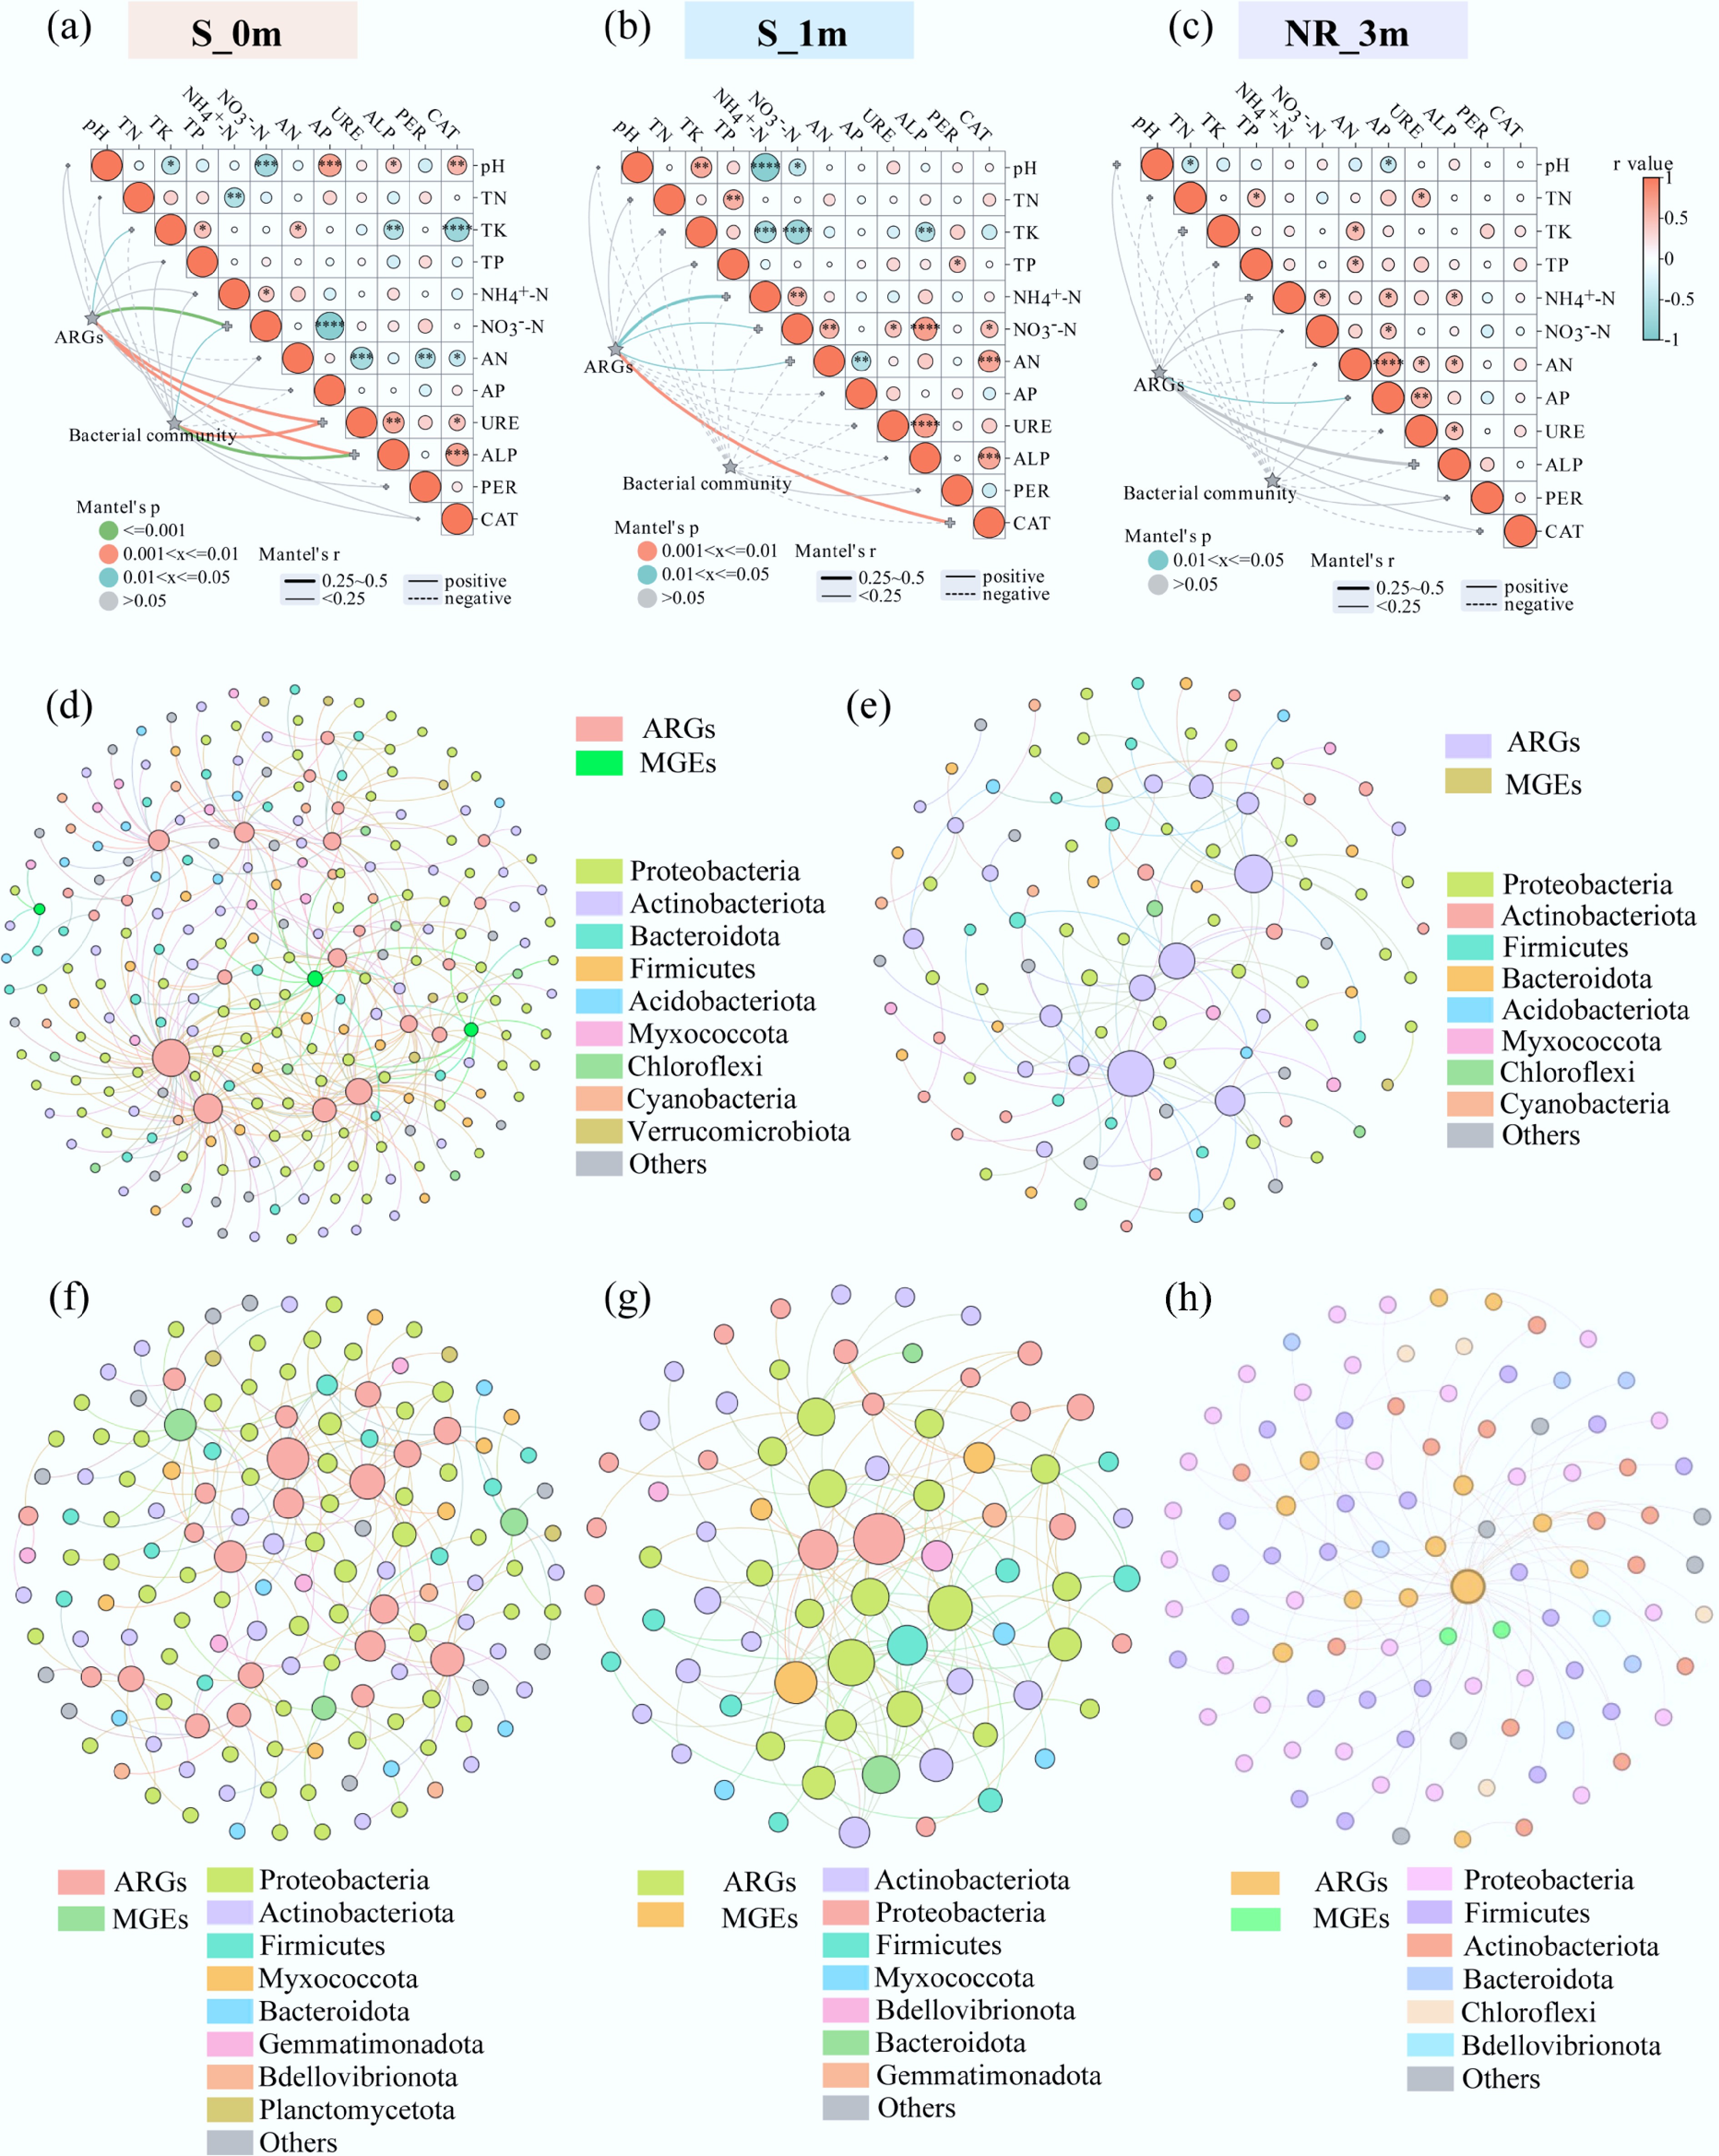
Figure 6.
(a)−(c) Mantel test analyzed the relationship between antibiotic resistance genes (ARGs), bacterial communities, and environmental variables of soybean non-rhizosphere soil at the beginning of the experiment (0m), and after incubation for one month (1m) and three months (3m). Network analysis of ARGs-bacteria in (d) non-rhizosphere soil, (e) rhizosphere soil, (f) rhizoplane, (g) phyllosphere, and (h) soybean seed. The size of the nodes reflects the number of connections. In the network diagram, the correlation coefficient is r ≥ 0.5, and the significance level is p < 0.05.
Figures
(6)
Tables
(0)