-
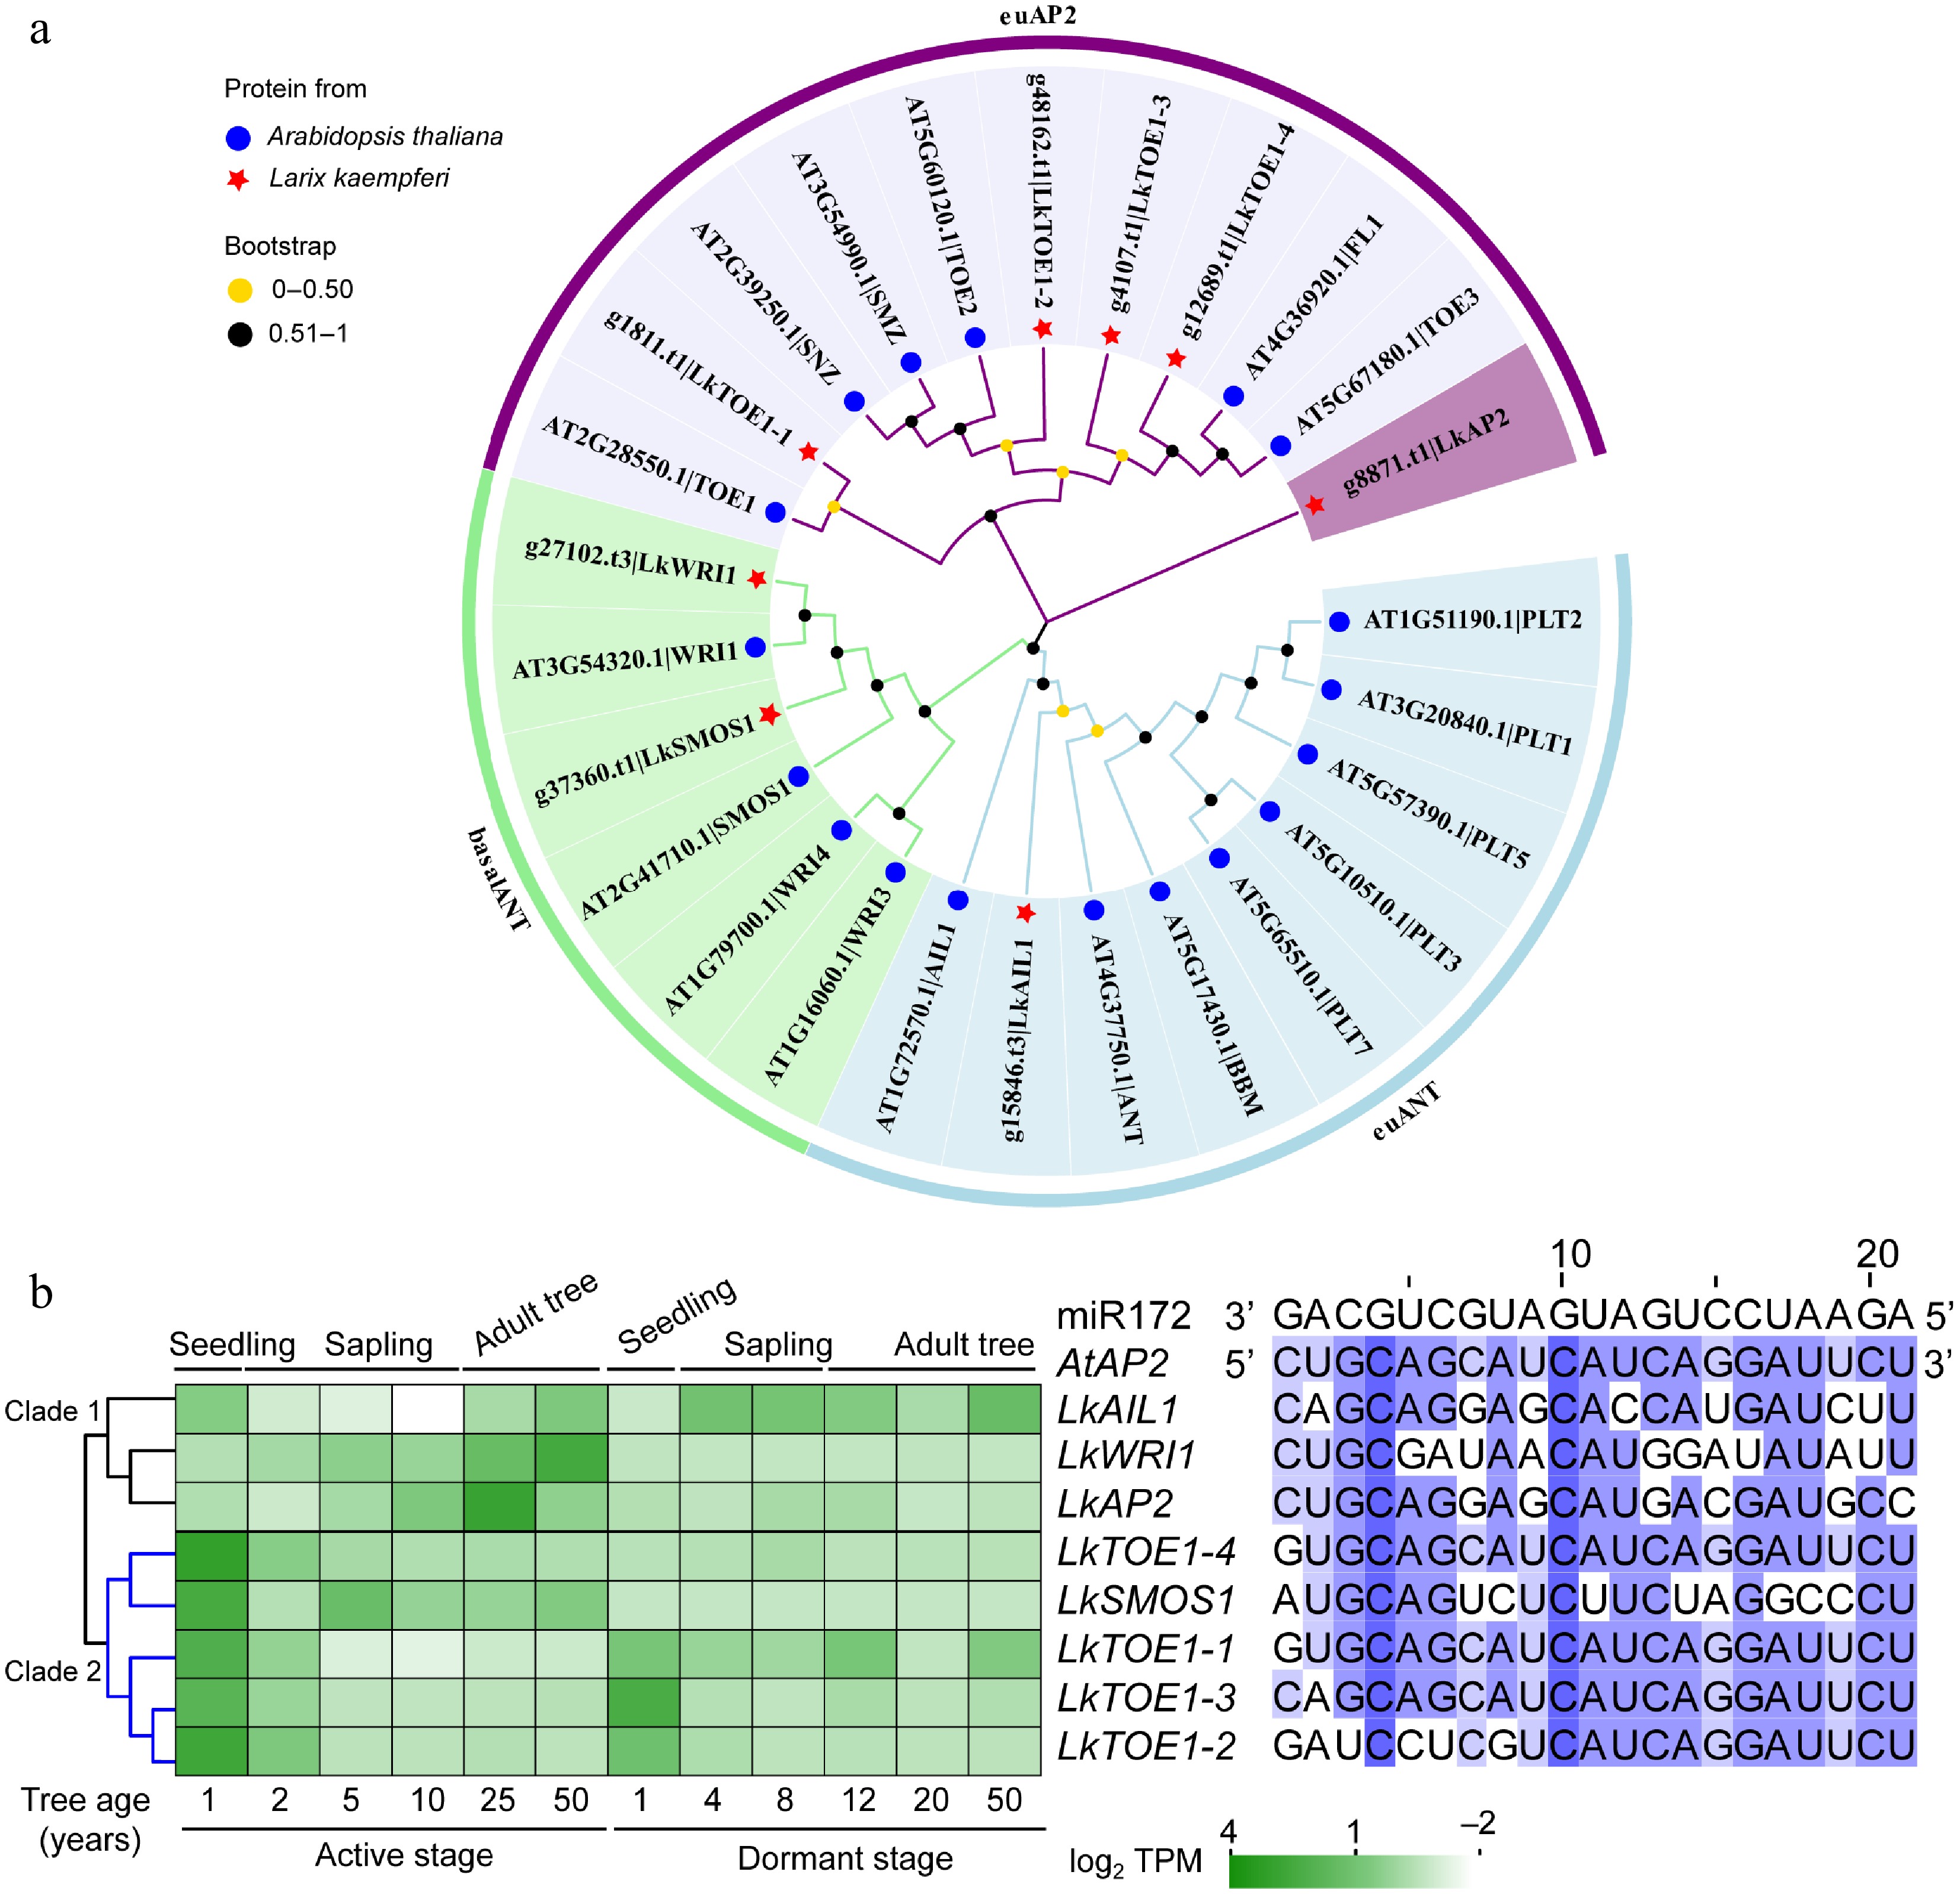
Figure 1.
Phylogeny, sequence, and expression analysis of AP2 subfamily genes in Larix kaempferi. (a) Phylogenetic tree of AP2 subfamily proteins from L. kaempferi and Arabidopsis thaliana. (b) Sequence alignment of conserved miR172 target sites in A. thaliana and L. kaempferi AP2 with A. thaliana miR172 as a reference and expression patterns of AP2 subfamily genes during L. kaempferi tree aging detected by RNA-seq. Heatmaps were shown with the average normalized TPM (log2) values (–2 to 4).
-
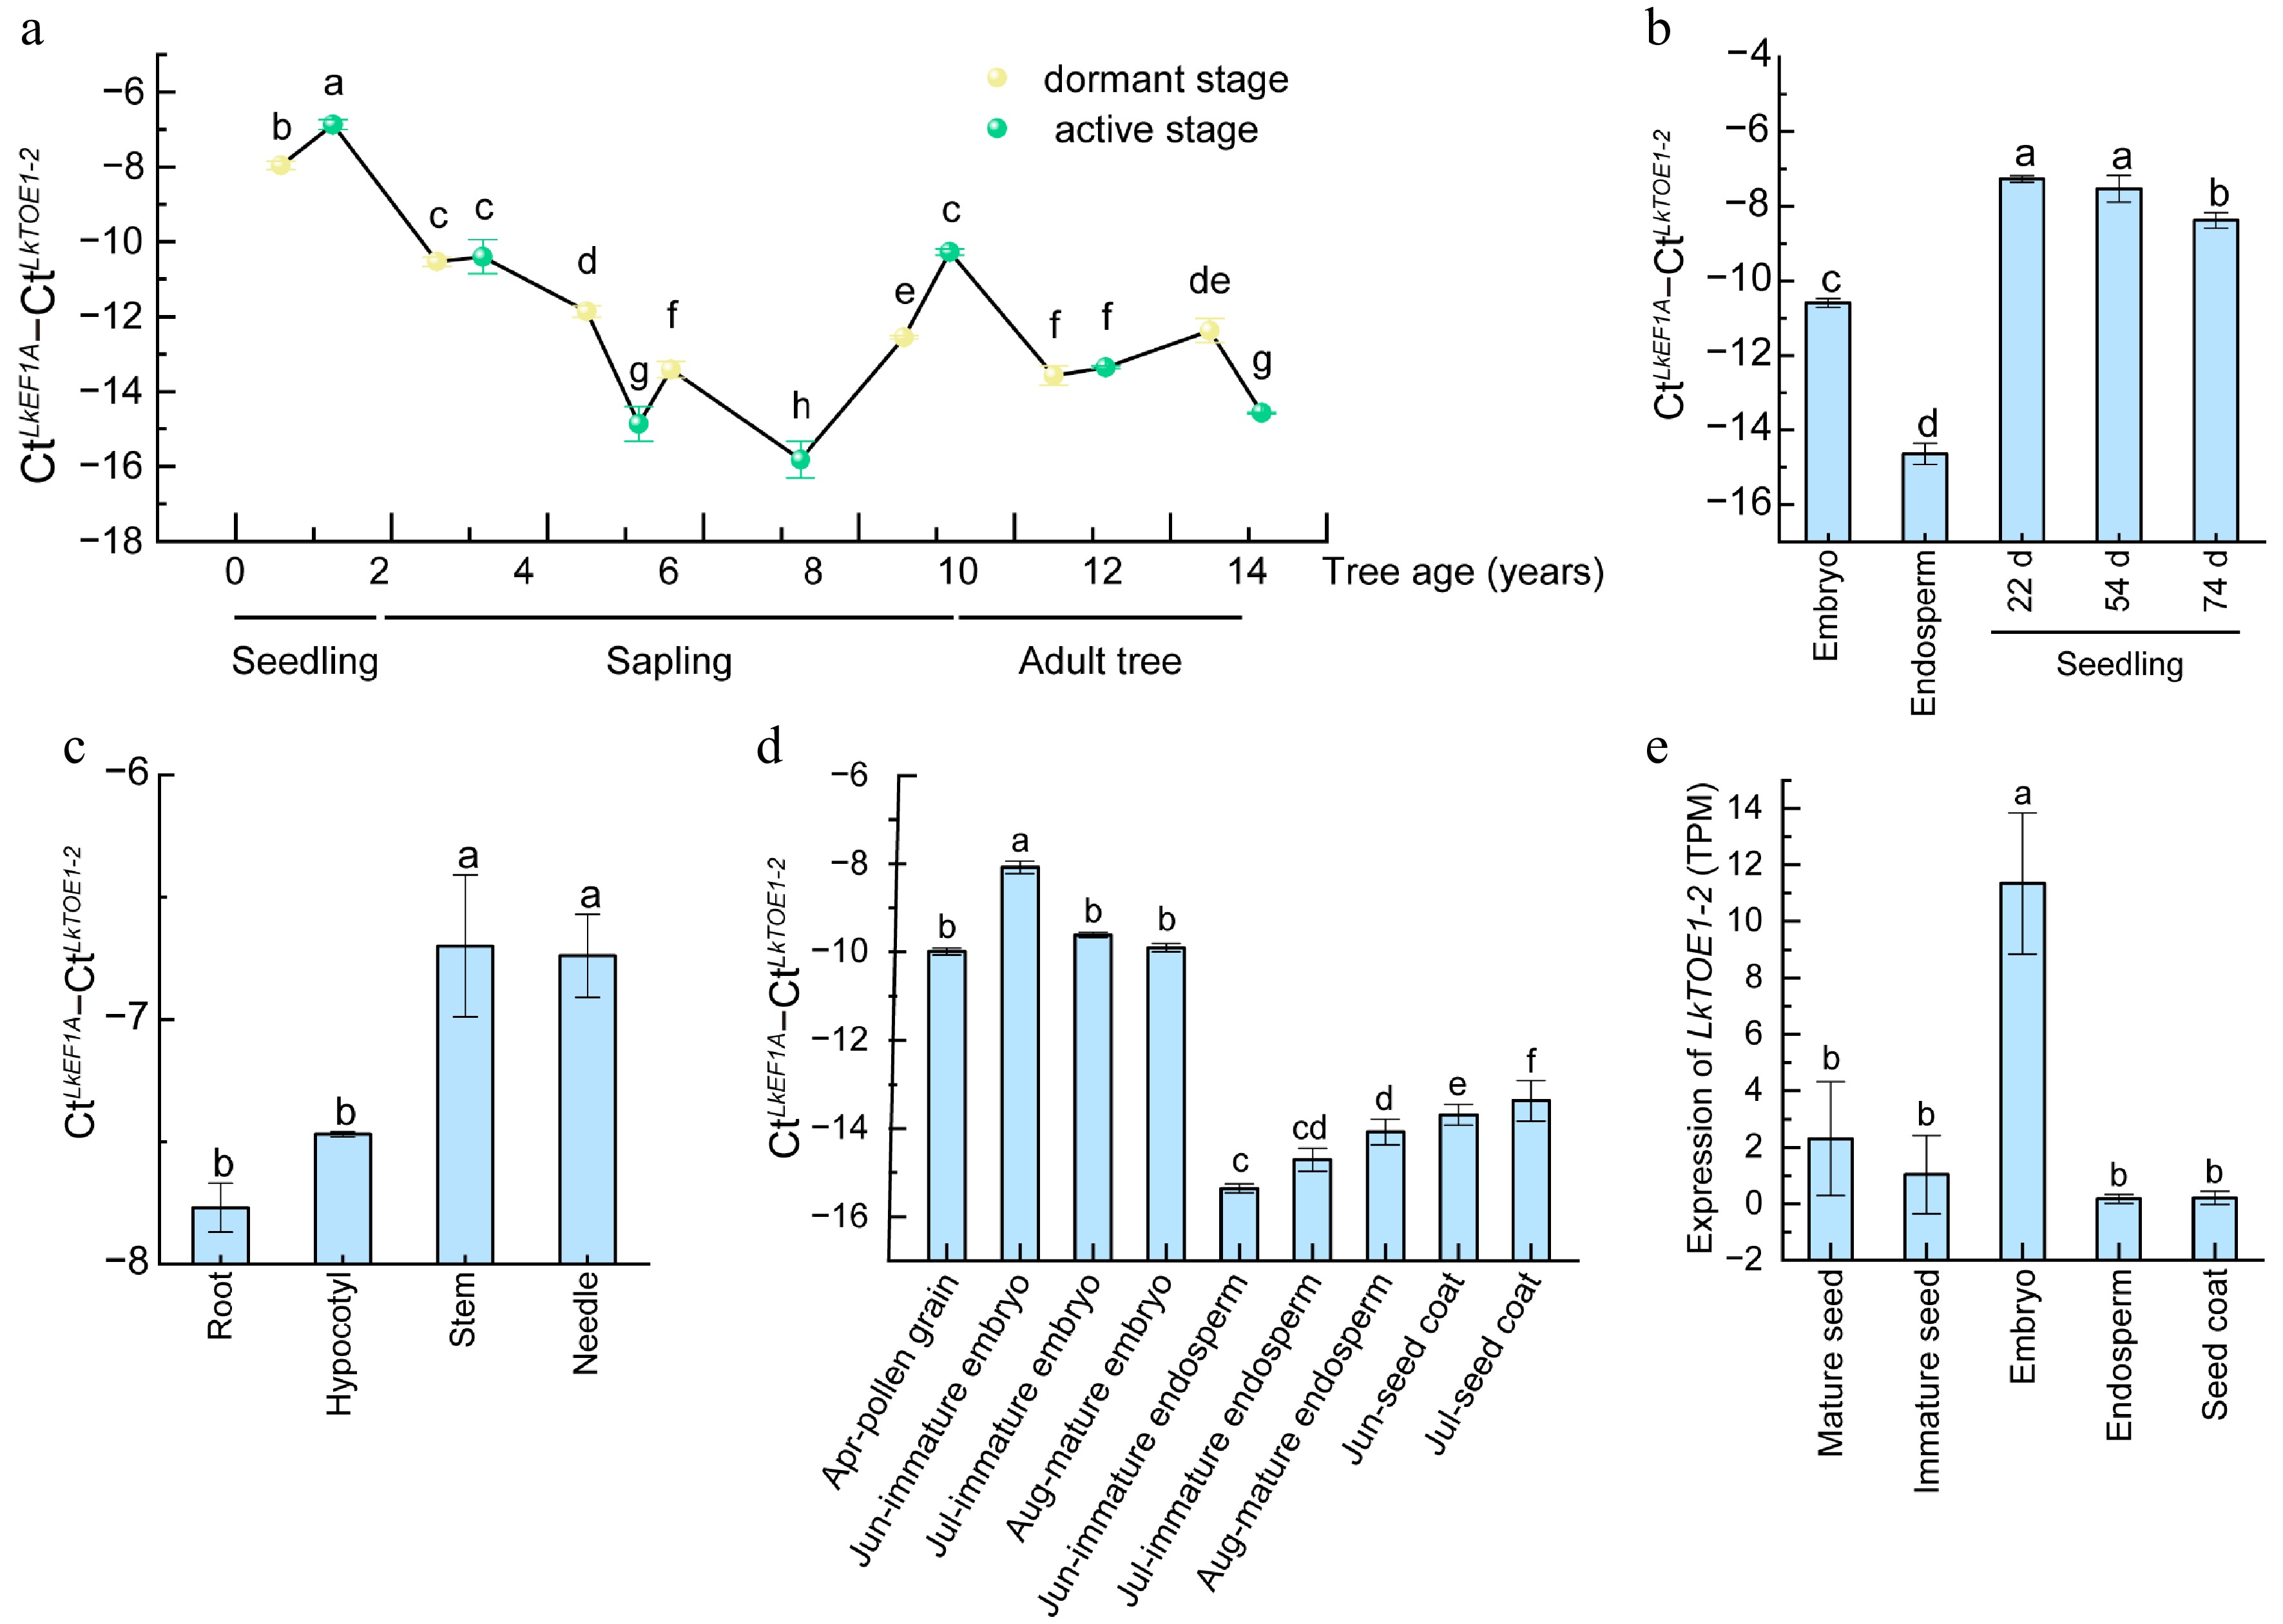
Figure 2.
Expression patterns of LkTOE1-2 during tree aging and seed formation in Larix kaempferi. (a) Expression patterns of LkTOE1-2 during L. kaempferi tree aging detected by qRT-PCR. (b) Expression patterns of LkTOE1-2 in seeds and seedlings. (c) Expression patterns of LkTOE1-2 in different organs of seedlings. Expression patterns of LkTOE1-2 during L. kaempferi seed formation detected by (d) qRT-PCR, and (e) RNA-seq. Different letters on the bars indicate significant differences as determined by one-way ANOVA followed by Tukey's multiple comparisons test, p < 0.05.
-
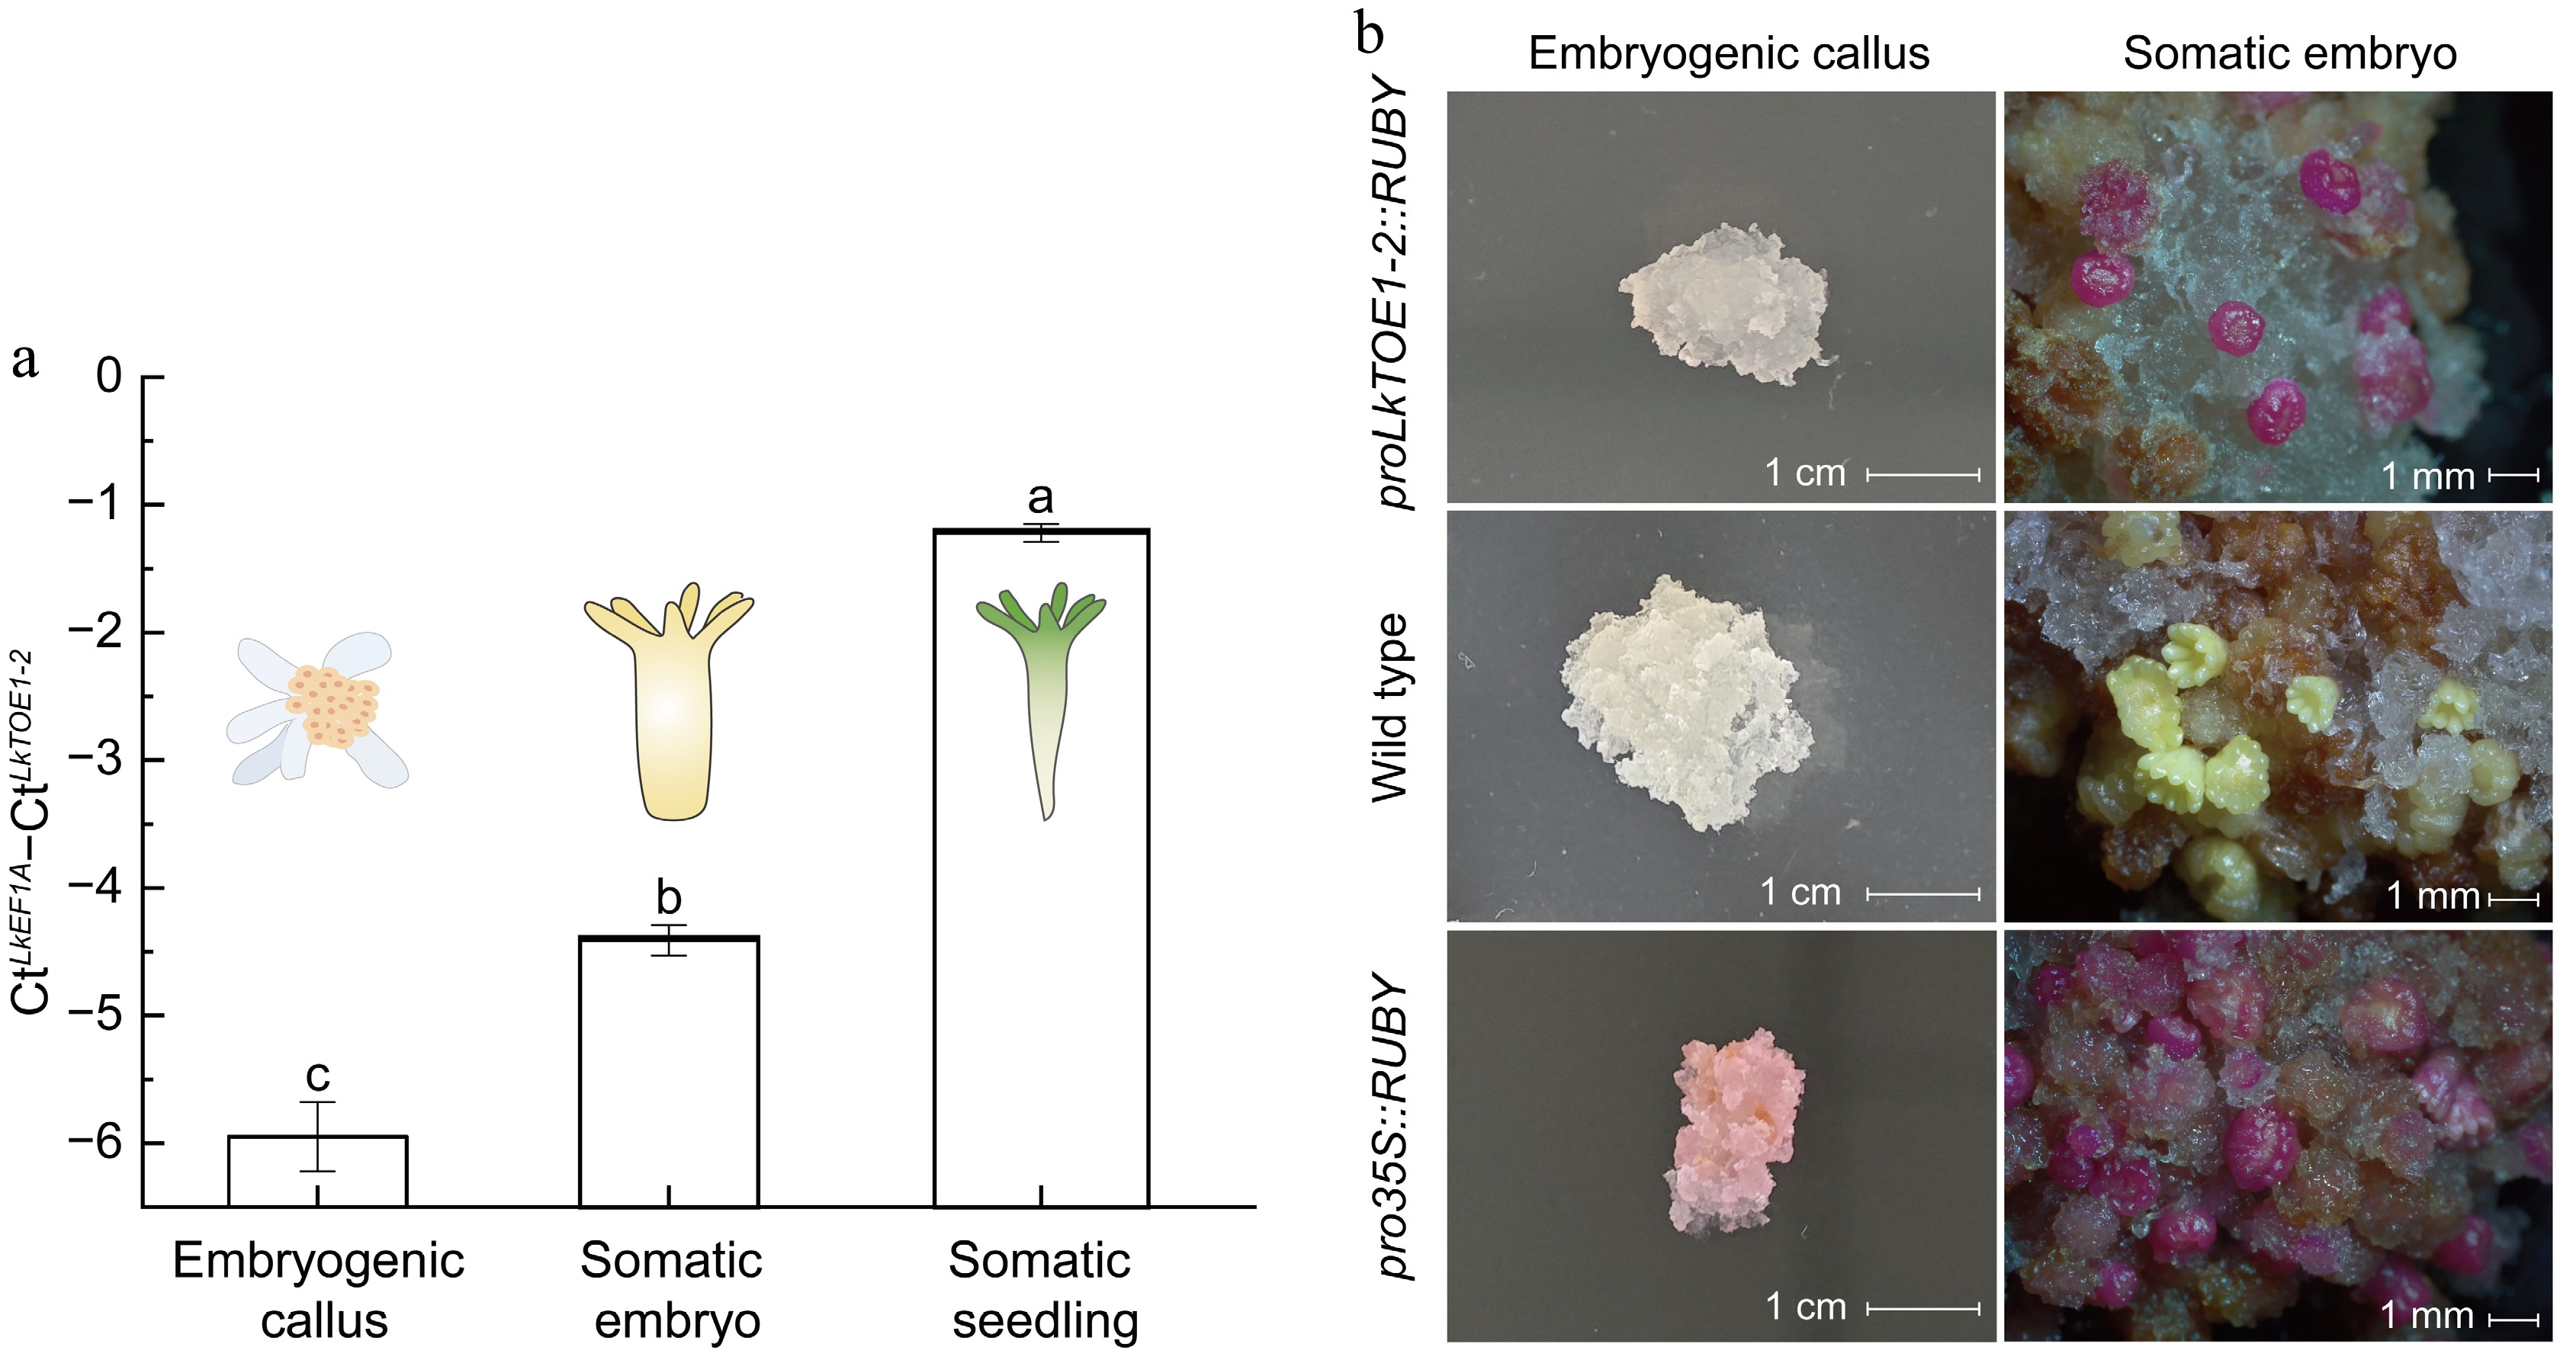
Figure 3.
Expression patterns and promoter activity of LkTOE1-2 during Larix kaempferi somatic embryogenesis. (a) Expression patterns of LkTOE1-2 in embryogenetic calli, somatic embryos, and somatic seedlings detected by qRT-PCR. Different letters on the bars indicate significant differences as determined by one-way ANOVA followed by Tukey's multiple comparisons test, p < 0.05. (b) Promoter activity of LkTOE1-2 in embryogenetic calli and somatic embryos detected with the RUBY reporter system.
-
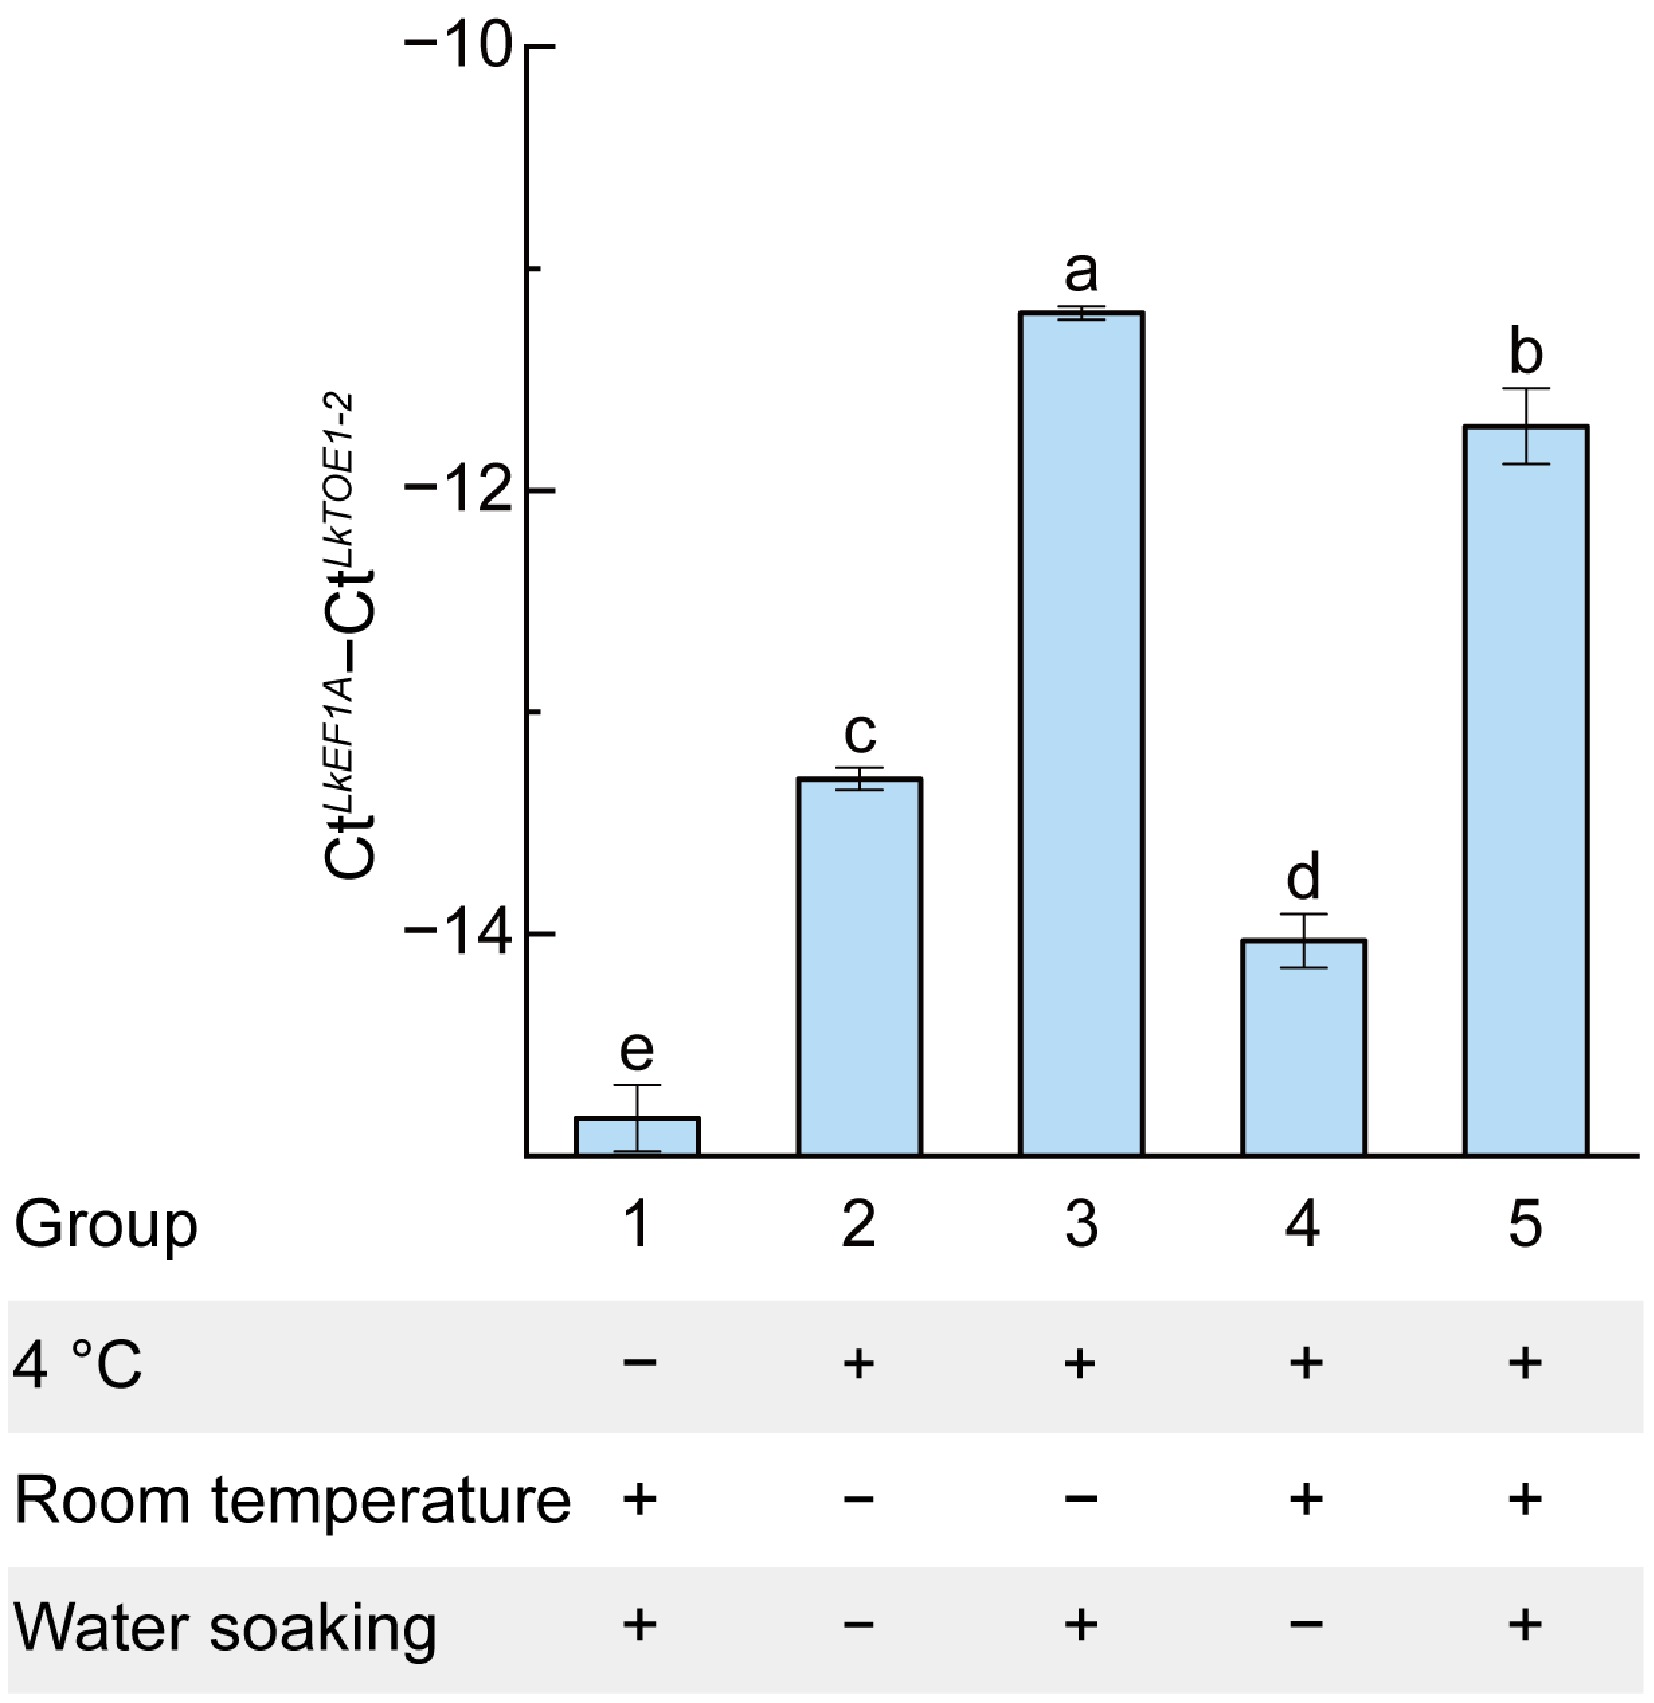
Figure 4.
Responses of LkTOE1-2 expression to temperature and water soaking detected by qRT-PCR. Different letters on the bars indicate significant differences as determined by one-way ANOVA followed by Tukey's multiple comparisons test, p < 0.05.
-
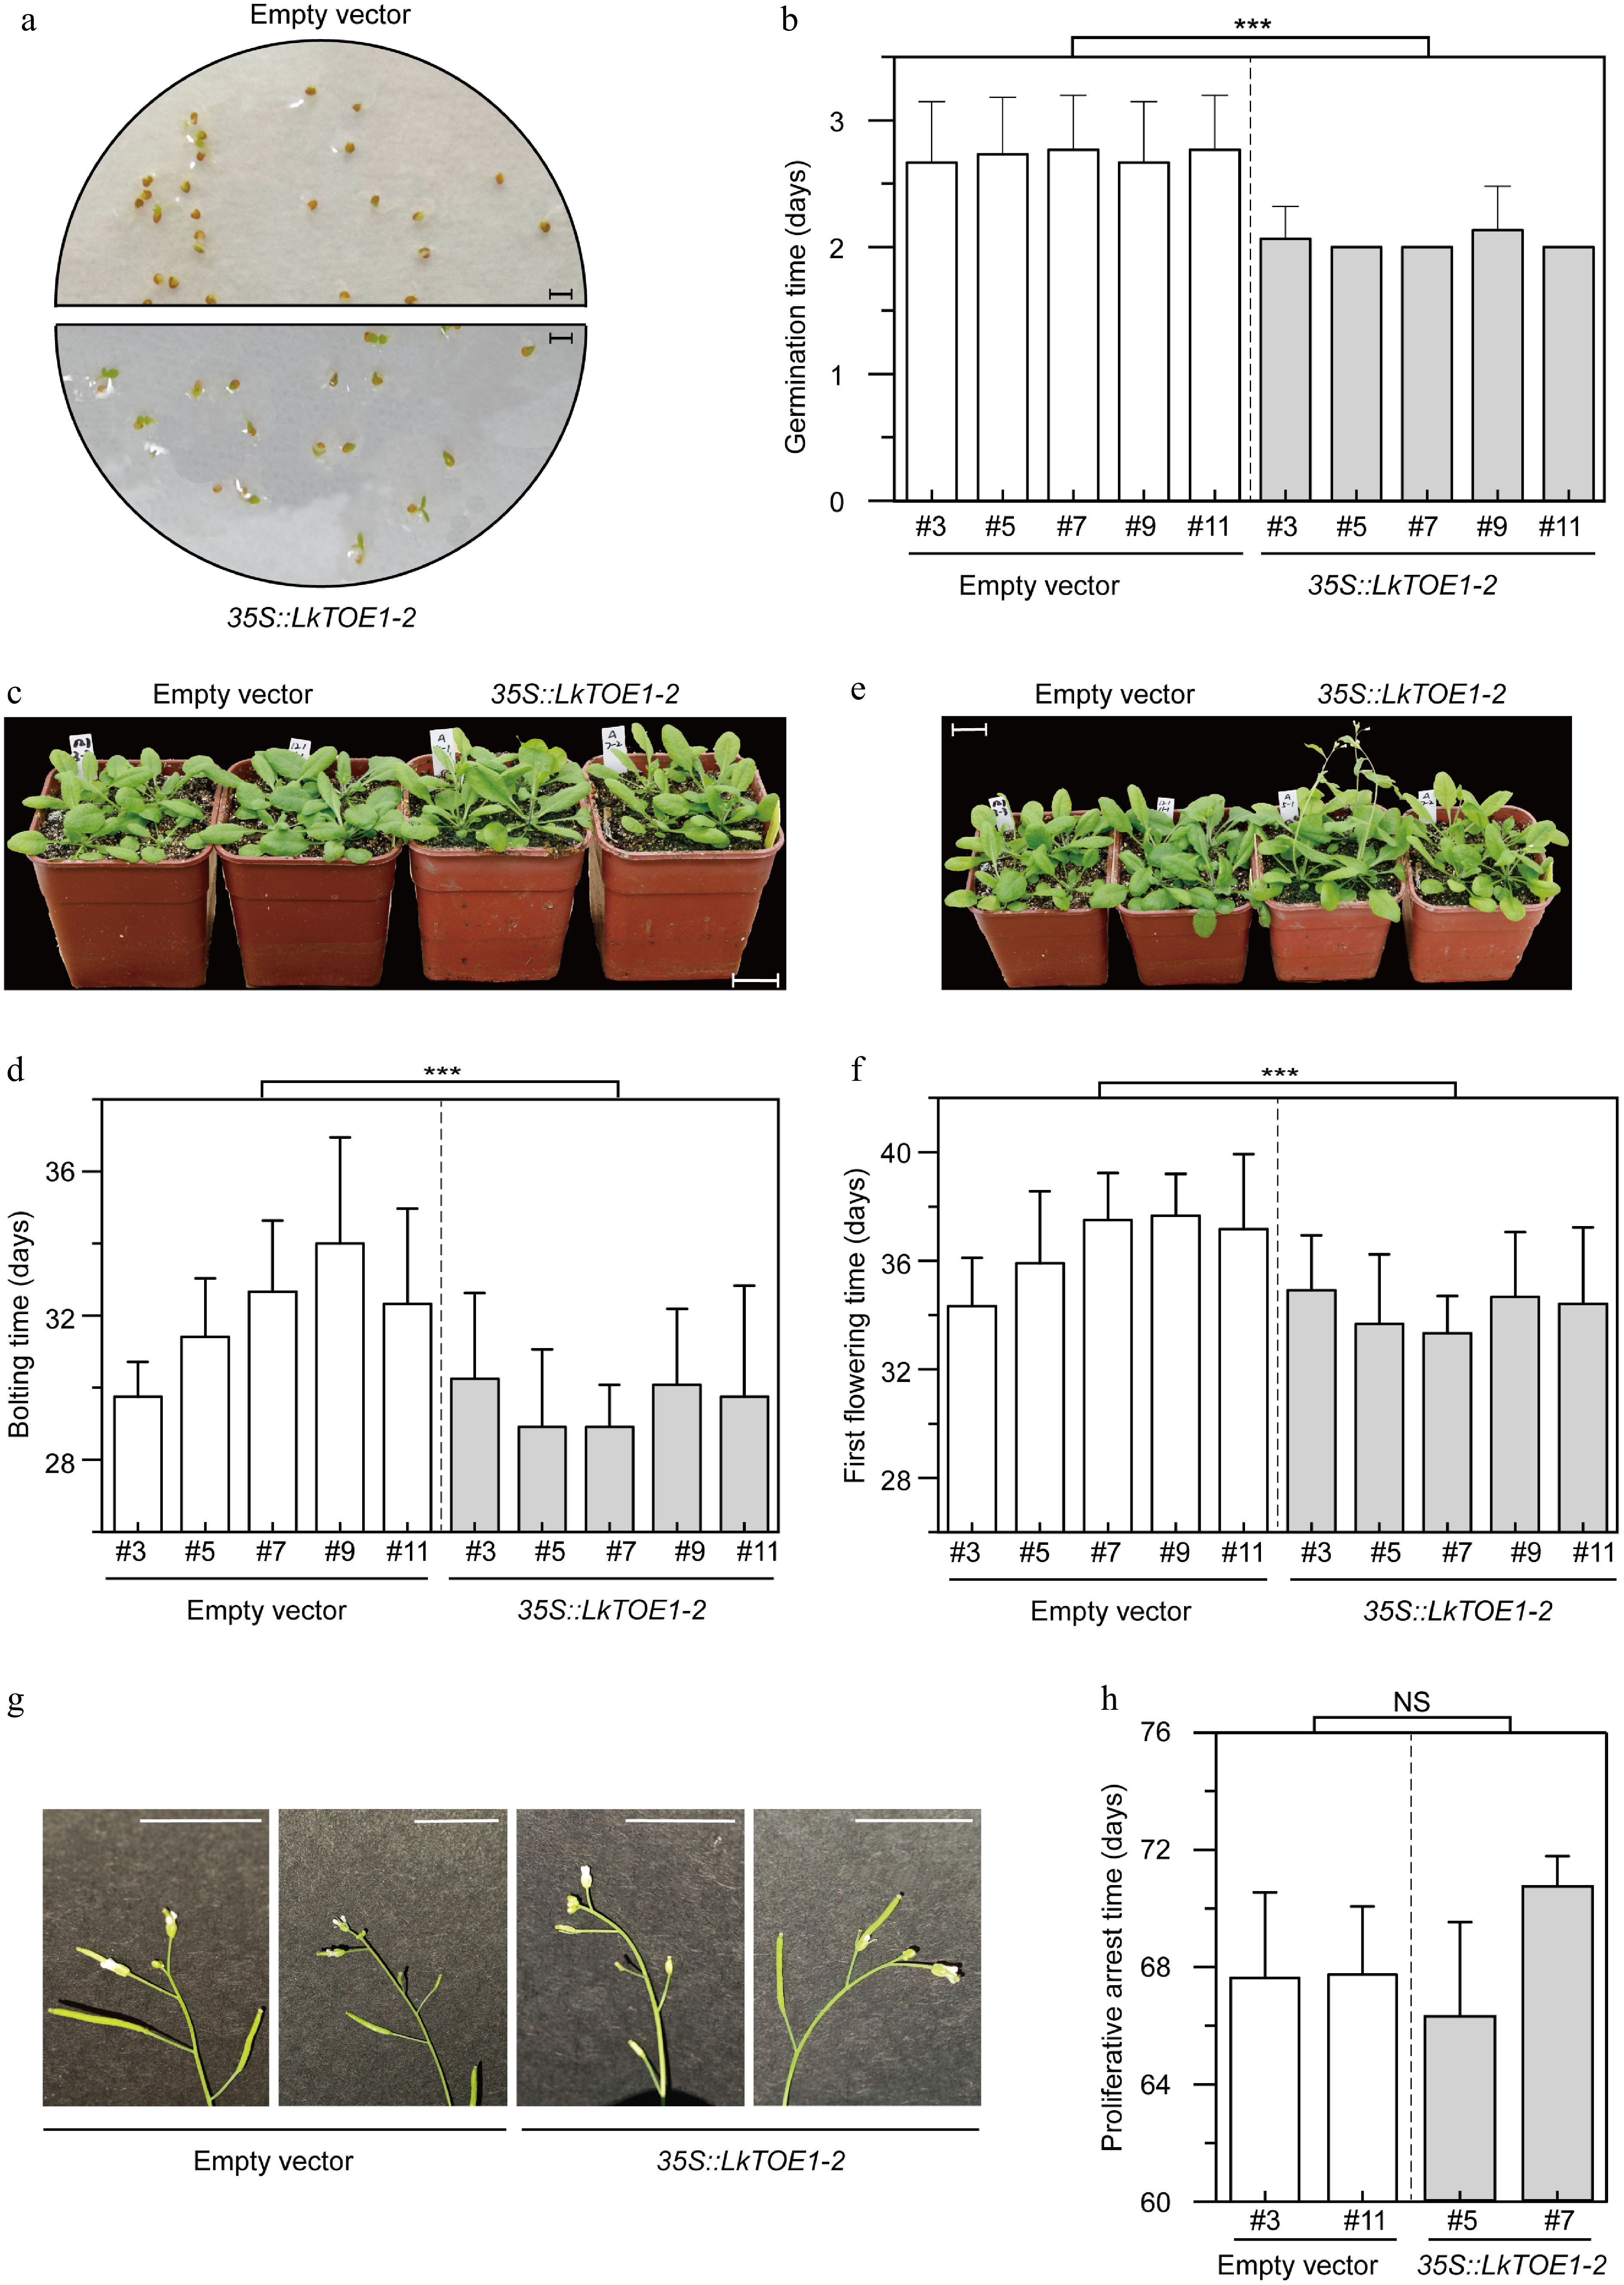
Figure 5.
Phenotypes of transgenic Arabidopsis thaliana over-expressing LkTOE1-2. (a) Germination of transgenic A. thaliana. Scale bar = 3 mm. The pictures were taken on the second day after 4 °C treatment. (b) Germination time of transgenic A. thaliana. n = 30. Germination was counted when two cotyledons were visible. (c) Bolting of transgenic A. thaliana. Scale bar = 2 cm. The pictures were taken on the 29th day after 4 °C treatment. (d) Bolting time of transgenic A. thaliana. Twelve plants were used in each line. Bolting was counted when inflorescence axis was visible, and bolting time was recorded from 4 °C treatment. n = 12. (e) Flowering of transgenic A. thaliana. Scale bar = 2 cm. The pictures were taken on the 31th day after 4 °C treatment. (f) First flowering time of transgenic A. thaliana over-expressing LkTOE1-2. First flowering time was recorded from 4 °C treatment. n = 12. (g) Proliferative arrest of the inflorescence axis in transgenic A. thaliana. Scale bar = 1 cm. The pictures were taken on the 65th day after 4 °C treatment. (h) Proliferative arrest time of the inflorescence axis in transgenic A. thaliana. Proliferative arrest was counted when a spherical structure is formed in the apex of the inflorescence axis, and proliferative arrest time was recorded from 4 °C treatment. n = 8. Transgenic A. thaliana expressing the empty vector was used as a control. *** p < 0.001, NS p ≥ 0.05, Student's t-test.
-
Classification Arabidopsis thaliana Oryza sativa Larix kaempferi AP2 subfamily 56 32 8 DREB subfamily 8 5 163 ERF subfamily 134 127 158 Other subfamily no no 32 RAV subfamily 26 14 12 Soloist subfamily Uncharacterized Uncharacterized 1 Total 224 178 374 The data for A. thaliana and O. sativa AP2/ERF superfamily was from Choudhury[63]. Table 1.
Summary of the AP2/ERF superfamily in Arabidopsis thaliana, Oryza sativa and Larix kaempferi.
Figures
(5)
Tables
(1)